 Deutsch
 English
 Español
 Français
 Italiano
 Nederlands
 Polski
 Português
 Русский
 Türkçe
 Svenska
 Chinese
 Magyar
Breve Análise do Conversível Asus Zenbook UX360CA-FC060T

| |||||||||||||||||||||||||
iluminação: 90 %
iluminação com acumulador: 302 cd/m²
Contraste: 1438:1 (Preto: 0.21 cd/m²)
ΔE Color 6.33 | 0.5-29.43 Ø5
ΔE Greyscale 8.13 | 0.57-98 Ø5.3
93% sRGB (Argyll 1.6.3 3D)
60% AdobeRGB 1998 (Argyll 1.6.3 3D)
66.5% AdobeRGB 1998 (Argyll 2.2.0 3D)
93% sRGB (Argyll 2.2.0 3D)
65.1% Display P3 (Argyll 2.2.0 3D)
Gamma: 2.52
| Asus Zenbook UX360CA-FC060T 1920x1080 IPS | Toshiba Satellite Radius 12 P20W-C-106 3840x2160 IPS | HP Spectre x360 13-4104ng 2560x1440 IPS | Acer Aspire R13 R7-372T-746N 2560x1440 IPS | Lenovo Yoga 900-13ISK 80MK 3200x1800 IPS | Microsoft Surface Pro 4, Core i5, 128GB 2736x1824 IPS | Samsung Galaxy Tab Pro S W700N 2160x1440 sAMOLED | |
|---|---|---|---|---|---|---|---|
| Display | -1% | 1% | 6% | -3% | 2% | ||
| Display P3 Coverage | 65.1 | 63.6 -2% | 66.8 3% | 69.6 7% | 63.2 -3% | 65 0% | |
| sRGB Coverage | 93 | 94.7 2% | 92.8 0% | 98 5% | 88.7 -5% | 96.5 4% | |
| AdobeRGB 1998 Coverage | 66.5 | 65 -2% | 67.3 1% | 70.7 6% | 64.9 -2% | 67 1% | |
| Response Times | -117% | 16% | 120% | 183% | -58% | ||
| Response Time Grey 50% / Grey 80% * | 29 ? | 68 ? -134% | 24 ? 17% | 36 ? -24% | 38.8 ? -34% | 46 ? -59% | |
| Response Time Black / White * | 22 ? | 44 ? -100% | 19 ? 14% | 30 ? -36% | 22.4 ? -2% | 31.2 ? -42% | |
| PWM Frequency | 192 ? | 1000 ? 421% | 1316 585% | 50 ? -74% | |||
| Screen | 13% | -1% | 19% | -27% | 9% | 111% | |
| Brightness middle | 302 | 388 28% | 324 7% | 320 6% | 319.8 6% | 413 37% | 363 20% |
| Brightness | 298 | 351 18% | 324 9% | 308 3% | 302 1% | 396 33% | 378 27% |
| Brightness Distribution | 90 | 85 -6% | 90 0% | 91 1% | 88 -2% | 87 -3% | 90 0% |
| Black Level * | 0.21 | 0.32 -52% | 0.34 -62% | 0.17 19% | 0.835 -298% | 0.36 -71% | 0.03 86% |
| Contrast | 1438 | 1213 -16% | 953 -34% | 1882 31% | 383 -73% | 1147 -20% | 12100 741% |
| Colorchecker dE 2000 * | 6.33 | 1.83 71% | 4.36 31% | 3.18 50% | 2.68 58% | 3.09 51% | 4.8 24% |
| Colorchecker dE 2000 max. * | 11.89 | 9.91 17% | 6.91 42% | ||||
| Greyscale dE 2000 * | 8.13 | 2.17 73% | 4.62 43% | 4.13 49% | 2.35 71% | 3.92 52% | 5.04 38% |
| Gamma | 2.52 87% | 2.43 91% | 2.18 101% | 2.03 108% | 2.09 105% | 2.3 96% | 2.57 86% |
| CCT | 6811 95% | 6703 97% | 6857 95% | 6752 96% | 6975 93% | 7333 89% | 7255 90% |
| Color Space (Percent of AdobeRGB 1998) | 60 | 60 0% | 60 0% | 65 8% | 57 -5% | 61 2% | 73 22% |
| Color Space (Percent of sRGB) | 93 | 95 2% | 93 0% | 98 5% | 88 -5% | 97 4% | |
| Total Average (Program / Settings) | -35% /
-8% | 5% /
2% | 48% /
36% | 51% /
19% | -16% /
-6% | 111% /
111% |
* ... smaller is better
Display Response Times
| ↔ Response Time Black to White | ||
|---|---|---|
| 22 ms ... rise ↗ and fall ↘ combined | ↗ 5 ms rise | 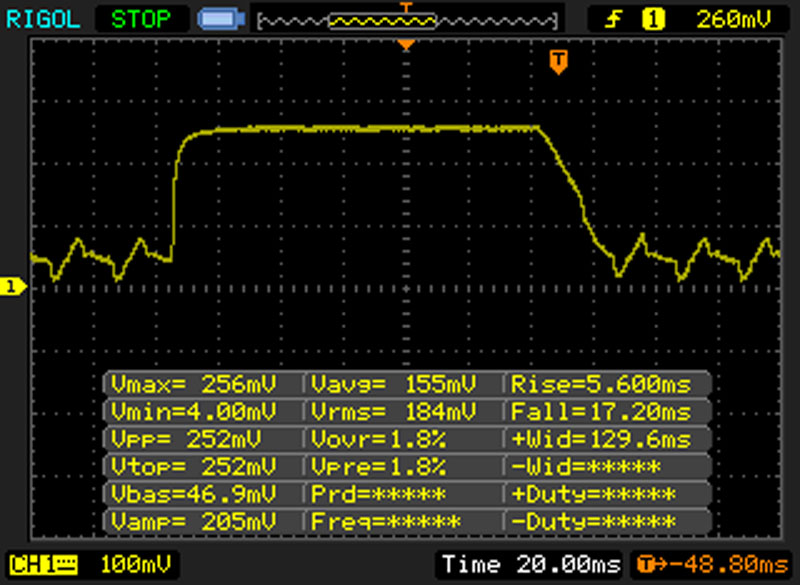 |
| ↘ 17 ms fall | ||
| The screen shows good response rates in our tests, but may be too slow for competitive gamers. In comparison, all tested devices range from 0.1 (minimum) to 240 (maximum) ms. » 42 % of all devices are better. This means that the measured response time is similar to the average of all tested devices (21.5 ms). | ||
| ↔ Response Time 50% Grey to 80% Grey | ||
| 29 ms ... rise ↗ and fall ↘ combined | ↗ 15 ms rise | 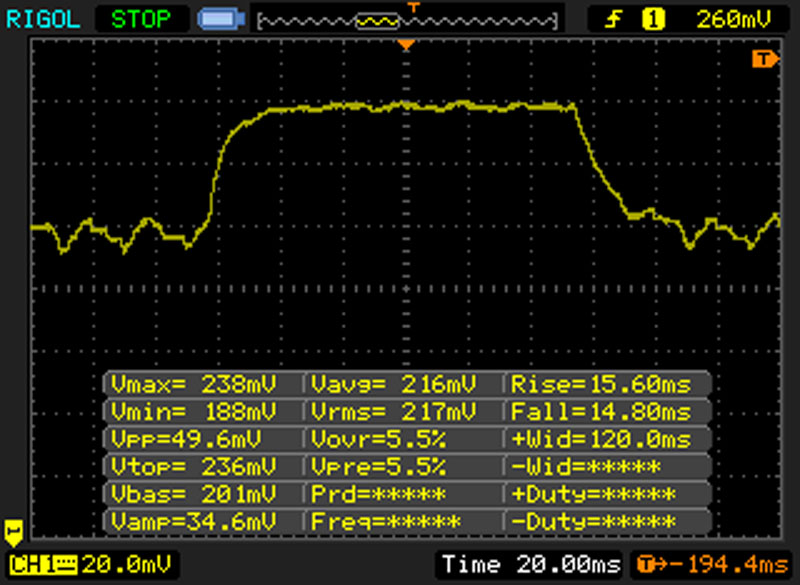 |
| ↘ 14 ms fall | ||
| The screen shows relatively slow response rates in our tests and may be too slow for gamers. In comparison, all tested devices range from 0.2 (minimum) to 636 (maximum) ms. » 33 % of all devices are better. This means that the measured response time is better than the average of all tested devices (33.7 ms). | ||
Screen Flickering / PWM (Pulse-Width Modulation)
| Screen flickering / PWM detected | 192 Hz | ≤ 30 % brightness setting | 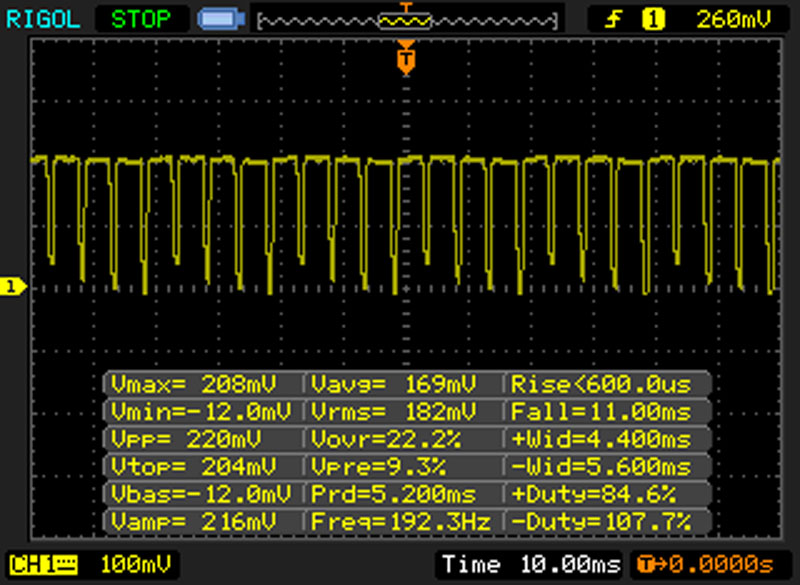 |
The display backlight flickers at 192 Hz (worst case, e.g., utilizing PWM) Flickering detected at a brightness setting of 30 % and below. There should be no flickering or PWM above this brightness setting. The frequency of 192 Hz is relatively low, so sensitive users will likely notice flickering and experience eyestrain at the stated brightness setting and below. In comparison: 53 % of all tested devices do not use PWM to dim the display. If PWM was detected, an average of 17924 (minimum: 5 - maximum: 3846000) Hz was measured. | |||
* ... smaller is better
| PCMark 8 Home Score Accelerated v2 | 2727 pontos | |
| PCMark 8 Work Score Accelerated v2 | 3496 pontos | |
Ajuda | ||
| Asus Zenbook UX360CA Lite-On CV1- 8B128 | Toshiba Sat. Radius 12 P20W-C Samsung PM871 | HP Spectre x360 13 Samsung PM851 | Acer Aspire R13 R7-372T Lite-On CV1- 8B256 | Lenovo Yoga 900- 13ISK Samsung PM871 | Microsoft Surface Pro 4 Samsung PM951 | Samsung Galaxy Tab Pro S W700N Lite-On CV1- 8B128 | Lenovo IdeaPad Miix 700 Samsung PM871 | HP Spectre x2 12 Sandisk X300 SD7SN6S | Acer Aspire Switch Alpha 12 SA5-271 N.N. | |
|---|---|---|---|---|---|---|---|---|---|---|
| CrystalDiskMark 3.0 | 44% | -11% | 44% | 42% | 28% | -8% | 26% | 6% | 18% | |
| Read Seq | 497 | 492.6 -1% | 491.8 -1% 491.8 -1% | 507 2% | 514 3% | 666 34% | 419.8 -16% | 497.9 0% | 410.1 -17% | 518 4% |
| Write Seq | 182.9 | 306.5 68% | 264.5 45% 264.5 45% | 354.4 94% | 459.5 151% | 154.2 -16% | 162.9 -11% | 153.5 -16% | 316 73% | 199.9 9% |
| Read 4k | 31.89 | 33.48 5% | 30.88 -3% 30.88 -3% | 32.66 2% | 36.34 14% | 28.51 -11% | 27.49 -14% | 36.2 14% | 27.4 -14% | 29.3 -8% |
| Write 4k | 62 | 89.7 45% | 75.6 22% 75.6 22% | 81.6 32% | 100.1 61% | 101.5 64% | 48.44 -22% | 95.5 54% | 53.5 -14% | 76.8 24% |
| Read 4k QD32 | 207.7 | 323.9 56% | 31.85 -85% 31.85 -85% | 277.6 34% | 313.8 51% | 368.3 77% | 236.2 14% | 389.5 88% | 196 -6% | 272 31% |
| Write 4k QD32 | 131.8 | 249 89% | 73.9 -44% 73.9 -44% | 261.2 98% | 96.8 -27% | 153.6 17% | 135 2% | 154 17% | 147.8 12% | 197.1 50% |
| AS SSD | 20% | 36% | 62% | 42% | -8% | 17% | -1% | 16% | ||
| Seq Read | 486.3 | 491.7 1% 491.7 1% | 514 6% | 505 4% | 832 71% | 473.3 -3% | 499.7 3% | 439.1 -10% | 505 4% | |
| Seq Write | 175.6 | 255.5 46% 255.5 46% | 342 95% | 454.6 159% | 142.5 -19% | 169.6 -3% | 147 -16% | 216.9 24% | 186.6 6% | |
| 4K Read | 28.29 | 23.7 -16% 23.7 -16% | 30.32 7% | 32.29 14% | 34.24 21% | 20.79 -27% | 32.41 15% | 23.12 -18% | 31.06 10% | |
| 4K Write | 57 | 63.4 11% 63.4 11% | 71.3 25% | 80.6 41% | 86.5 52% | 52.5 -8% | 80.7 42% | 49.2 -14% | 66 16% | |
| Score Read | 372 | 437 17% 437 17% | 345 -7% | 458 23% | 645 73% | 343 -8% | 459 23% | 333 -10% | 460 24% | |
| Score Write | 180 | 274 52% 274 52% | 371 106% | 429 138% | 239 33% | 176 -2% | 227 26% | 223 24% | 228 27% | |
| Score Total | 737 | 930 26% 930 26% | 896 22% | 1129 53% | 1190 61% | 686 -7% | 913 24% | 722 -2% | 918 25% | |
| Total Average (Program / Settings) | 44% /
44% | 5% /
5% | 40% /
40% | 52% /
53% | 35% /
35% | -8% /
-8% | 22% /
21% | 3% /
2% | 17% /
17% |

| 3DMark | |
| 1280x720 Cloud Gate Standard Score (sort by value) | |
| Asus Zenbook UX360CA | |
| Toshiba Sat. Radius 12 P20W-C | |
| HP Spectre x360 13 | |
| HP Spectre x360 13 | |
| Acer Aspire R13 R7-372T | |
| Lenovo Yoga 900- 13ISK | |
| Microsoft Surface Pro 4 | |
| Samsung Galaxy Tab Pro S W700N | |
| Lenovo IdeaPad Miix 700 | |
| HP Spectre x2 12 | |
| 1280x720 Cloud Gate Standard Graphics (sort by value) | |
| Asus Zenbook UX360CA | |
| Toshiba Sat. Radius 12 P20W-C | |
| HP Spectre x360 13 | |
| HP Spectre x360 13 | |
| Acer Aspire R13 R7-372T | |
| Lenovo Yoga 900- 13ISK | |
| Microsoft Surface Pro 4 | |
| Samsung Galaxy Tab Pro S W700N | |
| Lenovo IdeaPad Miix 700 | |
| HP Spectre x2 12 | |
| 3DMark 11 Performance | 785 pontos | |
| 3DMark Cloud Gate Standard Score | 4205 pontos | |
Ajuda | ||
| Rise of the Tomb Raider - 1024x768 Lowest Preset (sort by value) | |
| Asus Zenbook UX360CA | |
| Samsung Galaxy Tab Pro S W700N | |
| Tomb Raider | |
| 1366x768 Normal Preset AA:FX AF:4x (sort by value) | |
| Asus Zenbook UX360CA | |
| Acer Aspire R13 R7-372T | |
| Microsoft Surface Pro 4 | |
| Lenovo IdeaPad Miix 700 | |
| 1024x768 Low Preset (sort by value) | |
| Asus Zenbook UX360CA | |
| Acer Aspire R13 R7-372T | |
| Microsoft Surface Pro 4 | |
| Lenovo IdeaPad Miix 700 | |
| BioShock Infinite - 1366x768 Medium Preset (sort by value) | |
| Asus Zenbook UX360CA | |
| HP Spectre x360 13 | |
| Acer Aspire R13 R7-372T | |
| Microsoft Surface Pro 4 | |
| Lenovo IdeaPad Miix 700 | |
| baixo | média | alto | ultra | |
| Tomb Raider (2013) | 34.8 | 12.4 | ||
| BioShock Infinite (2013) | 36.4 | 20.2 | 15.8 | |
| Rise of the Tomb Raider (2016) | 8.4 | 4.2 |
| Asus Zenbook UX360CA HD Graphics 515, 6Y30, Lite-On CV1-8B128 | Toshiba Sat. Radius 12 P20W-C HD Graphics 520, 6500U, Samsung SSD PM871 MZNLN256HCHP | HP Spectre x360 13 HD Graphics 520, 6200U, Samsung SSD PM851 256 GB MZNTE256HMHP | Acer Aspire R13 R7-372T HD Graphics 520, 6500U, Lite-On CV1-8B256 | Lenovo Yoga 900- 13ISK HD Graphics 520, 6500U, Samsung SSD PM871 MZNLN512HCJH | Microsoft Surface Pro 4 HD Graphics 520, 6300U, Samsung MZFLV128 NVMe | |
|---|---|---|---|---|---|---|
| Noise | ||||||
| off / environment * | 31.3 | 31.3 | ||||
| Idle Minimum * | 32.5 | 29.6 | 31.3 | 29.7 | 31.5 | |
| Idle Average * | 32.6 | 29.6 | 31.3 | 29.8 | 31.5 | |
| Idle Maximum * | 32.6 | 34.6 | 31.8 | 30 | 31.5 | |
| Load Average * | 41 | 34.7 | 39.2 | 32 | 40.5 | |
| Load Maximum * | 41 | 37.9 | 39.1 | 38.5 | 40.7 |
* ... smaller is better
| Asus Zenbook UX360CA 6Y30 fanless | Toshiba Sat. Radius 12 P20W-C 6500U fan | HP Spectre x360 13 6200U fan | Acer Aspire R13 R7-372T 6500U fan | Lenovo Yoga 900- 13ISK 6500U fan | Microsoft Surface Pro 4 6300U fan | Samsung Galaxy Tab Pro S W700N 6Y30 fanless | Lenovo IdeaPad Miix 700 6Y54 fanless | HP Spectre x2 12 6Y75 fanless | Aspire Switch Alpha 12 SA5-271 6200U fanless | |
|---|---|---|---|---|---|---|---|---|---|---|
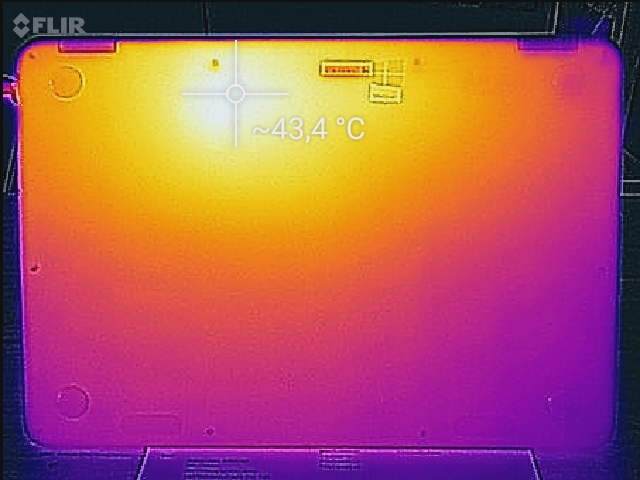
| Heat | -14% | -5% | -0% | 1% | -44% | -30% | -9% | -16% | -20% | |
| Maximum Upper Side * | 39 | 46.5 -19% | 39.6 -2% | 40 -3% | 37.4 4% | 52.3 -34% | 42.5 -9% | 38.6 1% | 43.5 -12% | 46.7 -20% |
| Maximum Bottom * | 37.6 | 43 -14% | 39.7 -6% | 37.6 -0% | 36.4 3% | 51.4 -37% | 44.6 -19% | 40.8 -9% | 42 -12% | 51 -36% |
| Idle Upper Side * | 25.7 | 28.9 -12% | 25 3% | 25.1 2% | 26.6 -4% | 43.2 -68% | 36.6 -42% | 30.4 -18% | 33 -28% | 29.5 -15% |
| Idle Bottom * | 26 | 28.4 -9% | 29.8 -15% | 26 -0% | 25.6 2% | 36 -38% | 38.6 -48% | 28 -8% | 29.3 -13% | 28.6 -10% |
* ... smaller is better
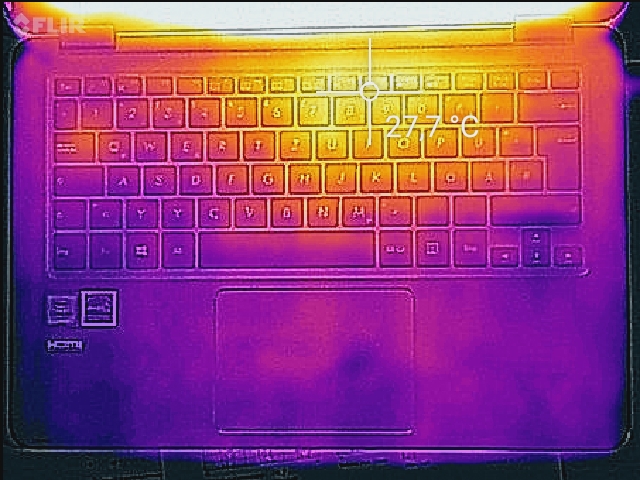
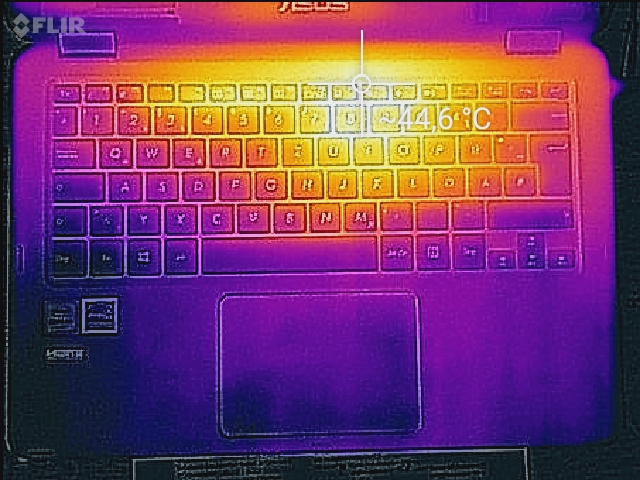
(+) The maximum temperature on the upper side is 39 °C / 102 F, compared to the average of 35.3 °C / 96 F, ranging from 19.6 to 55.7 °C for the class Convertible.
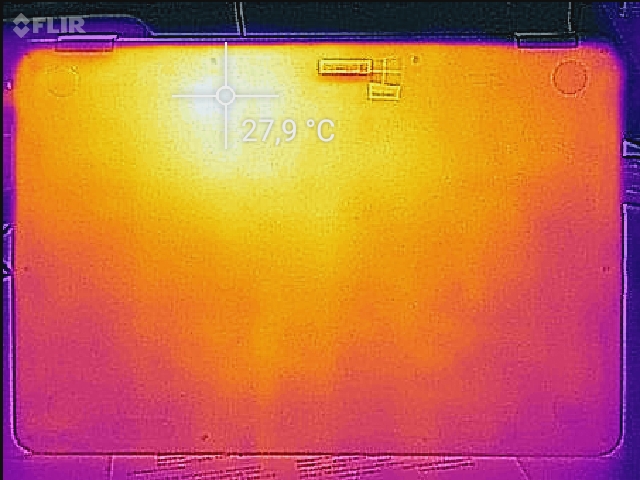
(+) The bottom heats up to a maximum of 37.6 °C / 100 F, compared to the average of 36.8 °C / 98 F
(+) In idle usage, the average temperature for the upper side is 24.3 °C / 76 F, compared to the device average of 30.2 °C / 86 F.
(+) The palmrests and touchpad are cooler than skin temperature with a maximum of 27.8 °C / 82 F and are therefore cool to the touch.
(±) The average temperature of the palmrest area of similar devices was 28.1 °C / 82.6 F (+0.3 °C / 0.6 F).
| Asus Zenbook UX360CA 6Y30 fanless | Toshiba Sat. Radius 12 P20W-C 6500U fan | HP Spectre x360 13 6200U fan | Acer Aspire R13 R7-372T 6500U fan | Microsoft Surface Pro 4 6300U fan | Samsung Galaxy Tab Pro S W700N 6Y30 fanless | Lenovo IdeaPad Miix 700 6Y54 fanless | HP Spectre x2 12 6Y75 fanless | Aspire Switch Alpha 12 SA5-271 6200U fanless | |
|---|---|---|---|---|---|---|---|---|---|
| Power Consumption | -103% | -25% | -68% | -20% | 5% | -28% | -11% | -54% | |
| Idle Minimum * | 3.4 | 8.8 -159% | 3.9 -15% | 6.2 -82% | 4.4 -29% | 3.4 -0% | 4 -18% | 4.5 -32% | 7.3 -115% |
| Idle Average * | 7 | 12.8 -83% | 7.4 -6% | 8 -14% | 9 -29% | 8 -14% | 8.6 -23% | 7.7 -10% | 10 -43% |
| Idle Maximum * | 7.6 | 13.7 -80% | 9.2 -21% | 11.6 -53% | 10.7 -41% | 9 -18% | 9.3 -22% | 8.3 -9% | 10.15 -34% |
| Load Average * | 19 | 38 -100% | 28.1 -48% | 40 -111% | 19.6 -3% | 12 37% | 18.6 2% | 19.8 -4% | 25.2 -33% |
| Load Maximum * | 20.1 | 39 -94% | 27.6 -37% | 36.6 -82% | 19.9 1% | 16.1 20% | 36.3 -81% | 20.6 -2% | 29.3 -46% |
* ... smaller is better
| desligado | |
| Ocioso | |
| Carga |
|
| Asus Zenbook UX360CA 6Y30 fanless | Toshiba Sat. Radius 12 P20W-C 6500U fan | HP Spectre x360 13 6200U fan | Acer Aspire R13 R7-372T 6500U fan | Lenovo Yoga 900- 13ISK 6500U fan | Microsoft Surface Pro 4 6300U fan | Samsung Galaxy Tab Pro S W700N 6Y30 fanless | Lenovo IdeaPad Miix 700 6Y54 fanless | HP Spectre x2 12 6Y75 fanless | Aspire Switch Alpha 12 SA5-271 6200U fanless | |
|---|---|---|---|---|---|---|---|---|---|---|
| Battery Runtime | -38% | 30% | -33% | -20% | -18% | 22% | -12% | -15% | -36% | |
| Reader / Idle | 1027 | 669 -35% | 844 -18% | 899 -12% | 1110 8% | 861 -16% | 954 -7% | 640 -38% | ||
| WiFi v1.3 | 386 | 241 -38% | 500 30% | 382 -1% | 403 4% | 427 11% | 525 36% | 440 14% | 361 -6% | 321 -17% |
| Load | 239 | 85 -64% | 128 -46% | 111 -54% | 157 -34% | 166 -31% | 112 -53% | |||
| H.264 | 393 | 515 | 450 | 468 |
Pro
Contra
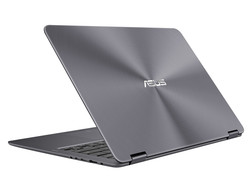
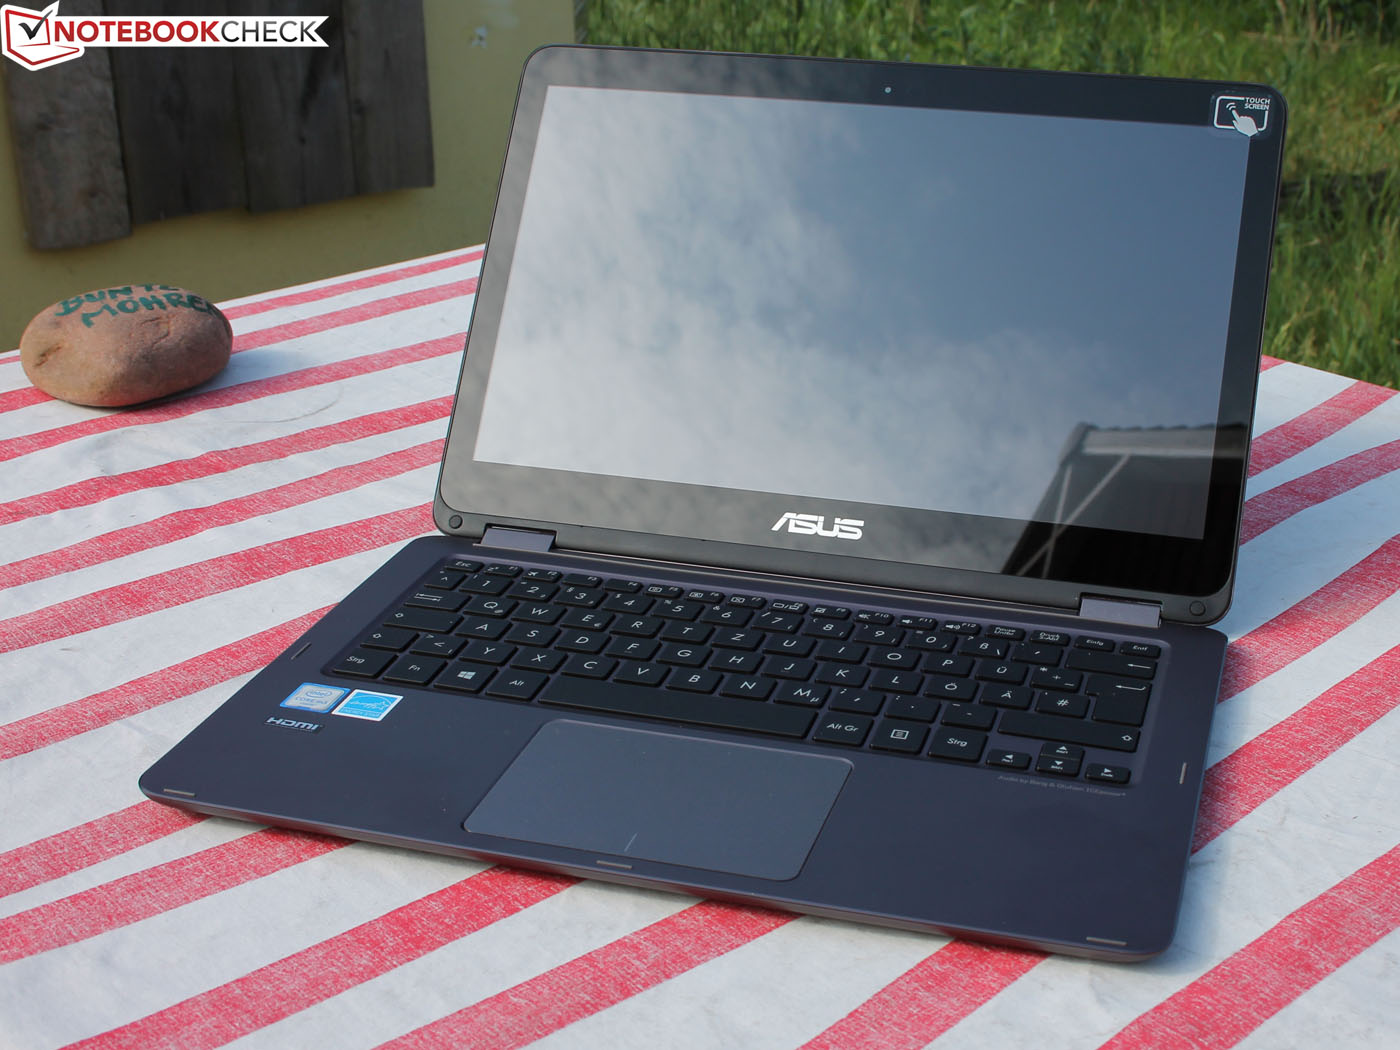
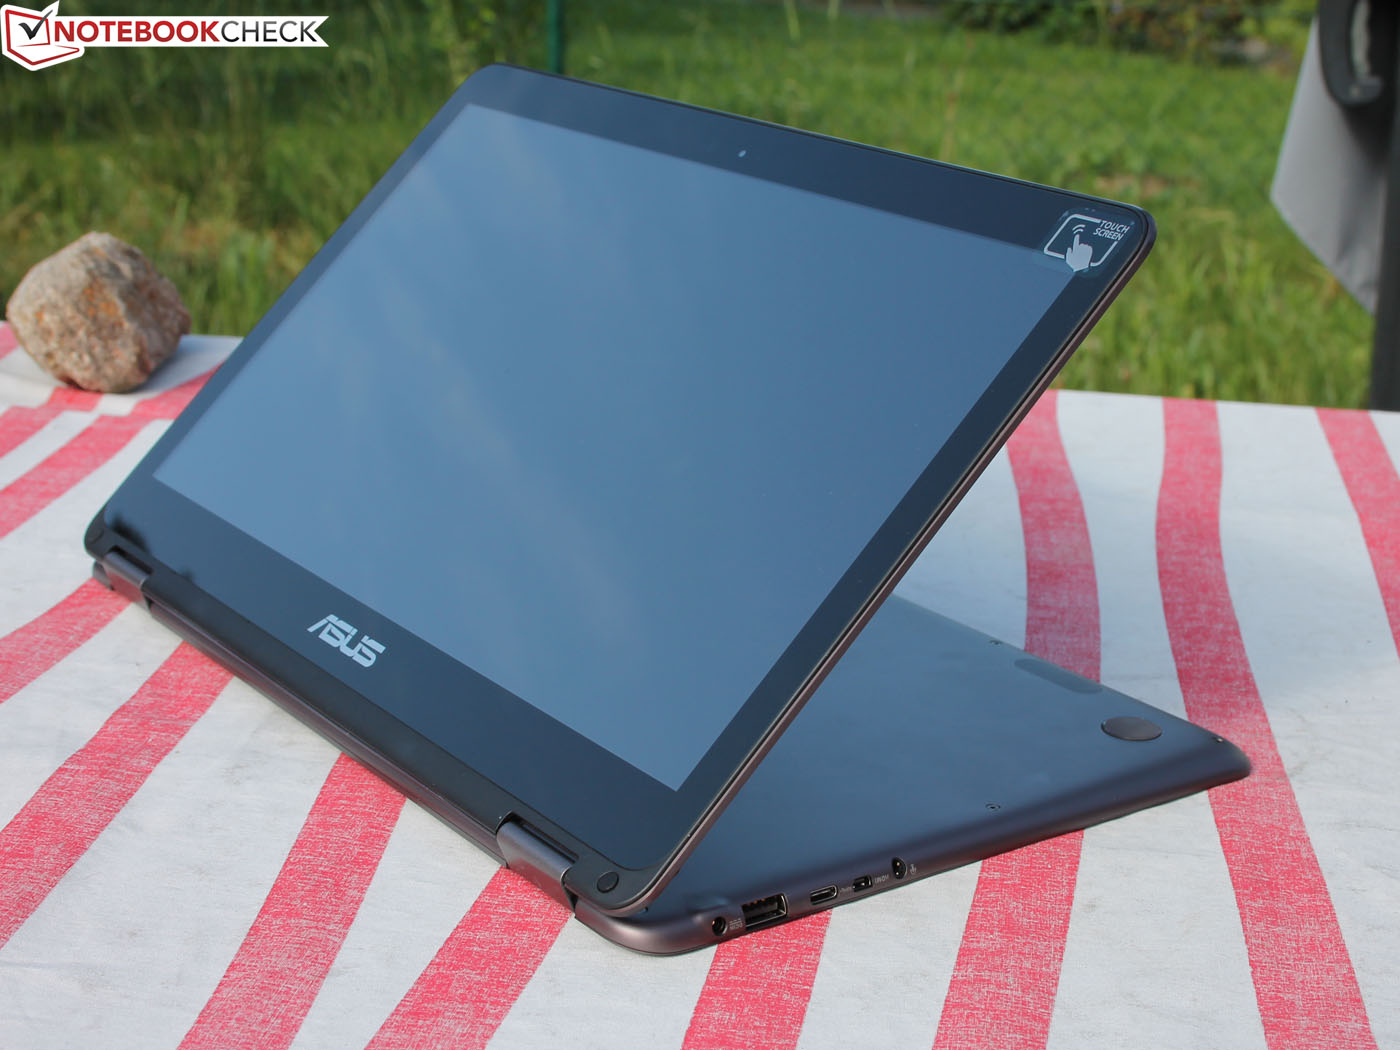
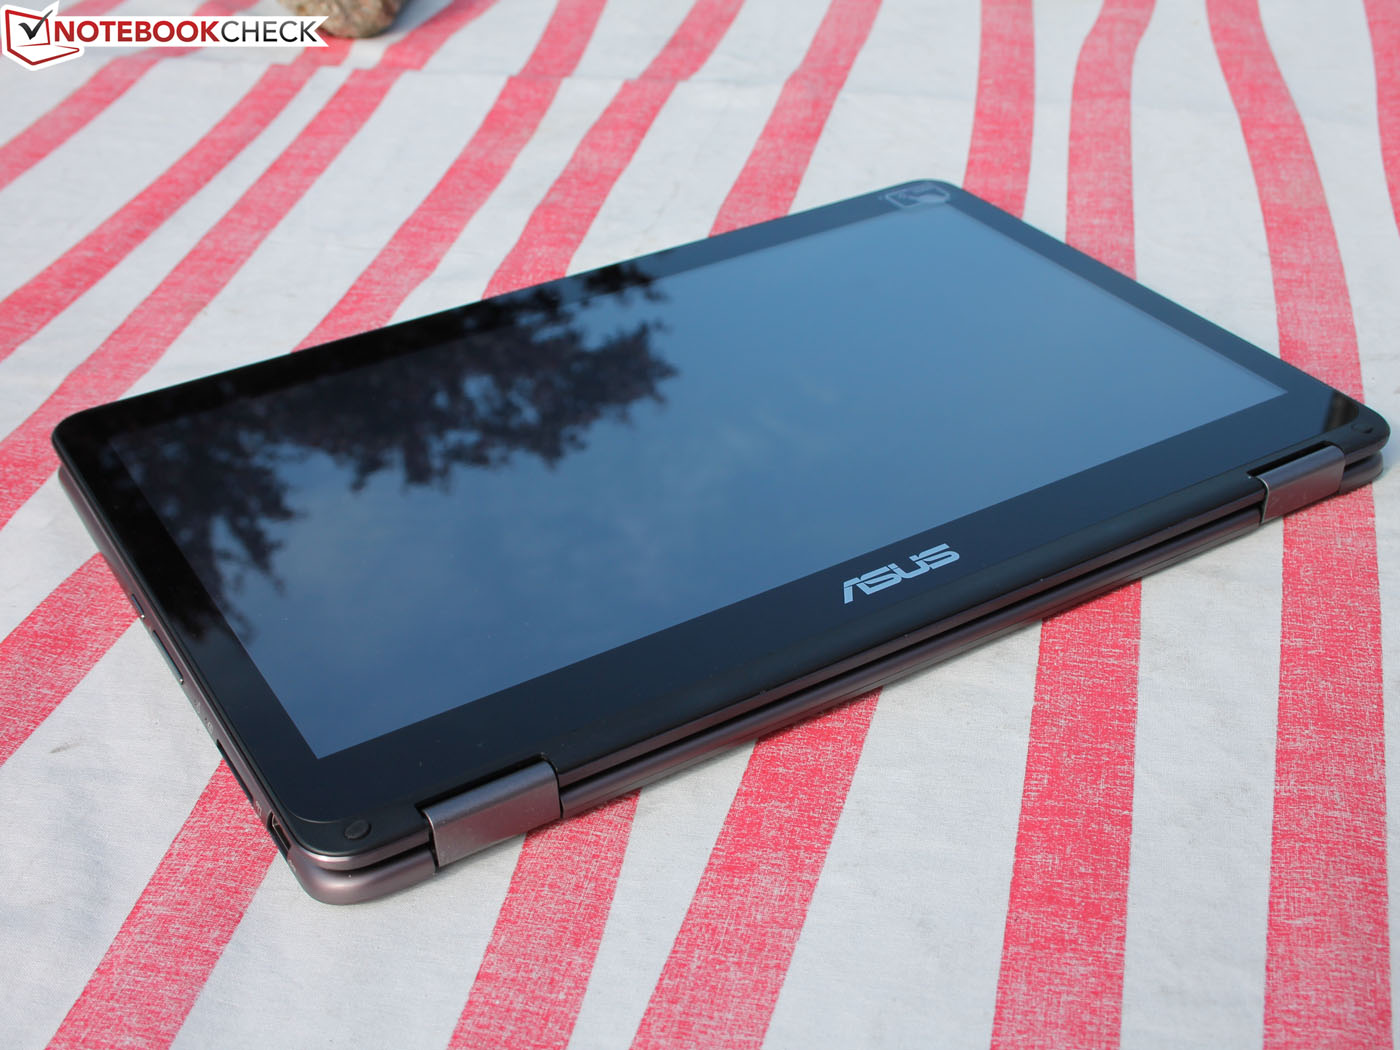
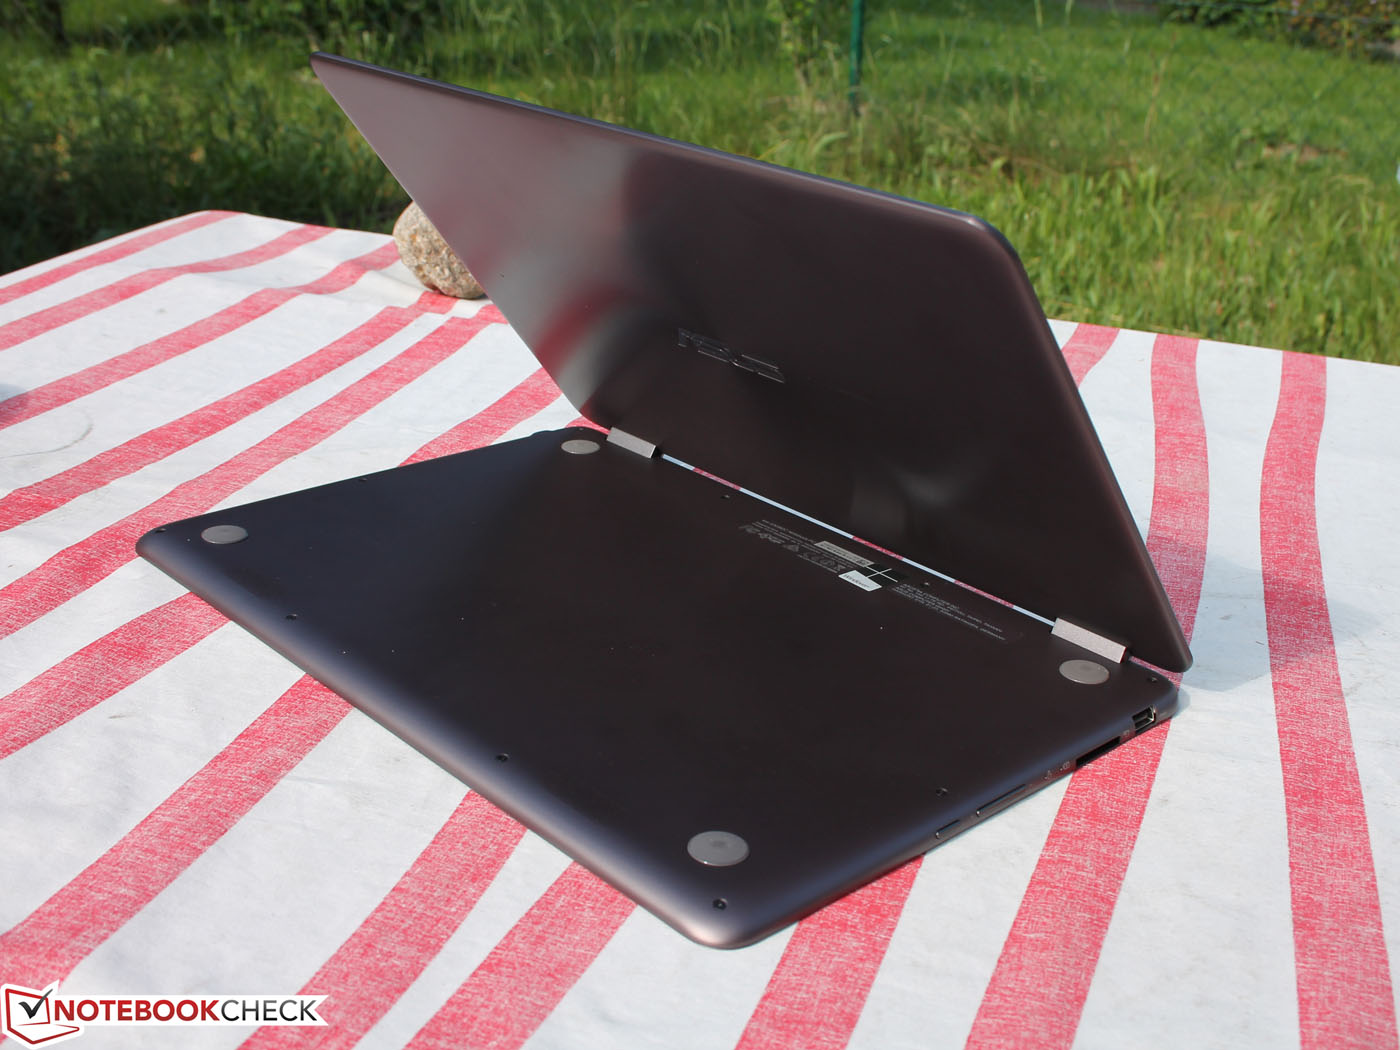
Está à procura de um conversível leve que lide bem com múltiplas tarefas produtivas do Windows e que tenha um bom visual ao mesmo tempo? A Asus faz uma tentativa em conseguir este equilíbrio e redesenha o seu bem-sucedido Zenbook UX305CA (Core m, sem ventoinha) ao estilo Yoga. O resultado é um rival para o Lenovo Yoga 900-13ISK (1400 Euros, ~$1578). É claro que a Asus oferece um melhor preço de 830 Euros (~$935), mas omite a resolução 4K e somente tem um Core m3 e sem uma dobradiça bonita.
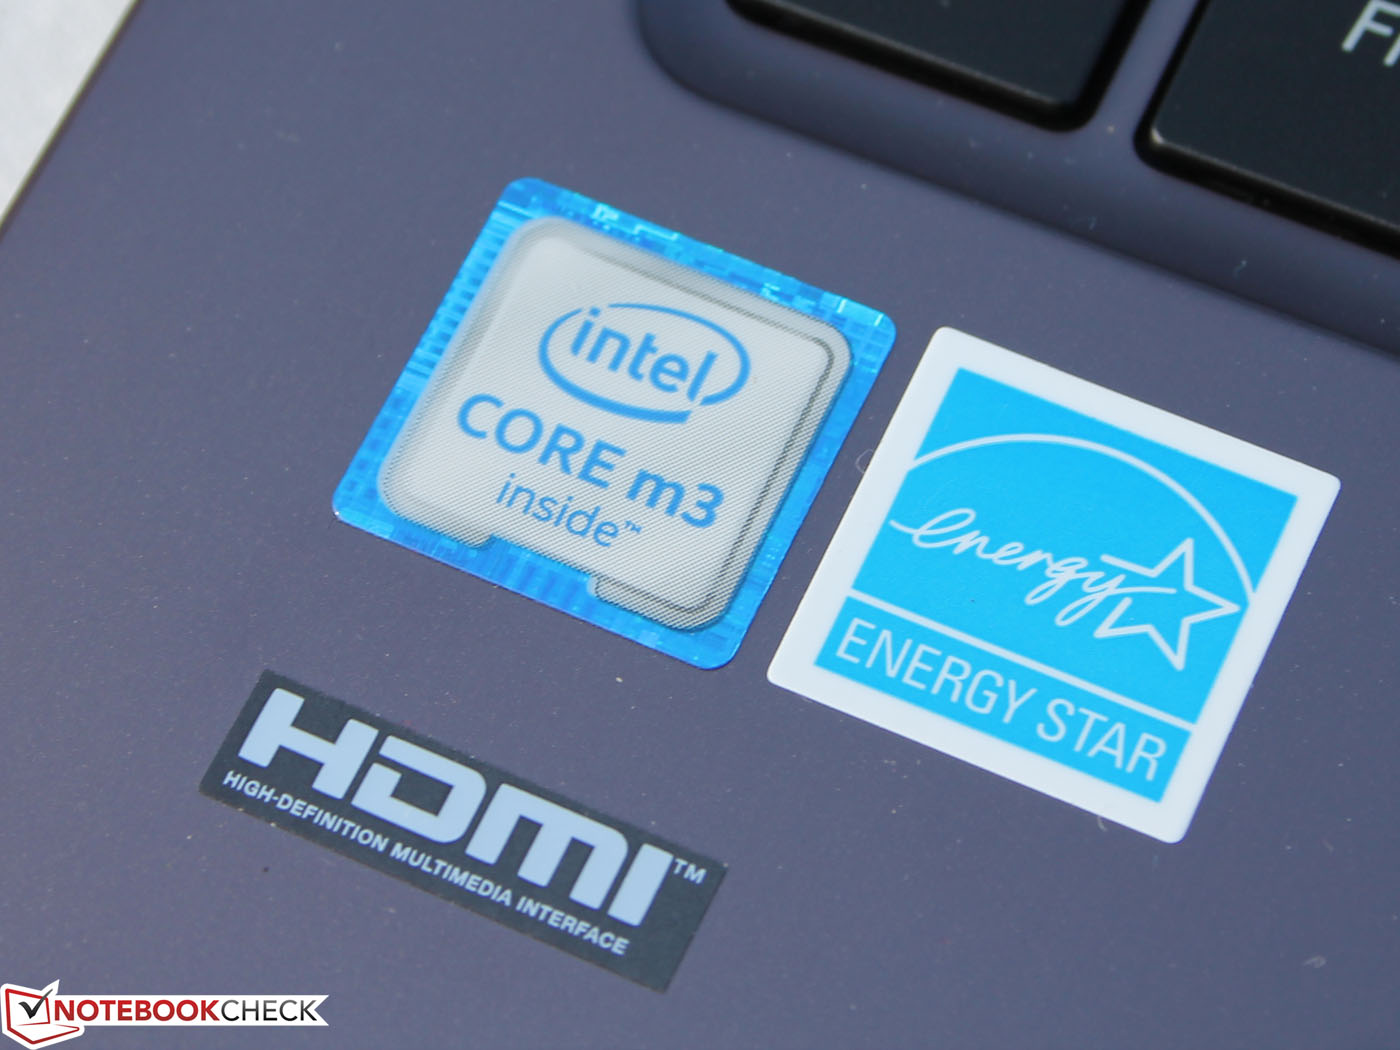
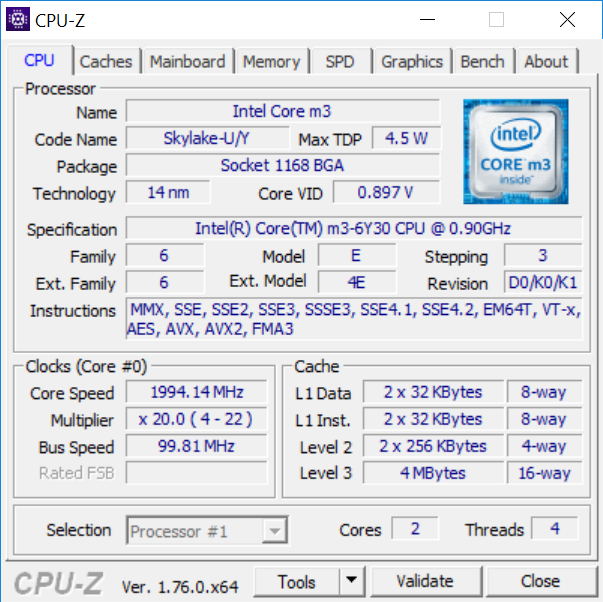
"Somente um Core m3" – é isso uma desvantagem? Nós achamos que: Não. A Asus descobriu, como nós em nossos testes com o Core m3, m5 e m7, que o m3 fornece a melhor razão de preço-desempenho. Este é o motivo pelo qual o Core m7 - como no HP Spectre x2 12 - não consegue proporcionar o seu desempenho plenamente, durante uso básico, devido ao afogamento. Isso seria como se alguém comprasse uma motocicleta que está limitada para apenas 80 km/h. Então seria preferível comprar uma leve moto frugal de 125 m³. Ele também consegue atravessar o tráfico da cidade, como os benchmarks de sistemas demonstram. Graças aos velozes SSDs em todos os aparelhos similares, as diferenças entre o Core i e m são bastante pequenas. 12 - 15% soa muito insignificante.
A Microsoft não optou por nada em contra do m5 e m7 em seu Surface Pro 4 sem ventoinha. Os usuários que desejam mais poder terão que procurar processadores Core i. A Asus, no entanto, não oferece esses em seu modelo de 360-graus, somente em seus Zenbooks normais. Outras alternativas seriam o não muito mais caro Acer Aspire R13 R7-372T-746N (com porta Thunderbolt 3) ou o Toshiba Satellite Radius 12 P20W-C-106.
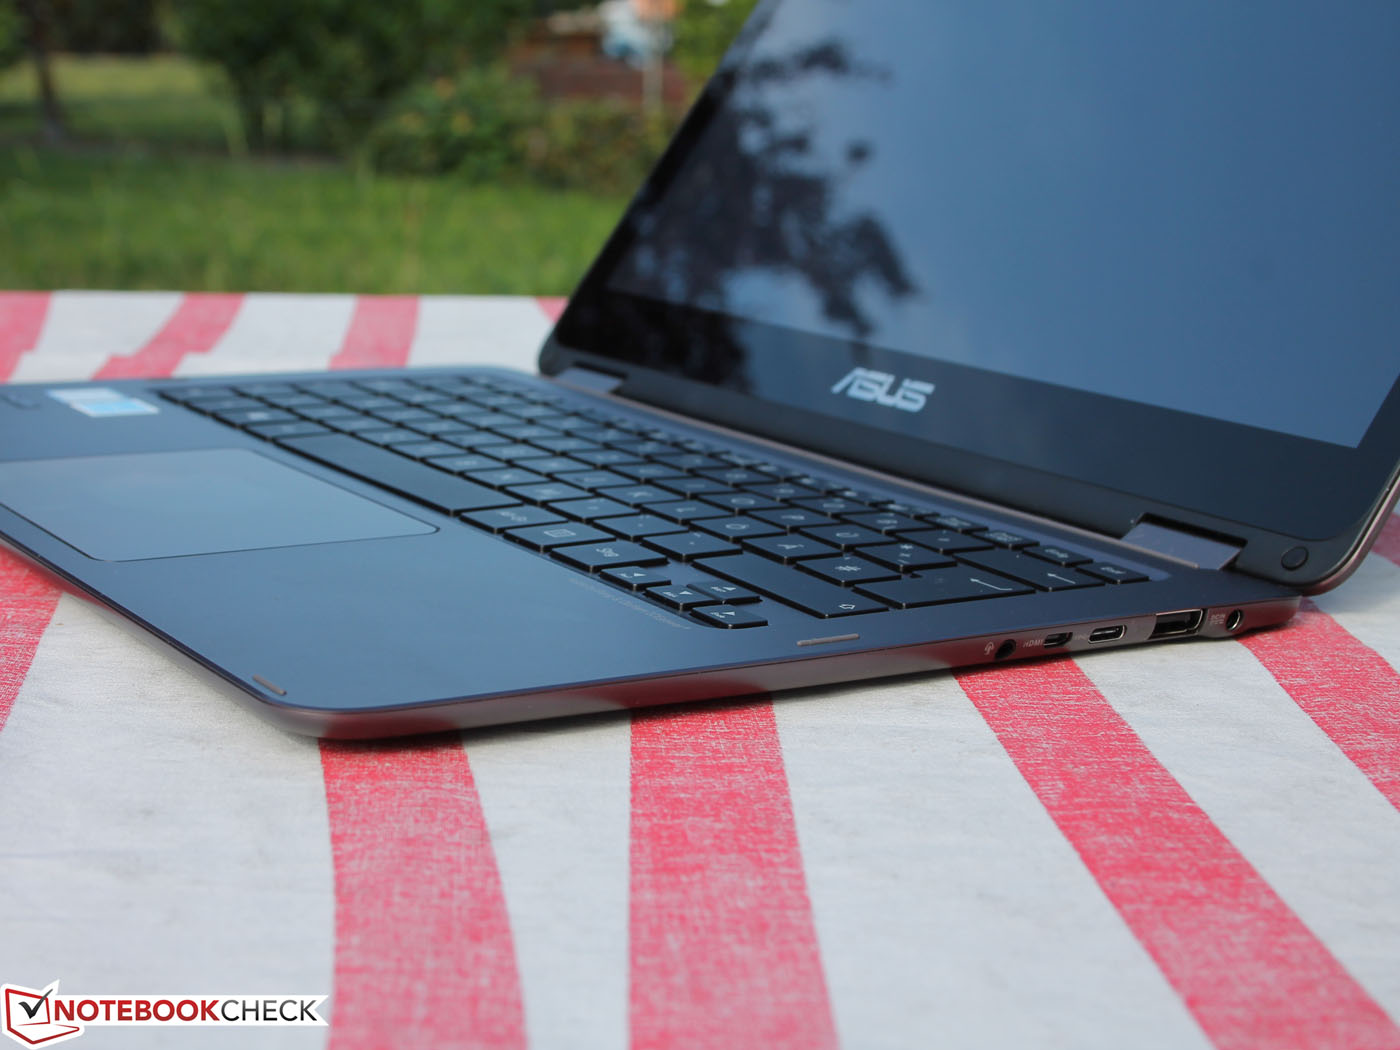
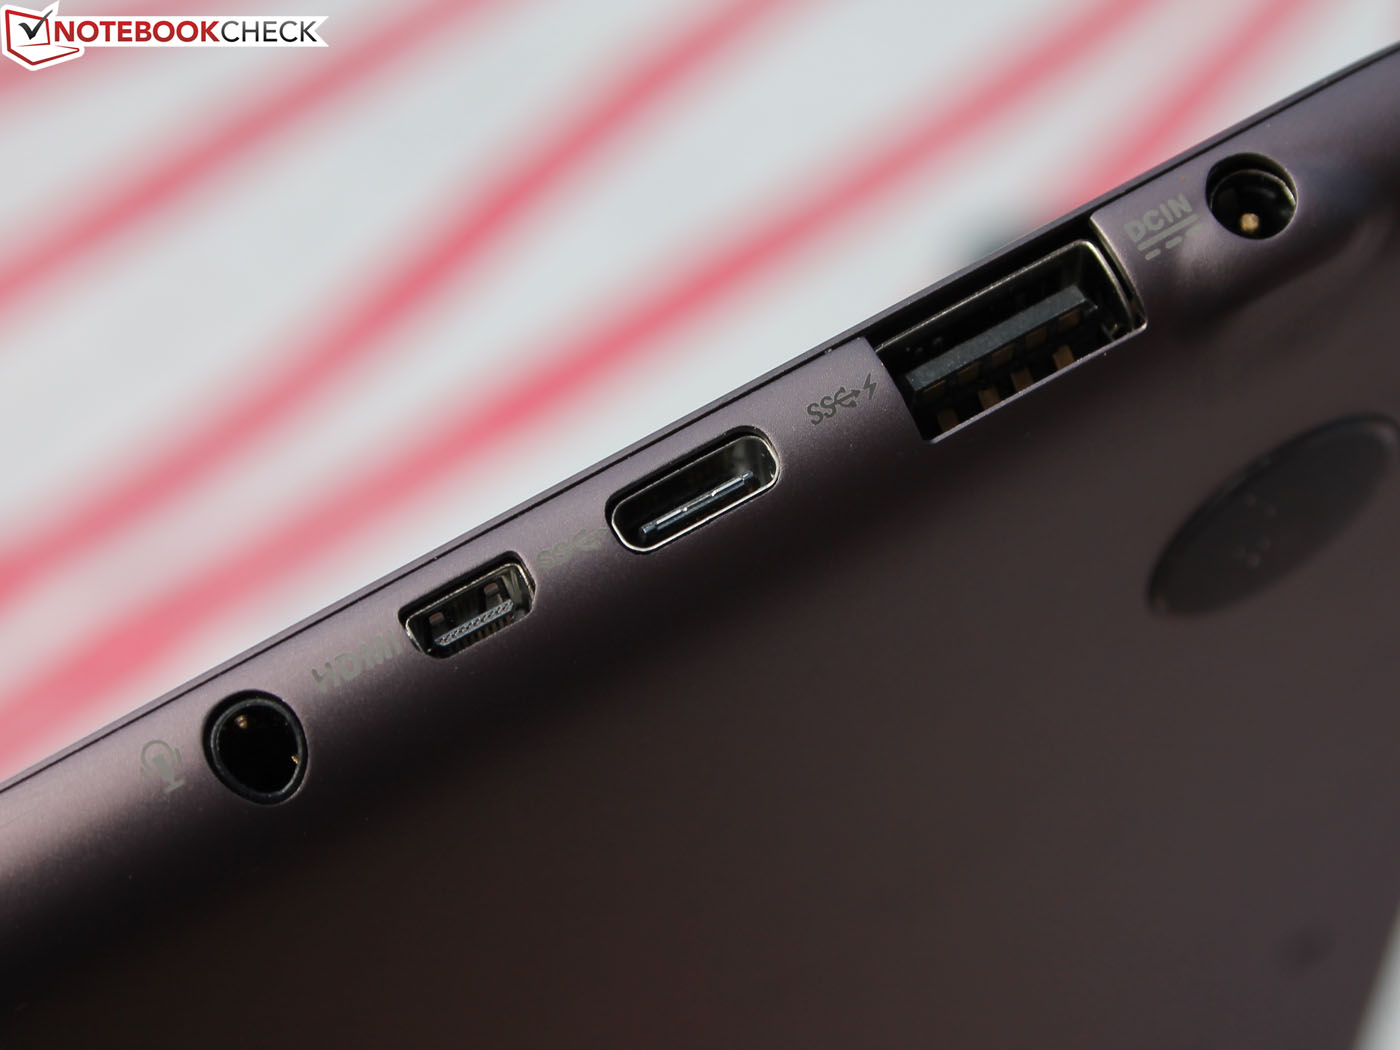
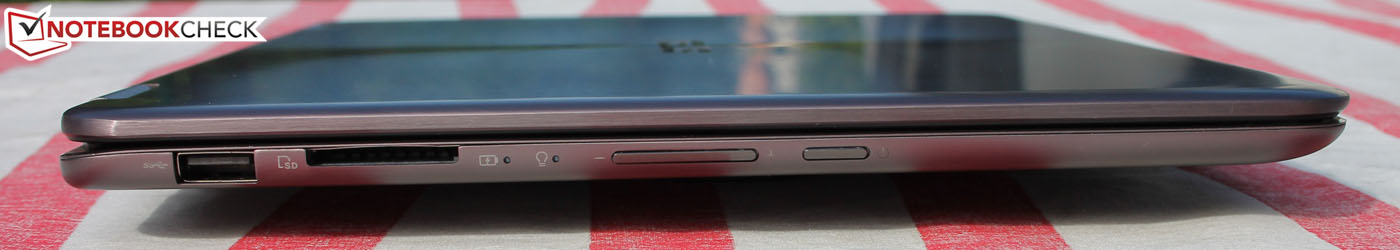
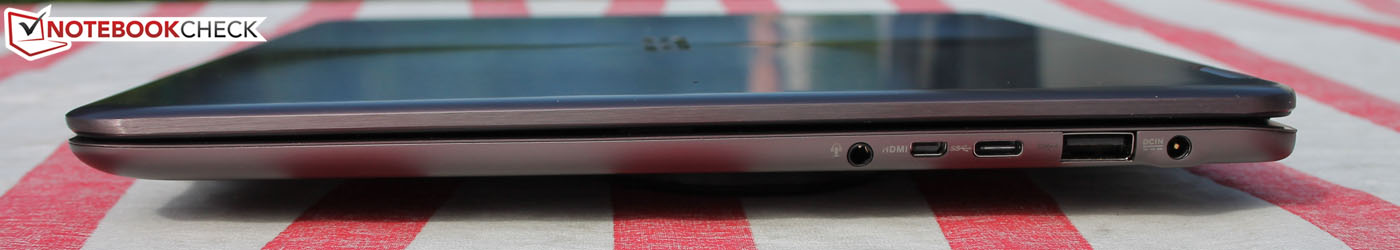
Em comparação com soluções tablet, o UX360CA oferece uma enorme diversidade de interfaces. Dependendo dos requisitos, este ponto não é necessariamente uma desvantagem. OLenovo IdeaPad Miix 700 vem com uma porta USB Type-A junto com um micro-HDMI, e o HP Spectre x2 12 oferece um total de duas portas USB Type-C - mas não uma verdadeira saída de vídeo.
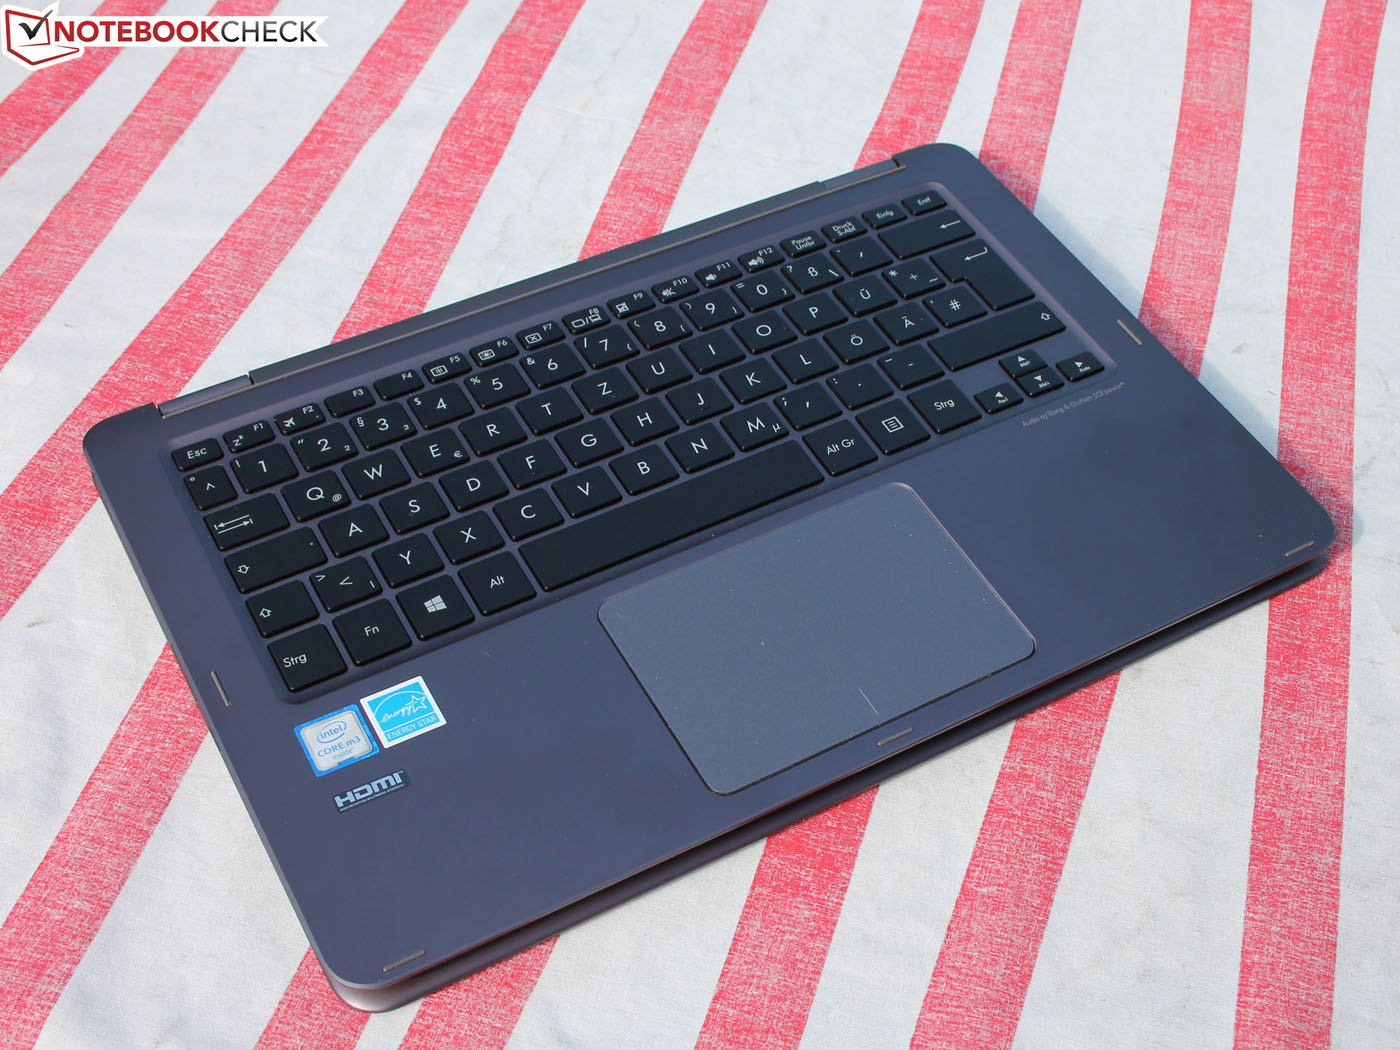
Finalmente, o Asus Zenbook UX360CA-FC060T é um conversível bem concebido que sofre apenas com um teclado que é fraco porque é instável. Os escritores prolíficos não estarão contentes com ele no longo prazo.
Esta é uma versão reduzida da análise original. Você pode ler a análise completa em inglês aqui.
Asus Zenbook UX360CA-FC060T
-
06/15/2016 v5.1(old)
Sebastian Jentsch