 Deutsch
 English
 Español
 Français
 Italiano
 Nederlands
 Polski
 Português
 Русский
 Türkçe
 Svenska
 Chinese
 Magyar
Breve Análise do Conversível Dell Inspiron 17 7778


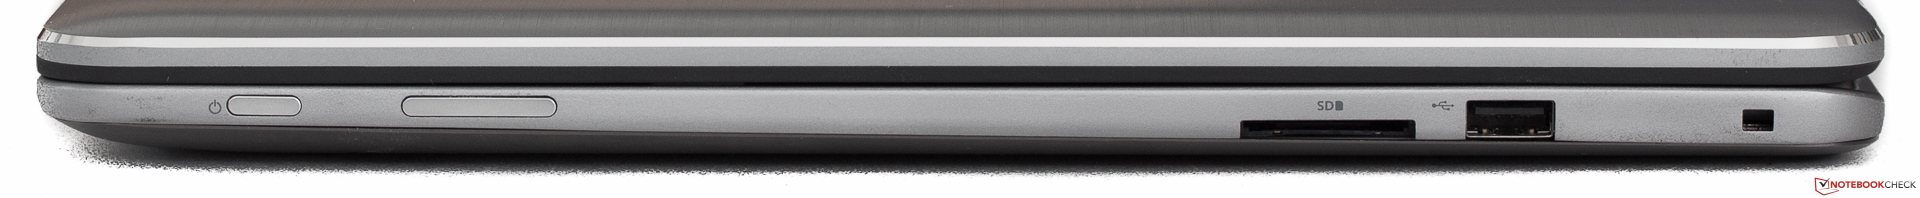
| SD Card Reader | |
| average JPG Copy Test (av. of 3 runs) | |
| HP Envy 15-w103ng x360 | |
| Dell Inspiron 17 7778 | |
| Dell Inspiron 15 5568 | |
| Acer TravelMate P278-MG-76L2 | |
| maximum AS SSD Seq Read Test (1GB) | |
| HP Envy 15-w103ng x360 | |
| Acer TravelMate P278-MG-76L2 | |
| Dell Inspiron 15 5568 | |
| Dell Inspiron 17 7778 | |
| Networking | |
| WiFi Speed Client 1m | |
| WiFi Speed Server 1m |
| |||||||||||||||||||||||||
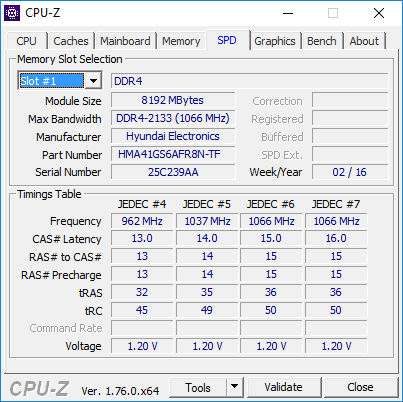
iluminação: 87 %
iluminação com acumulador: 334 cd/m²
Contraste: 1090:1 (Preto: 0.3 cd/m²)
ΔE Color 6.75 | 0.5-29.43 Ø5
ΔE Greyscale 7.91 | 0.57-98 Ø5.3
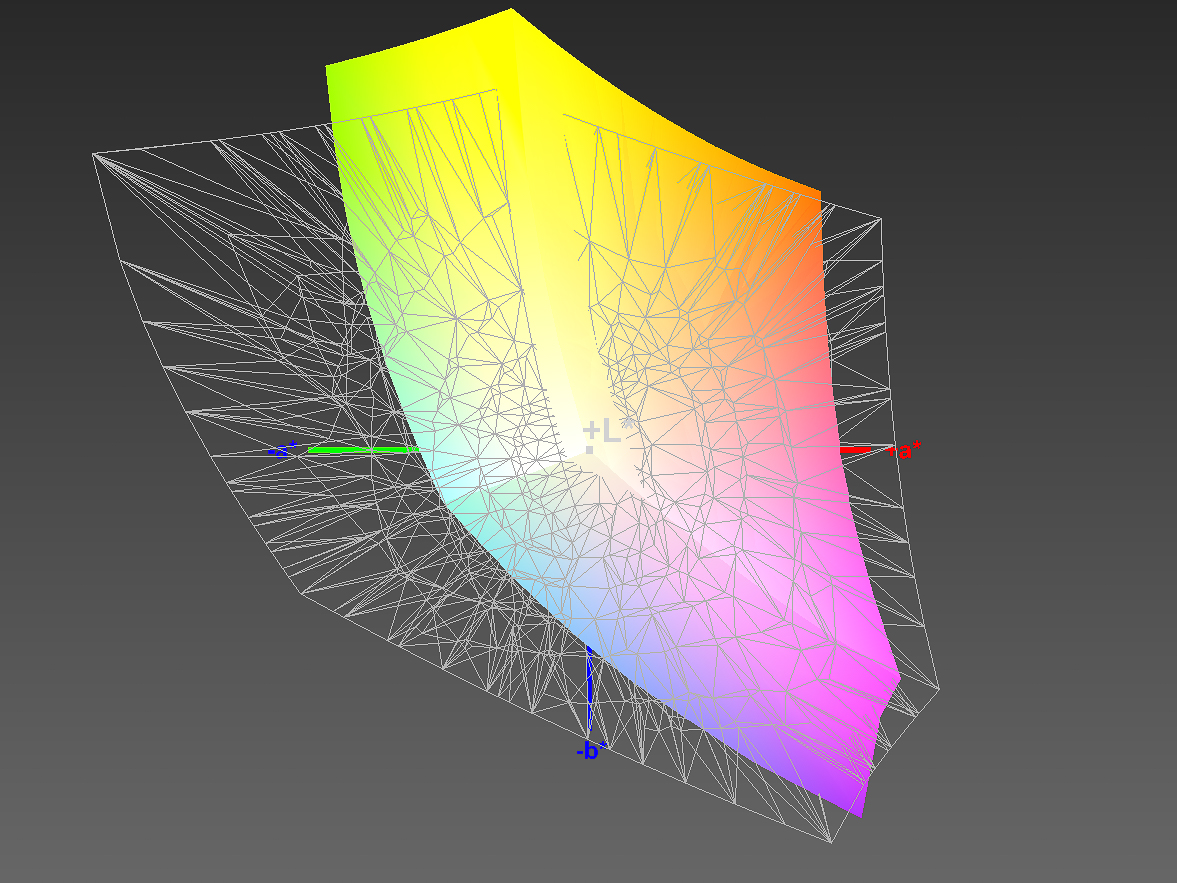
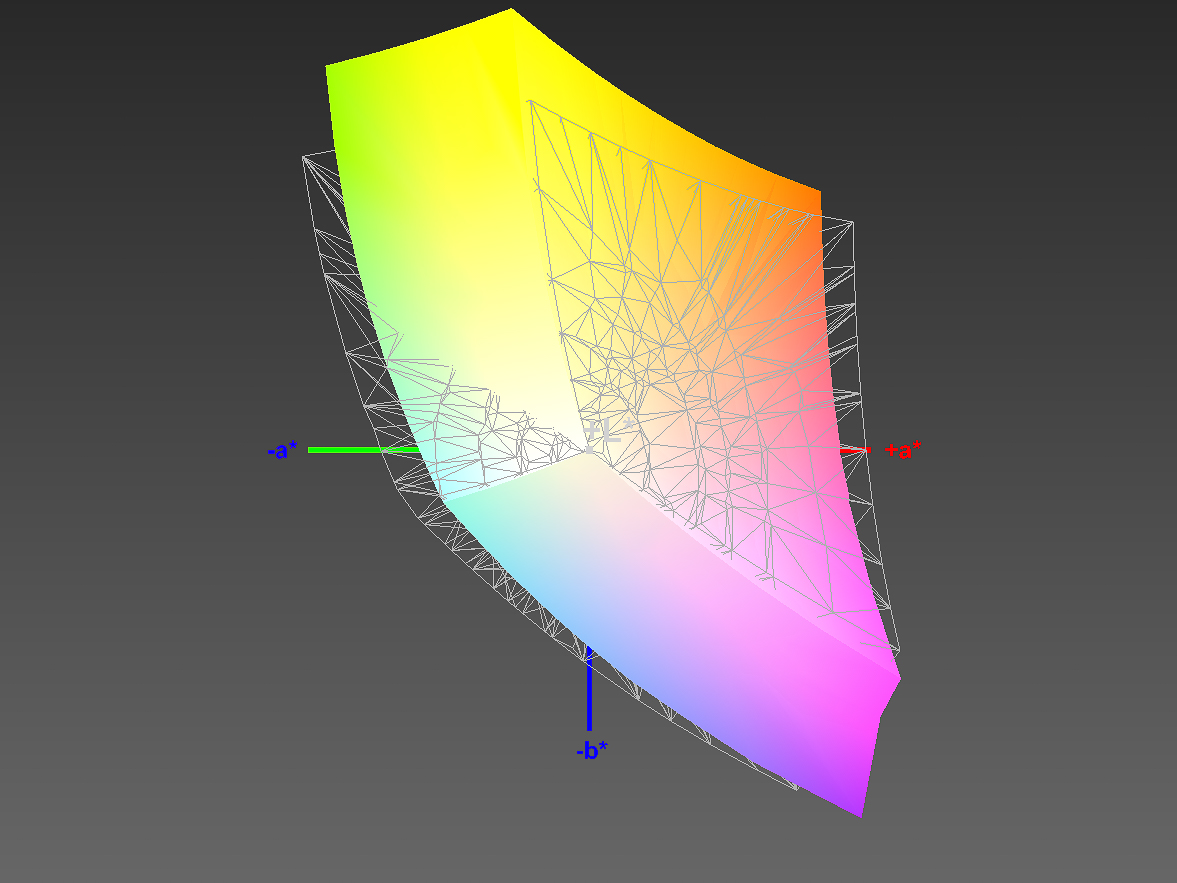
86% sRGB (Argyll 1.6.3 3D)
57% AdobeRGB 1998 (Argyll 1.6.3 3D)
63.1% AdobeRGB 1998 (Argyll 2.2.0 3D)
86.3% sRGB (Argyll 2.2.0 3D)
67.4% Display P3 (Argyll 2.2.0 3D)
Gamma: 2.31
| Dell Inspiron 17 7778 LG Philips LGD 0513 / 173WF4, , 1920x1080, 17.30 | HP Spectre x360 15-ap012dx 3840x2160, 15.60 | Dell Inspiron 15 5568 AU Optronics B156HW01 V0, , 1920x1080, 15.60 | HP Envy 15-w103ng x360 LG Philips, , 1920x1080, 15.60 | Acer TravelMate P278-MG-76L2 AUO B173HTN01.1 (AUO119D), , 1920x1080, 17.30 | |
|---|---|---|---|---|---|
| Display | -1% | -39% | -36% | 4% | |
| Display P3 Coverage | 67.4 | 62.8 -7% | 38.04 -44% | 39.97 -41% | 68.8 2% |
| sRGB Coverage | 86.3 | 88.2 2% | 57.1 -34% | 59.8 -31% | 90.6 5% |
| AdobeRGB 1998 Coverage | 63.1 | 63.9 1% | 39.3 -38% | 41.32 -35% | 66.3 5% |
| Response Times | -9% | -9% | -15% | -10% | |
| Response Time Grey 50% / Grey 80% * | 36 ? | 32.8 ? 9% | 42 ? -17% | 37 ? -3% | 41 ? -14% |
| Response Time Black / White * | 22 ? | 28 ? -27% | 22 ? -0% | 28 ? -27% | 23 ? -5% |
| PWM Frequency | 1000 ? | ||||
| Screen | -1% | -1% | -17% | -21% | |
| Brightness middle | 327 | 298 -9% | 266 -19% | 208 -36% | 362 11% |
| Brightness | 314 | 295 -6% | 249 -21% | 205 -35% | 344 10% |
| Brightness Distribution | 87 | 88 1% | 85 -2% | 80 -8% | 84 -3% |
| Black Level * | 0.3 | 0.57 -90% | 0.26 13% | 0.26 13% | 0.57 -90% |
| Contrast | 1090 | 523 -52% | 1023 -6% | 800 -27% | 635 -42% |
| Colorchecker dE 2000 * | 6.75 | 4.43 34% | 4.98 26% | 6.97 -3% | 9.54 -41% |
| Colorchecker dE 2000 max. * | 11.82 | 6.62 44% | 11.82 -0% | 16.11 -36% | |
| Greyscale dE 2000 * | 7.91 | 2.45 69% | 2.68 66% | 7.37 7% | 10.39 -31% |
| Gamma | 2.31 95% | 2.45 90% | 2.27 97% | 2.34 94% | 2.55 86% |
| CCT | 7642 85% | 6326 103% | 6583 99% | 6823 95% | 11093 59% |
| Color Space (Percent of AdobeRGB 1998) | 57 | 57.2 0% | 36 -37% | 38 -33% | 59 4% |
| Color Space (Percent of sRGB) | 86 | 87.8 2% | 57 -34% | 59 -31% | 90 5% |
| Total Average (Program / Settings) | -4% /
-2% | -16% /
-10% | -23% /
-21% | -9% /
-15% |
* ... smaller is better
Display Response Times
| ↔ Response Time Black to White | ||
|---|---|---|
| 22 ms ... rise ↗ and fall ↘ combined | ↗ 5 ms rise | 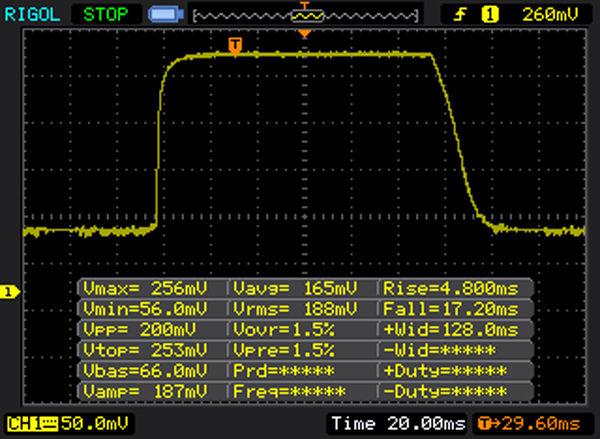 |
| ↘ 17 ms fall | ||
| The screen shows good response rates in our tests, but may be too slow for competitive gamers. In comparison, all tested devices range from 0.1 (minimum) to 240 (maximum) ms. » 42 % of all devices are better. This means that the measured response time is similar to the average of all tested devices (21.5 ms). | ||
| ↔ Response Time 50% Grey to 80% Grey | ||
| 36 ms ... rise ↗ and fall ↘ combined | ↗ 14 ms rise | 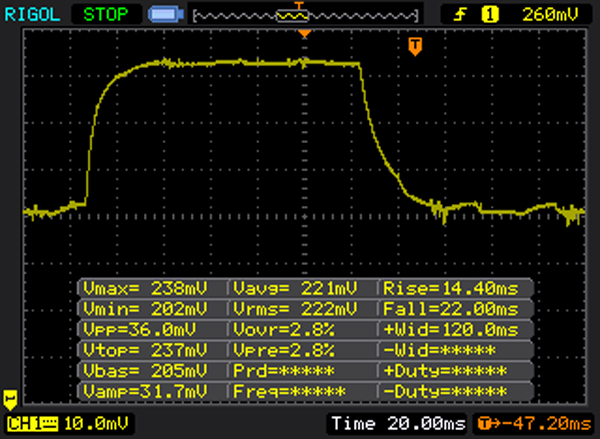 |
| ↘ 22 ms fall | ||
| The screen shows slow response rates in our tests and will be unsatisfactory for gamers. In comparison, all tested devices range from 0.2 (minimum) to 636 (maximum) ms. » 44 % of all devices are better. This means that the measured response time is similar to the average of all tested devices (33.7 ms). | ||
Screen Flickering / PWM (Pulse-Width Modulation)
| Screen flickering / PWM not detected | ||
In comparison: 53 % of all tested devices do not use PWM to dim the display. If PWM was detected, an average of 17924 (minimum: 5 - maximum: 3846000) Hz was measured. | ||

| Cinebench R15 | |
| CPU Single 64Bit | |
| Acer TravelMate P278-MG-76L2 | |
| Dell Inspiron 15 5568 | |
| Dell Inspiron 17 7778 | |
| HP Spectre x360 15-ap012dx | |
| HP Envy 15-w103ng x360 | |
| CPU Multi 64Bit | |
| Acer TravelMate P278-MG-76L2 | |
| HP Spectre x360 15-ap012dx | |
| Dell Inspiron 15 5568 | |
| Dell Inspiron 17 7778 | |
| HP Envy 15-w103ng x360 | |
| PCMark 8 | |
| Home Score Accelerated v2 | |
| Dell Inspiron 17 7778 | |
| Dell Inspiron 15 5568 | |
| Acer TravelMate P278-MG-76L2 | |
| HP Envy 15-w103ng x360 | |
| HP Spectre x360 15-ap012dx | |
| Work Score Accelerated v2 | |
| Dell Inspiron 17 7778 | |
| Acer TravelMate P278-MG-76L2 | |
| Dell Inspiron 15 5568 | |
| HP Envy 15-w103ng x360 | |
| HP Spectre x360 15-ap012dx | |
| PCMark 8 Home Score Accelerated v2 | 3696 pontos | |
| PCMark 8 Work Score Accelerated v2 | 4572 pontos | |
Ajuda | ||
| Dell Inspiron 17 7778 Liteonit CV3-CE512 | HP Spectre x360 15-ap012dx Sandisk X300 SD7SN6S-256G-1006 | Dell Inspiron 15 5568 Toshiba THNSNK256GCS8 | HP Envy 15-w103ng x360 Samsung SSD PM851 256 GB MZNTE256HMHP | Acer TravelMate P278-MG-76L2 Lite-On CV1-8B256 | |
|---|---|---|---|---|---|
| CrystalDiskMark 3.0 | -4% | -8% | 2% | -4% | |
| Read Seq | 486.4 | 475.6 -2% | 458.6 -6% | 515 6% | 473 -3% |
| Write Seq | 438.4 | 425 -3% | 270 -38% | 240.7 -45% | 366.3 -16% |
| Read 512 | 232.8 | 258.4 11% | 397.4 71% | 391.3 68% | 329.4 41% |
| Write 512 | 386.7 | 318.9 -18% | 242 -37% | 240 -38% | 357.3 -8% |
| Read 4k | 32.3 | 35.48 10% | 19.88 -38% | 27.64 -14% | 30.83 -5% |
| Write 4k | 65.8 | 93 41% | 86.7 32% | 95.2 45% | 74.8 14% |
| Read 4k QD32 | 334.4 | 281.2 -16% | 275.3 -18% | 367.9 10% | 245.1 -27% |
| Write 4k QD32 | 289.5 | 138.7 -52% | 197.6 -32% | 239 -17% | 217.3 -25% |

| 3DMark 11 - 1280x720 Performance GPU | |
| Dell Inspiron 17 7778 | |
| Acer TravelMate P278-MG-76L2 | |
| HP Envy 15-w103ng x360 | |
| Dell Inspiron 15 5568 | |
| HP Spectre x360 15-ap012dx | |
| 3DMark | |
| 1280x720 Cloud Gate Standard Graphics | |
| Dell Inspiron 17 7778 | |
| Acer TravelMate P278-MG-76L2 | |
| Dell Inspiron 15 5568 | |
| HP Envy 15-w103ng x360 | |
| HP Spectre x360 15-ap012dx | |
| 1920x1080 Fire Strike Graphics | |
| Dell Inspiron 17 7778 | |
| Acer TravelMate P278-MG-76L2 | |
| HP Envy 15-w103ng x360 | |
| HP Spectre x360 15-ap012dx | |
| 3DMark 11 Performance | 2867 pontos | |
| 3DMark Cloud Gate Standard Score | 7674 pontos | |
| 3DMark Fire Strike Score | 1748 pontos | |
Ajuda | ||
| Mirror's Edge Catalyst | |
| 1920x1080 High Preset AF:16x | |
| MSI CX72 6QD | |
| Dell Inspiron 17 7778 | |
| 1366x768 Medium Preset AF:4x | |
| MSI CX72 6QD | |
| Asus VivoBook X556UQ-XO076T | |
| Dell Inspiron 17 7778 | |
| Far Cry Primal | |
| 1920x1080 High Preset AA:SM | |
| Dell Inspiron 17 7778 | |
| MSI CX72 6QD | |
| Lenovo ThinkPad T560-20FH002RGE | |
| 1920x1080 Medium Preset AA:SM | |
| MSI CX72 6QD | |
| Dell Inspiron 17 7778 | |
| Lenovo ThinkPad T560-20FH002RGE | |
| Rise of the Tomb Raider | |
| 1920x1080 High Preset AA:FX AF:4x | |
| Dell Inspiron 17 7778 | |
| MSI CX72 6QD | |
| Lenovo ThinkPad T560-20FH002RGE | |
| Acer TravelMate P278-MG-76L2 | |
| 1366x768 Medium Preset AF:2x | |
| Dell Inspiron 17 7778 | |
| MSI CX72 6QD | |
| Lenovo ThinkPad T560-20FH002RGE | |
| Acer TravelMate P278-MG-76L2 | |
| Just Cause 3 | |
| 1920x1080 High / On AA:FX AF:8x | |
| MSI CX72 6QD | |
| Lenovo ThinkPad T560-20FH002RGE | |
| Dell Inspiron 17 7778 | |
| 1366x768 Medium / Off AF:4x | |
| MSI CX72 6QD | |
| Lenovo ThinkPad T560-20FH002RGE | |
| Dell Inspiron 17 7778 | |
| Rainbow Six Siege | |
| 1920x1080 High Preset AA:T AF:4x | |
| MSI CX72 6QD | |
| Dell Inspiron 17 7778 | |
| Lenovo ThinkPad T560-20FH002RGE | |
| 1366x768 Medium Preset AA:T AF:2x | |
| MSI CX72 6QD | |
| Lenovo ThinkPad T560-20FH002RGE | |
| Dell Inspiron 17 7778 | |
| Assassin's Creed Syndicate | |
| 1920x1080 High Preset AA:FX | |
| Dell Inspiron 17 7778 | |
| HP Envy 15-w103ng x360 | |
| 1366x768 Medium Preset AA:FX | |
| Dell Inspiron 17 7778 | |
| MSI CX72 6QD | |
| HP Envy 15-w103ng x360 | |
| Star Wars Battlefront | |
| 1920x1080 High Preset AA:FX | |
| Dell Inspiron 17 7778 | |
| MSI CX72 6QD | |
| Lenovo ThinkPad T560-20FH002RGE | |
| HP Envy 15-w103ng x360 | |
| 1366x768 Medium Preset AA:FX | |
| MSI CX72 6QD | |
| Lenovo ThinkPad T560-20FH002RGE | |
| Asus VivoBook X556UQ-XO076T | |
| Dell Inspiron 17 7778 | |
| HP Envy 15-w103ng x360 | |
| Fallout 4 | |
| 1920x1080 High Preset AA:T AF:16x | |
| Dell Inspiron 17 7778 | |
| MSI CX72 6QD | |
| Lenovo ThinkPad T560-20FH002RGE | |
| HP Envy 15-w103ng x360 | |
| 1366x768 Medium Preset AA:T AF:16x | |
| Dell Inspiron 17 7778 | |
| MSI CX72 6QD | |
| Lenovo ThinkPad T560-20FH002RGE | |
| HP Envy 15-w103ng x360 | |
| Anno 2205 | |
| 1920x1080 High Preset AA:4x | |
| Dell Inspiron 17 7778 | |
| Lenovo ThinkPad T560-20FH002RGE | |
| MSI CX72 6QD | |
| HP Envy 15-w103ng x360 | |
| 1366x768 Medium Preset AA:2x | |
| MSI CX72 6QD | |
| Dell Inspiron 17 7778 | |
| Lenovo ThinkPad T560-20FH002RGE | |
| HP Envy 15-w103ng x360 | |
| FIFA 16 | |
| 1920x1080 High Preset AA:4x MS | |
| Dell Inspiron 17 7778 | |
| MSI CX72 6QD | |
| HP Envy 15-w103ng x360 | |
| 1366x768 High Preset AA:2x MS | |
| MSI CX72 6QD | |
| HP Envy 15-w103ng x360 | |
| Dirt Rally | |
| 1920x1080 High Preset | |
| Dell Inspiron 17 7778 | |
| Lenovo ThinkPad T560-20FH002RGE | |
| 1366x768 Medium Preset | |
| Dell Inspiron 17 7778 | |
| Lenovo ThinkPad T560-20FH002RGE | |
| The Witcher 3 | |
| 1920x1080 High Graphics & Postprocessing (Nvidia HairWorks Off) | |
| Dell Inspiron 17 7778 | |
| MSI CX72 6QD | |
| Lenovo ThinkPad T560-20FH002RGE | |
| HP Envy 15-w103ng x360 | |
| 1366x768 Medium Graphics & Postprocessing | |
| Dell Inspiron 17 7778 | |
| MSI CX72 6QD | |
| Lenovo ThinkPad T560-20FH002RGE | |
| HP Envy 15-w103ng x360 | |
| Battlefield 4 | |
| 1366x768 High Preset | |
| Dell Inspiron 17 7778 | |
| Lenovo ThinkPad T560-20FH002RGE | |
| Asus VivoBook X556UQ-XO076T | |
| Acer TravelMate P278-MG-76L2 | |
| 1366x768 Medium Preset | |
| Lenovo ThinkPad T560-20FH002RGE | |
| Asus VivoBook X556UQ-XO076T | |
| Dell Inspiron 17 7778 | |
| Acer TravelMate P278-MG-76L2 | |
| Metro: Last Light | |
| 1366x768 High (DX11) AF:16x | |
| Dell Inspiron 17 7778 | |
| Lenovo ThinkPad T560-20FH002RGE | |
| 1366x768 Medium (DX10) AF:4x | |
| Dell Inspiron 17 7778 | |
| Lenovo ThinkPad T560-20FH002RGE | |
| BioShock Infinite | |
| 1366x768 High Preset | |
| Dell Inspiron 17 7778 | |
| Lenovo ThinkPad T560-20FH002RGE | |
| Acer TravelMate P278-MG-76L2 | |
| Asus VivoBook X556UQ-XO076T | |
| 1366x768 Medium Preset | |
| Dell Inspiron 17 7778 | |
| Lenovo ThinkPad T560-20FH002RGE | |
| Acer TravelMate P278-MG-76L2 | |
| Asus VivoBook X556UQ-XO076T | |
| Crysis 3 | |
| 1366x768 High Preset AA:FX AF:16x | |
| Dell Inspiron 17 7778 | |
| Lenovo ThinkPad T560-20FH002RGE | |
| 1366x768 Medium Preset AF:16x | |
| Dell Inspiron 17 7778 | |
| Lenovo ThinkPad T560-20FH002RGE | |
| baixo | média | alto | ultra | |
| Crysis 3 (2013) | 51.5 | 28.1 | 21.7 | |
| BioShock Infinite (2013) | 107.8 | 60.1 | 53.1 | 19.3 |
| Metro: Last Light (2013) | 55.2 | 42.6 | 25.2 | |
| Battlefield 4 (2013) | 40.6 | 32.4 | 14.3 | |
| Dirt Rally (2015) | 52.4 | 30.7 | ||
| The Witcher 3 (2015) | 36.9 | 21.7 | 11.2 | |
| FIFA 16 (2015) | 45.8 | |||
| Anno 2205 (2015) | 39.4 | 27 | 13.2 | |
| Fallout 4 (2015) | 37.1 | 25.2 | 13.9 | |
| Star Wars Battlefront (2015) | 40.1 | 29.6 | 16.5 | |
| Assassin's Creed Syndicate (2015) | 20.7 | 20.1 | 11.1 | |
| Rainbow Six Siege (2015) | 79.1 | 40.4 | 22.5 | |
| Just Cause 3 (2015) | 31.9 | 25.7 | 13.4 | |
| Rise of the Tomb Raider (2016) | 37.7 | 22.3 | 13.1 | |
| Far Cry Primal (2016) | 32 | 14 | 14 | |
| The Division (2016) | 40.2 | 20.7 | 8.8 | |
| Hitman 2016 (2016) | 21.7 | 23.4 | ||
| Mirror's Edge Catalyst (2016) | 44 | 19.3 | 8.3 |
Barulho
| Ocioso |
| 32.1 / 32.1 / 34 dB |
| Carga |
| 40.3 / 42.6 dB |
 | ||
30 dB silencioso 40 dB(A) audível 50 dB(A) ruidosamente alto |
||
min: | ||
(±) The maximum temperature on the upper side is 44.7 °C / 112 F, compared to the average of 36.9 °C / 98 F, ranging from 21.1 to 71 °C for the class Multimedia.
(-) The bottom heats up to a maximum of 45.5 °C / 114 F, compared to the average of 39.1 °C / 102 F
(+) In idle usage, the average temperature for the upper side is 29.9 °C / 86 F, compared to the device average of 31.2 °C / 88 F.
(+) The palmrests and touchpad are reaching skin temperature as a maximum (33.5 °C / 92.3 F) and are therefore not hot.
(-) The average temperature of the palmrest area of similar devices was 28.8 °C / 83.8 F (-4.7 °C / -8.5 F).
Dell Inspiron 17 7778 audio analysis
(±) | speaker loudness is average but good (74 dB)
Bass 100 - 315 Hz
(±) | reduced bass - on average 7.5% lower than median
(+) | bass is linear (6.4% delta to prev. frequency)
Mids 400 - 2000 Hz
(+) | balanced mids - only 4.9% away from median
(+) | mids are linear (6.6% delta to prev. frequency)
Highs 2 - 16 kHz
(+) | balanced highs - only 1.7% away from median
(+) | highs are linear (4.5% delta to prev. frequency)
Overall 100 - 16.000 Hz
(+) | overall sound is linear (12.5% difference to median)
Compared to same class
» 16% of all tested devices in this class were better, 3% similar, 80% worse
» The best had a delta of 5%, average was 18%, worst was 45%
Compared to all devices tested
» 8% of all tested devices were better, 2% similar, 90% worse
» The best had a delta of 4%, average was 25%, worst was 134%
| desligado | |
| Ocioso | |
| Carga |
|
| Dell Inspiron 17 7778 6500U, GeForce 940MX, Liteonit CV3-CE512, IPS, 1920x1080, 17.30 | HP Spectre x360 15-ap012dx 6200U, HD Graphics 520, Sandisk X300 SD7SN6S-256G-1006, IPS, 3840x2160, 15.60 | Dell Inspiron 15 5568 6500U, HD Graphics 520, Toshiba THNSNK256GCS8, IPS, 1920x1080, 15.60 | HP Envy 15-w103ng x360 6200U, GeForce 930M, Samsung SSD PM851 256 GB MZNTE256HMHP, IPS, 1920x1080, 15.60 | Acer TravelMate P278-MG-76L2 6500U, GeForce 940M, Lite-On CV1-8B256, TN LED, 1920x1080, 17.30 | |
|---|---|---|---|---|---|
| Power Consumption | -0% | 31% | 24% | -13% | |
| Idle Minimum * | 5.6 | 6.5 -16% | 4.34 22% | 4.15 26% | 5.8 -4% |
| Idle Average * | 11.2 | 13.3 -19% | 7.5 33% | 8.2 27% | 11.6 -4% |
| Idle Maximum * | 11.9 | 15.1 -27% | 8.4 29% | 8.2 31% | 13.6 -14% |
| Load Average * | 46 | 30.8 33% | 30.4 34% | 34.6 25% | 51 -11% |
| Load Maximum * | 53 | 38.5 27% | 32.5 39% | 48 9% | 69 -30% |
* ... smaller is better
| Dell Inspiron 17 7778 6500U, GeForce 940MX, 56 Wh | HP Spectre x360 15-ap012dx 6200U, HD Graphics 520, 65 Wh | Dell Inspiron 15 5568 6500U, HD Graphics 520, 42 Wh | HP Envy 15-w103ng x360 6200U, GeForce 930M, 48 Wh | Acer TravelMate P278-MG-76L2 6500U, GeForce 940M, 37 Wh | |
|---|---|---|---|---|---|
| Battery Runtime | -8% | -33% | -20% | -24% | |
| Reader / Idle | 811 | 705 -13% | 449 -45% | 601 -26% | |
| WiFi v1.3 | 495 | 431 -13% | 299 -40% | 398 -20% | 297 -40% |
| Load | 110 | 113 3% | 93 -15% | 104 -5% | |
| H.264 | 298 | 288 |
Pro
Contra
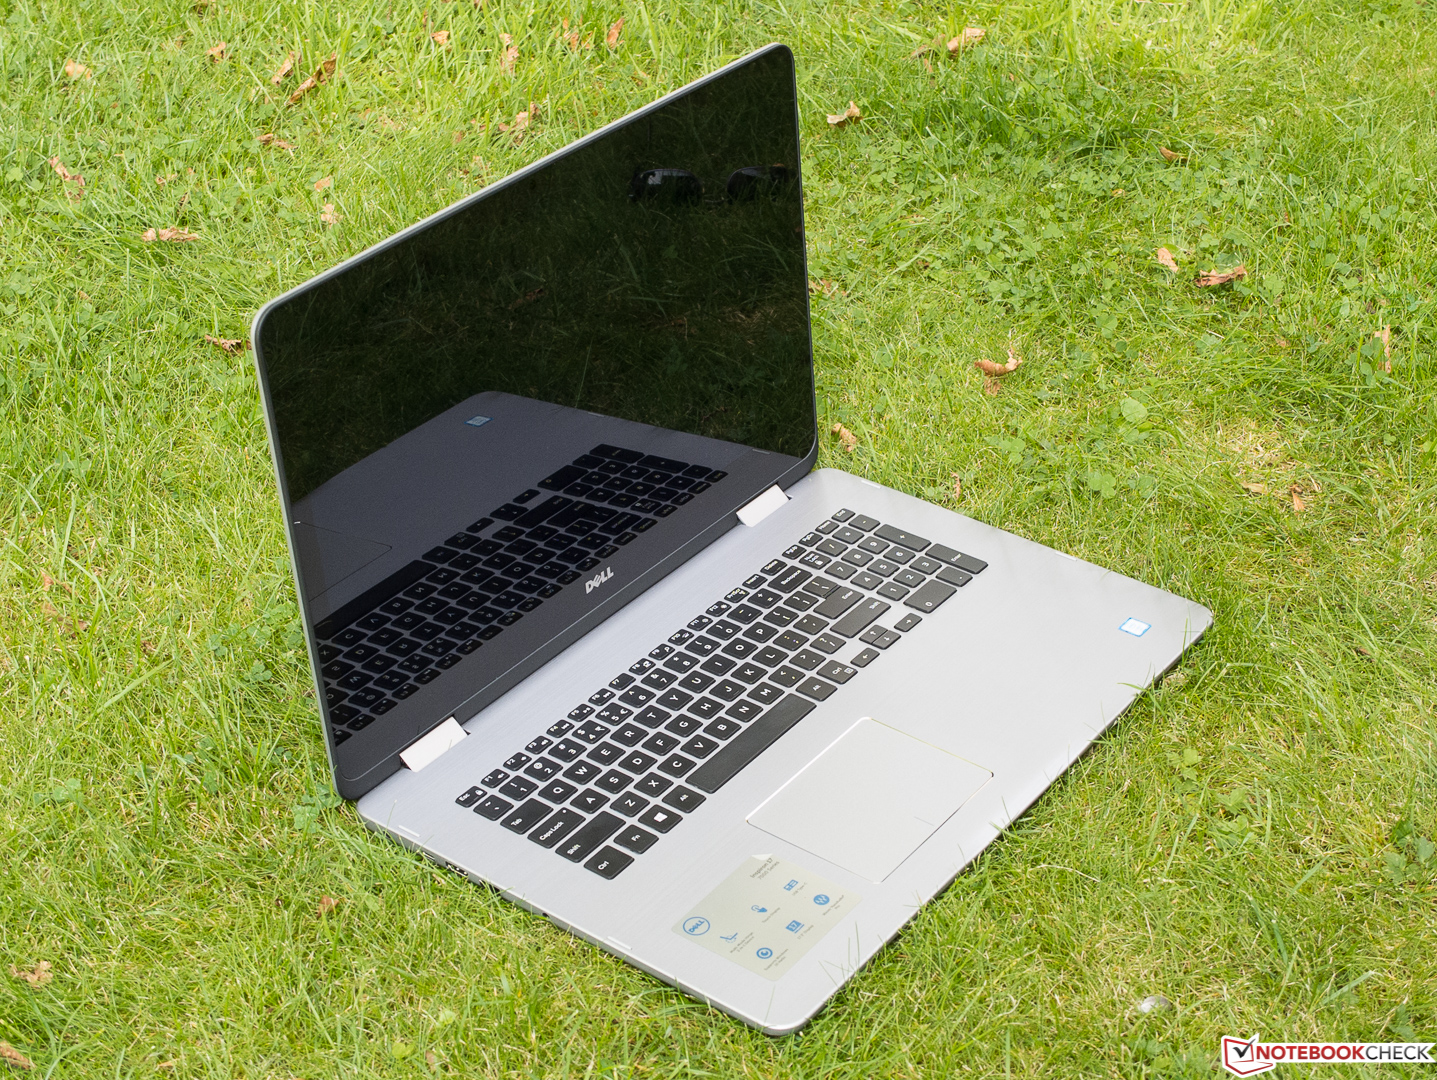
O novo Inspiron 17 7778 2-em-1 da Dell, sem dúvida é um conversível um pouco exótico, cujos aspectos de mobilidade não serão tão importantes como nos conversíveis menores, devido unicamente ao seu tamanho e peso. Mas isso não é uma falha, dado que os modos adicionais típicos de um conversível são basicamente um bônus em um aparelho que pode ser utilizado perfeitamente como um portátil multimídia tradicional e inclusive permite jogar ocasionalmente, graças à GeForce 940MX. A carcaça é absolutamente convincente, e a tela também. O sistema normalmente roda muito de forma muito silenciosa. Muita duração sem a necessidade de uma tomada, agradará os usuários se estiverem de viagem com o 7778.
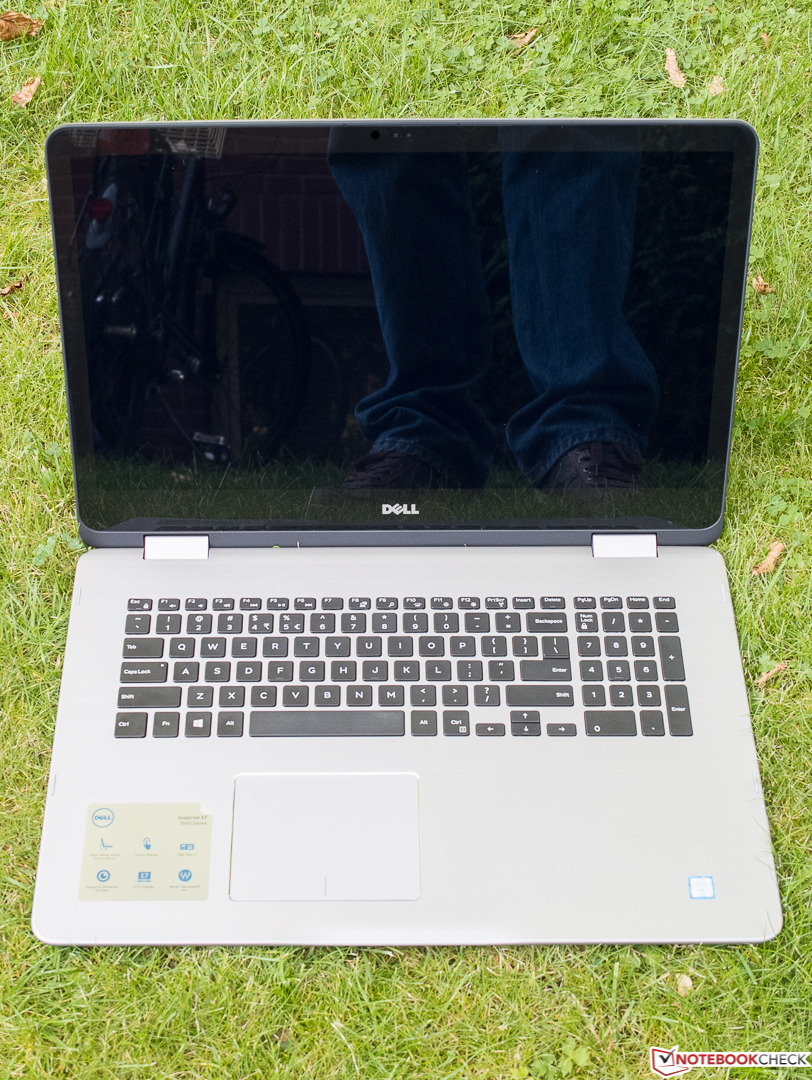
Além das dobradiças, que são irrelevantes em alguns modos, temos que criticar o teclado não ideal que provavelmente não satisfará os escritores mais prolíficos. A placa de vídeo que, às vezes, tende a se afogar, não é tão importante. O modelo de teste também tem que adicionar a tela táctil que não pode ser utilizada de forma ideal com dedos húmidos, se isso for evitável (via um acabamento?).
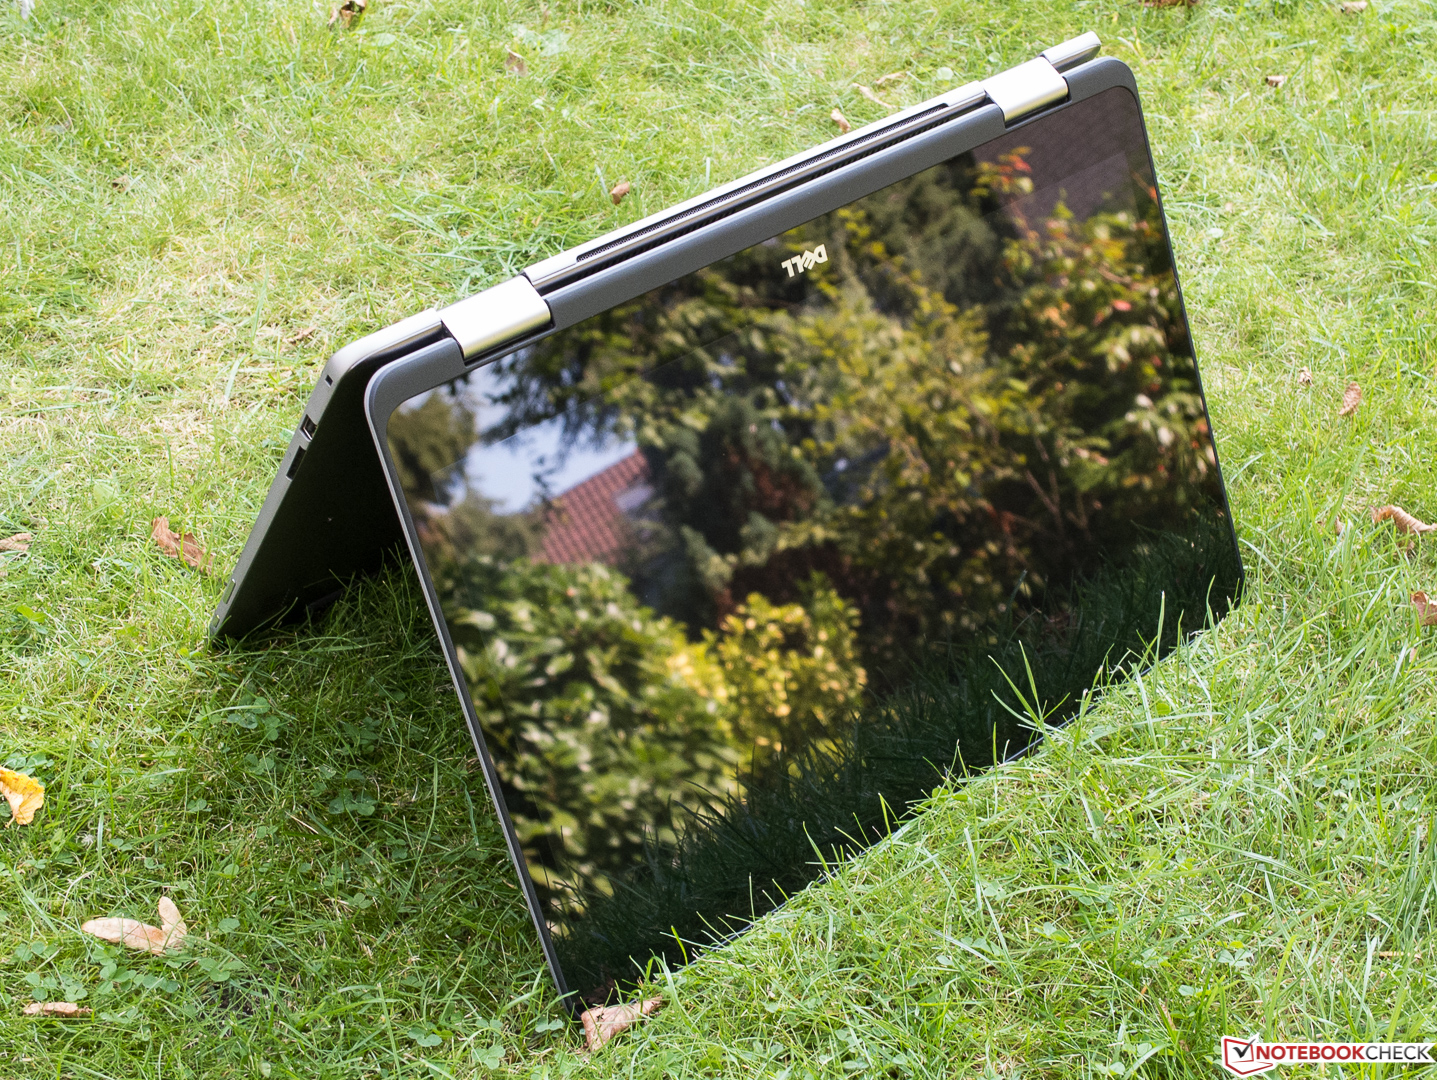
No geral, o Dell Inspiron 17 7778 é um conversível enorme bem concebido, flexível e elegante que tem apenas alguns compromissos para os fanáticos do uso híbrido.
Dell Inspiron 17 7778
-
09/09/2016 v5.1(old)
Sven Kloevekorn