 Deutsch
 English
 Español
 Français
 Italiano
 Nederlands
 Polski
 Português
 Русский
 Türkçe
 Svenska
 Chinese
 Magyar
Breve Análise do Conversível HP Spectre x360 13 w023dx


| Networking | |
| iperf Server (receive) TCP 1 m 512KB | |
| MSI GT72VR 6RD-063US | |
| HP Spectre x360 13-w023dx | |
| HP 250 G5 Y1V08UT | |
| iperf Client (transmit) TCP 1 m 512KB | |
| MSI GT72VR 6RD-063US | |
| HP Spectre x360 13-w023dx | |
| HP 250 G5 Y1V08UT | |
| |||||||||||||||||||||||||
iluminação: 90 %
iluminação com acumulador: 334.6 cd/m²
Contraste: 996:1 (Preto: 0.336 cd/m²)
ΔE Color 6.21 | 0.5-29.43 Ø5
ΔE Greyscale 7.71 | 0.57-98 Ø5.3
90% sRGB (Argyll 1.6.3 3D)
58.6% AdobeRGB 1998 (Argyll 1.6.3 3D)
65.8% AdobeRGB 1998 (Argyll 2.2.0 3D)
90.4% sRGB (Argyll 2.2.0 3D)
65.4% Display P3 (Argyll 2.2.0 3D)
Gamma: 2.36
| HP Spectre x360 13-w023dx Chi Mei CMN1367, IPS, 13.30, 1920x1080 | Dell XPS 13 9360 QHD+ i5 Sharp SHP144A, , 13.30, 3200x1800 | HP Spectre 13 IPS UWVA, 13.30, 1920x1080 | Lenovo Yoga 900-13ISK 80MK IPS, 13.30, 3200x1800 | Asus Zenbook UX360UA-C4159T AU Optronics AOU272D / B133HAN02.7, IPS, 13.30, 1920x1080 | Acer Aspire S 13 S5-371-71QZ AUO B133HAN04.1, IPS, 13.30, 1920x1080 | |
|---|---|---|---|---|---|---|
| Display | 0% | 3% | -2% | 1% | ||
| Display P3 Coverage | 65.4 | 64.6 -1% | 65.6 0% | 63.2 -3% | 64.8 -1% | |
| sRGB Coverage | 90.4 | 91.6 1% | 94.7 5% | 88.7 -2% | 93.1 3% | |
| AdobeRGB 1998 Coverage | 65.8 | 66.5 1% | 67.5 3% | 64.9 -1% | 66 0% | |
| Response Times | -2% | -36% | 2% | 23% | -29% | |
| Response Time Grey 50% / Grey 80% * | 33.2 ? | 31 ? 7% | 50.8 ? -53% | 38.8 ? -17% | 29 ? 13% | 50 ? -51% |
| Response Time Black / White * | 28 ? | 31.2 ? -11% | 33.2 ? -19% | 22.4 ? 20% | 19 ? 32% | 29.6 ? -6% |
| PWM Frequency | 1316 | 50 ? | ||||
| Screen | 22% | 27% | -11% | 10% | 10% | |
| Brightness middle | 334.6 | 444 33% | 300.5 -10% | 319.8 -4% | 344 3% | 375 12% |
| Brightness | 319 | 393 23% | 305 -4% | 302 -5% | 326 2% | 358 12% |
| Brightness Distribution | 90 | 82 -9% | 76 -16% | 88 -2% | 86 -4% | 87 -3% |
| Black Level * | 0.336 | 0.33 2% | 0.184 45% | 0.835 -149% | 0.27 20% | 0.39 -16% |
| Contrast | 996 | 1345 35% | 1633 64% | 383 -62% | 1274 28% | 962 -3% |
| Colorchecker dE 2000 * | 6.21 | 4 36% | 2.64 57% | 2.68 57% | 5.53 11% | 4.6 26% |
| Colorchecker dE 2000 max. * | 12 | 7.7 36% | 5.06 58% | 10.01 17% | 8.8 27% | |
| Greyscale dE 2000 * | 7.71 | 2.83 63% | 2.8 64% | 2.35 70% | 6.67 13% | 4 48% |
| Gamma | 2.36 93% | 2.05 107% | 2.16 102% | 2.09 105% | 2.43 91% | 2.34 94% |
| CCT | 6458 101% | 6963 93% | 6999 93% | 6975 93% | 7012 93% | 7304 89% |
| Color Space (Percent of AdobeRGB 1998) | 58.6 | 59.3 1% | 60.9 4% | 57 -3% | 60 2% | 57.9 -1% |
| Color Space (Percent of sRGB) | 90 | 91.4 2% | 94.3 5% | 88 -2% | 93 3% | 88.7 -1% |
| Total Average (Program / Settings) | 7% /
15% | -2% /
14% | -4% /
-7% | 11% /
9% | -10% /
4% |
* ... smaller is better
Display Response Times
| ↔ Response Time Black to White | ||
|---|---|---|
| 28 ms ... rise ↗ and fall ↘ combined | ↗ 5.6 ms rise |  |
| ↘ 22.4 ms fall | ||
| The screen shows relatively slow response rates in our tests and may be too slow for gamers. In comparison, all tested devices range from 0.1 (minimum) to 240 (maximum) ms. » 67 % of all devices are better. This means that the measured response time is worse than the average of all tested devices (21.5 ms). | ||
| ↔ Response Time 50% Grey to 80% Grey | ||
| 33.2 ms ... rise ↗ and fall ↘ combined | ↗ 16 ms rise |  |
| ↘ 17.2 ms fall | ||
| The screen shows slow response rates in our tests and will be unsatisfactory for gamers. In comparison, all tested devices range from 0.2 (minimum) to 636 (maximum) ms. » 39 % of all devices are better. This means that the measured response time is similar to the average of all tested devices (33.7 ms). | ||
Screen Flickering / PWM (Pulse-Width Modulation)
| Screen flickering / PWM not detected |  | ||
In comparison: 53 % of all tested devices do not use PWM to dim the display. If PWM was detected, an average of 17924 (minimum: 5 - maximum: 3846000) Hz was measured. | |||
| Cinebench R15 | |
| CPU Single 64Bit | |
| MSI CX72-7QL | |
| Toshiba Satellite S70-B-106 | |
| Toshiba Portege Z30t-B1320W10 | |
| Asus Zenbook UX510UW-CN044T | |
| Lenovo ThinkPad T440s 20AQ006BGE | |
| HP Spectre x360 13-w023dx | |
| Lenovo Ideapad 510-15ISK | |
| HP 250 G4 T6P08ES | |
| Lenovo IdeaPad Z40-59422614 | |
| CPU Multi 64Bit | |
| Toshiba Satellite S70-B-106 | |
| MSI CX72-7QL | |
| Asus Zenbook UX510UW-CN044T | |
| HP Spectre x360 13-w023dx | |
| Toshiba Portege Z30t-B1320W10 | |
| Lenovo Ideapad 510-15ISK | |
| Lenovo ThinkPad T440s 20AQ006BGE | |
| HP 250 G4 T6P08ES | |
| Lenovo IdeaPad Z40-59422614 | |
| Cinebench R11.5 | |
| CPU Single 64Bit | |
| MSI CX72-7QL | |
| HP Spectre x360 13-w023dx | |
| Toshiba Portege Z30t-B1320W10 | |
| Toshiba Satellite S70-B-106 | |
| Asus Zenbook UX510UW-CN044T | |
| Lenovo ThinkPad T440s 20AQ006BGE | |
| HP 250 G4 T6P08ES | |
| Lenovo IdeaPad Z40-59422614 | |
| CPU Multi 64Bit | |
| Toshiba Satellite S70-B-106 | |
| MSI CX72-7QL | |
| Asus Zenbook UX510UW-CN044T | |
| HP Spectre x360 13-w023dx | |
| Toshiba Portege Z30t-B1320W10 | |
| Lenovo ThinkPad T440s 20AQ006BGE | |
| HP 250 G4 T6P08ES | |
| Lenovo IdeaPad Z40-59422614 | |
| Cinebench R10 | |
| Rendering Multiple CPUs 32Bit | |
| MSI CX72-7QL | |
| HP Spectre x360 13-w023dx | |
| Asus Zenbook UX510UW-CN044T | |
| Toshiba Portege Z30t-B1320W10 | |
| Lenovo ThinkPad T440s 20AQ006BGE | |
| HP 250 G4 T6P08ES | |
| Lenovo IdeaPad Z40-59422614 | |
| Rendering Single 32Bit | |
| MSI CX72-7QL | |
| HP Spectre x360 13-w023dx | |
| Toshiba Portege Z30t-B1320W10 | |
| Asus Zenbook UX510UW-CN044T | |
| Lenovo ThinkPad T440s 20AQ006BGE | |
| HP 250 G4 T6P08ES | |
| Lenovo IdeaPad Z40-59422614 | |
| wPrime 2.10 - 1024m | |
| Lenovo IdeaPad Z40-59422614 | |
| HP Spectre x360 13-w023dx | |
| Toshiba Portege Z30t-B1320W10 | |
| MSI CX72-7QL | |
| Super Pi Mod 1.5 XS 32M - 32M | |
| Lenovo IdeaPad Z40-59422614 | |
| Toshiba Portege Z30t-B1320W10 | |
| HP Spectre x360 13-w023dx | |
| MSI CX72-7QL | |
* ... smaller is better
| PCMark 8 | |
| Home Score Accelerated v2 | |
| HP Spectre x360 13-w023dx | |
| HP Spectre 13 | |
| Asus Zenbook UX360UA-C4159T | |
| Lenovo Yoga 900-13ISK 80MK | |
| Dell XPS 13 9360 QHD+ i5 | |
| Work Score Accelerated v2 | |
| HP Spectre x360 13-w023dx | |
| HP Spectre 13 | |
| Asus Zenbook UX360UA-C4159T | |
| Lenovo Yoga 900-13ISK 80MK | |
| Creative Score Accelerated v2 | |
| HP Spectre x360 13-w023dx | |
| HP Spectre 13 | |
| Lenovo Yoga 900-13ISK 80MK | |
| PCMark 8 Home Score Accelerated v2 | 3795 pontos | |
| PCMark 8 Creative Score Accelerated v2 | 4699 pontos | |
| PCMark 8 Work Score Accelerated v2 | 4910 pontos | |
Ajuda | ||
| HP Spectre x360 13-w023dx Samsung PM951 NVMe MZVLV512 | Dell XPS 13 9360 QHD+ i5 Toshiba NVMe THNSN5256GPUK | Lenovo Yoga 900-13ISK 80MK Samsung SSD PM871 MZNLN512HCJH | Asus Zenbook UX360UA-C4159T SK Hynix Canvas SC300 512GB M.2 (HFS512G39MND) | Acer Aspire S 13 S5-371-71QZ LiteOn CV1-8B512 | |
|---|---|---|---|---|---|
| CrystalDiskMark 3.0 | -12% | -38% | -41% | -41% | |
| Read Seq | 1376 | 1168 -15% | 514 -63% | 452.1 -67% | 502 -64% |
| Write Seq | 571 | 329 -42% | 459.5 -20% | 421.3 -26% | 418.9 -27% |
| Read 512 | 679 | 1015 49% | 413.4 -39% | 288.6 -57% | 341.3 -50% |
| Write 512 | 571 | 307 -46% | 424.5 -26% | 310.7 -46% | 389.7 -32% |
| Read 4k | 42.66 | 33 -23% | 36.34 -15% | 28.52 -33% | 29.69 -30% |
| Write 4k | 137.9 | 132 -4% | 100.1 -27% | 72.1 -48% | 86.8 -37% |
| Read 4k QD32 | 535 | 525 -2% | 313.8 -41% | 389.6 -27% | 301.3 -44% |
| Write 4k QD32 | 361.2 | 325 -10% | 96.8 -73% | 285.3 -21% | 211.2 -42% |

| 3DMark | |
| 1280x720 Cloud Gate Standard Graphics | |
| Acer Aspire E5-574-53YZ | |
| MSI CX72-7QL | |
| HP Spectre x360 13-w023dx | |
| Acer TravelMate P257-M-56AX | |
| HP ProBook 640 G2-T9X60ET | |
| HP EliteBook 840 G3 T8X41EA | |
| Toshiba Portege Z30t-B1320W10 | |
| Sony Vaio SVF14N13CXB | |
| 1920x1080 Fire Strike Graphics | |
| MSI CX72-7QL | |
| Acer Aspire E5-574-53YZ | |
| HP Spectre x360 13-w023dx | |
| HP ProBook 640 G2-T9X60ET | |
| HP EliteBook 840 G3 T8X41EA | |
| Toshiba Portege Z30t-B1320W10 | |
| Sony Vaio SVF14N13CXB | |
| 3DMark 11 | |
| 1280x720 Performance GPU | |
| Acer Aspire E5-574-53YZ | |
| MSI CX72-7QL | |
| HP Spectre x360 13-w023dx | |
| HP ProBook 640 G2-T9X60ET | |
| HP EliteBook 840 G3 T8X41EA | |
| Acer TravelMate P257-M-56AX | |
| Toshiba Portege Z30t-B1320W10 | |
| Sony Vaio SVF14N13CXB | |
| 1280x720 Performance Combined | |
| Acer Aspire E5-574-53YZ | |
| MSI CX72-7QL | |
| HP Spectre x360 13-w023dx | |
| Acer TravelMate P257-M-56AX | |
| HP EliteBook 840 G3 T8X41EA | |
| HP ProBook 640 G2-T9X60ET | |
| Toshiba Portege Z30t-B1320W10 | |
| Sony Vaio SVF14N13CXB | |
| 3DMark 11 Performance | 1715 pontos | |
| 3DMark Ice Storm Standard Score | 61863 pontos | |
| 3DMark Cloud Gate Standard Score | 6111 pontos | |
| 3DMark Fire Strike Score | 889 pontos | |
| 3DMark Fire Strike Extreme Score | 395 pontos | |
Ajuda | ||
| BioShock Infinite | |
| 1280x720 Very Low Preset | |
| Acer TravelMate P278-MG-76L2 | |
| Acer Aspire E5-574-53YZ | |
| MSI CX72-7QL | |
| HP Spectre x360 13-w023dx | |
| Lenovo ThinkPad Yoga 12 20DK002EPB | |
| HP ProBook 650 G2 V1A44ET | |
| Samsung ATIV Book 9 2014 (NP930X5J-K02DE) | |
| Fujitsu Lifebook T904 | |
| 1366x768 Medium Preset | |
| Acer TravelMate P278-MG-76L2 | |
| Acer Aspire E5-574-53YZ | |
| MSI CX72-7QL | |
| HP Spectre x360 13-w023dx | |
| Lenovo ThinkPad Yoga 12 20DK002EPB | |
| HP ProBook 650 G2 V1A44ET | |
| Samsung ATIV Book 9 2014 (NP930X5J-K02DE) | |
| Fujitsu Lifebook T904 | |
| 1366x768 High Preset | |
| Acer TravelMate P278-MG-76L2 | |
| Acer Aspire E5-574-53YZ | |
| MSI CX72-7QL | |
| HP Spectre x360 13-w023dx | |
| Lenovo ThinkPad Yoga 12 20DK002EPB | |
| HP ProBook 650 G2 V1A44ET | |
| baixo | média | alto | ultra | |
| BioShock Infinite (2013) | 53.5 | 30.6 | 26.1 | 8.3 |
| Metro: Last Light (2013) | 27.9 | 23.6 | 15 | 7.2 |
| Rise of the Tomb Raider (2016) | 20.8 | 12.6 | ||
| Overwatch (2016) | 48 | 34.1 | 19.9 |
Barulho
| Ocioso |
| 29.1 / 29.1 / 31.2 dB |
| Carga |
| 37.3 / 39.6 dB |
 | ||
30 dB silencioso 40 dB(A) audível 50 dB(A) ruidosamente alto |
||
min: | ||
| HP Spectre x360 13-w023dx HD Graphics 620, i7-7500U, Samsung PM951 NVMe MZVLV512 | Dell XPS 13 9360 QHD+ i5 HD Graphics 620, i5-7200U, Toshiba NVMe THNSN5256GPUK | HP Spectre 13 HD Graphics 520, 6500U, Samsung PM951 NVMe MZVLV256 | Lenovo Yoga 900-13ISK 80MK HD Graphics 520, 6500U, Samsung SSD PM871 MZNLN512HCJH | Asus Zenbook UX360UA-C4159T HD Graphics 520, 6500U, SK Hynix Canvas SC300 512GB M.2 (HFS512G39MND) | Acer Aspire S 13 S5-371-71QZ HD Graphics 520, 6500U, LiteOn CV1-8B512 | |
|---|---|---|---|---|---|---|
| Noise | 0% | -2% | 3% | -2% | -1% | |
| off / environment * | 29.1 | 30.3 -4% | 28.5 2% | 30.5 -5% | 31.2 -7% | |
| Idle Minimum * | 29.1 | 30.6 -5% | 28.5 2% | 29.7 -2% | 30.5 -5% | 31.2 -7% |
| Idle Average * | 29.1 | 30.6 -5% | 30.9 -6% | 29.8 -2% | 32.1 -10% | 31.2 -7% |
| Idle Maximum * | 31.2 | 32.2 -3% | 31.6 -1% | 30 4% | 32.3 -4% | 31.5 -1% |
| Load Average * | 37.3 | 32.2 14% | 38.8 -4% | 32 14% | 36.1 3% | 35.7 4% |
| Load Maximum * | 39.6 | 38.5 3% | 41.4 -5% | 38.5 3% | 36.1 9% | 35.8 10% |
* ... smaller is better
(-) The maximum temperature on the upper side is 48.2 °C / 119 F, compared to the average of 35.3 °C / 96 F, ranging from 19.6 to 55.7 °C for the class Convertible.
(-) The bottom heats up to a maximum of 46 °C / 115 F, compared to the average of 36.8 °C / 98 F
(+) In idle usage, the average temperature for the upper side is 22.4 °C / 72 F, compared to the device average of 30.2 °C / 86 F.
(+) The palmrests and touchpad are reaching skin temperature as a maximum (33 °C / 91.4 F) and are therefore not hot.
(-) The average temperature of the palmrest area of similar devices was 28.1 °C / 82.6 F (-4.9 °C / -8.8 F).
HP Spectre x360 13-w023dx audio analysis
(±) | speaker loudness is average but good (76.2 dB)
Bass 100 - 315 Hz
(-) | nearly no bass - on average 17% lower than median
(±) | linearity of bass is average (12.7% delta to prev. frequency)
Mids 400 - 2000 Hz
(+) | balanced mids - only 3.7% away from median
(+) | mids are linear (6.3% delta to prev. frequency)
Highs 2 - 16 kHz
(+) | balanced highs - only 2.4% away from median
(±) | linearity of highs is average (7.2% delta to prev. frequency)
Overall 100 - 16.000 Hz
(±) | linearity of overall sound is average (21.9% difference to median)
Compared to same class
» 58% of all tested devices in this class were better, 8% similar, 34% worse
» The best had a delta of 6%, average was 21%, worst was 57%
Compared to all devices tested
» 58% of all tested devices were better, 7% similar, 35% worse
» The best had a delta of 4%, average was 25%, worst was 134%
Apple MacBook 12 (Early 2016) 1.1 GHz audio analysis
(+) | speakers can play relatively loud (83.6 dB)
Bass 100 - 315 Hz
(±) | reduced bass - on average 11.3% lower than median
(±) | linearity of bass is average (14.2% delta to prev. frequency)
Mids 400 - 2000 Hz
(+) | balanced mids - only 2.4% away from median
(+) | mids are linear (5.5% delta to prev. frequency)
Highs 2 - 16 kHz
(+) | balanced highs - only 2% away from median
(+) | highs are linear (4.5% delta to prev. frequency)
Overall 100 - 16.000 Hz
(+) | overall sound is linear (10.2% difference to median)
Compared to same class
» 5% of all tested devices in this class were better, 2% similar, 93% worse
» The best had a delta of 5%, average was 19%, worst was 53%
Compared to all devices tested
» 3% of all tested devices were better, 1% similar, 96% worse
» The best had a delta of 4%, average was 25%, worst was 134%
| desligado | |
| Ocioso | |
| Carga |
|
| HP Spectre x360 13-w023dx i7-7500U, HD Graphics 620, Samsung PM951 NVMe MZVLV512, IPS, 1920x1080, 13.30 | Dell XPS 13 9360 QHD+ i5 i5-7200U, HD Graphics 620, Toshiba NVMe THNSN5256GPUK, , 3200x1800, 13.30 | HP Spectre 13 6500U, HD Graphics 520, Samsung PM951 NVMe MZVLV256, IPS UWVA, 1920x1080, 13.30 | Asus Zenbook UX360UA-C4159T 6500U, HD Graphics 520, SK Hynix Canvas SC300 512GB M.2 (HFS512G39MND), IPS, 1920x1080, 13.30 | Acer Aspire S 13 S5-371-71QZ 6500U, HD Graphics 520, LiteOn CV1-8B512, IPS, 1920x1080, 13.30 | |
|---|---|---|---|---|---|
| Power Consumption | 13% | -37% | -7% | 6% | |
| Idle Minimum * | 5.5 | 3.7 33% | 8.6 -56% | 6.9 -25% | 4.1 25% |
| Idle Average * | 6.7 | 6.1 9% | 11 -64% | 7.9 -18% | 6.7 -0% |
| Idle Maximum * | 7.1 | 6.5 8% | 11.3 -59% | 8.3 -17% | 7.4 -4% |
| Load Average * | 33.1 | 29.5 11% | 33.8 -2% | 30.1 9% | 32.4 2% |
| Load Maximum * | 35.2 | 33 6% | 36.2 -3% | 29.6 16% | 32.4 8% |
* ... smaller is better
| HP Spectre x360 13-w023dx i7-7500U, HD Graphics 620, 57.8 Wh | Dell XPS 13 9360 QHD+ i5 i5-7200U, HD Graphics 620, 60 Wh | HP Spectre 13 6500U, HD Graphics 520, 38 Wh | Lenovo Yoga 900-13ISK 80MK 6500U, HD Graphics 520, 66 Wh | Asus Zenbook UX360UA-C4159T 6500U, HD Graphics 520, 57 Wh | Acer Aspire S 13 S5-371-71QZ 6500U, HD Graphics 520, 45 Wh | |
|---|---|---|---|---|---|---|
| Battery Runtime | 4% | -39% | -18% | 13% | -17% | |
| Reader / Idle | 1233 | 715 -42% | 844 -32% | 1165 -6% | 1028 -17% | |
| WiFi v1.3 | 558 | 526 -6% | 338 -39% | 403 -28% | 581 4% | 472 -15% |
| Load | 121 | 137 13% | 78 -36% | 128 6% | 169 40% | 99 -18% |
Pro
Contra
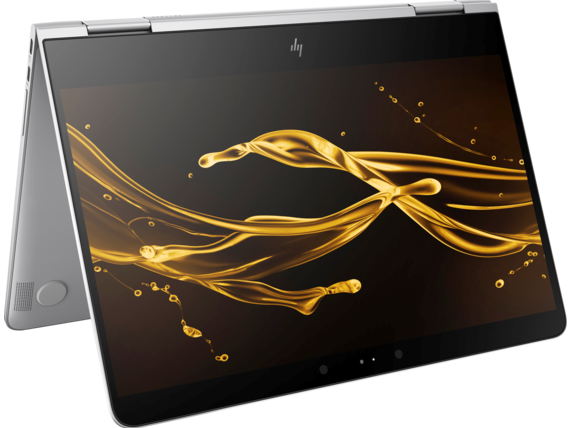
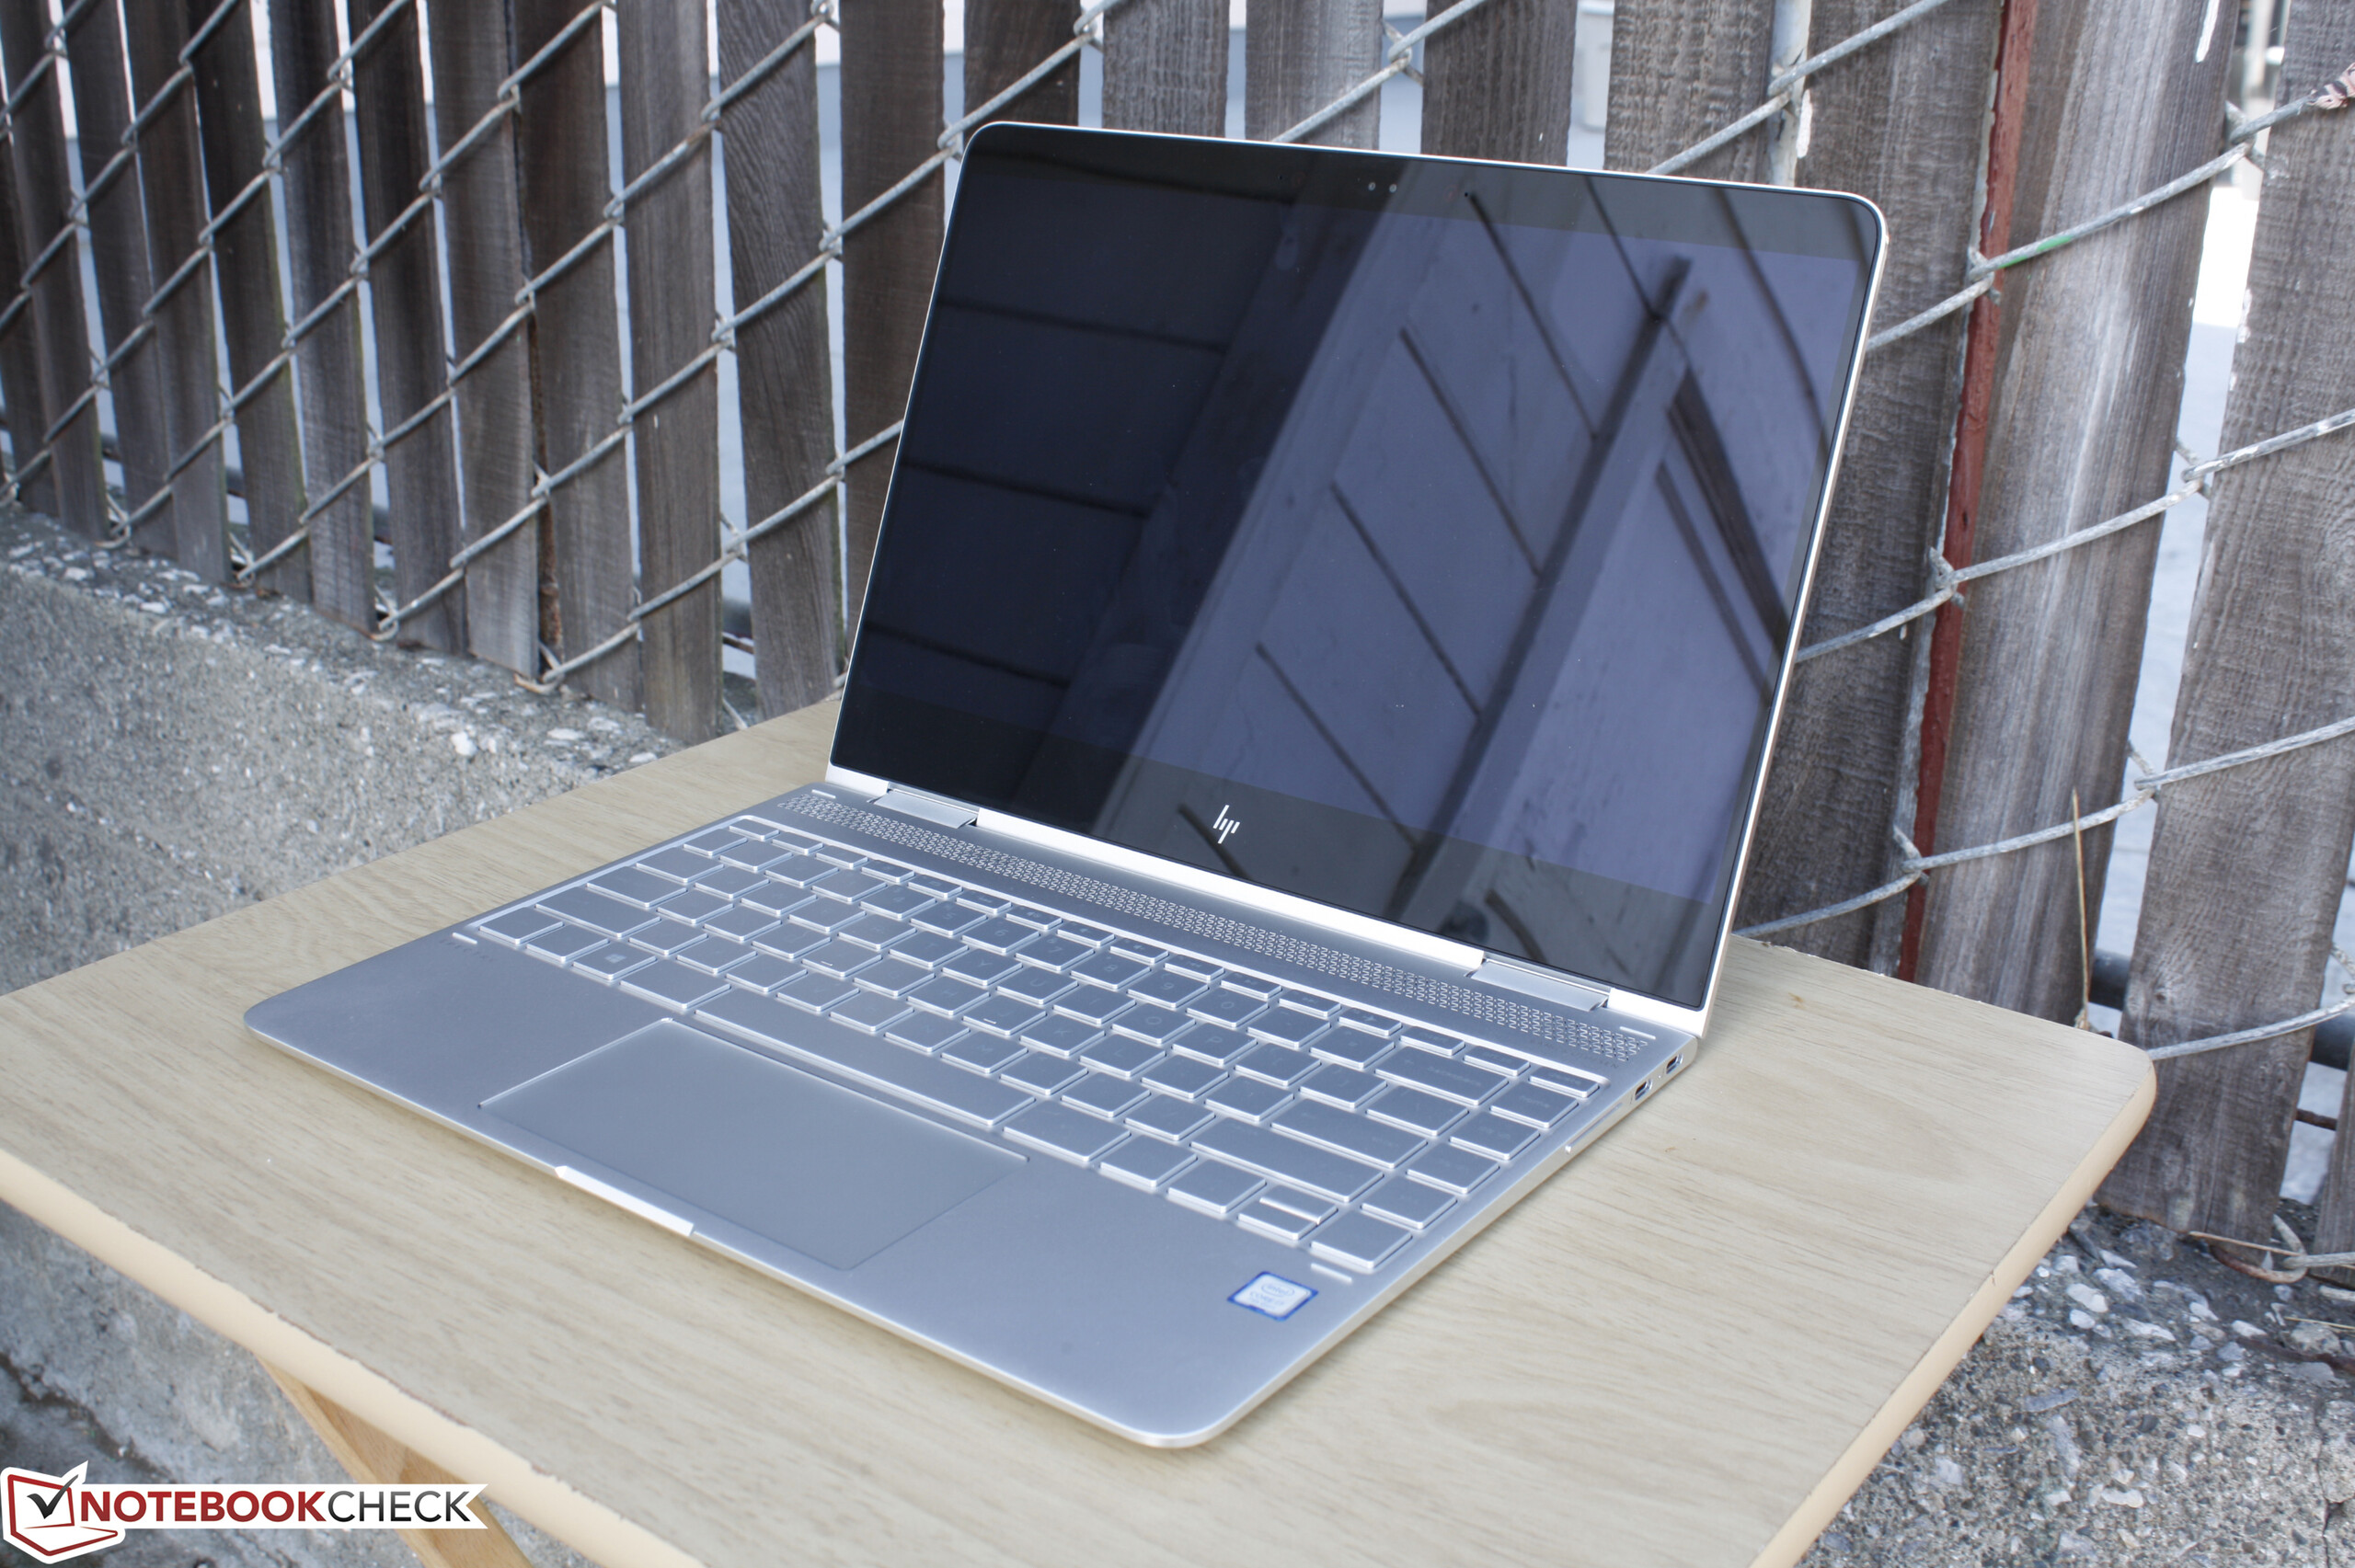
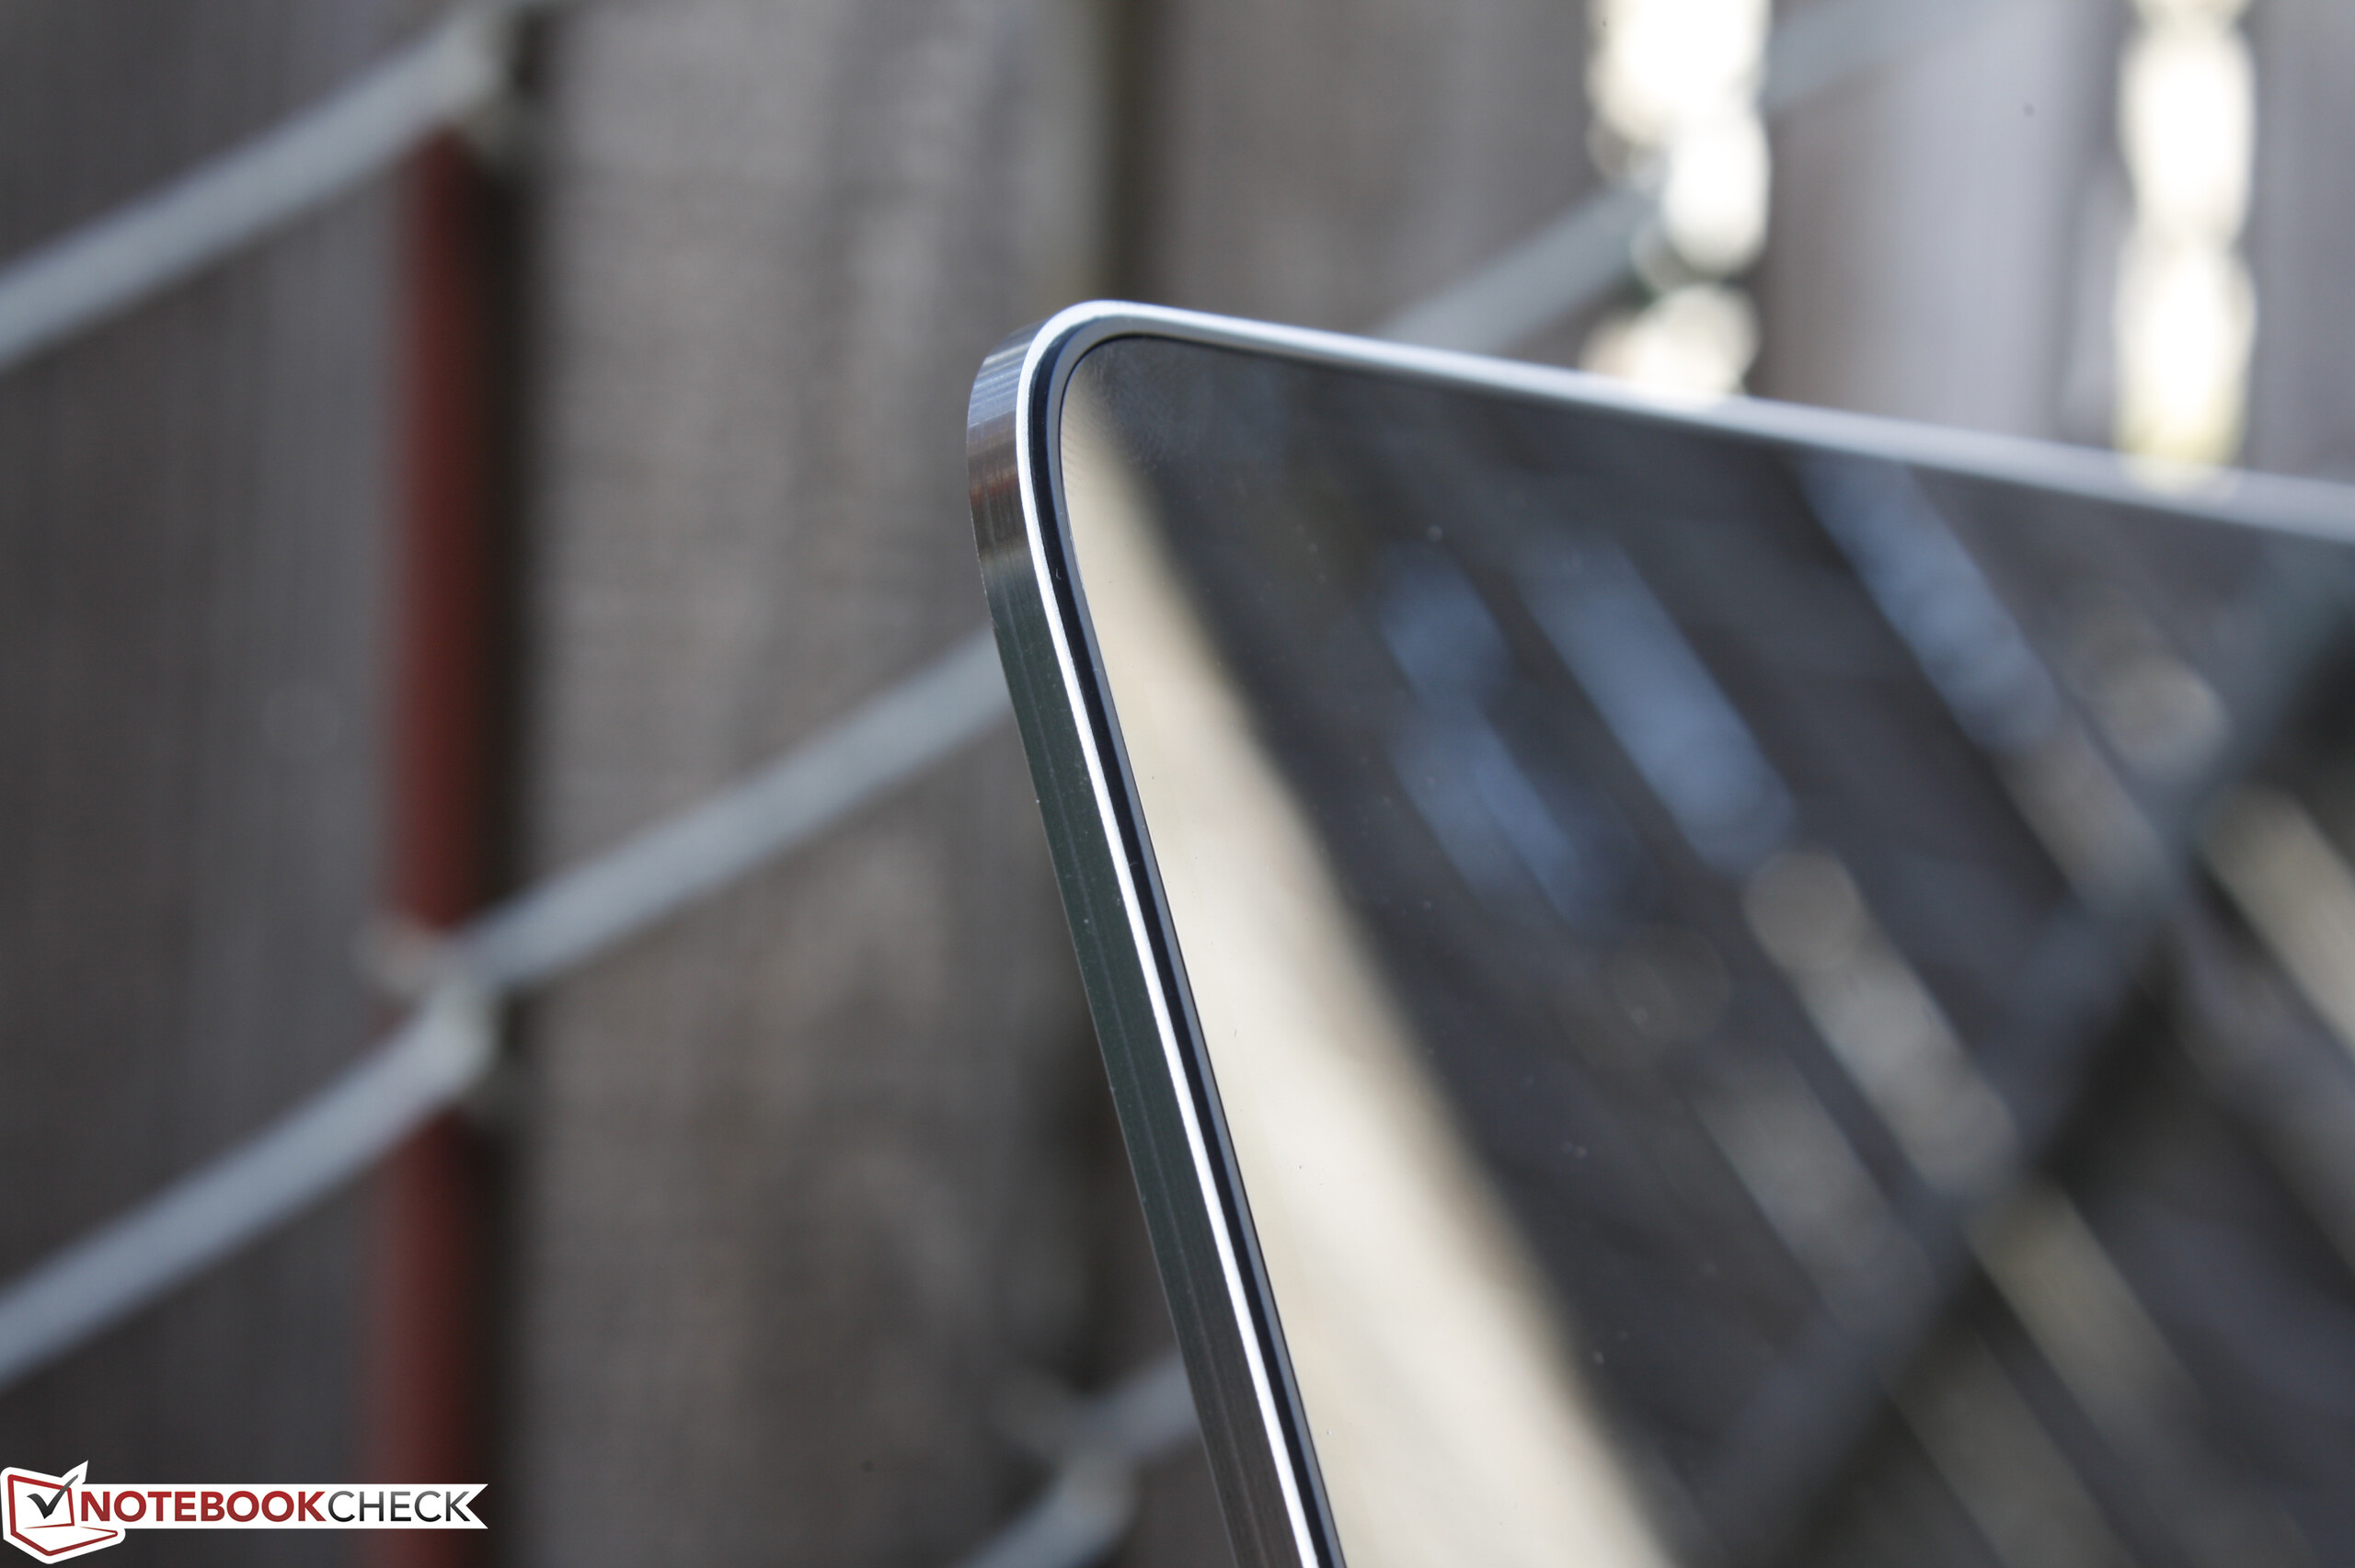
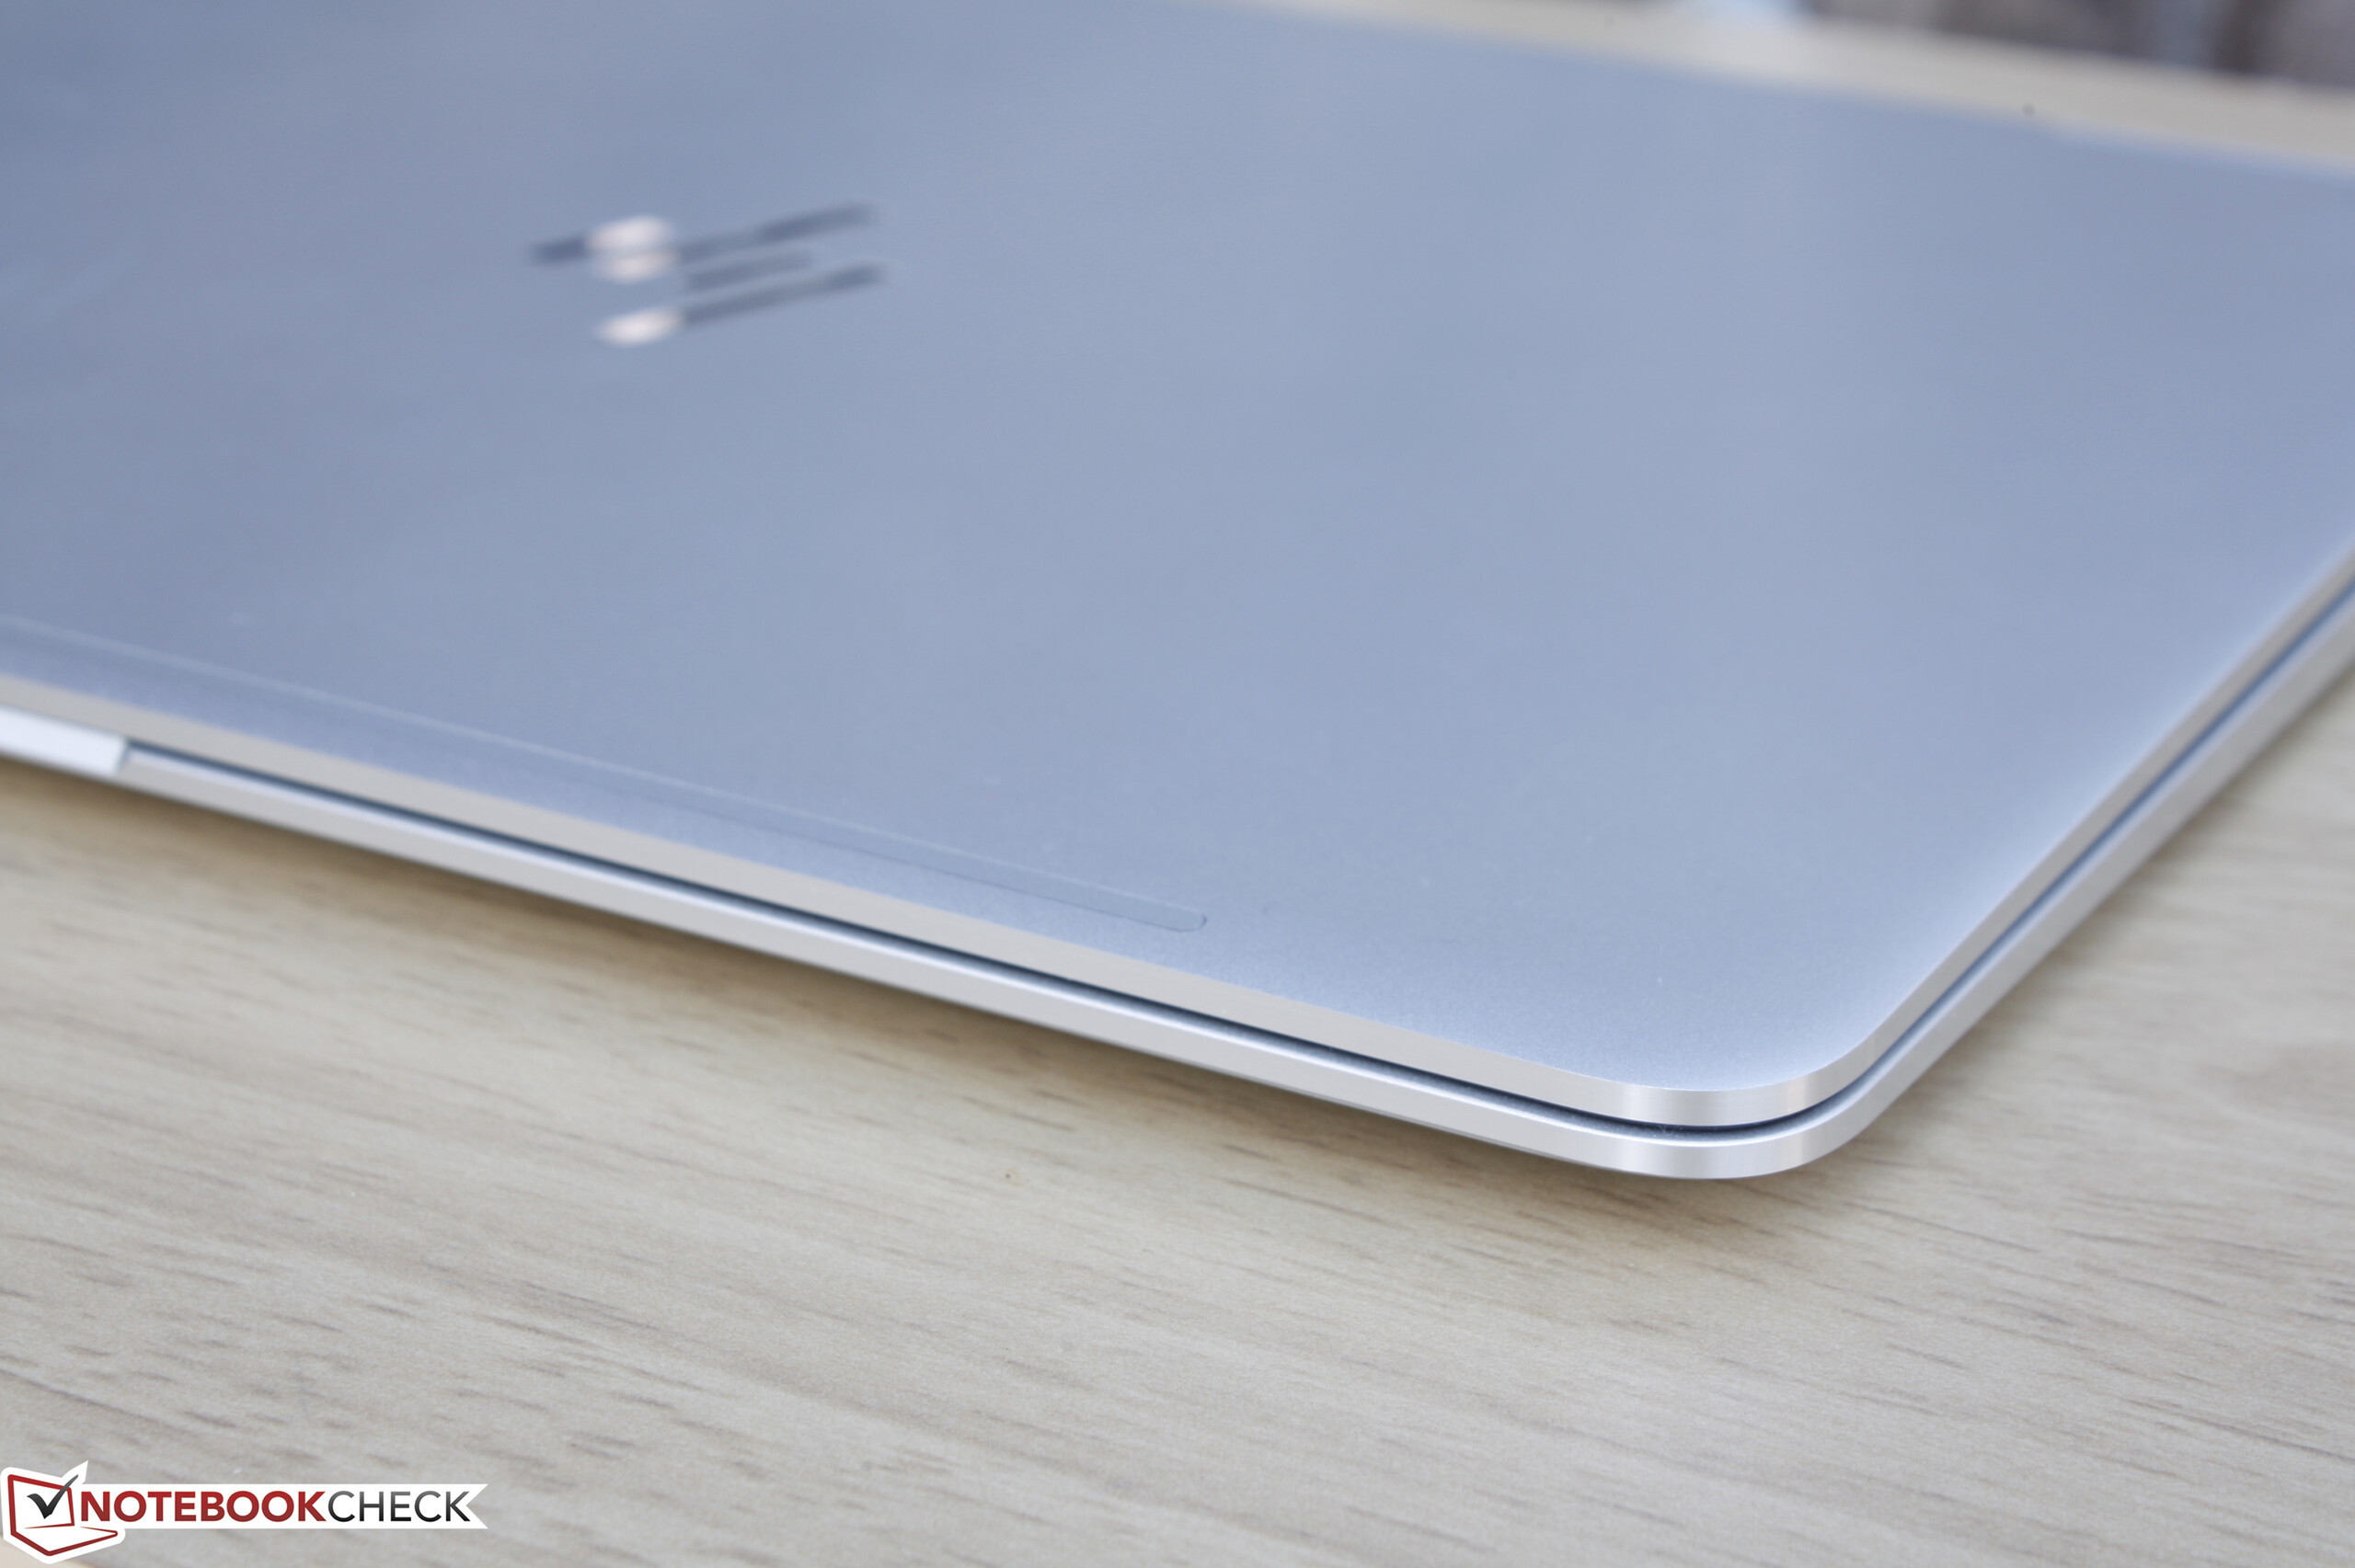
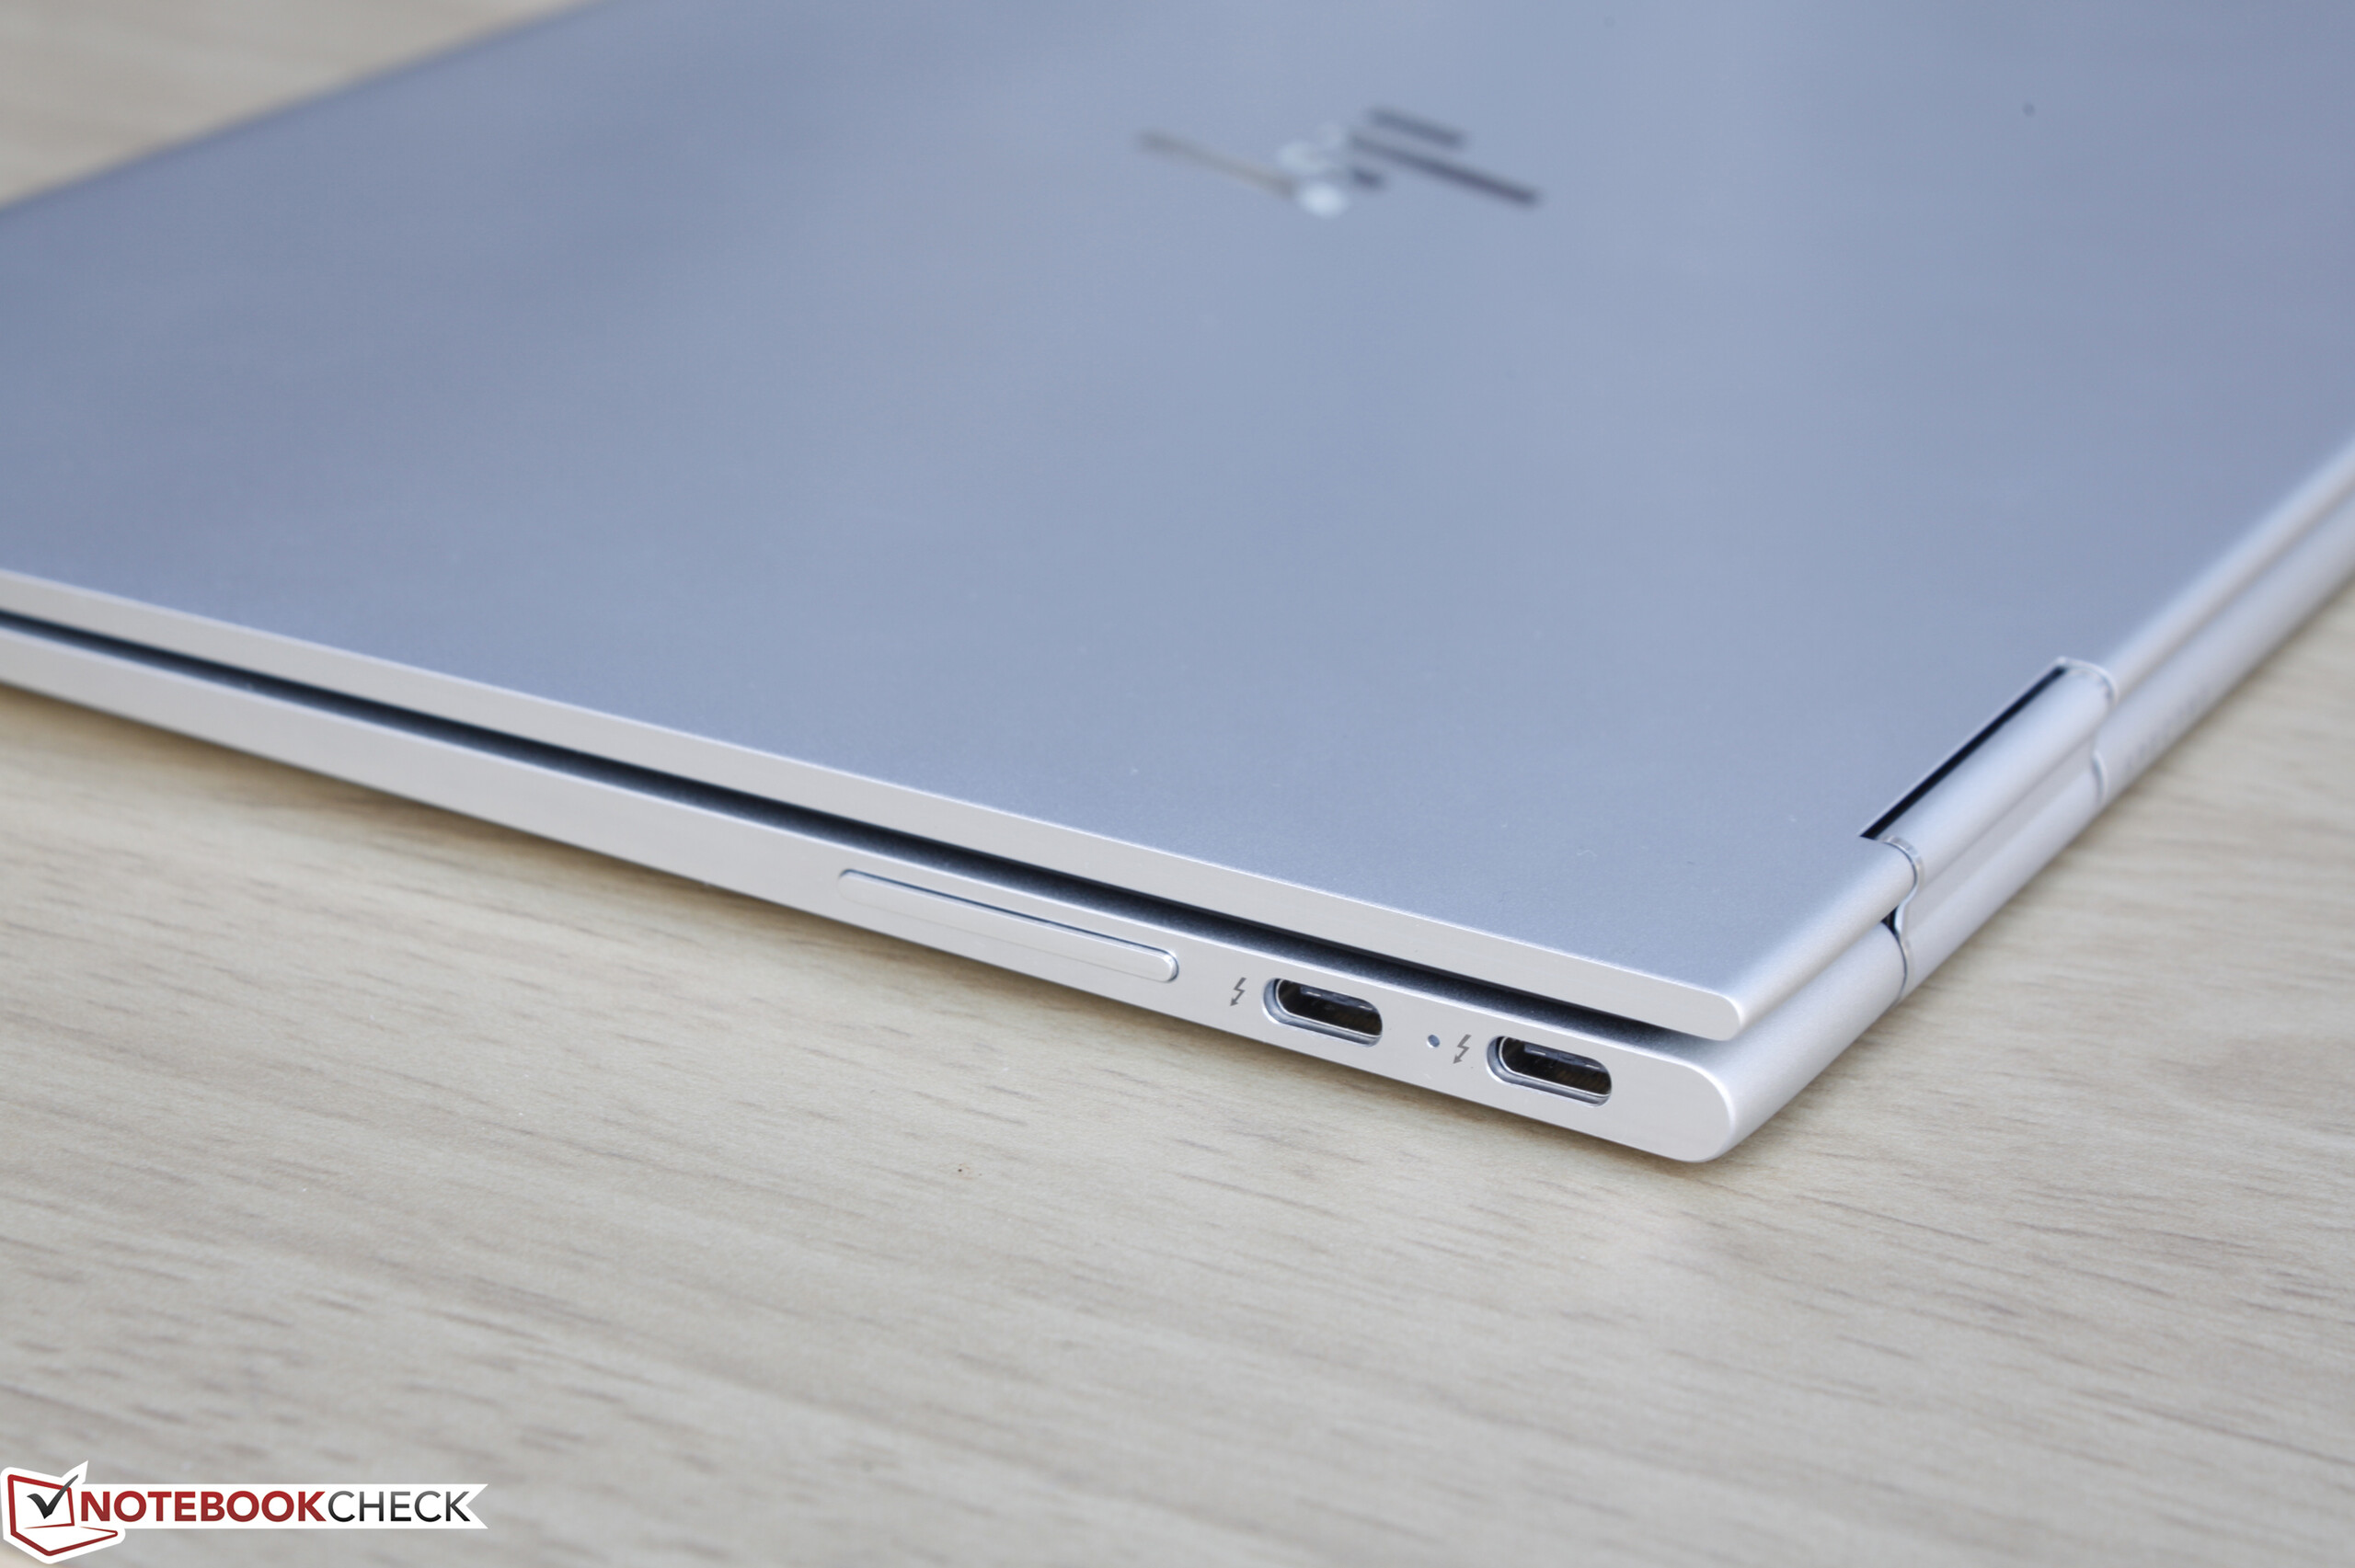
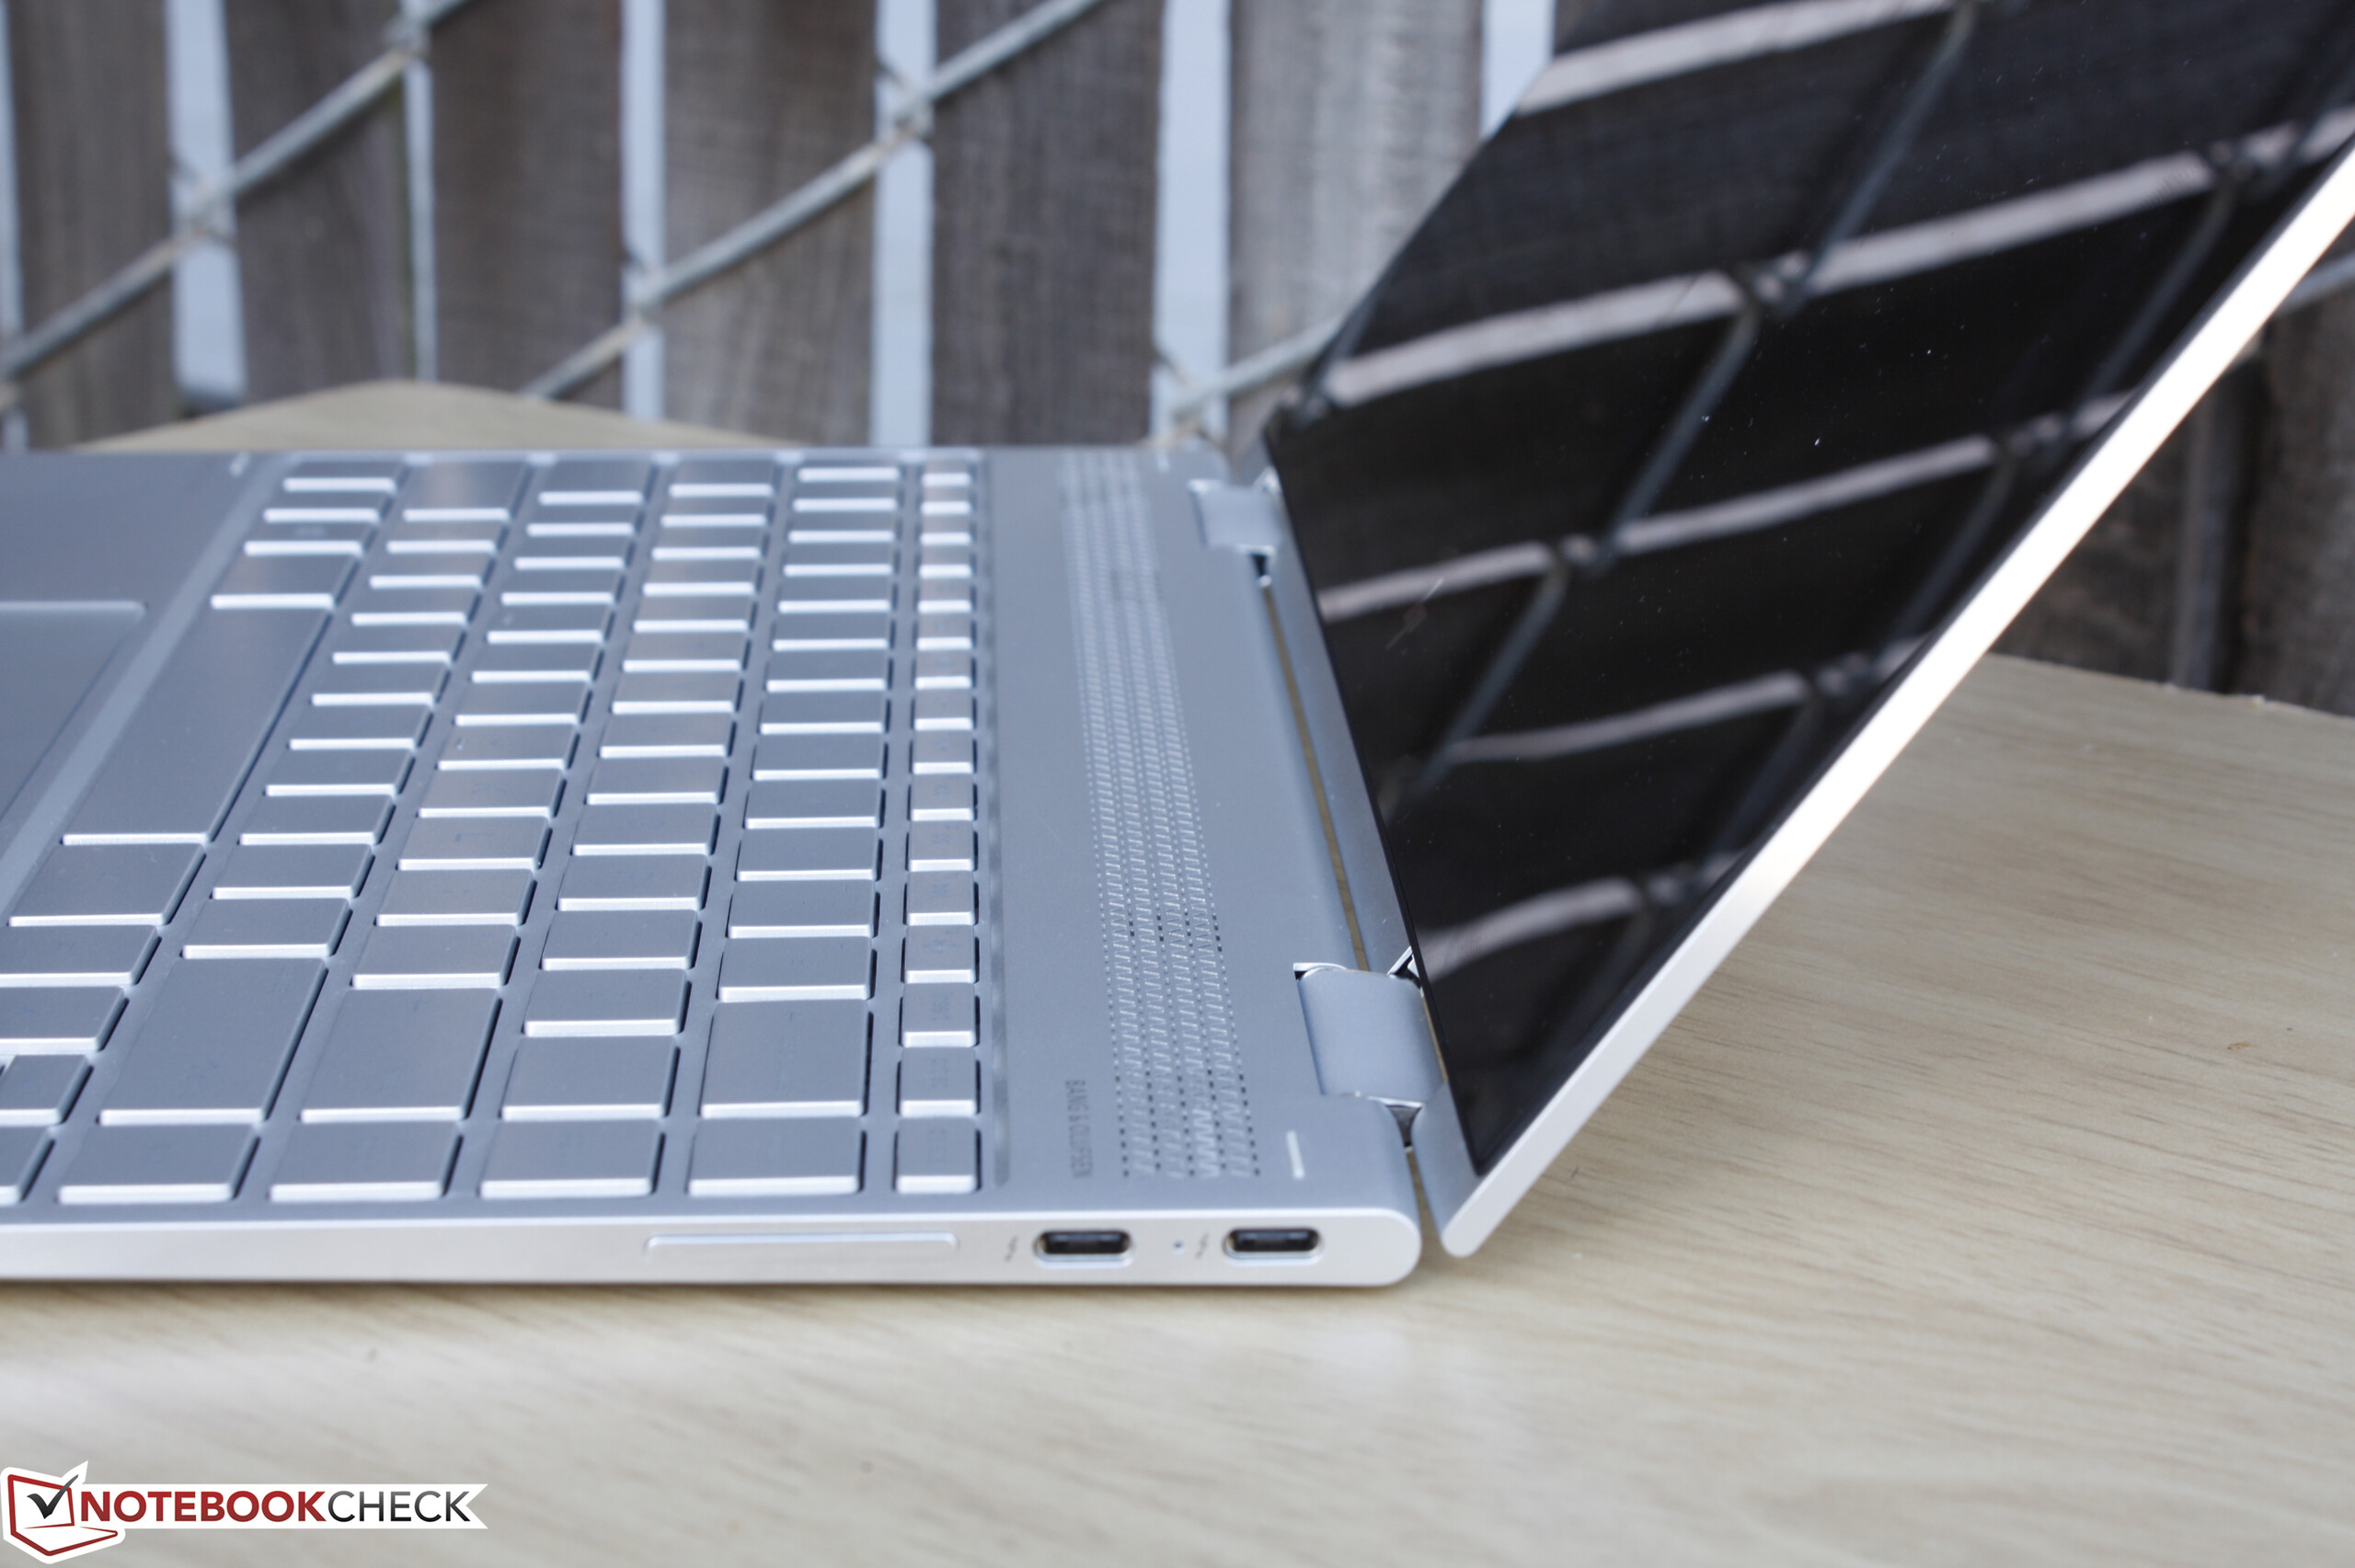
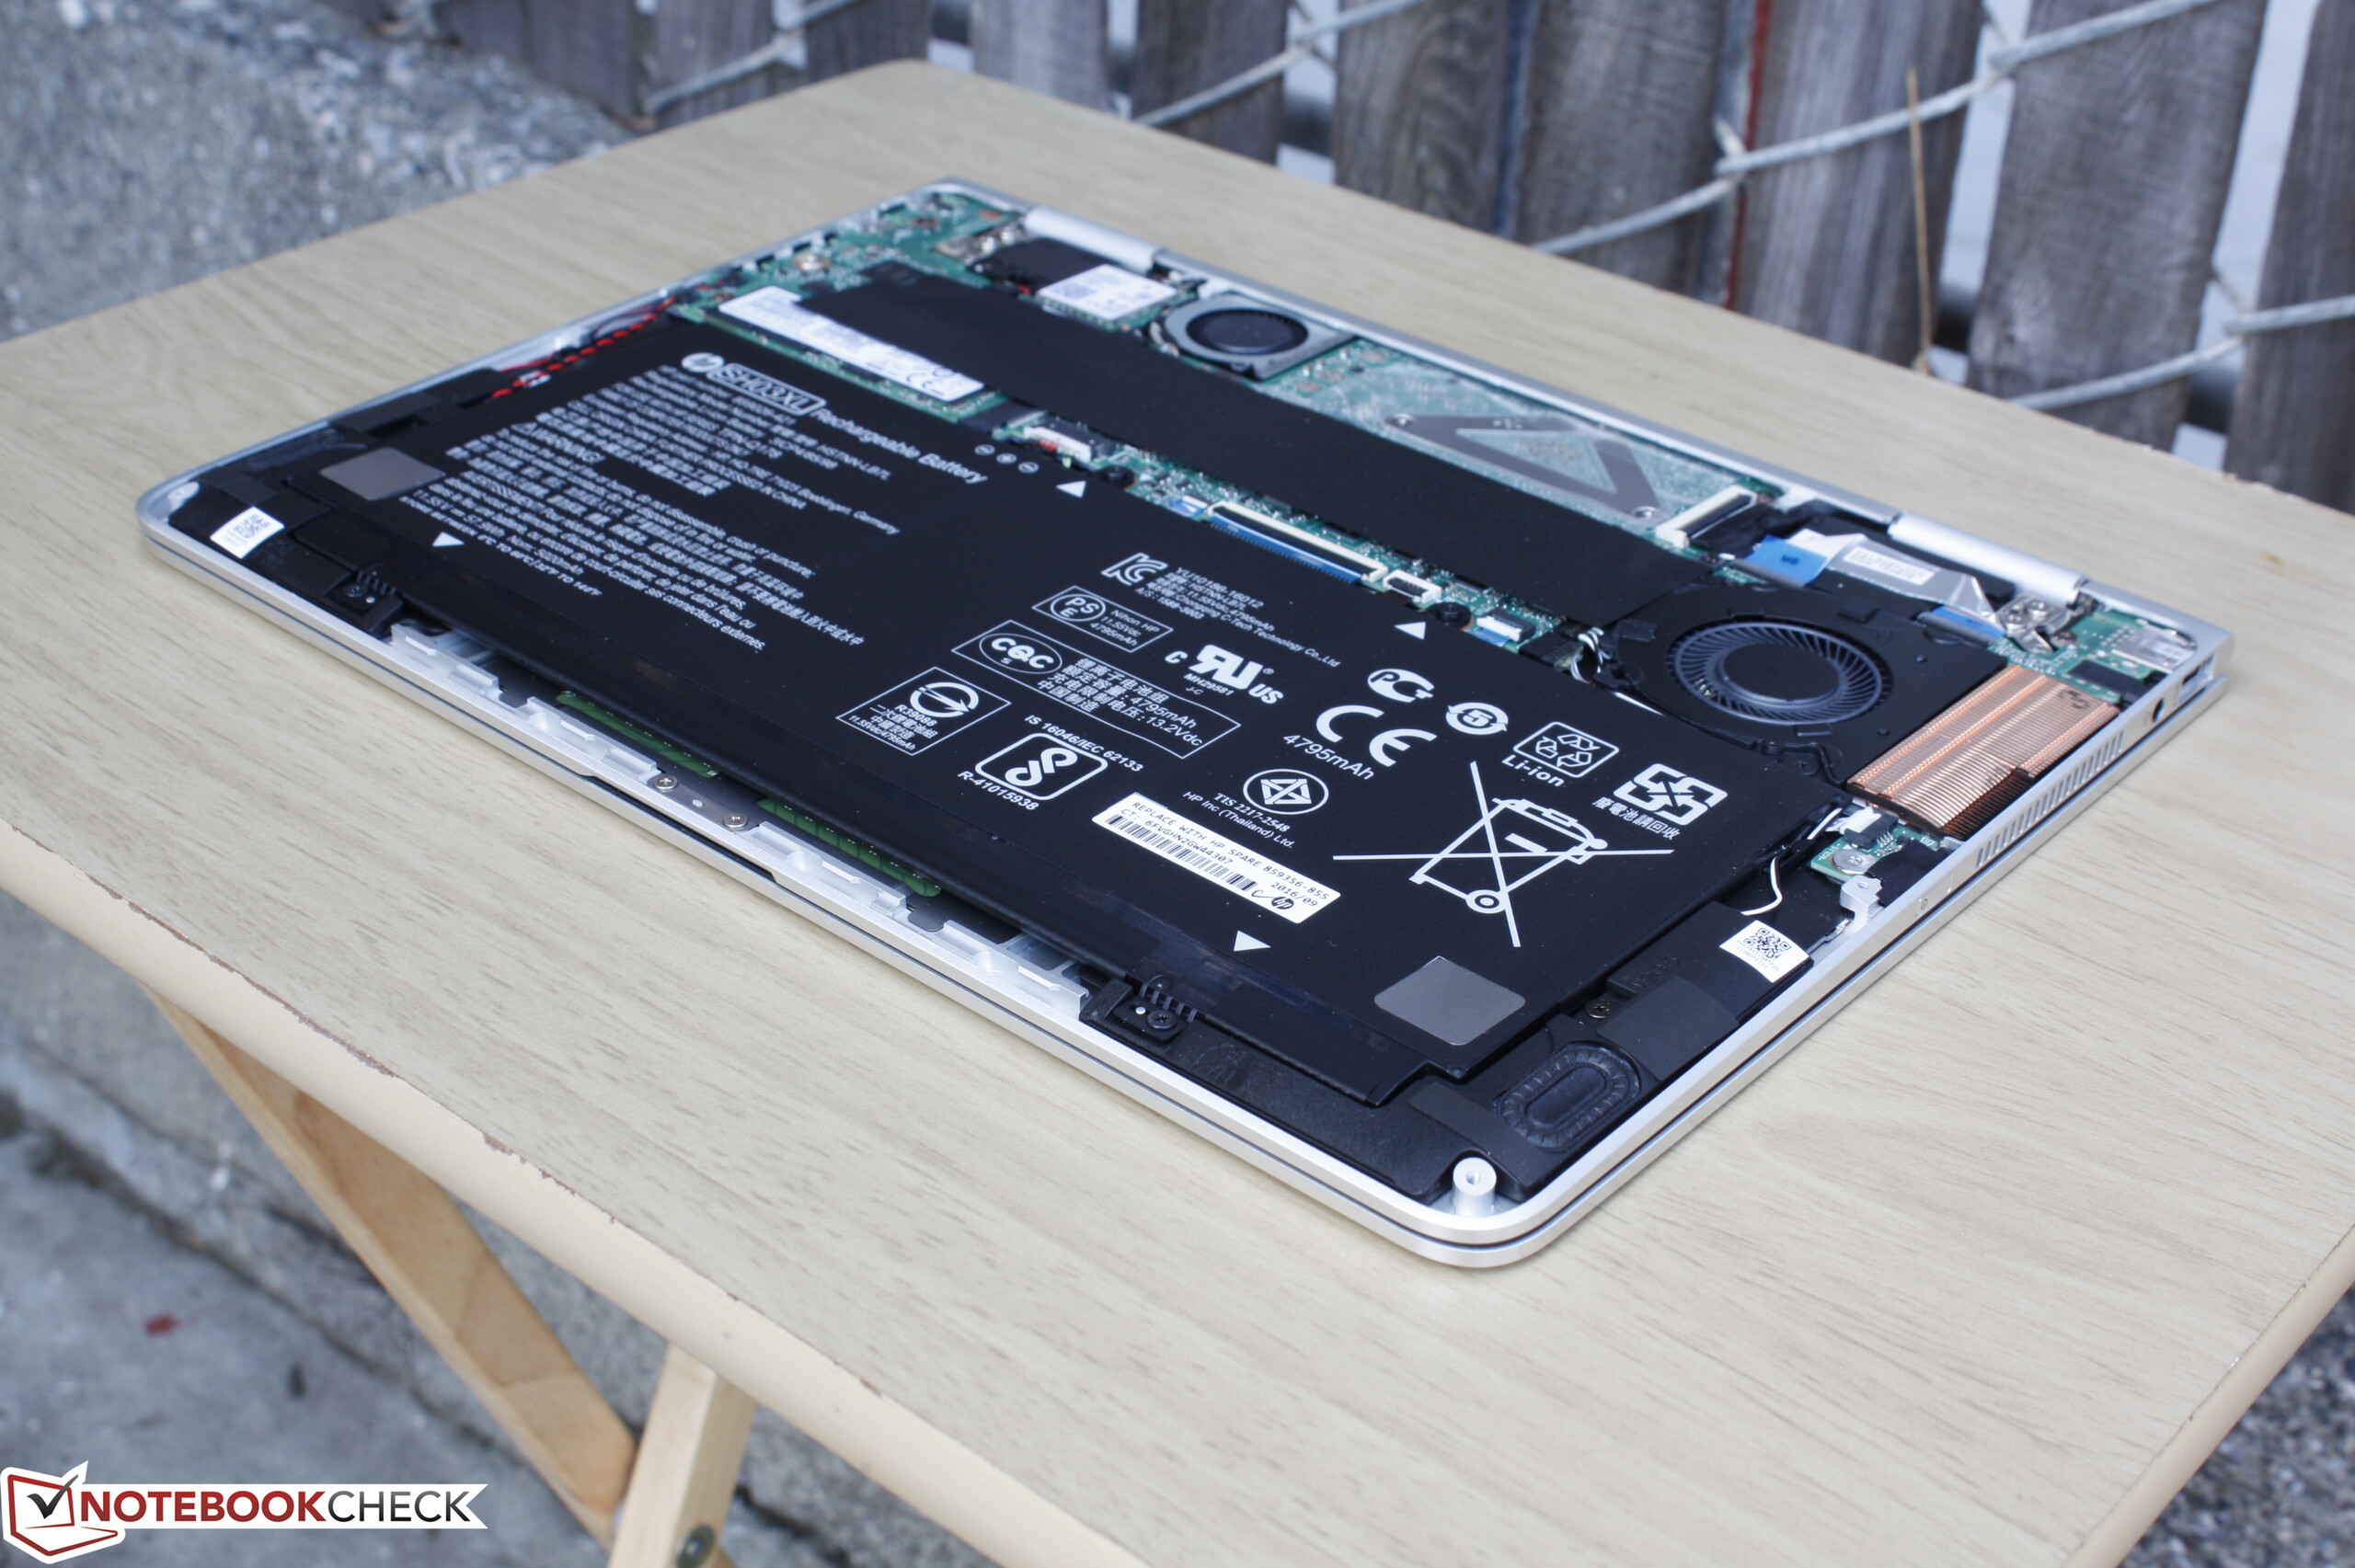
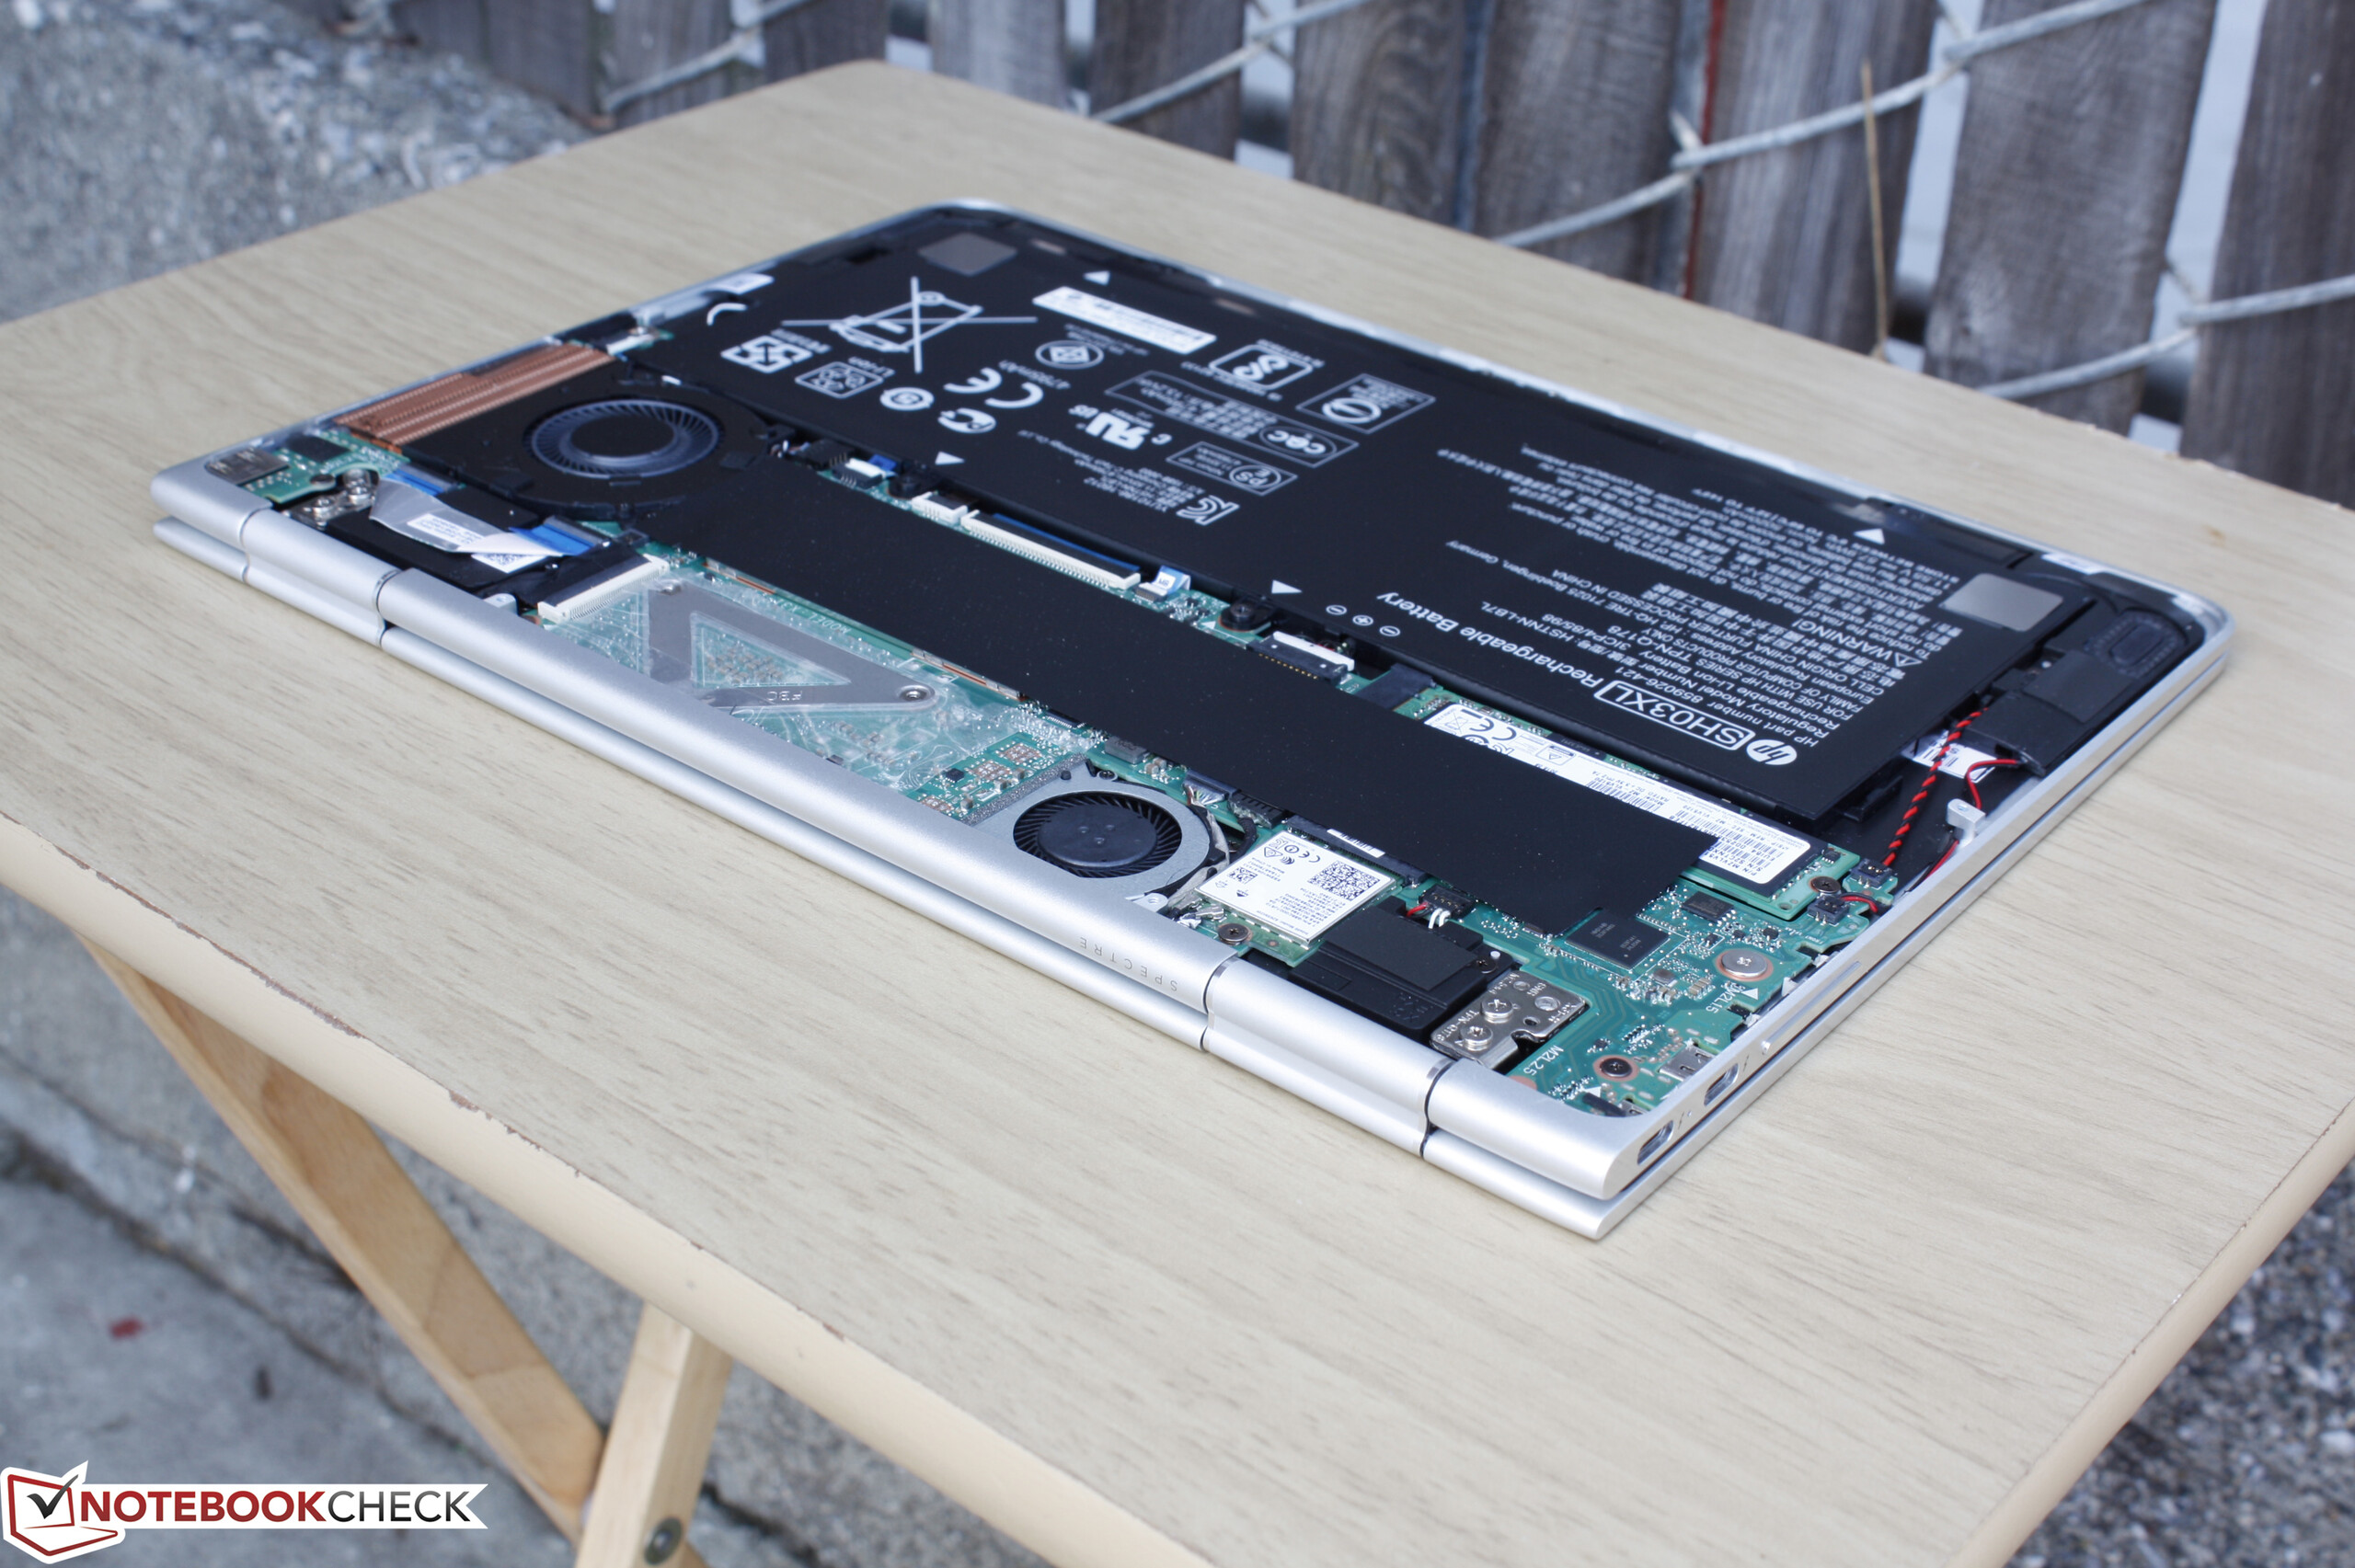
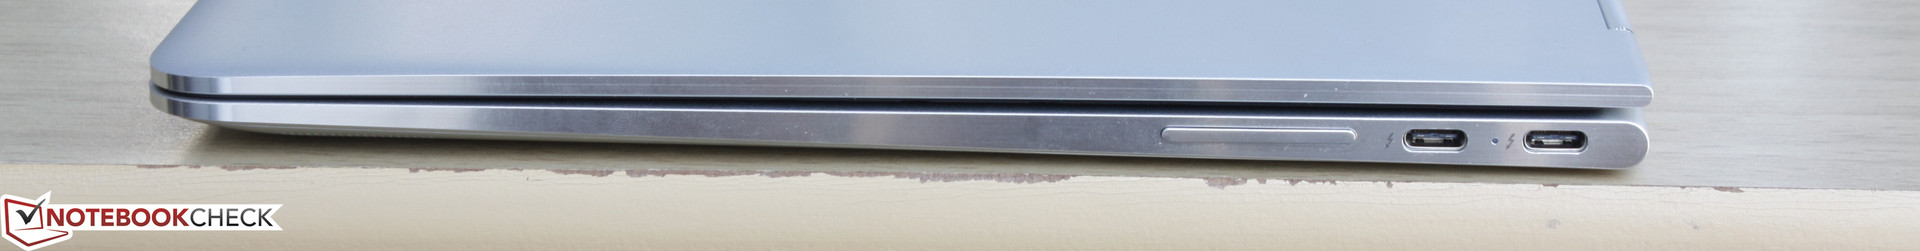
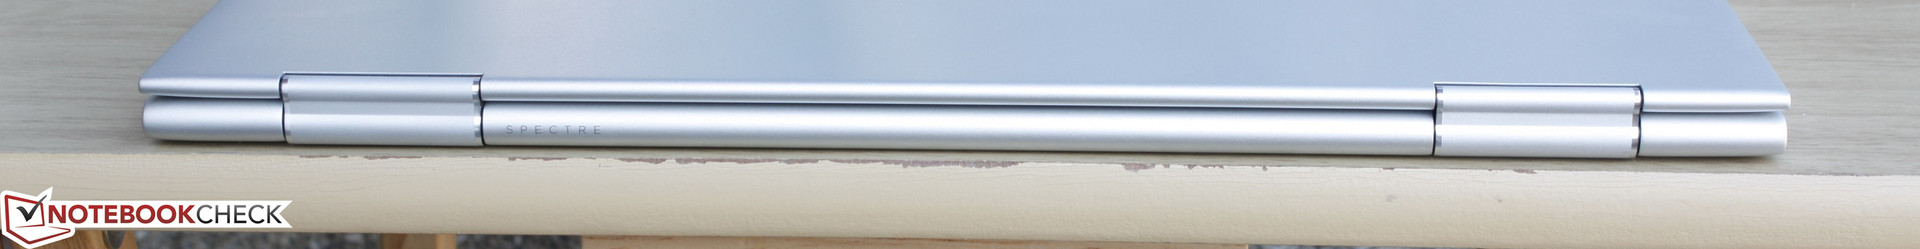
O Spectre x360 13 é o melhor Spectre 2-em-1 até agora. A nossa maior queixa com conversíveis Spectre anteriores era que eles eram muito volumosos em comparação com a concorrência, mas os marcos mais estreitos ajudaram a reduzir o tamanho e o peso tremendamente sem quaisquer consequências drásticas para a qualidade ou rigidez. De fato, o novo design é o melhor aspecto doe Spectre x360 13 mais que a atualização de hardware Kaby Lake. Outras vantagens da atualização são as durações mais longas, SSD NVMe, desempenho mais potente da GPU integrada, e 2 portas Thunderbolt 3.
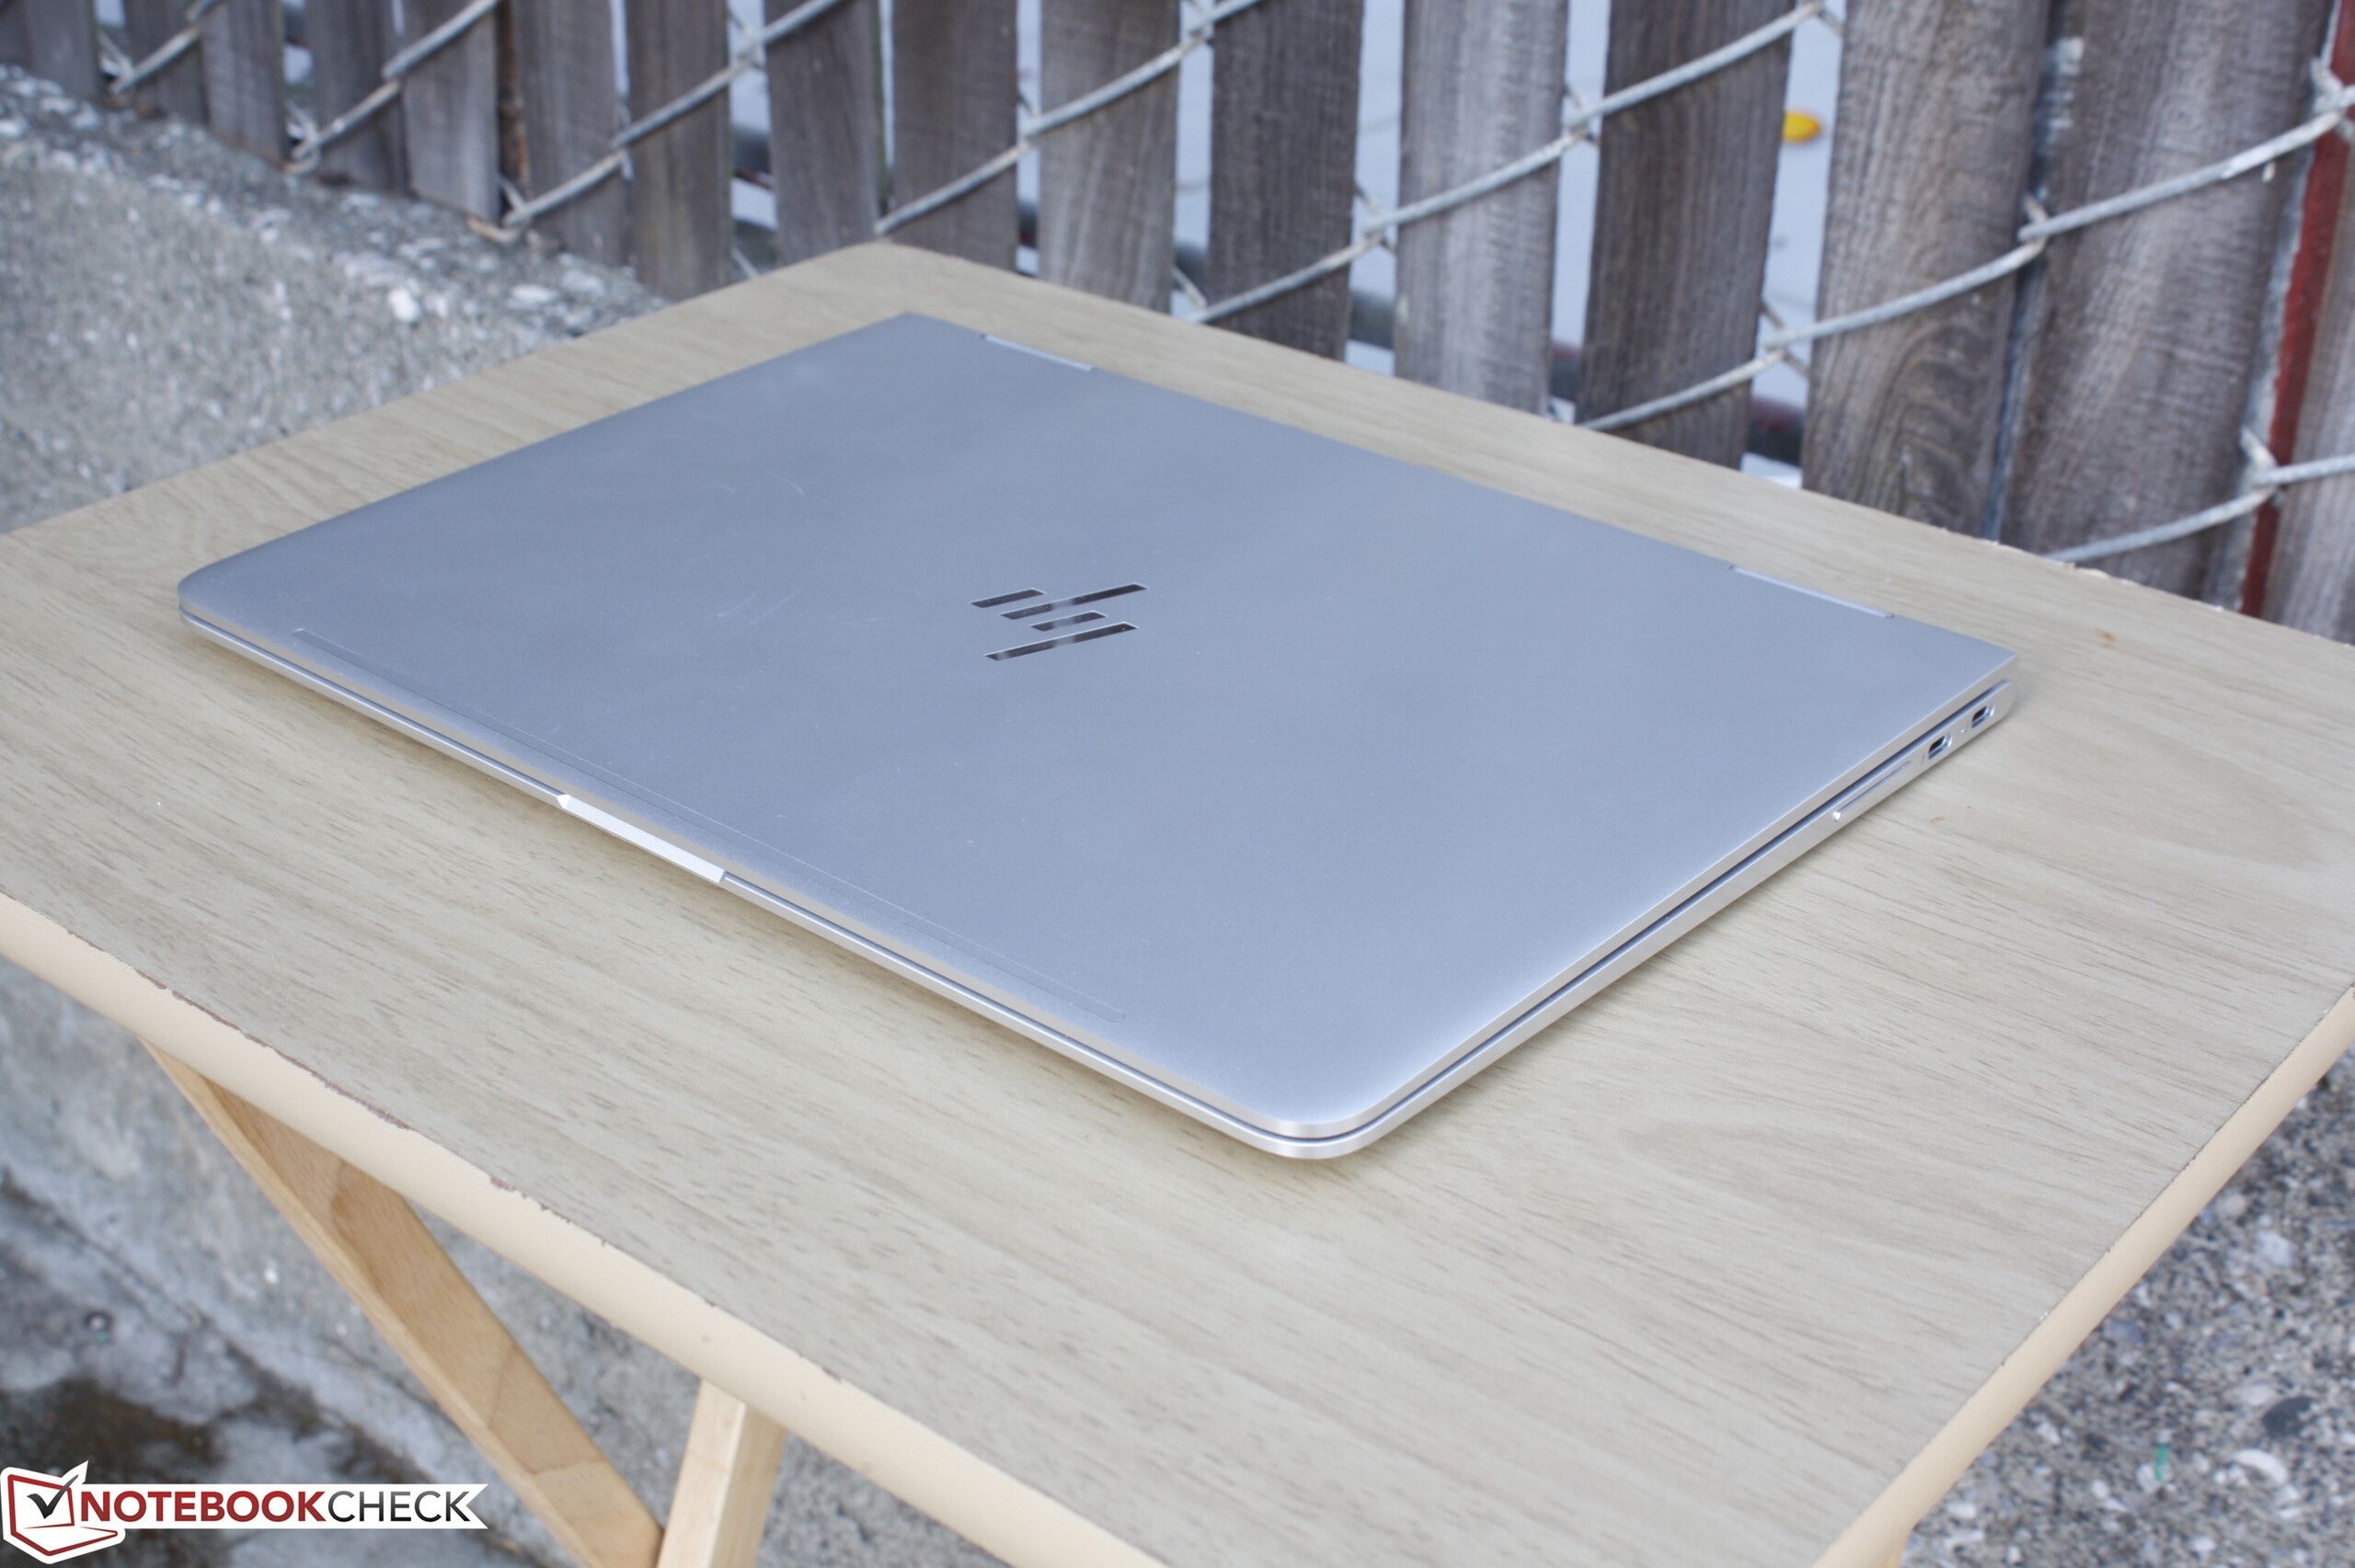
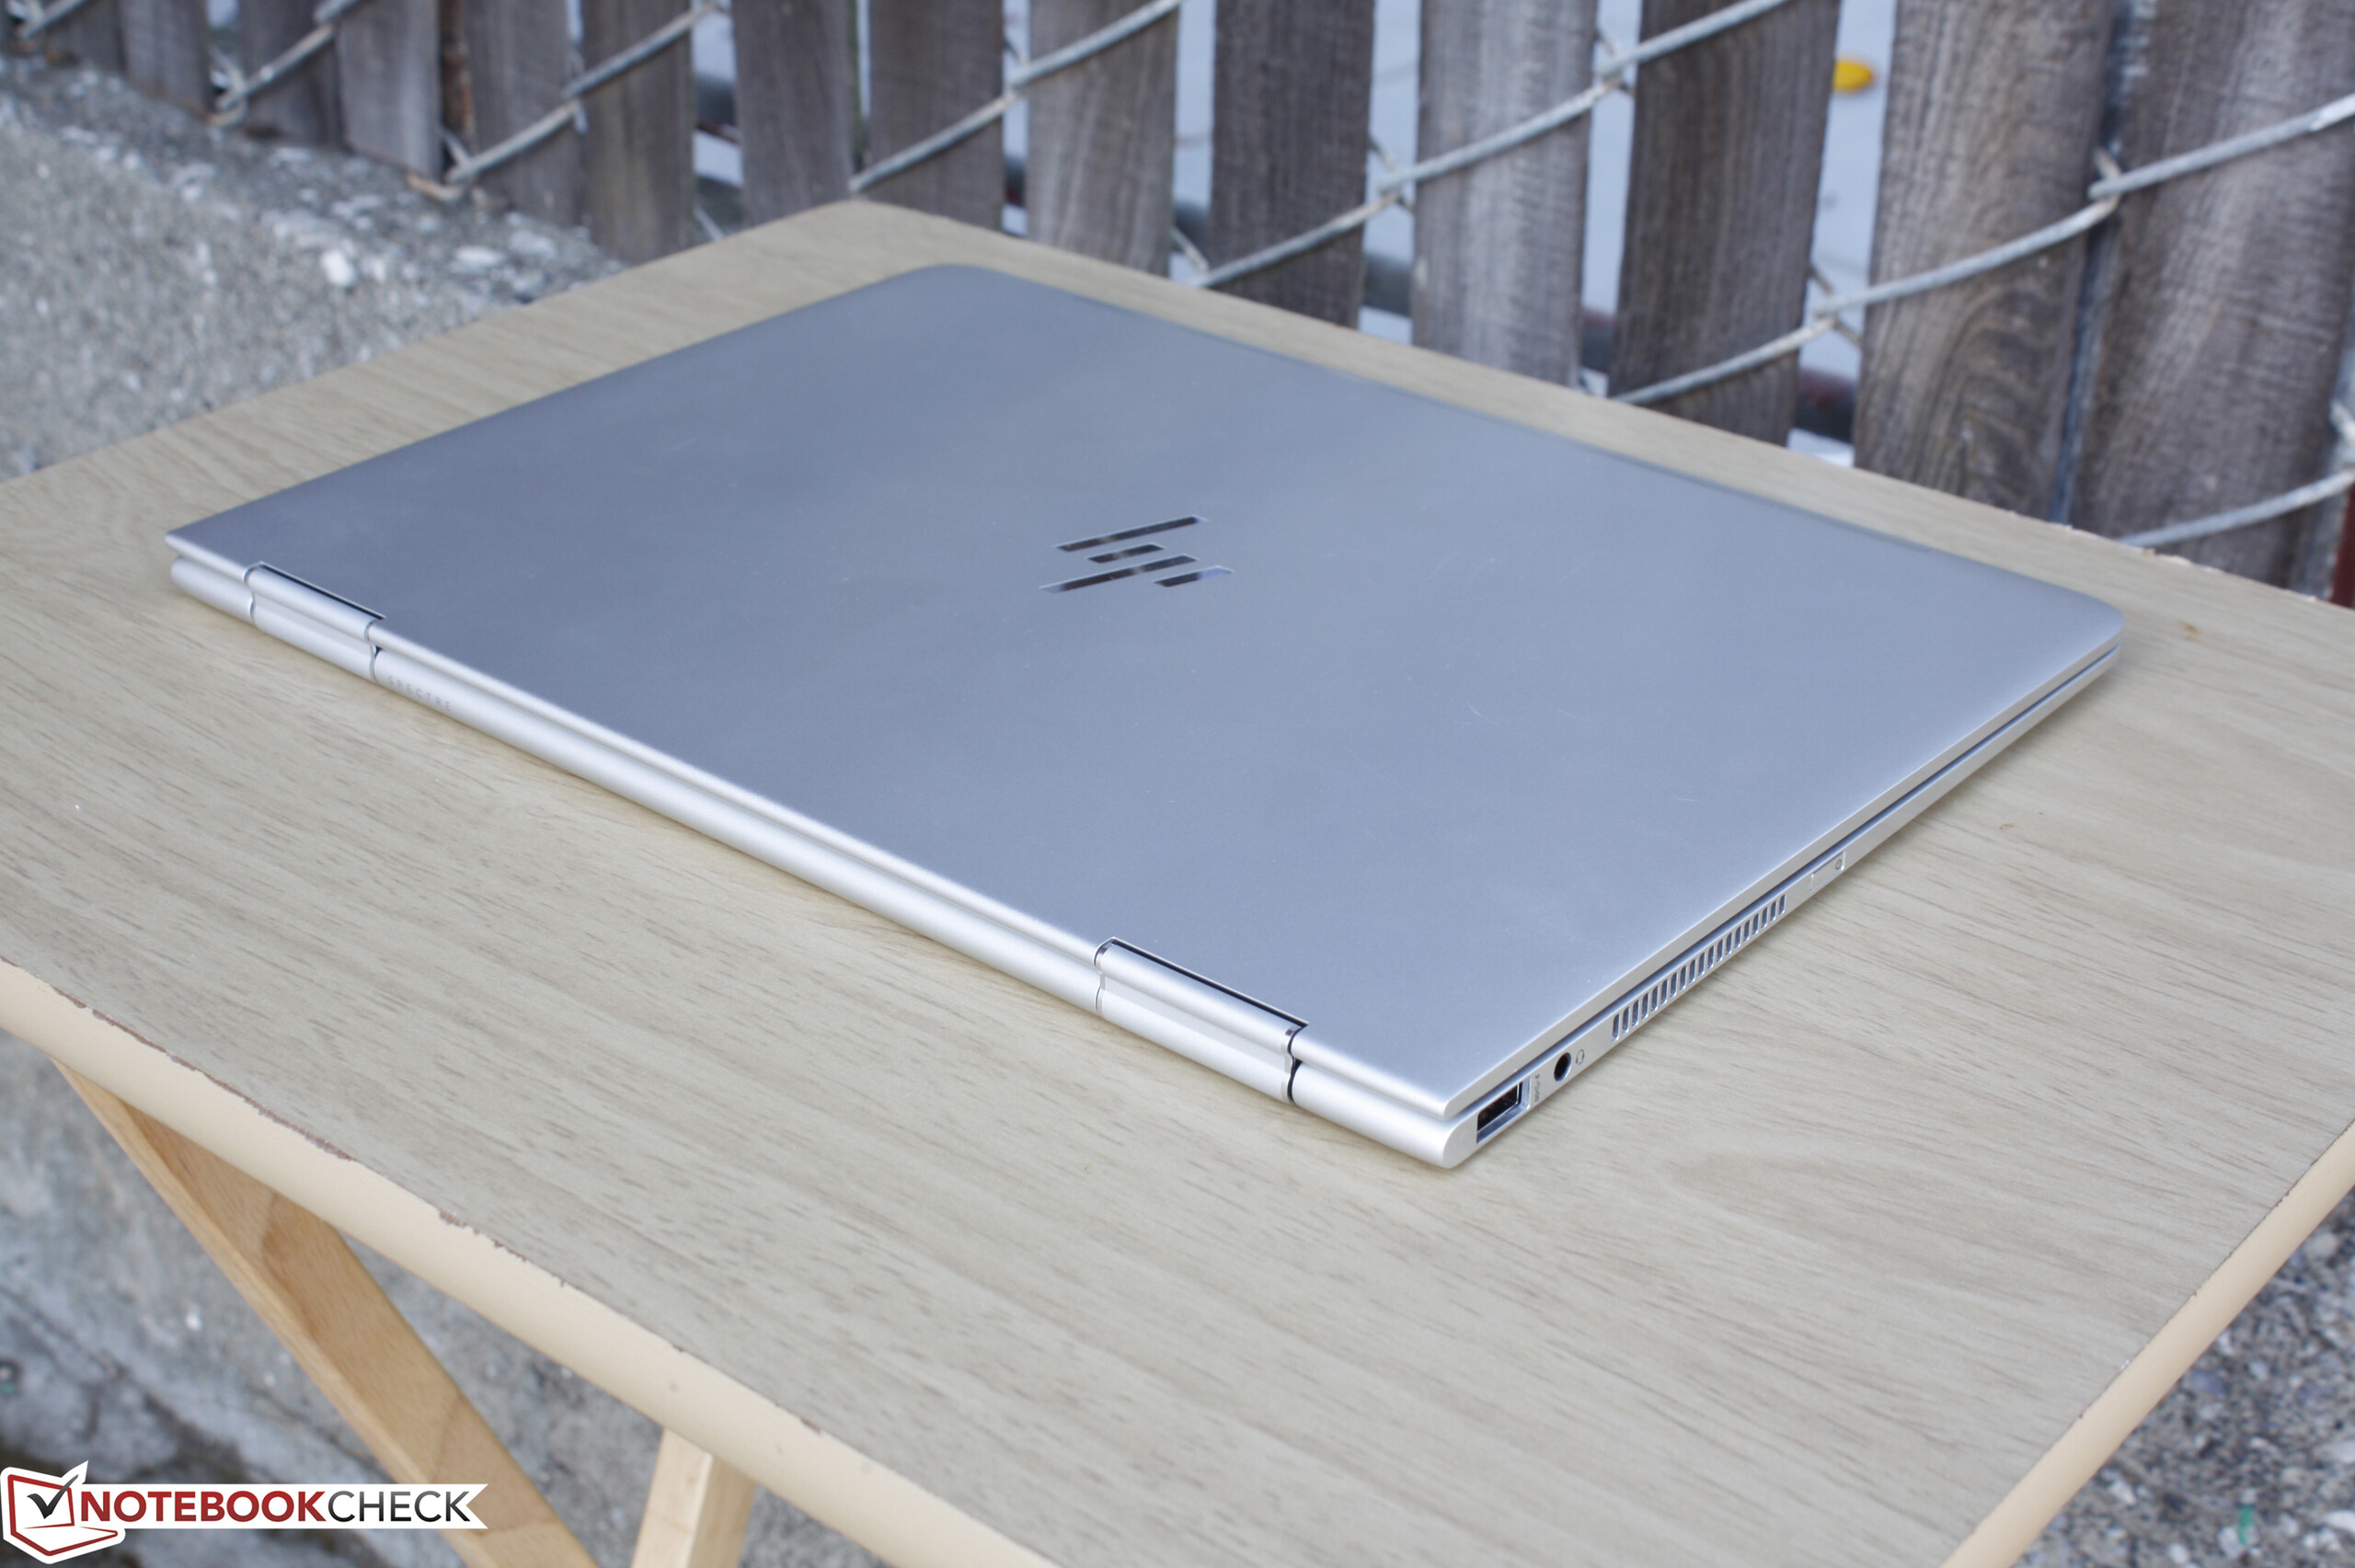
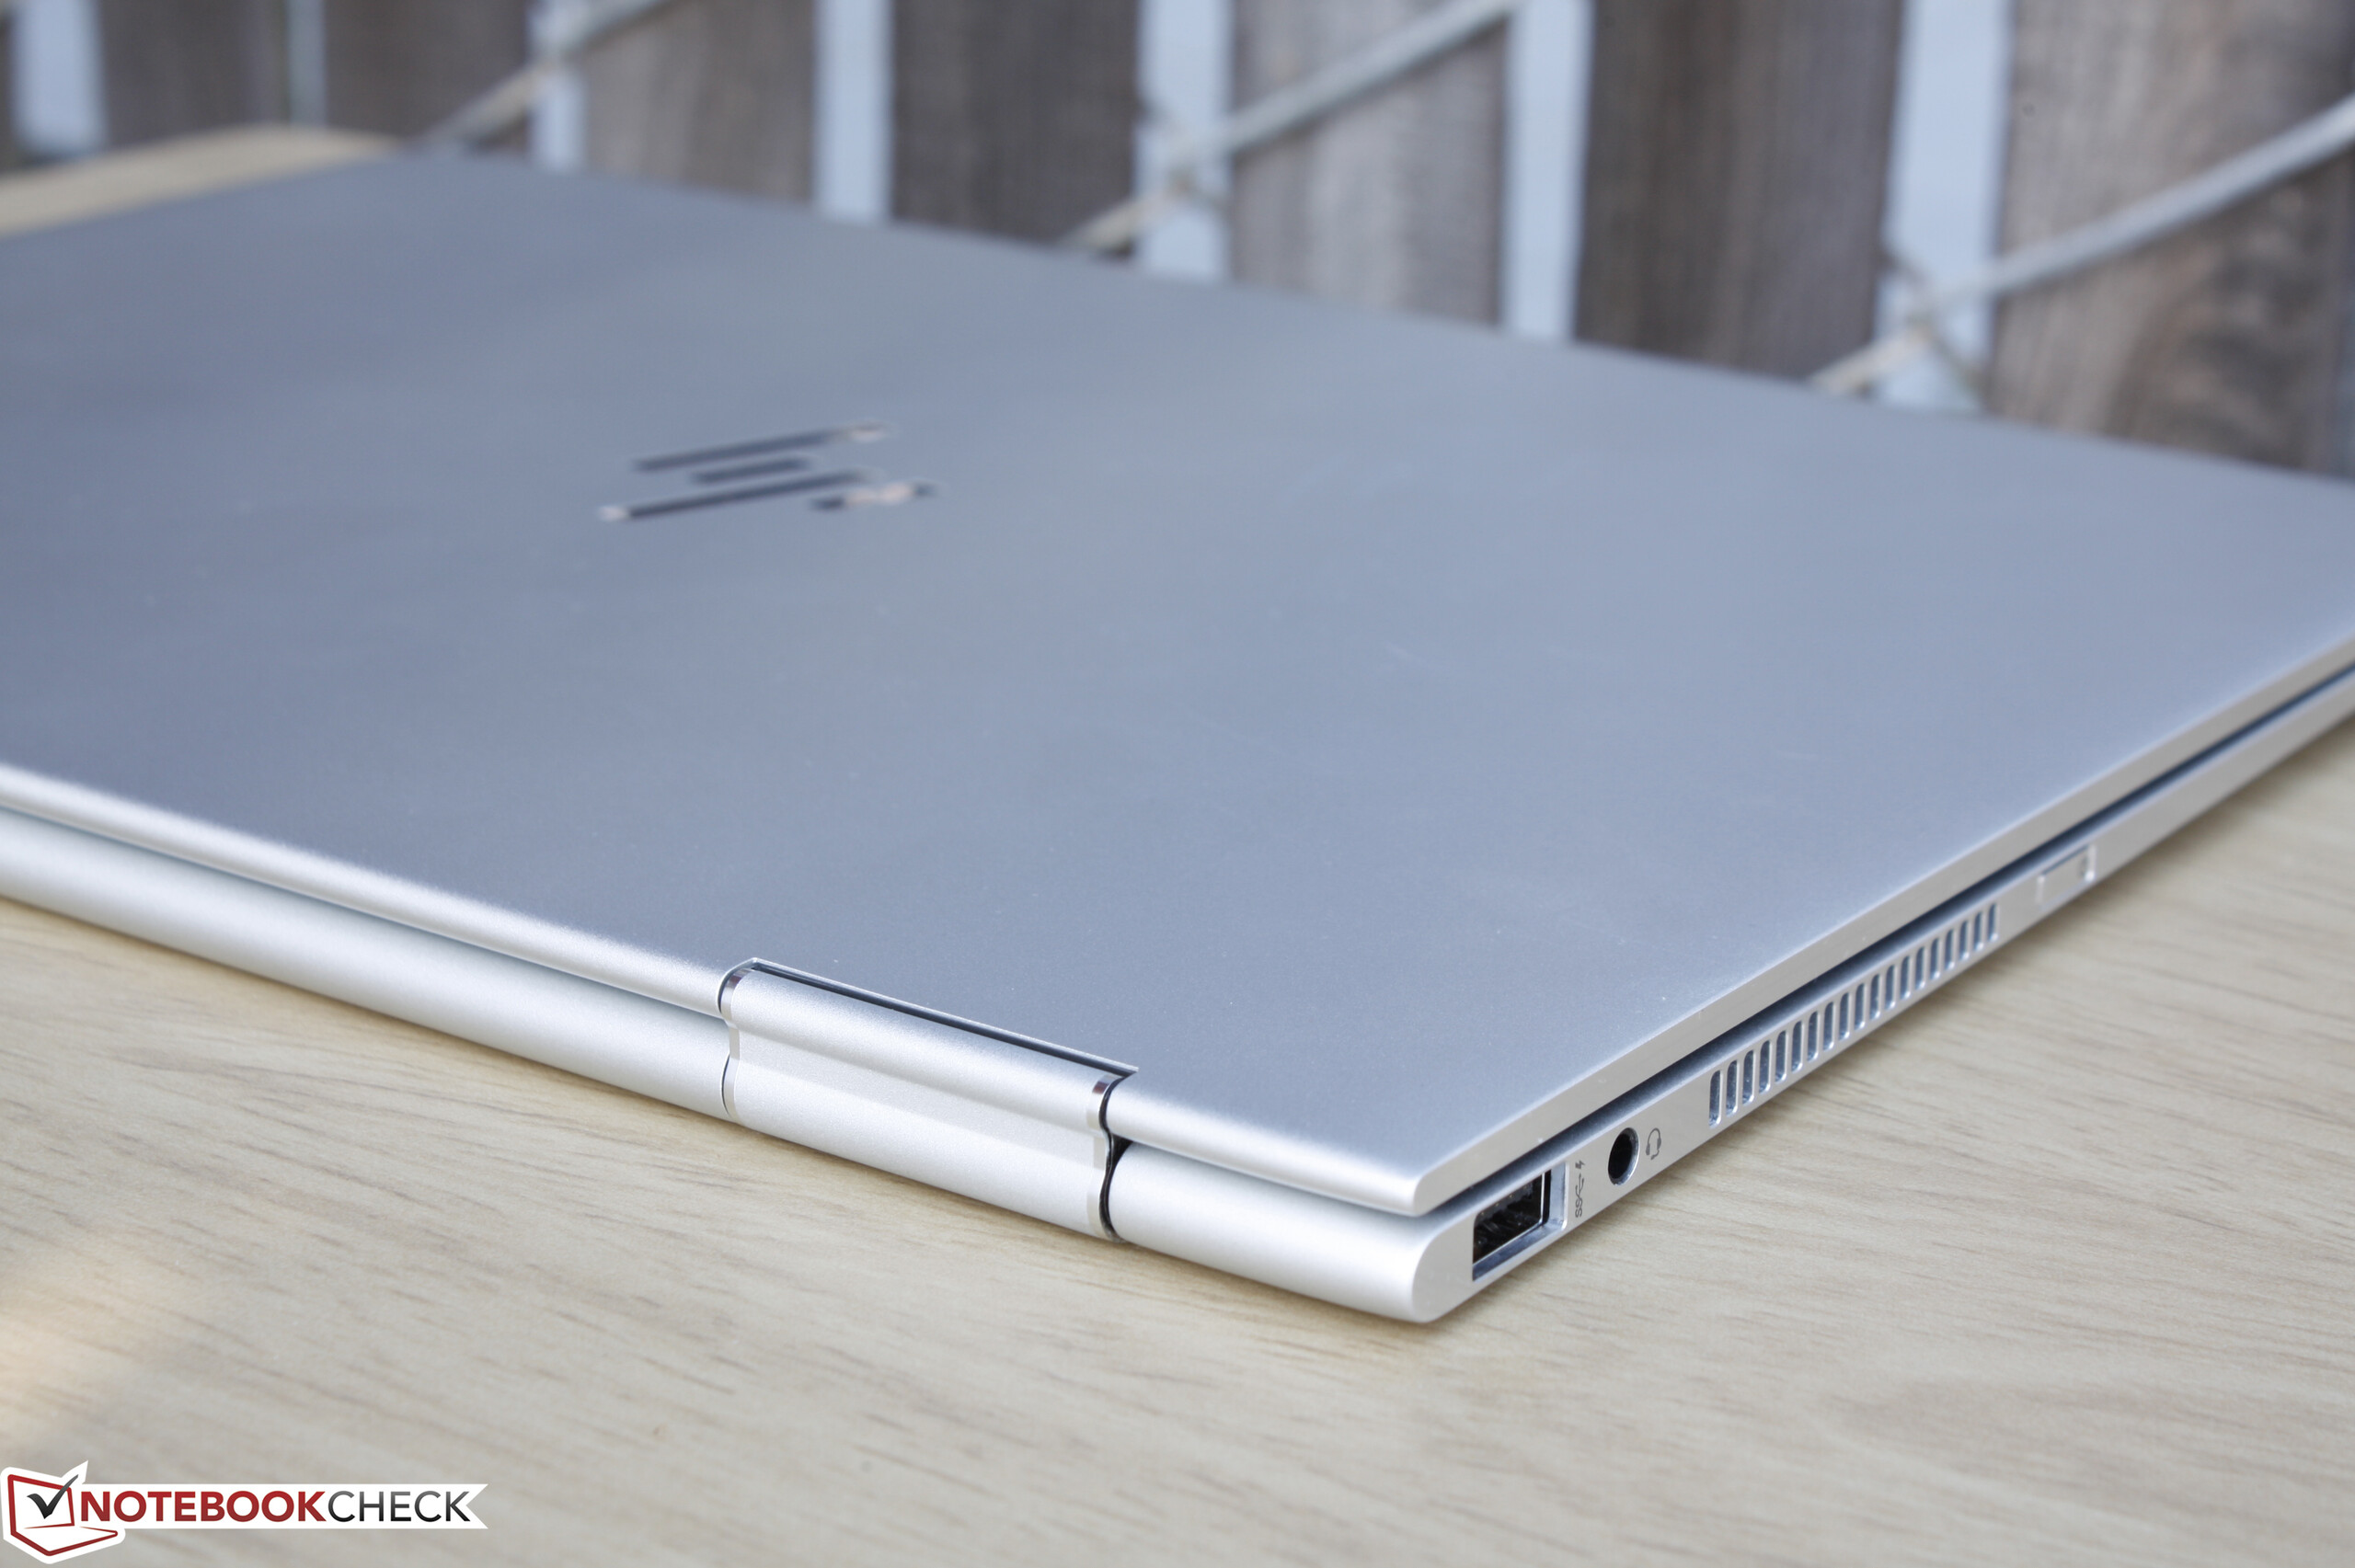
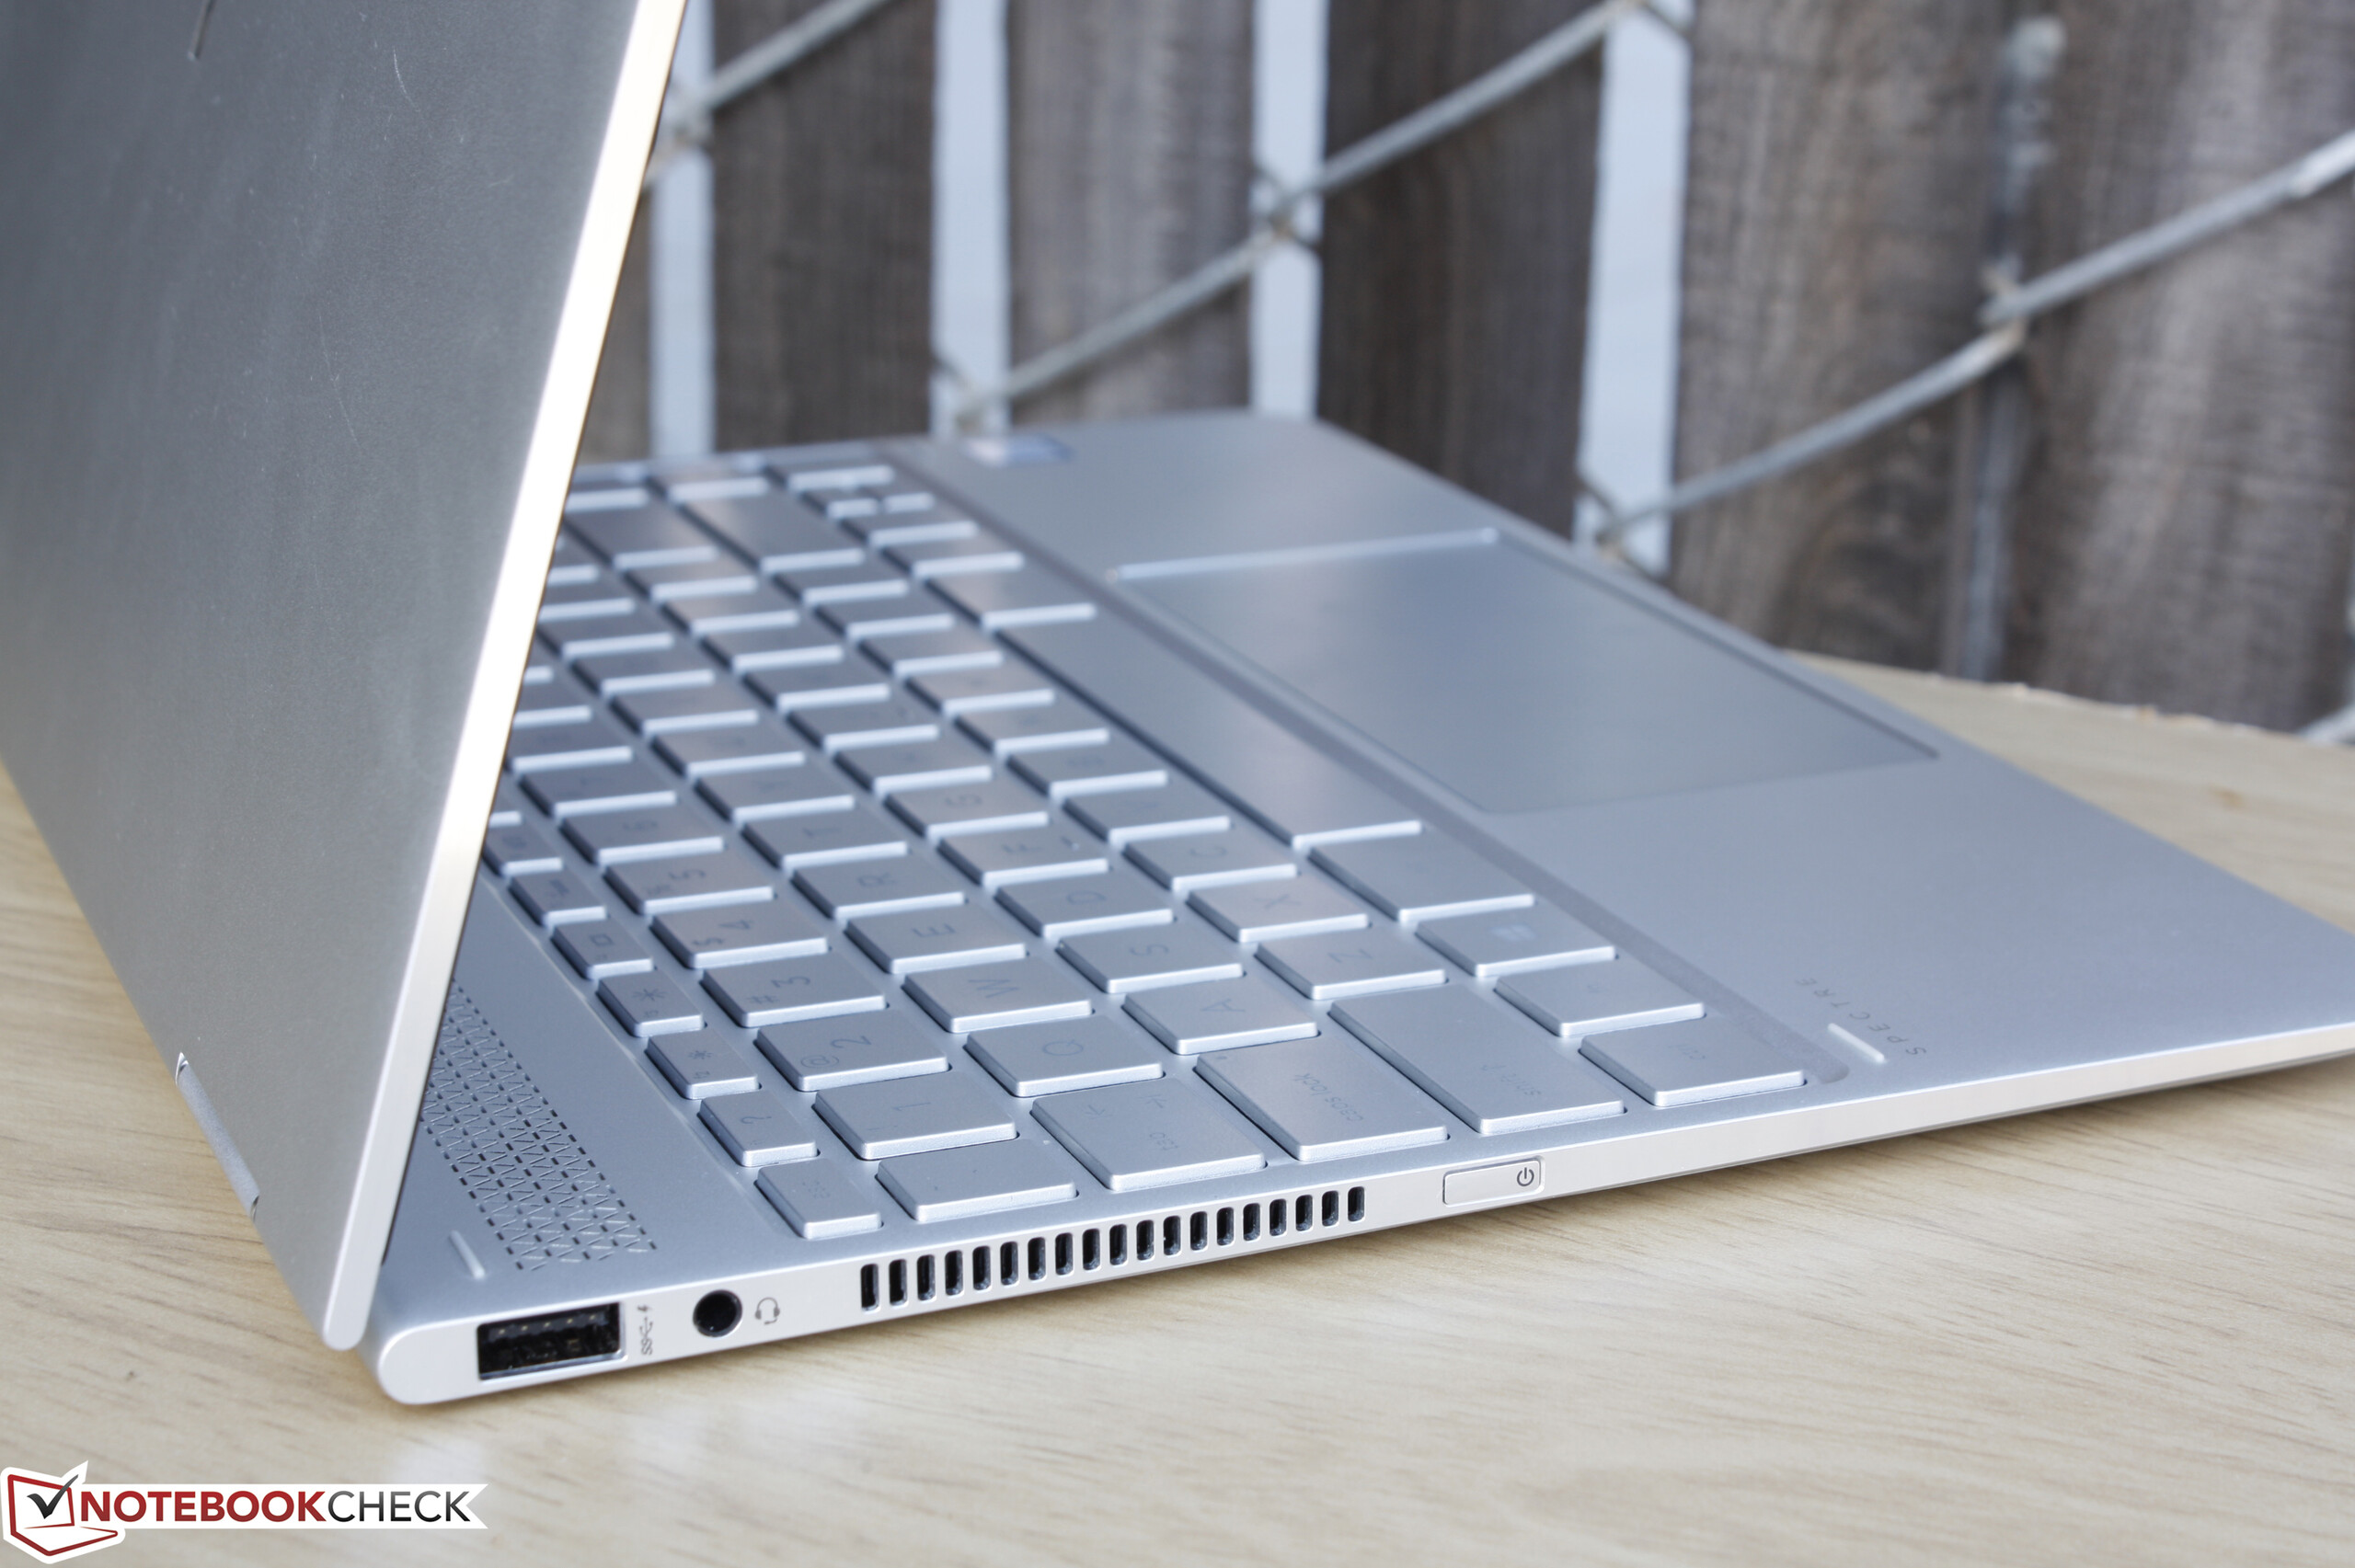
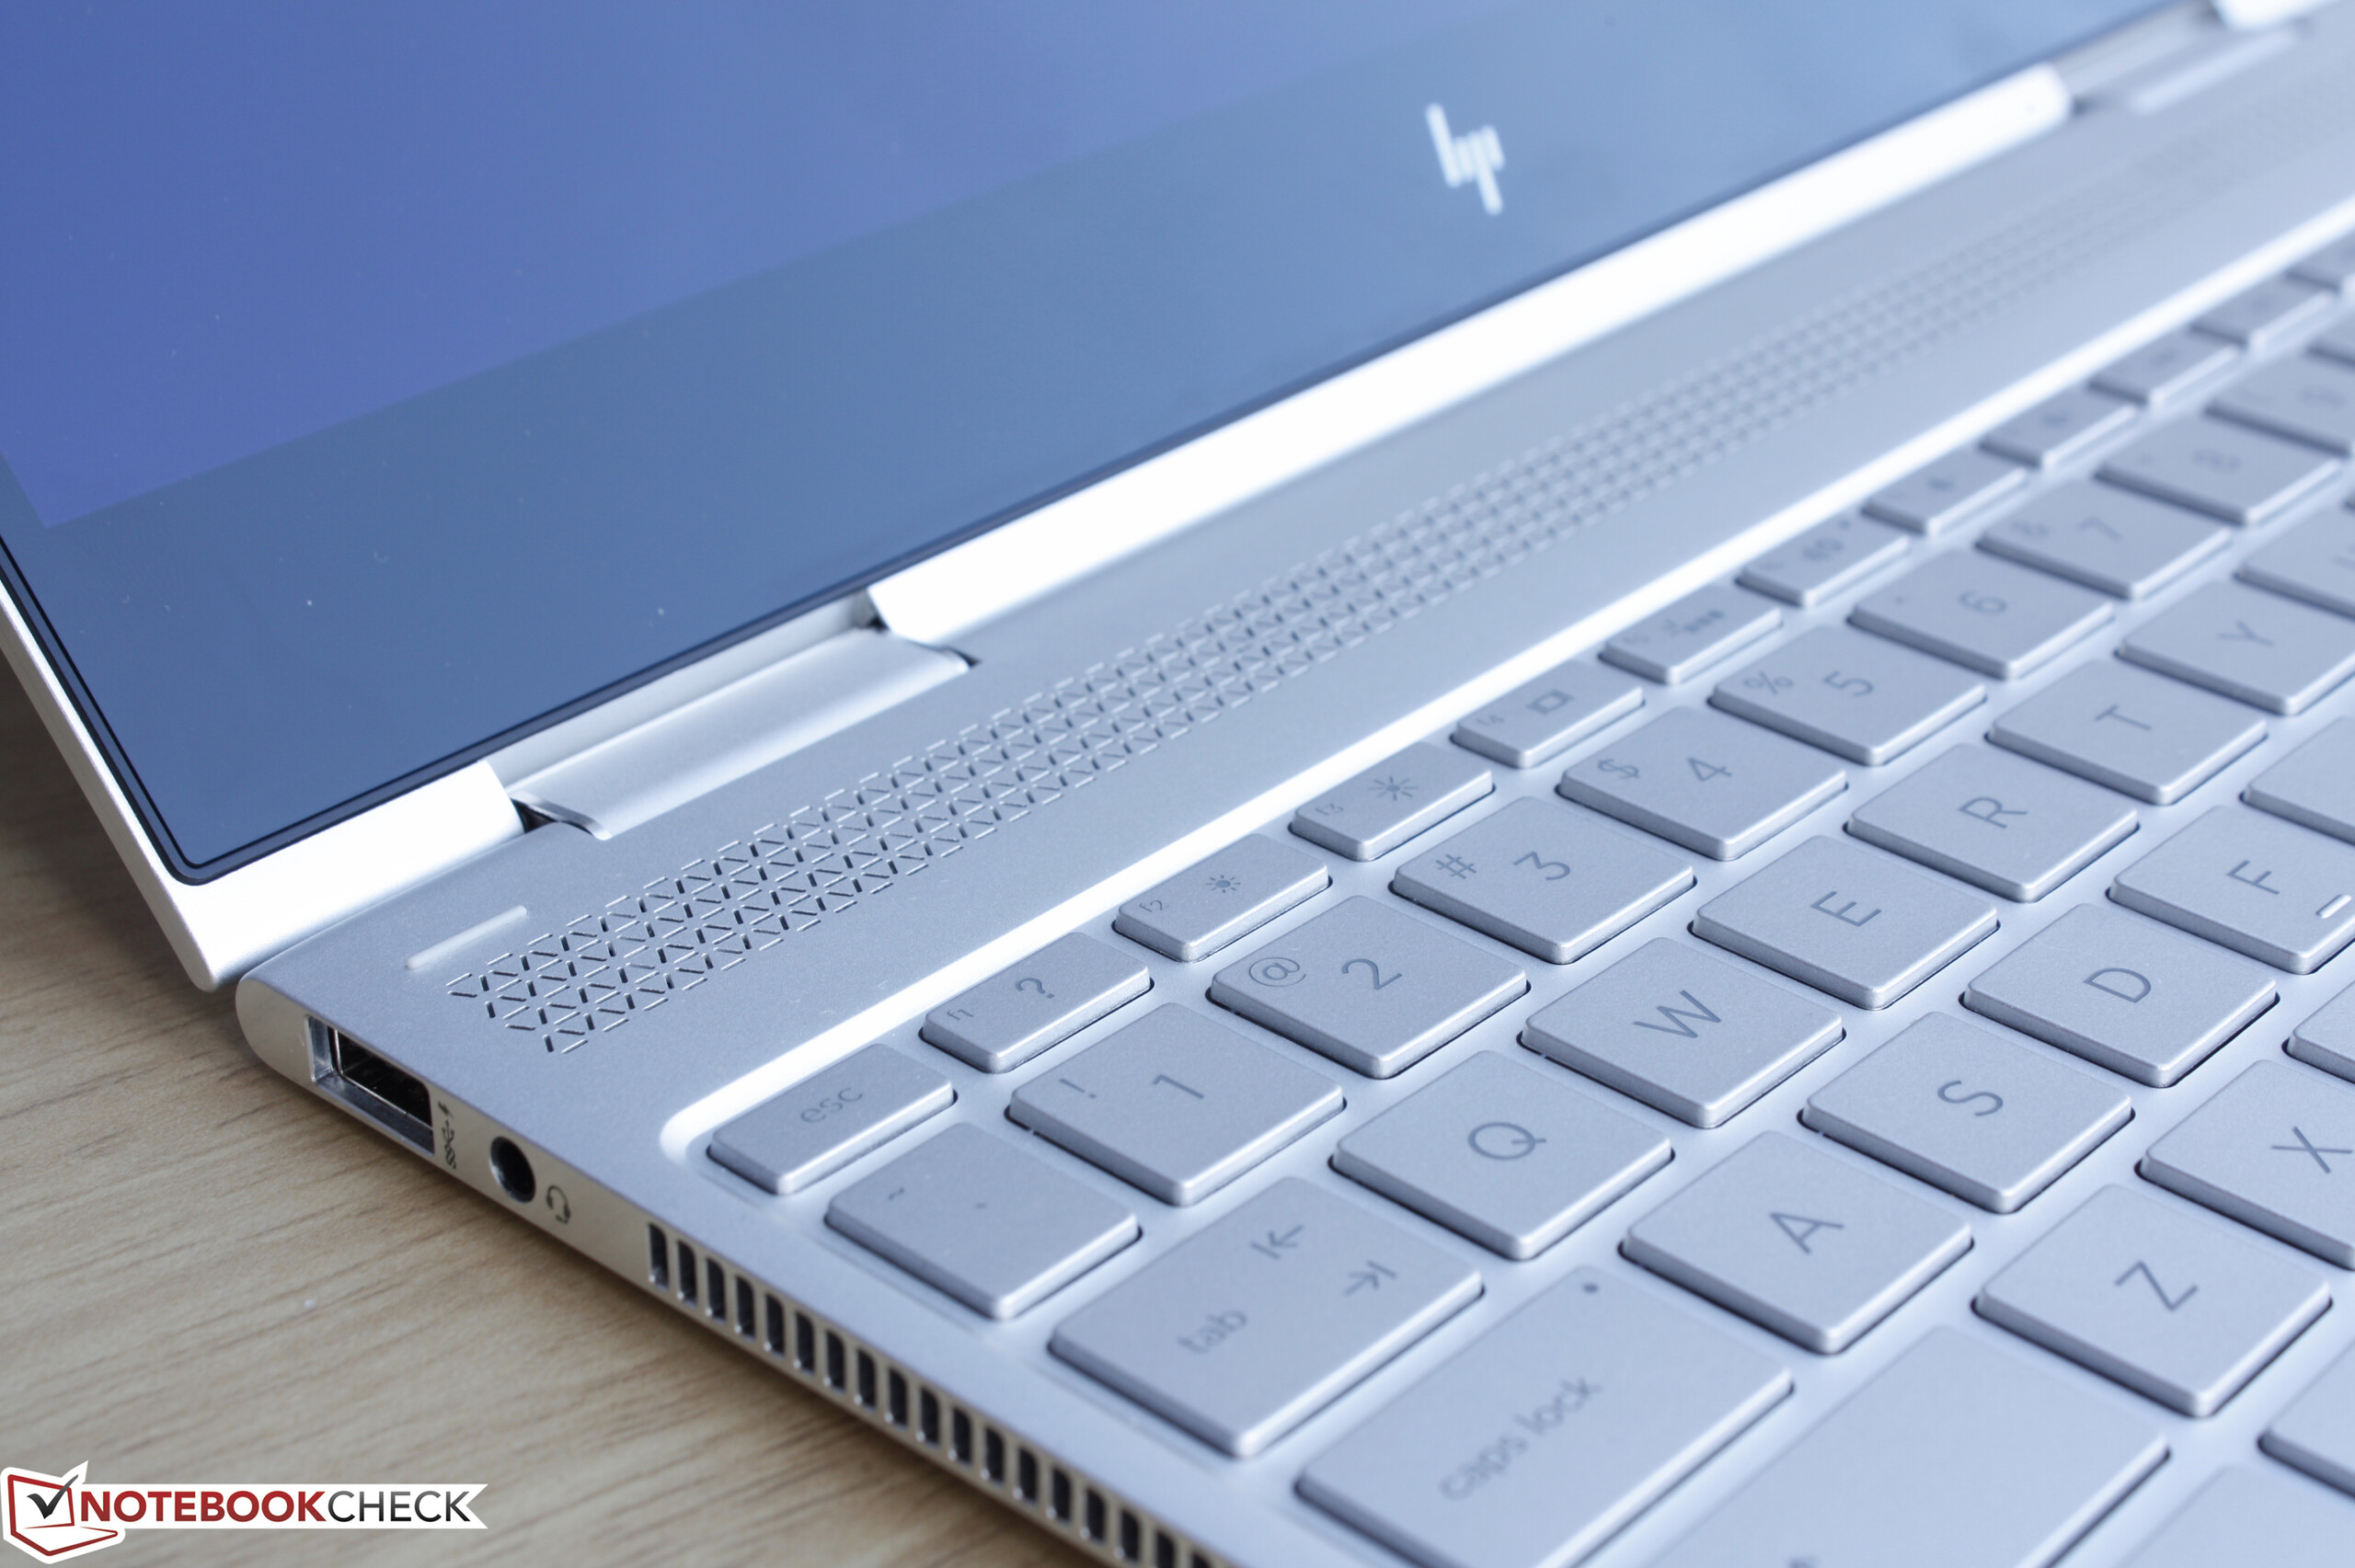
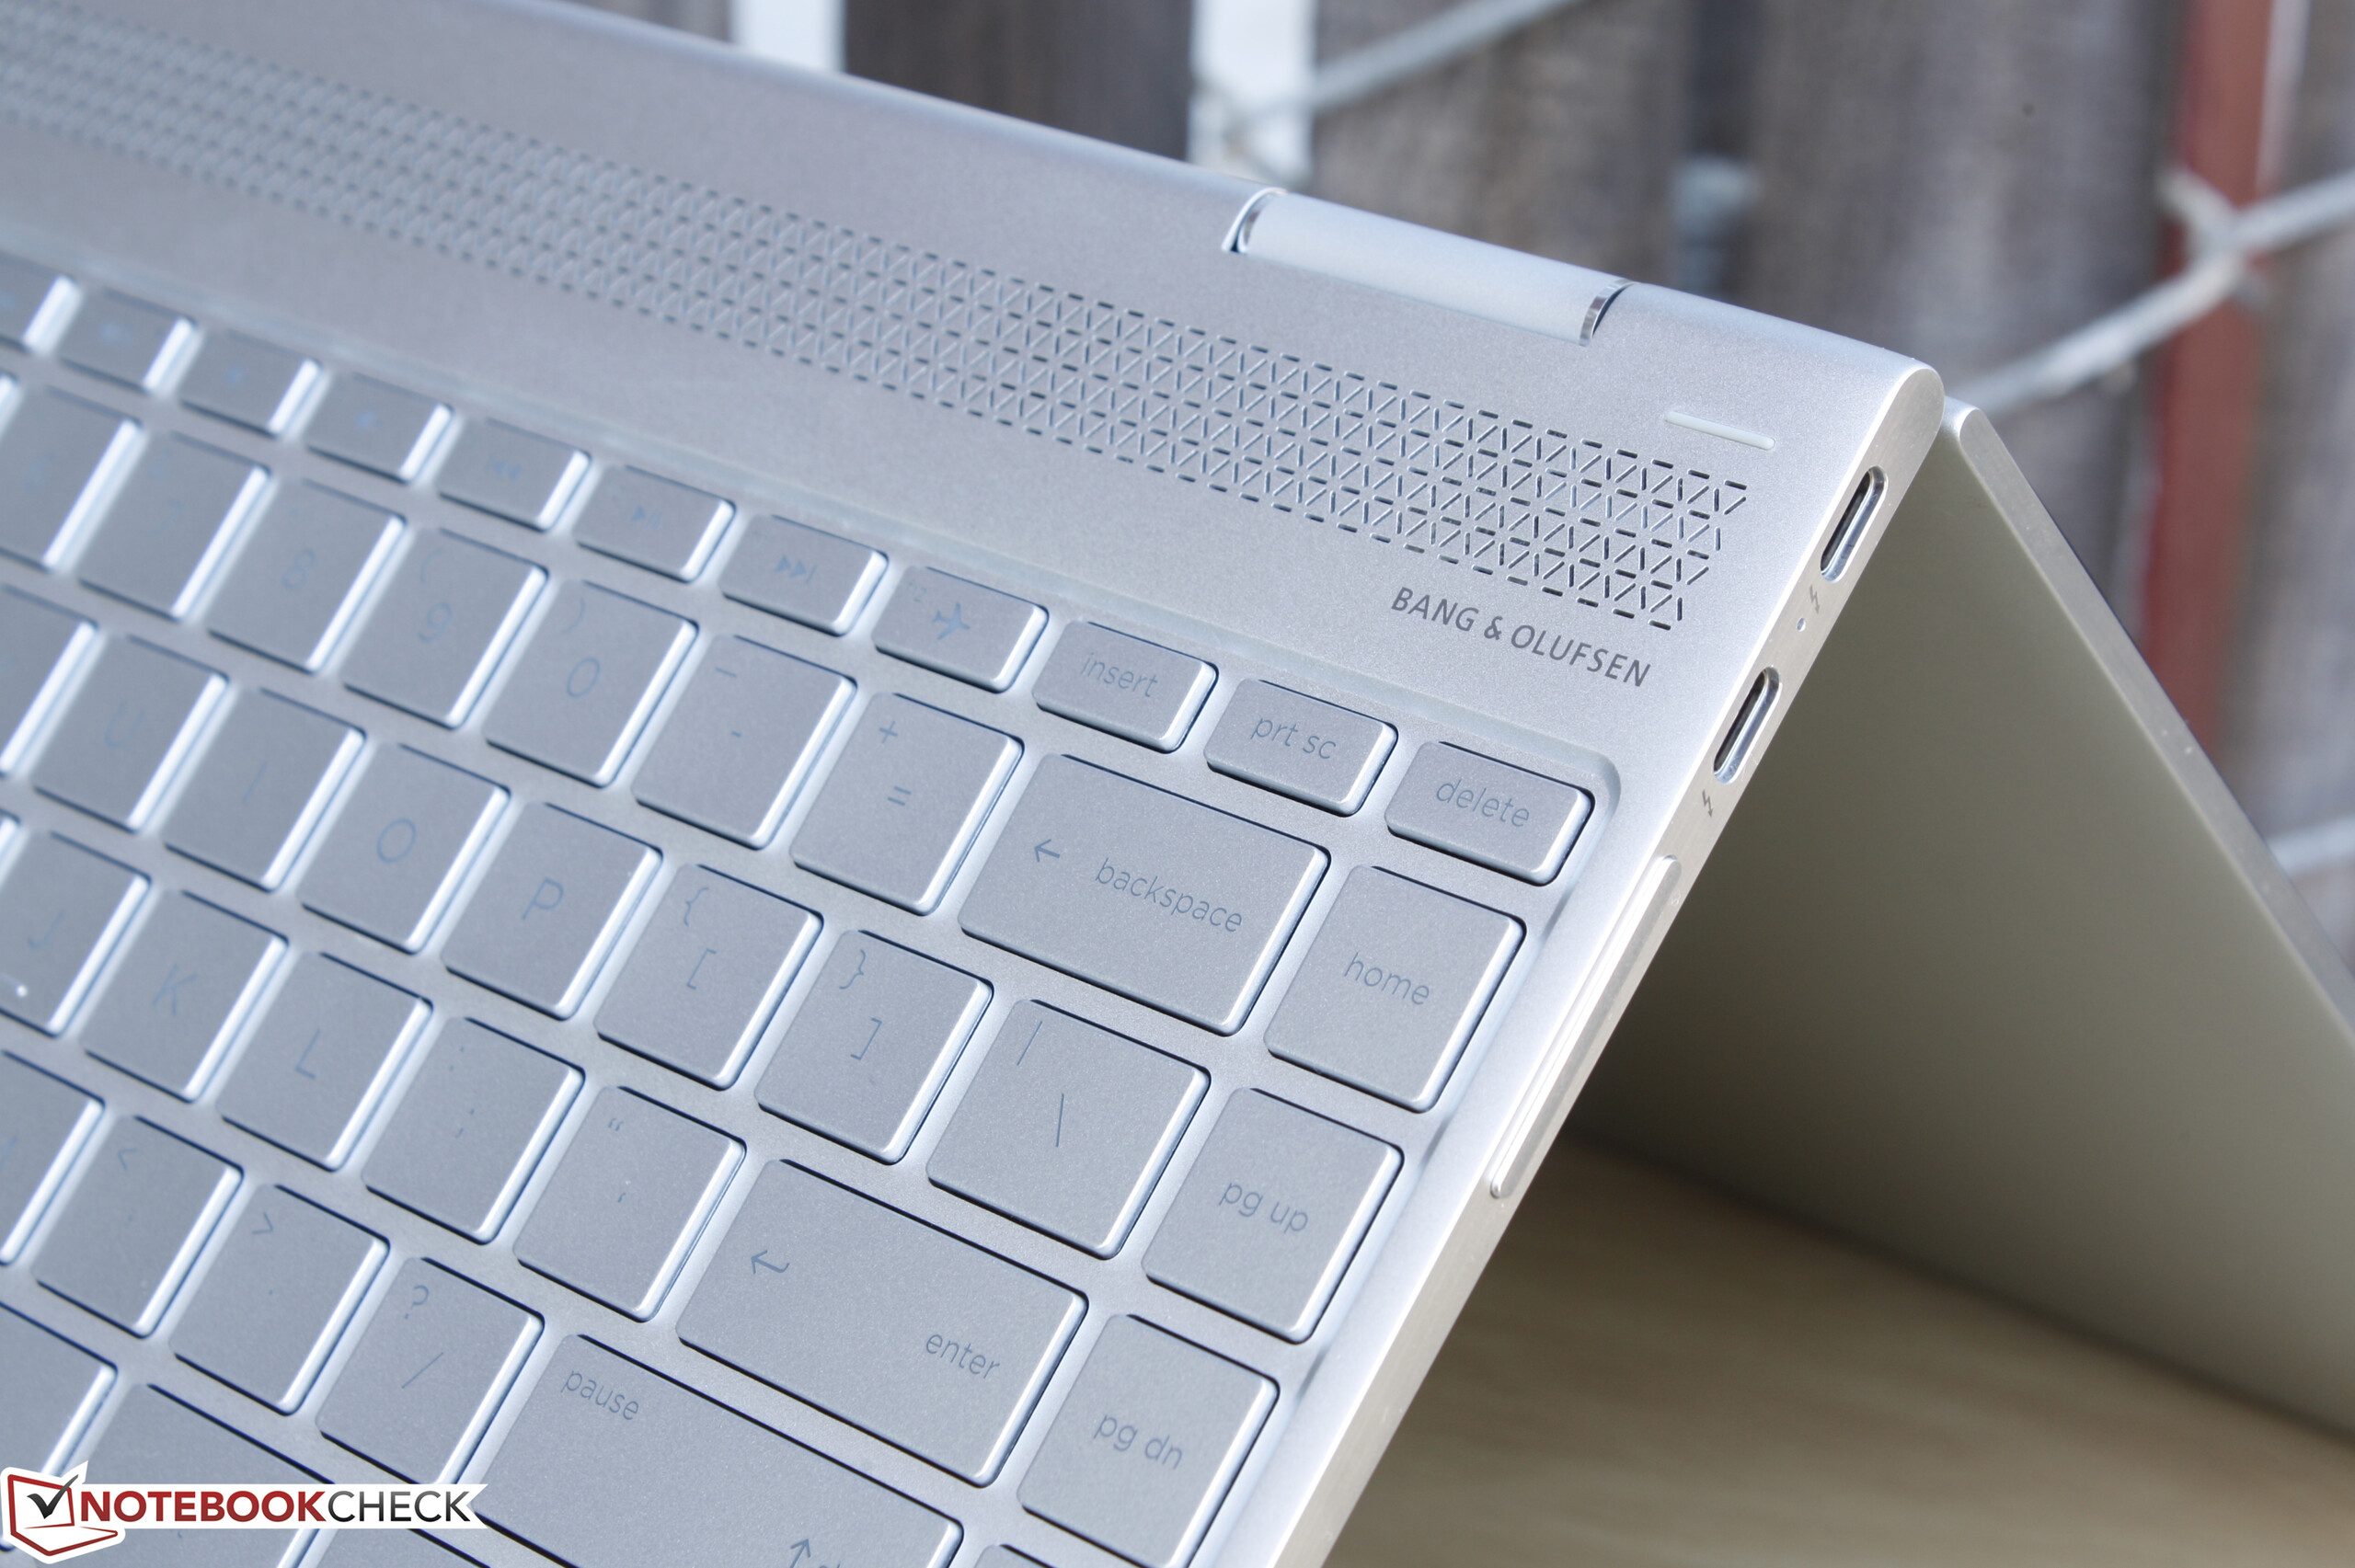
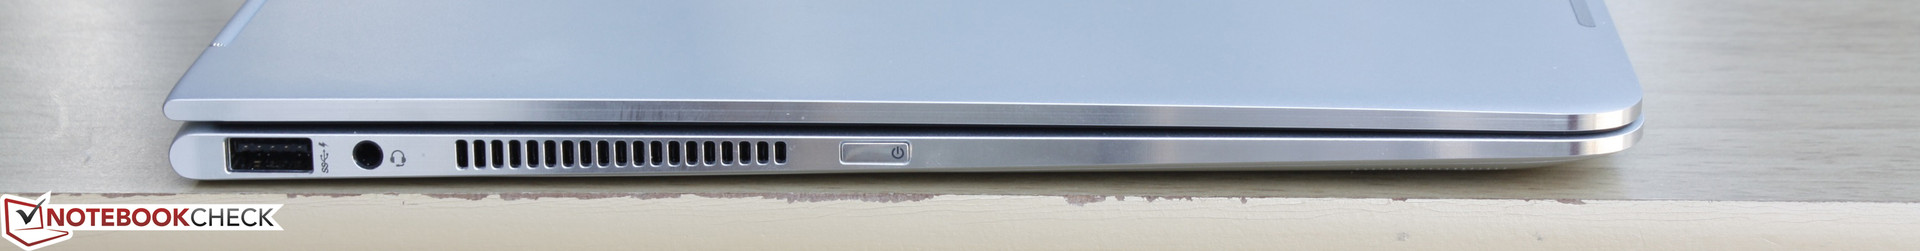
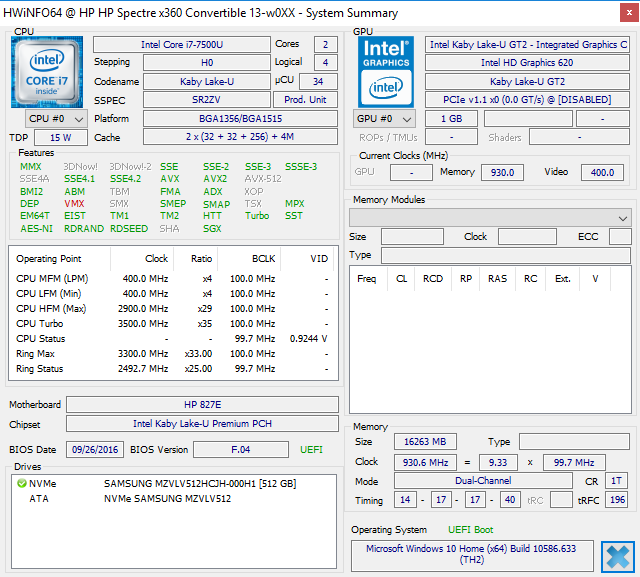
A extrema portabilidade e versatilidade do conversível da HP vem com o sacrifício de recursos, inclusive de um leitor de MicroSD ou algum tipo de dongle para o suporte de HDMI/VGA teria sido elogiado. O teclado, embora adequado, não se compara com o do XPS 13 ou o da série ThinkPad Yoga da Lenovo em termos de resposta e deslocamento. Seu potencial muito fraco do Turbo Boost significa que o desempenho do processador é mais lento que o esperado do i7-7500U, portanto, seu poder pleno infelizmente não é utilizado neste sistema.
A HP tomou uma perspectiva de barebones com o novo Spectre e achamos que isto é melhor considerando que o conversível tem como alvo usuários de Ultrabooks e MacBook Air. Não podemos esperar para ver o fabricante aplicar o mesmo conceito de marcos finos à sua série Spectre x360 15.
O Spectre x360 13 é suficientemente poderoso para ser um portátil multimídia, enquanto é leve e portável o suficiente para agir como um tablet Windows ocasional. O seu design menor mais recente permite que o conversível seja o melhor de ambos os mundos, mais apto que a concorrência atual.
HP Spectre x360 13-w023dx
-
10/20/2016 v5.1(old)
Allen Ngo
Pricecompare
