 Deutsch
 English
 Español
 Français
 Italiano
 Nederlands
 Polski
 Português
 Русский
 Türkçe
 Svenska
 Chinese
 Magyar
Breve Análise do Conversível Lenovo Yoga 920-13IKB (i7-8550U, FHD)
| SD Card Reader | |
| maximum SDCardreader Maximum Transfer Rate | |
| average SDCardreader Average Transfer Rate |
| Networking | |
| iperf3 transmit AX12 | |
| Asus ZenBook Flip S UX370 | |
| Lenovo Yoga 920-13IKB-80Y7 | |
| Dell Latitude 5289 | |
| Dell XPS 13-9365 2-in-1 | |
| iperf3 receive AX12 | |
| Lenovo Yoga 920-13IKB-80Y7 | |
| Dell Latitude 5289 | |
| Asus ZenBook Flip S UX370 | |
| Dell XPS 13-9365 2-in-1 | |
| |||||||||||||||||||||||||
iluminação: 81 %
iluminação com acumulador: 297.9 cd/m²
Contraste: 677:1 (Preto: 0.44 cd/m²)
ΔE Color 5.1 | 0.5-29.43 Ø5
ΔE Greyscale 6.7 | 0.57-98 Ø5.3
91.7% sRGB (Argyll 1.6.3 3D)
64.1% AdobeRGB 1998 (Argyll 1.6.3 3D)
64.1% AdobeRGB 1998 (Argyll 2.2.0 3D)
91.7% sRGB (Argyll 2.2.0 3D)
62.5% Display P3 (Argyll 2.2.0 3D)
Gamma: 2.9
| Lenovo Yoga 920-13IKB-80Y7 AU Optronics B139HAN03.0, IPS, 13.90, 1920x1080 | Dell XPS 13-9365 2-in-1 IPS, 13.30, 1920x1080 | HP Spectre x360 13-w023dx Chi Mei CMN1367, IPS, 13.30, 1920x1080 | Asus ZenBook Flip S UX370 AUO B133HAN04.2, a-Si TFT-LCD, WLED, 13.30, 1920x1080 | Dell Latitude 5289 BOE NV12N51, IPS LED, 12.50, 1920x1080 | HP Spectre x360 13-ac033dx LG Philips LGD054D, IPS, 13.30, 3840x2160 | |
|---|---|---|---|---|---|---|
| Display | -23% | 2% | 0% | -31% | 9% | |
| Display P3 Coverage | 62.5 | 47.32 -24% | 65.4 5% | 64 2% | 42.79 -32% | 69.4 11% |
| sRGB Coverage | 91.7 | 71.1 -22% | 90.4 -1% | 90 -2% | 64.3 -30% | 96.8 6% |
| AdobeRGB 1998 Coverage | 64.1 | 48.83 -24% | 65.8 3% | 64.9 1% | 44.21 -31% | 71.1 11% |
| Response Times | -4% | 20% | 6% | 6% | 4% | |
| Response Time Grey 50% / Grey 80% * | 46 ? | 48 ? -4% | 33.2 ? 28% | 44 ? 4% | 42 ? 9% | 42 ? 9% |
| Response Time Black / White * | 31.6 ? | 32.8 ? -4% | 28 ? 11% | 29 ? 8% | 31 ? 2% | 32 ? -1% |
| PWM Frequency | 1042 ? | 531 ? | ||||
| Screen | 11% | 5% | 26% | 18% | 30% | |
| Brightness middle | 297.9 | 322.6 8% | 334.6 12% | 334 12% | 336 13% | 302.6 2% |
| Brightness | 278 | 306 10% | 319 15% | 321 15% | 320 15% | 282 1% |
| Brightness Distribution | 81 | 91 12% | 90 11% | 86 6% | 90 11% | 83 2% |
| Black Level * | 0.44 | 0.19 57% | 0.336 24% | 0.25 43% | 0.34 23% | 0.25 43% |
| Contrast | 677 | 1698 151% | 996 47% | 1336 97% | 988 46% | 1210 79% |
| Colorchecker dE 2000 * | 5.1 | 7.7 -51% | 6.21 -22% | 4.24 17% | 3.45 32% | 2.4 53% |
| Colorchecker dE 2000 max. * | 11 | 11.1 -1% | 12 -9% | 6.03 45% | 7.95 28% | 4.9 55% |
| Greyscale dE 2000 * | 6.7 | 7.9 -18% | 7.71 -15% | 3.92 41% | 1.68 75% | 2.8 58% |
| Gamma | 2.9 76% | 2.88 76% | 2.36 93% | 2.68 82% | 2.49 88% | 2.2 100% |
| CCT | 6839 95% | 7044 92% | 6458 101% | 6758 96% | 6782 96% | 6333 103% |
| Color Space (Percent of AdobeRGB 1998) | 64.1 | 44.1 -31% | 58.6 -9% | 58 -10% | 41 -36% | 65.5 2% |
| Color Space (Percent of sRGB) | 91.7 | 69.9 -24% | 90 -2% | 90 -2% | 64 -30% | 97.1 6% |
| Total Average (Program / Settings) | -5% /
2% | 9% /
7% | 11% /
18% | -2% /
6% | 14% /
22% |
* ... smaller is better
Display Response Times
| ↔ Response Time Black to White | ||
|---|---|---|
| 31.6 ms ... rise ↗ and fall ↘ combined | ↗ 18.4 ms rise | 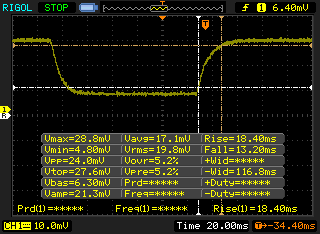 |
| ↘ 13.2 ms fall | ||
| The screen shows slow response rates in our tests and will be unsatisfactory for gamers. In comparison, all tested devices range from 0.1 (minimum) to 240 (maximum) ms. » 83 % of all devices are better. This means that the measured response time is worse than the average of all tested devices (21.5 ms). | ||
| ↔ Response Time 50% Grey to 80% Grey | ||
| 46 ms ... rise ↗ and fall ↘ combined | ↗ 20.8 ms rise | 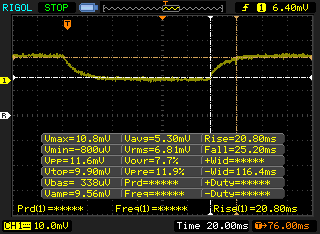 |
| ↘ 25.2 ms fall | ||
| The screen shows slow response rates in our tests and will be unsatisfactory for gamers. In comparison, all tested devices range from 0.2 (minimum) to 636 (maximum) ms. » 76 % of all devices are better. This means that the measured response time is worse than the average of all tested devices (33.7 ms). | ||
Screen Flickering / PWM (Pulse-Width Modulation)
| Screen flickering / PWM not detected | 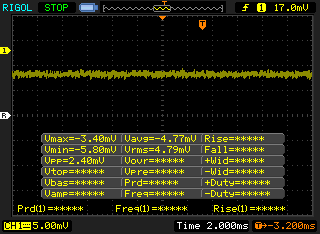 | ||
In comparison: 53 % of all tested devices do not use PWM to dim the display. If PWM was detected, an average of 17900 (minimum: 5 - maximum: 3846000) Hz was measured. | |||
| Cinebench R10 | |
| Rendering Multiple CPUs 32Bit | |
| Dell XPS 13 i7-8550U | |
| Lenovo Yoga 920-13IKB-80Y7 | |
| HP Spectre x360 13-w023dx | |
| Asus ZenBook Flip S UX370 | |
| Dell XPS 13-9365 2-in-1 | |
| Rendering Single 32Bit | |
| Lenovo Yoga 920-13IKB-80Y7 | |
| HP Spectre x360 13-w023dx | |
| Dell XPS 13 i7-8550U | |
| Dell XPS 13-9365 2-in-1 | |
| Asus ZenBook Flip S UX370 | |
| wPrime 2.10 - 1024m | |
| Dell XPS 13-9365 2-in-1 | |
| HP Spectre x360 13-w023dx | |
| Lenovo Yoga 920-13IKB-80Y7 | |
* ... smaller is better
| PCMark 8 Home Score Accelerated v2 | 3999 pontos | |
| PCMark 8 Creative Score Accelerated v2 | 5342 pontos | |
| PCMark 8 Work Score Accelerated v2 | 5154 pontos | |
| PCMark 10 Score | 4012 pontos | |
Ajuda | ||
| Lenovo Yoga 920-13IKB-80Y7 Samsung PM961 MZVLW256HEHP | Dell XPS 13-9365 2-in-1 Toshiba NVMe THNSN5256GPUK | HP Spectre x360 13-w023dx Samsung PM951 NVMe MZVLV512 | Asus ZenBook Flip S UX370 SanDisk SD8SN8U256G1002 | Dell Latitude 5289 SanDisk X400 256GB, SATA (SD8SB8U-256G) | HP Spectre x360 13-ac033dx Samsung PM961 NVMe MZVLW512HMJP | |
|---|---|---|---|---|---|---|
| CrystalDiskMark 3.0 | -35% | -25% | -59% | -67% | 1% | |
| Write 4k QD32 | 573 | 250.2 -56% | 361.2 -37% | 170.8 -70% | 158.8 -72% | 225.6 -61% |
| Read 4k QD32 | 432.9 | 411 -5% | 535 24% | 385.4 -11% | 306.2 -29% | 518 20% |
| Write 4k | 142.4 | 121.2 -15% | 137.9 -3% | 57 -60% | 27.92 -80% | 139.4 -2% |
| Read 4k | 56.2 | 32.93 -41% | 42.66 -24% | 29.7 -47% | 22.73 -60% | 54.7 -3% |
| Write 512 | 832 | 410.7 -51% | 571 -31% | 291.5 -65% | 255.6 -69% | 1229 48% |
| Read 512 | 1252 | 966 -23% | 679 -46% | 315.7 -75% | 260.8 -79% | 865 -31% |
| Write Seq | 1125 | 629 -44% | 571 -49% | 432.5 -62% | 406.4 -64% | 1550 38% |
| Read Seq | 2070 | 1206 -42% | 1376 -34% | 455.9 -78% | 423.7 -80% | 2065 0% |

| 3DMark 11 Performance | 1915 pontos | |
| 3DMark Ice Storm Standard Score | 74895 pontos | |
| 3DMark Cloud Gate Standard Score | 8519 pontos | |
| 3DMark Fire Strike Score | 1052 pontos | |
| 3DMark Fire Strike Extreme Score | 489 pontos | |
Ajuda | ||
| BioShock Infinite | |
| 1920x1080 Ultra Preset, DX11 (DDOF) (sort by value) | |
| Lenovo Yoga 920-13IKB-80Y7 | |
| Asus ZenBook Flip S UX370 | |
| Dell XPS 13 i7-8550U | |
| HP Envy 13-ad006ng | |
| Dell XPS 13 9360 FHD i7 Iris | |
| 1366x768 High Preset (sort by value) | |
| Lenovo Yoga 920-13IKB-80Y7 | |
| Asus ZenBook Flip S UX370 | |
| Dell XPS 13 i7-8550U | |
| HP Envy 13-ad006ng | |
| Dell XPS 13 9360 FHD i7 Iris | |
| Rise of the Tomb Raider | |
| 1920x1080 High Preset AA:FX AF:4x (sort by value) | |
| Lenovo Yoga 920-13IKB-80Y7 | |
| Asus ZenBook Flip S UX370 | |
| Dell XPS 13 i7-8550U | |
| HP Envy 13-ad006ng | |
| 1366x768 Medium Preset AF:2x (sort by value) | |
| Lenovo Yoga 920-13IKB-80Y7 | |
| Asus ZenBook Flip S UX370 | |
| Dell XPS 13 i7-8550U | |
| HP Envy 13-ad006ng | |
| baixo | média | alto | ultra | |
| BioShock Infinite (2013) | 67.1 | 36.2 | 30.5 | 10.1 |
| Rise of the Tomb Raider (2016) | 22.9 | 12.7 | 6.8 |
Barulho
| Ocioso |
| 28 / 28.8 / 30.3 dB |
| Carga |
| 34.5 / 34.3 dB |
 | ||
30 dB silencioso 40 dB(A) audível 50 dB(A) ruidosamente alto |
||
min: | ||
| Lenovo Yoga 920-13IKB-80Y7 UHD Graphics 620, i5-8550U, Samsung PM961 MZVLW256HEHP | HP Spectre x360 13-w023dx HD Graphics 620, i7-7500U, Samsung PM951 NVMe MZVLV512 | Asus ZenBook Flip S UX370 HD Graphics 620, i5-7200U, SanDisk SD8SN8U256G1002 | Dell Latitude 5289 HD Graphics 620, i5-7300U, SanDisk X400 256GB, SATA (SD8SB8U-256G) | HP Spectre x360 13-ac033dx HD Graphics 620, i7-7500U, Samsung PM961 NVMe MZVLW512HMJP | Lenovo Yoga 910-13IKB-80VF004CGE HD Graphics 620, i7-7500U, Samsung PM951 NVMe MZVLV512 | |
|---|---|---|---|---|---|---|
| Noise | -6% | -3% | -5% | -10% | -9% | |
| off / environment * | 28 | 29.1 -4% | 30.5 -9% | 30.5 -9% | 28.7 -3% | 31.7 -13% |
| Idle Minimum * | 28 | 29.1 -4% | 30.5 -9% | 30.5 -9% | 28.7 -3% | 31.7 -13% |
| Idle Average * | 28.8 | 29.1 -1% | 30.5 -6% | 30.5 -6% | 34.2 -19% | 31.7 -10% |
| Idle Maximum * | 30.3 | 31.2 -3% | 30.5 -1% | 30.5 -1% | 35.8 -18% | 31.7 -5% |
| Load Average * | 34.5 | 37.3 -8% | 34.2 1% | 36 -4% | 35.8 -4% | 38.4 -11% |
| Load Maximum * | 34.3 | 39.6 -15% | 32.5 5% | 34.6 -1% | 39.6 -15% | 34.7 -1% |
* ... smaller is better
(±) The maximum temperature on the upper side is 44.4 °C / 112 F, compared to the average of 35.3 °C / 96 F, ranging from 19.6 to 55.7 °C for the class Convertible.
(±) The bottom heats up to a maximum of 42.8 °C / 109 F, compared to the average of 36.8 °C / 98 F
(+) In idle usage, the average temperature for the upper side is 20.8 °C / 69 F, compared to the device average of 30.2 °C / 86 F.
(+) The palmrests and touchpad are cooler than skin temperature with a maximum of 31.8 °C / 89.2 F and are therefore cool to the touch.
(-) The average temperature of the palmrest area of similar devices was 28.1 °C / 82.6 F (-3.7 °C / -6.6 F).
Lenovo Yoga 920-13IKB-80Y7 audio analysis
(-) | not very loud speakers (65.7 dB)
Bass 100 - 315 Hz
(±) | reduced bass - on average 14.7% lower than median
(-) | bass is not linear (15.7% delta to prev. frequency)
Mids 400 - 2000 Hz
(+) | balanced mids - only 2.3% away from median
(+) | mids are linear (5.5% delta to prev. frequency)
Highs 2 - 16 kHz
(+) | balanced highs - only 2.9% away from median
(+) | highs are linear (6.8% delta to prev. frequency)
Overall 100 - 16.000 Hz
(±) | linearity of overall sound is average (18.5% difference to median)
Compared to same class
» 35% of all tested devices in this class were better, 9% similar, 56% worse
» The best had a delta of 6%, average was 21%, worst was 57%
Compared to all devices tested
» 36% of all tested devices were better, 8% similar, 56% worse
» The best had a delta of 4%, average was 25%, worst was 134%
Apple MacBook 12 (Early 2016) 1.1 GHz audio analysis
(+) | speakers can play relatively loud (83.6 dB)
Bass 100 - 315 Hz
(±) | reduced bass - on average 11.3% lower than median
(±) | linearity of bass is average (14.2% delta to prev. frequency)
Mids 400 - 2000 Hz
(+) | balanced mids - only 2.4% away from median
(+) | mids are linear (5.5% delta to prev. frequency)
Highs 2 - 16 kHz
(+) | balanced highs - only 2% away from median
(+) | highs are linear (4.5% delta to prev. frequency)
Overall 100 - 16.000 Hz
(+) | overall sound is linear (10.2% difference to median)
Compared to same class
» 5% of all tested devices in this class were better, 2% similar, 93% worse
» The best had a delta of 5%, average was 19%, worst was 53%
Compared to all devices tested
» 3% of all tested devices were better, 1% similar, 96% worse
» The best had a delta of 4%, average was 25%, worst was 134%
| desligado | |
| Ocioso | |
| Carga |
|
| Lenovo Yoga 920-13IKB-80Y7 i5-8550U, UHD Graphics 620, Samsung PM961 MZVLW256HEHP, IPS, 1920x1080, 13.90 | HP Spectre x360 13-w023dx i7-7500U, HD Graphics 620, Samsung PM951 NVMe MZVLV512, IPS, 1920x1080, 13.30 | Asus ZenBook Flip S UX370 i5-7200U, HD Graphics 620, SanDisk SD8SN8U256G1002, a-Si TFT-LCD, WLED, 1920x1080, 13.30 | HP Spectre x360 13-ac033dx i7-7500U, HD Graphics 620, Samsung PM961 NVMe MZVLW512HMJP, IPS, 3840x2160, 13.30 | Lenovo Yoga 910-13IKB-80VF004CGE i7-7500U, HD Graphics 620, Samsung PM951 NVMe MZVLV512, IPS, 3840x2160, 13.90 | Dell XPS 13-9365 2-in-1 i7-7Y75, HD Graphics 615, Toshiba NVMe THNSN5256GPUK, IPS, 1920x1080, 13.30 | Dell XPS 13 i7-8550U i5-8550U, UHD Graphics 620, Toshiba XG5 KXG50ZNV256G, IGZO IPS, 3200x1800, 13.30 | |
|---|---|---|---|---|---|---|---|
| Power Consumption | -15% | 11% | -32% | -8% | 26% | -9% | |
| Idle Minimum * | 3.1 | 5.5 -77% | 2.6 16% | 5.3 -71% | 4.3 -39% | 3.1 -0% | 4.1 -32% |
| Idle Average * | 6.6 | 6.7 -2% | 5.3 20% | 9.6 -45% | 6.3 5% | 4.3 35% | 5.8 12% |
| Idle Maximum * | 7 | 7.1 -1% | 8.5 -21% | 10.1 -44% | 9 -29% | 4.9 30% | 6 14% |
| Load Average * | 35.2 | 33.1 6% | 29 18% | 34.4 2% | 32.7 7% | 24.3 31% | 42.5 -21% |
| Load Maximum * | 34.6 | 35.2 -2% | 27 22% | 34.8 -1% | 28.8 17% | 22.8 34% | 41.4 -20% |
* ... smaller is better
| Lenovo Yoga 920-13IKB-80Y7 i5-8550U, UHD Graphics 620, 70 Wh | HP Spectre x360 13-w023dx i7-7500U, HD Graphics 620, 57.8 Wh | Asus ZenBook Flip S UX370 i5-7200U, HD Graphics 620, 39 Wh | Dell Latitude 5289 i5-7300U, HD Graphics 620, 60 Wh | HP Spectre x360 13-ac033dx i7-7500U, HD Graphics 620, 57.8 Wh | Lenovo Yoga 910-13IKB-80VF004CGE i7-7500U, HD Graphics 620, 78 Wh | Dell XPS 13-9365 2-in-1 i7-7Y75, HD Graphics 615, 46 Wh | |
|---|---|---|---|---|---|---|---|
| Battery Runtime | -19% | -22% | 1% | -31% | -6% | -5% | |
| Reader / Idle | 1655 | 1233 -25% | 937 -43% | 1728 4% | 792 -52% | 1069 -35% | 971 -41% |
| WiFi v1.3 | 685 | 558 -19% | 483 -29% | 708 3% | 537 -22% | 644 -6% | 686 0% |
| Load | 140 | 121 -14% | 147 5% | 136 -3% | 114 -19% | 174 24% | 175 25% |
Pro
Contra
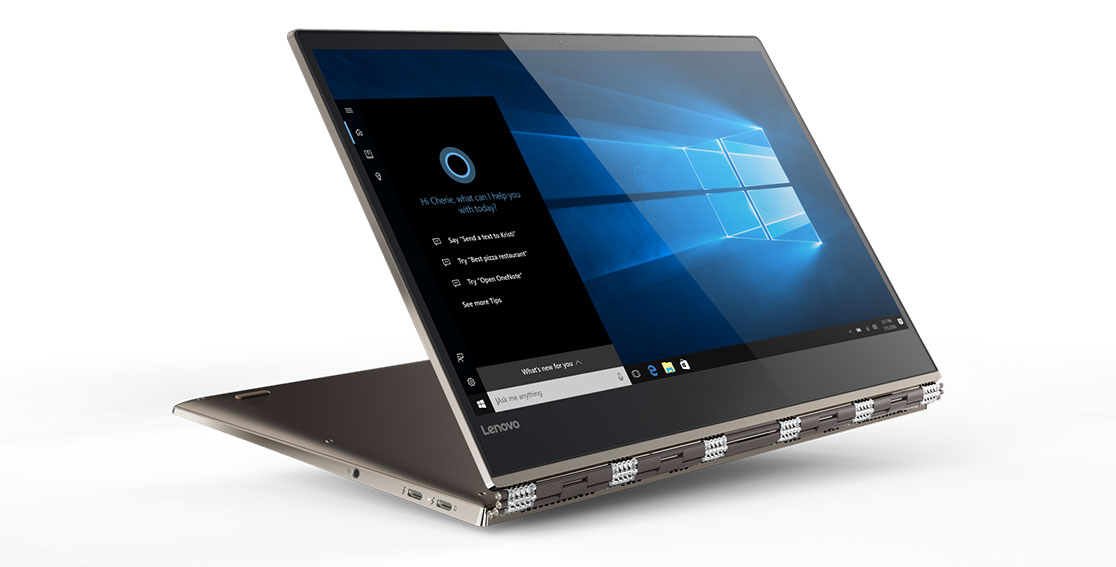
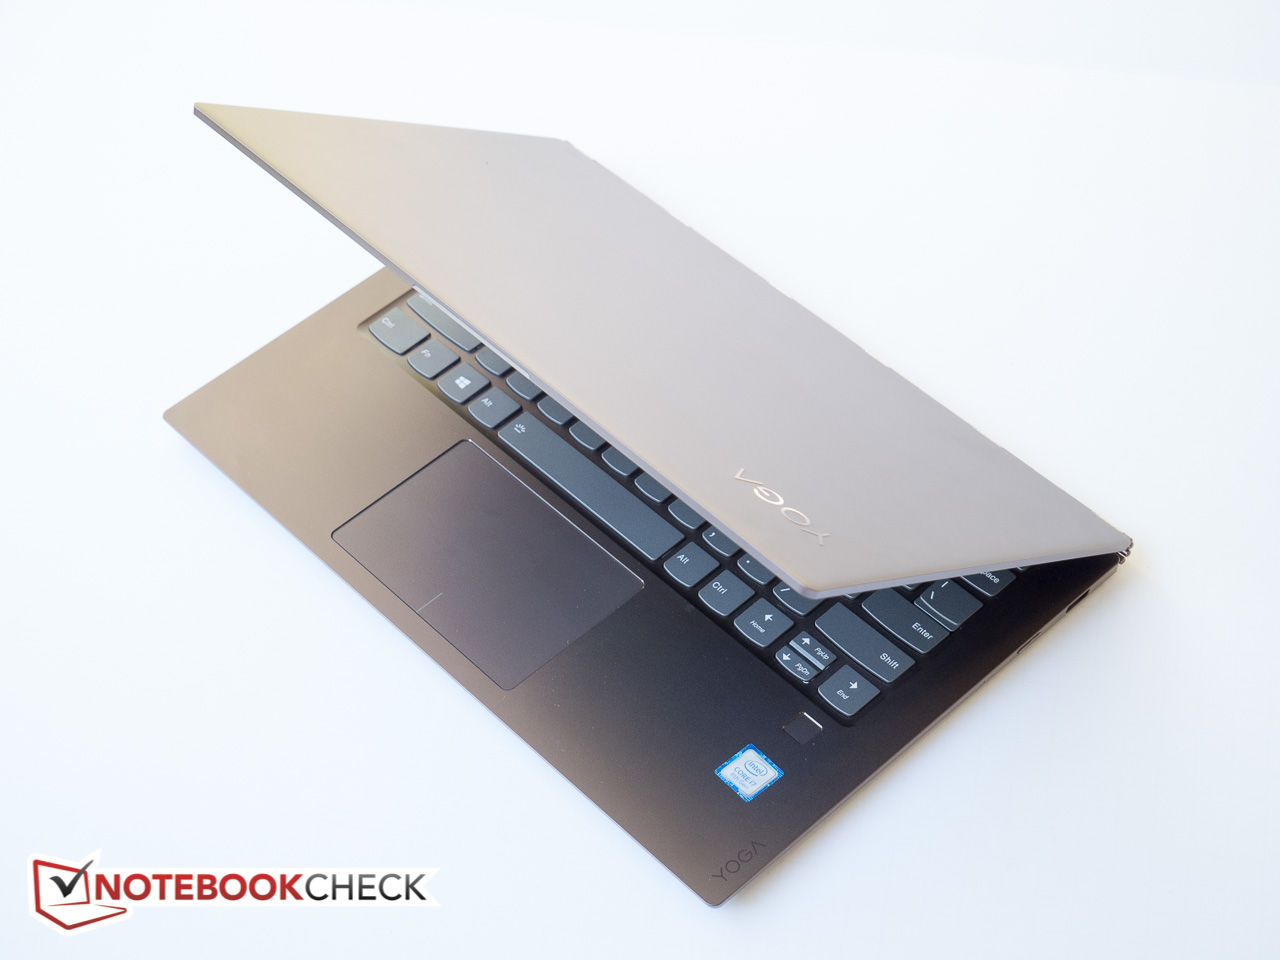
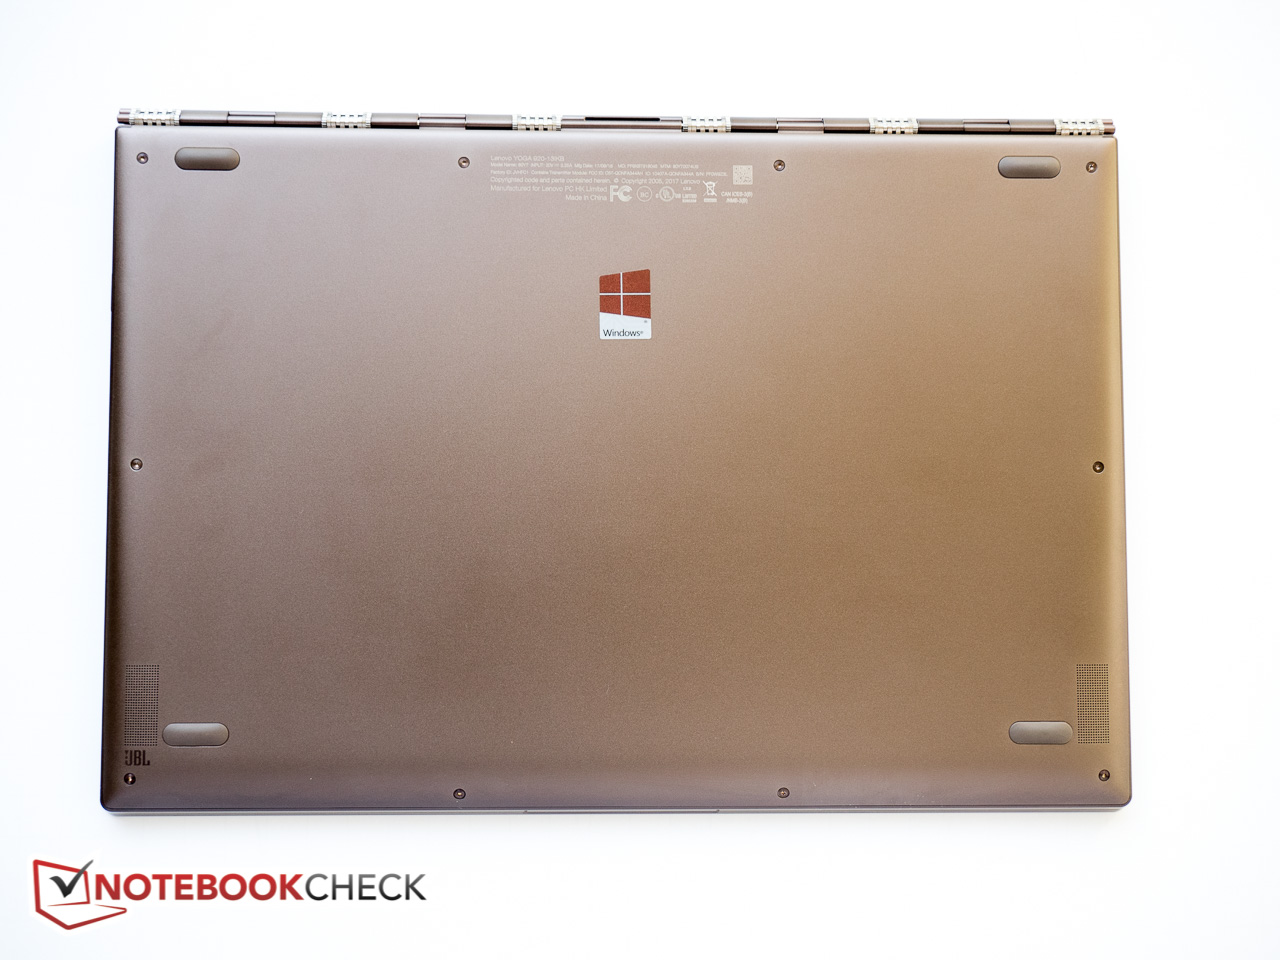
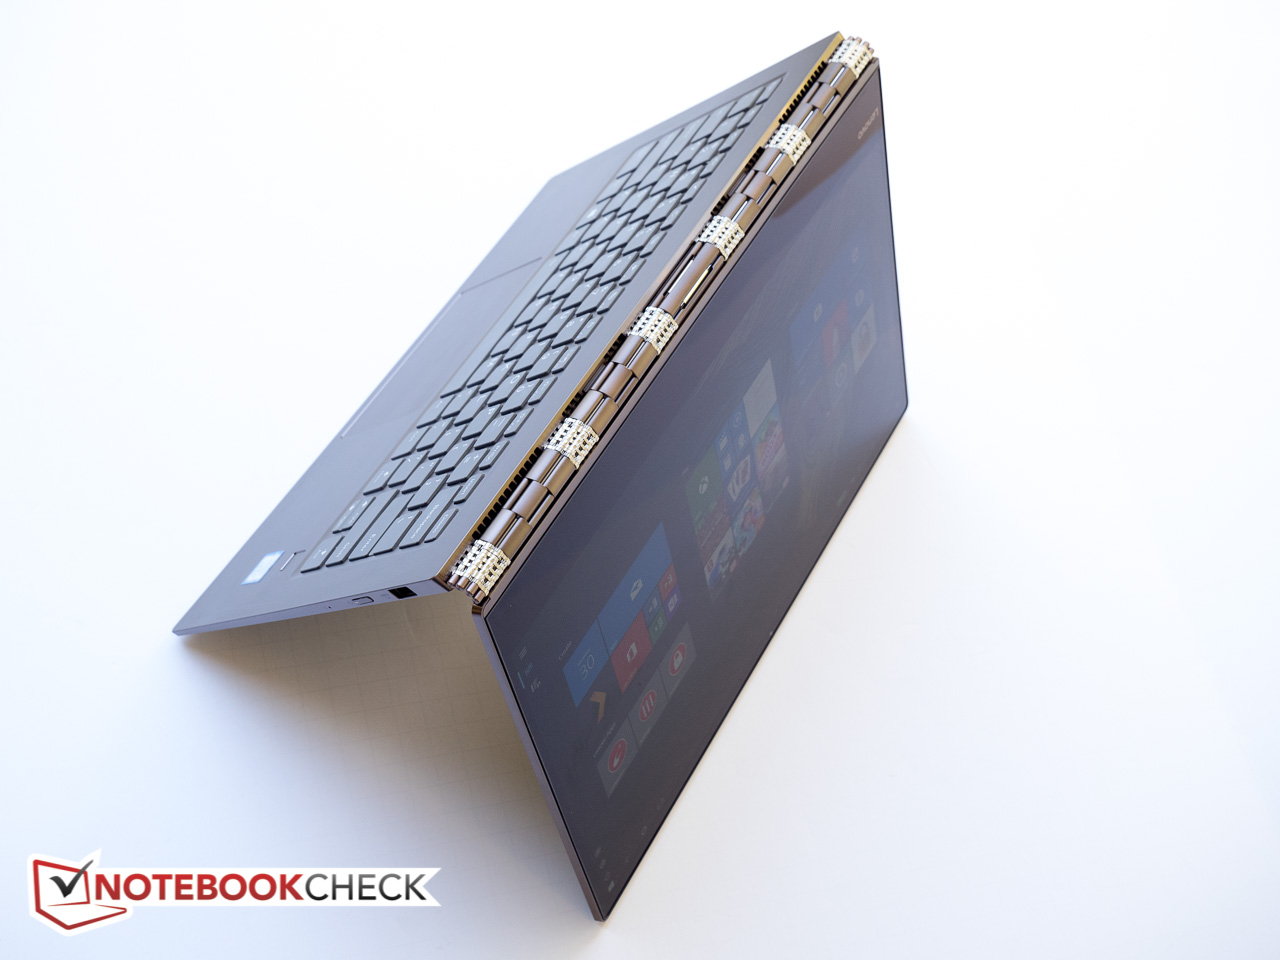
O novo e redesenhado Yoga 920 é o melhor Yoga da série 900 até agora e está longe de ser apenas uma atualização de hardware simples. O desempenho certamente está à altura da nova CPU quad-core e o SSD NVMe incrivelmente veloz, mas a Lenovo também melhorou outras áreas: o novo conversível agora possui 2 portas Thunderbolt 3, uma localização melhorada da webcam, um teclado modificado, suporta uma caneta ativa para pela primeira vez, e funciona durante mais tempo mais tempo com uma carga. A Lenovo, obviamente, levou em consideração o feedback dos clientes, o qual é agradável de se ver.
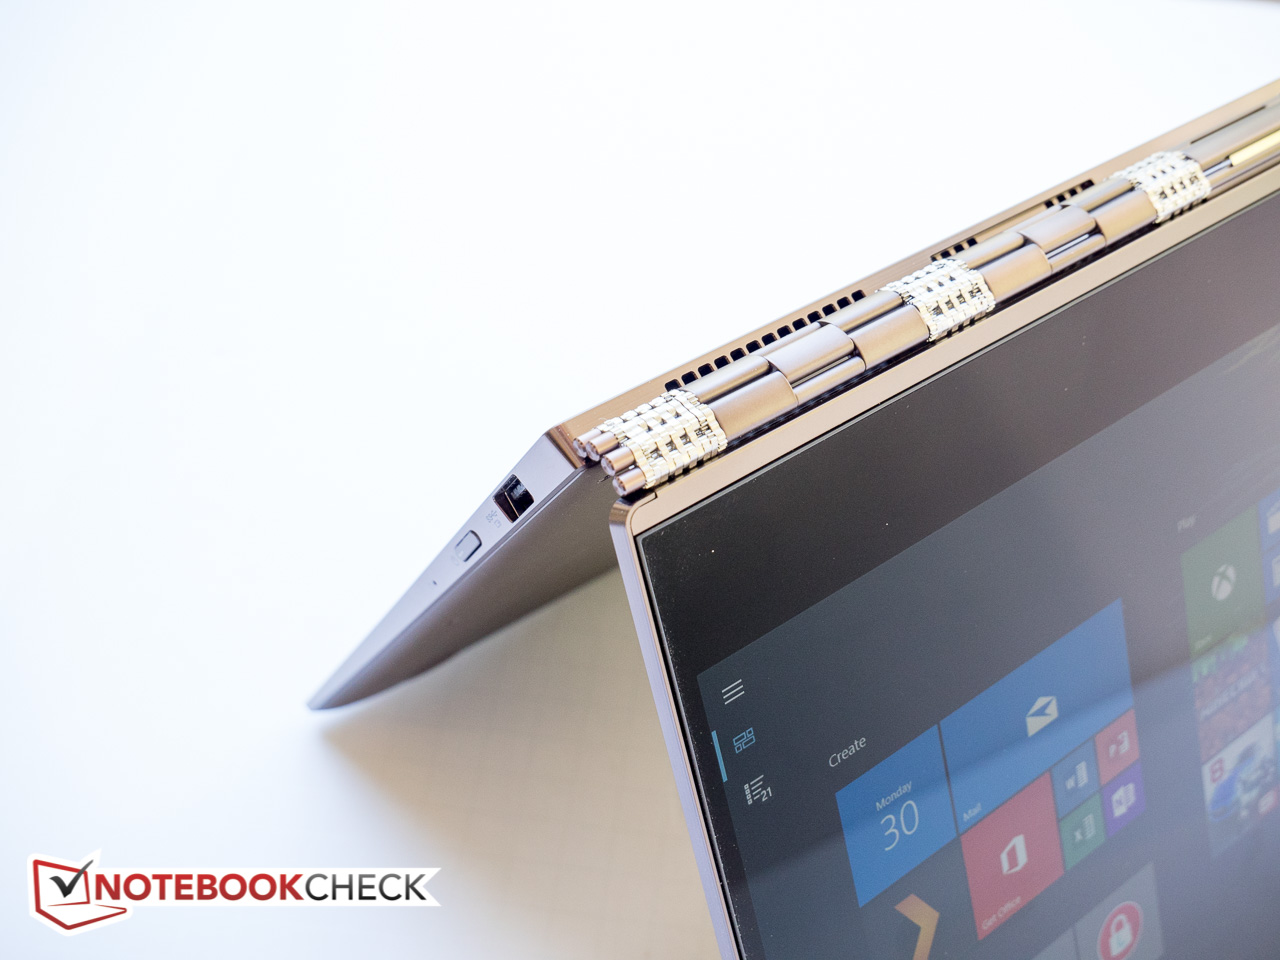
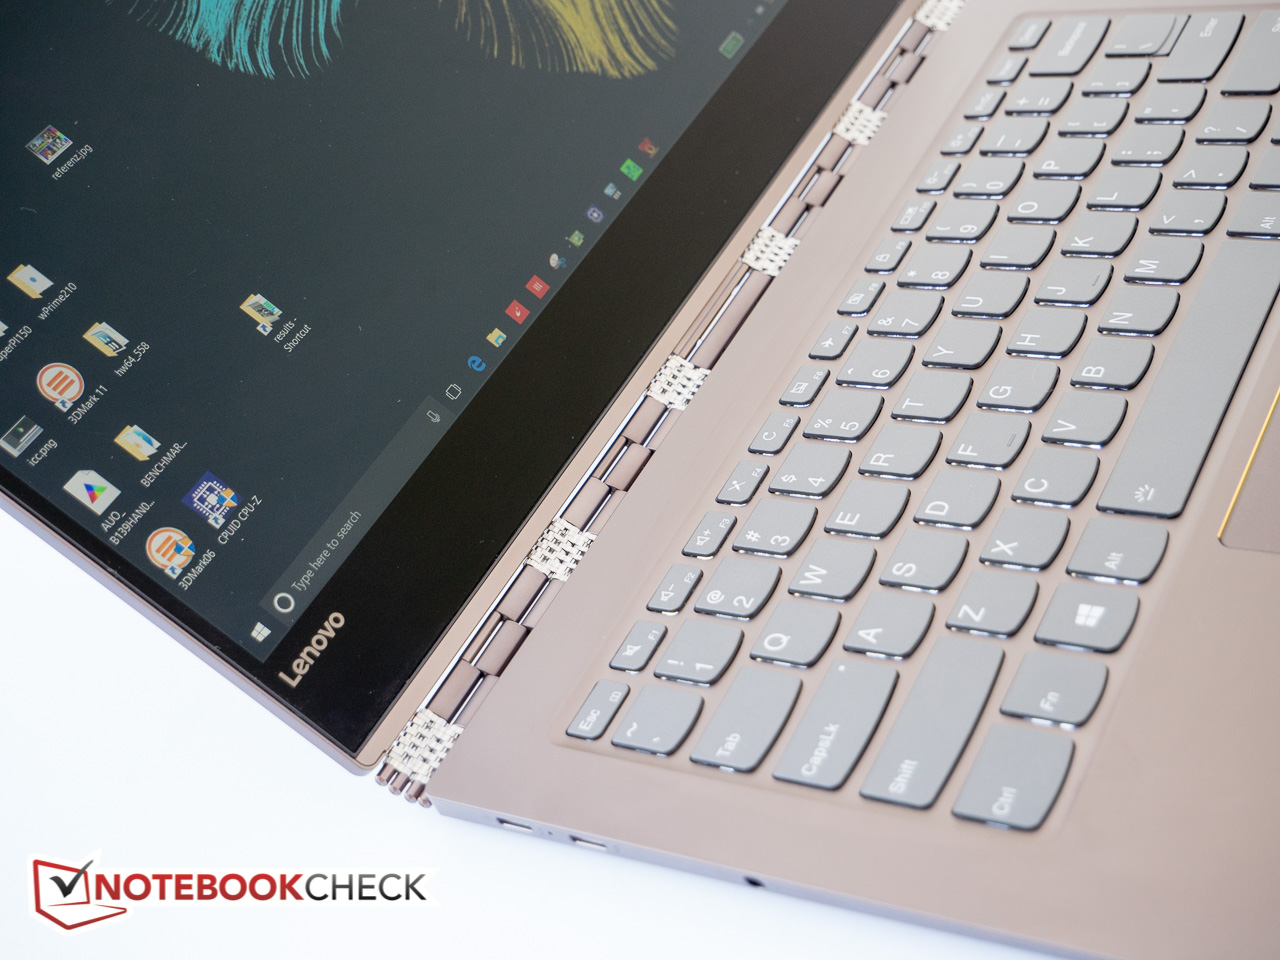
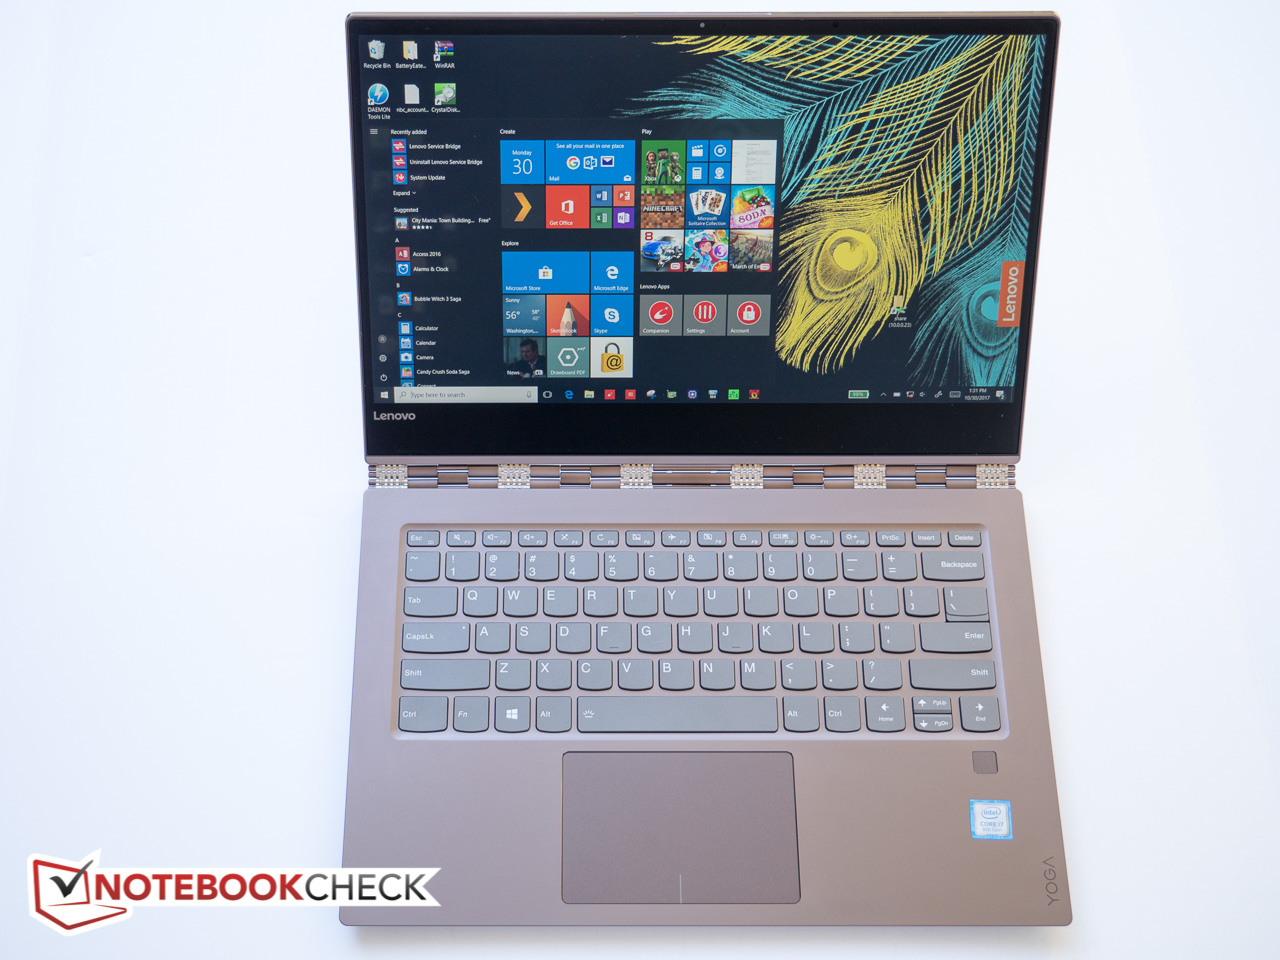
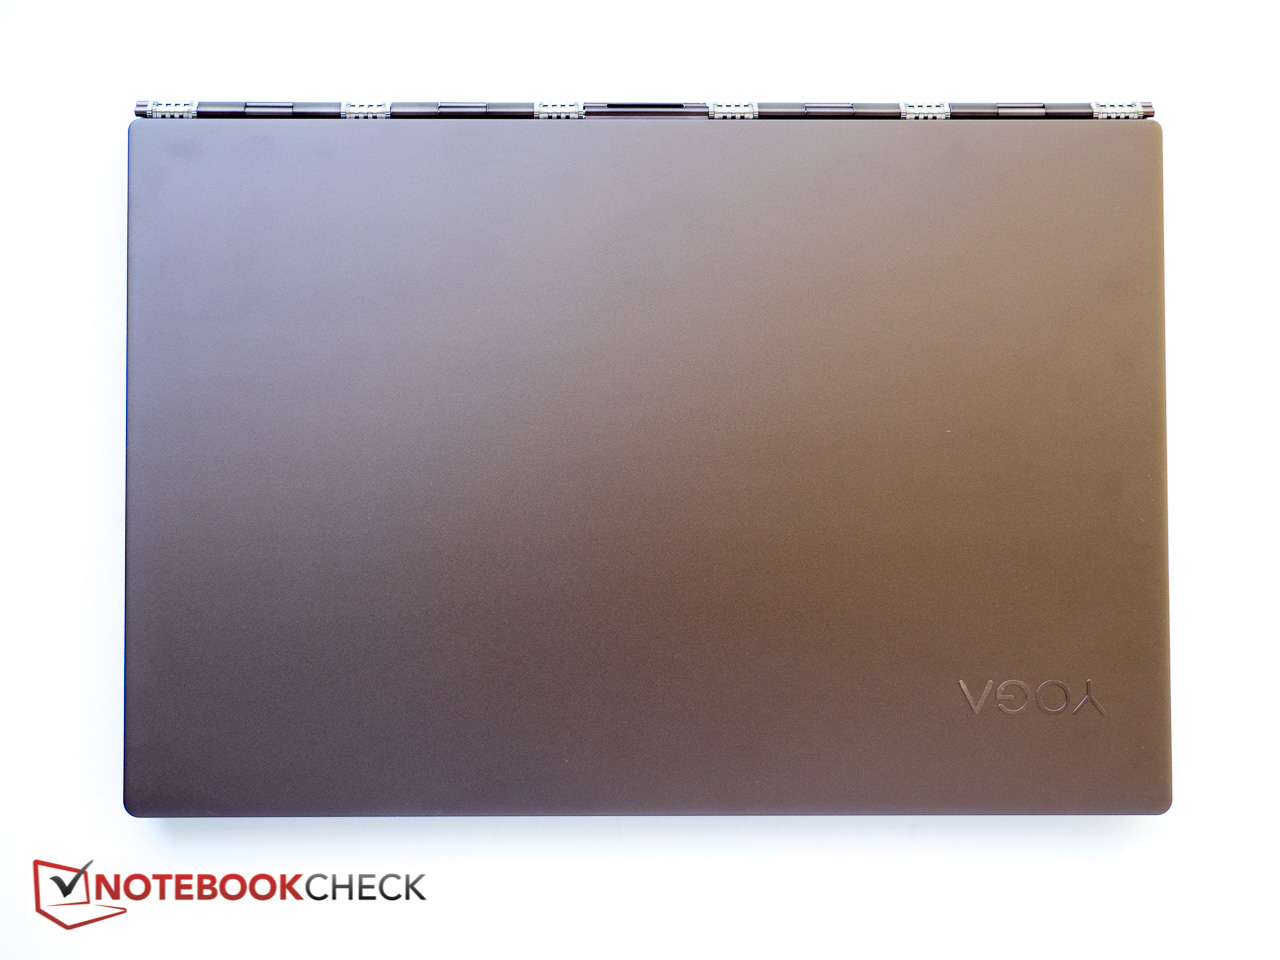
O chassi de alumínio é bonito e bastante robusto e o design watchband da dobradiça ainda atrai olhares. A tela poderia ser um pouco mais clara, e a relação de contraste e a precisão da escala de cinzas também poderiam ser melhores. Há também uma questão de tamanho: o Yoga ainda é um dos maiores conversíveis, o que não o torna fácil de segurar no modo tablet. Mesmo assim, alguns usuários podem apreciar a tela extra. A falta de um "Lift'n Lock" ao estilo ThinkPad Yoga também deixa as teclas expostas, então é necessário ter mais cuidado para evitar danos. O afogamento sob carga pesada reduz um pouco o enorme potencial de desempenho dos núcleos extras da CPU, mas o desempenho geral ainda está em alta, então não consideramos essa como uma grande desvantagem. Uma vantagem adicional: o irritante som de assobio que encontramos durante a nossa análise do antecessor, o Yoga 910, definitivamente não é mais um problema.
O Yoga 920 é um 2-em-1 atraente, muito bem projetado. Os usuários que considerem um conversível de 13,3 polegadas como o HP Spectre x360 ou o Dell XPS 13 definitivamente devem dar uma olhada no Yoga um pouco maior.
Lenovo Yoga 920-13IKB-80Y7
-
11/02/2017 v6(old)
Bernhard Pechlaner
Pricecompare
