 Deutsch
 English
 Español
 Français
 Italiano
 Nederlands
 Polski
 Português
 Русский
 Türkçe
 Svenska
 Chinese
 Magyar
Breve Análise do Nexoc G734III (Clevo P670RS-G)


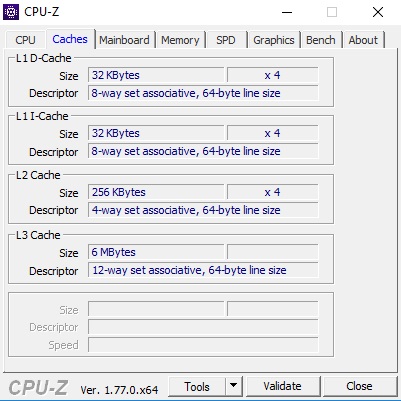
| SD Card Reader | |
| average JPG Copy Test (av. of 3 runs) | |
| MSI GT73VR-6RE16SR451 | |
| MSI GT72VR 6RE-015US | |
| Acer Predator 17 G9-793-77LG | |
| Nexoc G734III | |
| Asus G752VS-XB78K | |
| maximum AS SSD Seq Read Test (1GB) | |
| MSI GT73VR-6RE16SR451 | |
| MSI GT72VR 6RE-015US | |
| Acer Predator 17 G9-793-77LG | |
| Asus G752VS-XB78K | |
| Nexoc G734III | |
| Networking | |
| iperf Server (receive) TCP 1 m | |
| MSI GT73VR-6RE16SR451 | |
| Nexoc G734III | |
| Asus G752VS-XB78K | |
| Acer Predator 17 G9-793-77LG | |
| iperf Client (transmit) TCP 1 m | |
| Acer Predator 17 G9-793-77LG | |
| MSI GT73VR-6RE16SR451 | |
| Asus G752VS-XB78K | |
| Nexoc G734III | |
| |||||||||||||||||||||||||
iluminação: 92 %
iluminação com acumulador: 314 cd/m²
Contraste: 1121:1 (Preto: 0.28 cd/m²)
ΔE Color 4.17 | 0.5-29.43 Ø5
ΔE Greyscale 3.84 | 0.57-98 Ø5.3
86% sRGB (Argyll 1.6.3 3D)
56% AdobeRGB 1998 (Argyll 1.6.3 3D)
62.8% AdobeRGB 1998 (Argyll 2.2.0 3D)
85.8% sRGB (Argyll 2.2.0 3D)
67.4% Display P3 (Argyll 2.2.0 3D)
Gamma: 2.41
| Nexoc G734III LG Philips LP173WF4-SPD1 (LGD046C), 1920x1080 | MSI GT73VR-6RE16SR451 N173HHE-G32 (CMN1747), 1920x1080 | MSI GT72VR 6RE-015US LG Philips LGD046E, 1920x1080 | Asus G752VS-XB78K LG Philips LP173WF4-SPF3 (LGD04E8), 1920x1080 | Acer Predator 17 G9-793-77LG AU Optronics B173ZAN01.0 (AUO109B), 3840x2160 | |
|---|---|---|---|---|---|
| Display | 29% | 1% | -1% | 35% | |
| Display P3 Coverage | 67.4 | 91.2 35% | 68.3 1% | 66.9 -1% | 86.9 29% |
| sRGB Coverage | 85.8 | 100 17% | 86.7 1% | 85.2 -1% | 100 17% |
| AdobeRGB 1998 Coverage | 62.8 | 84.9 35% | 63.4 1% | 62.3 -1% | 99.4 58% |
| Response Times | 49% | -3% | -1% | -4% | |
| Response Time Grey 50% / Grey 80% * | 36 ? | 26 ? 28% | 34.4 ? 4% | 38 ? -6% | 37 ? -3% |
| Response Time Black / White * | 23 ? | 6.8 ? 70% | 25.2 ? -10% | 22 ? 4% | 24 ? -4% |
| PWM Frequency | 50 ? | ||||
| Screen | -28% | 4% | 3% | 13% | |
| Brightness middle | 314 | 314 0% | 348.7 11% | 328 4% | 336 7% |
| Brightness | 308 | 294 -5% | 327 6% | 317 3% | 320 4% |
| Brightness Distribution | 92 | 89 -3% | 89 -3% | 88 -4% | 88 -4% |
| Black Level * | 0.28 | 0.23 18% | 0.323 -15% | 0.3 -7% | 0.25 11% |
| Contrast | 1121 | 1365 22% | 1080 -4% | 1093 -2% | 1344 20% |
| Colorchecker dE 2000 * | 4.17 | 9.74 -134% | 4.09 2% | 3.74 10% | 3.61 13% |
| Colorchecker dE 2000 max. * | 8.94 | 15.71 -76% | 9.02 -1% | 8.97 -0% | 6.02 33% |
| Greyscale dE 2000 * | 3.84 | 9.58 -149% | 2.14 44% | 2.67 30% | 4.78 -24% |
| Gamma | 2.41 91% | 2.5 88% | 2.25 98% | 2.41 91% | 2.32 95% |
| CCT | 6950 94% | 11854 55% | 6885 94% | 6861 95% | 6185 105% |
| Color Space (Percent of AdobeRGB 1998) | 56 | 76 36% | 56.9 2% | 56 0% | 88 57% |
| Color Space (Percent of sRGB) | 86 | 100 16% | 86.5 1% | 85 -1% | 100 16% |
| Total Average (Program / Settings) | 17% /
-6% | 1% /
3% | 0% /
2% | 15% /
15% |
* ... smaller is better
Display Response Times
| ↔ Response Time Black to White | ||
|---|---|---|
| 23 ms ... rise ↗ and fall ↘ combined | ↗ 5 ms rise | 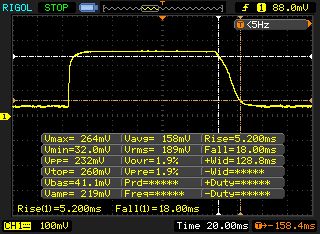 |
| ↘ 18 ms fall | ||
| The screen shows good response rates in our tests, but may be too slow for competitive gamers. In comparison, all tested devices range from 0.1 (minimum) to 240 (maximum) ms. » 45 % of all devices are better. This means that the measured response time is similar to the average of all tested devices (21.5 ms). | ||
| ↔ Response Time 50% Grey to 80% Grey | ||
| 36 ms ... rise ↗ and fall ↘ combined | ↗ 14 ms rise | 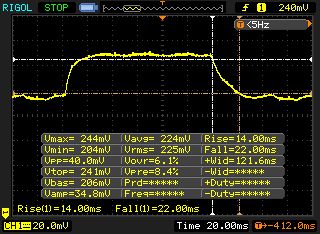 |
| ↘ 22 ms fall | ||
| The screen shows slow response rates in our tests and will be unsatisfactory for gamers. In comparison, all tested devices range from 0.2 (minimum) to 636 (maximum) ms. » 44 % of all devices are better. This means that the measured response time is similar to the average of all tested devices (33.7 ms). | ||
Screen Flickering / PWM (Pulse-Width Modulation)
| Screen flickering / PWM detected | 50 Hz | ≤ 5 % brightness setting | 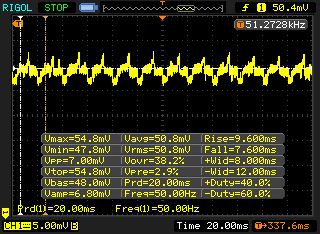 |
The display backlight flickers at 50 Hz (worst case, e.g., utilizing PWM) Flickering detected at a brightness setting of 5 % and below. There should be no flickering or PWM above this brightness setting. The frequency of 50 Hz is very low, so the flickering may cause eyestrain and headaches after extended use. In comparison: 53 % of all tested devices do not use PWM to dim the display. If PWM was detected, an average of 17924 (minimum: 5 - maximum: 3846000) Hz was measured. | |||
| Cinebench R11.5 | |
| CPU Single 64Bit | |
| MSI GT73VR-6RE16SR451 | |
| Asus G752VS-XB78K | |
| Nexoc G734III | |
| MSI GT72VR 6RE-015US | |
| CPU Multi 64Bit | |
| MSI GT73VR-6RE16SR451 | |
| Asus G752VS-XB78K | |
| MSI GT72VR 6RE-015US | |
| Nexoc G734III | |
| PCMark 8 | |
| Home Score Accelerated v2 | |
| Asus G752VS-XB78K | |
| MSI GT73VR-6RE16SR451 | |
| MSI GT72VR 6RE-015US | |
| Nexoc G734III | |
| Acer Predator 17 G9-793-77LG | |
| Work Score Accelerated v2 | |
| Asus G752VS-XB78K | |
| MSI GT73VR-6RE16SR451 | |
| MSI GT72VR 6RE-015US | |
| Nexoc G734III | |
| PCMark 7 Score | 5233 pontos | |
| PCMark 8 Home Score Accelerated v2 | 4180 pontos | |
| PCMark 8 Creative Score Accelerated v2 | 5262 pontos | |
| PCMark 8 Work Score Accelerated v2 | 5011 pontos | |
Ajuda | ||
| Nexoc G734III Samsung SM951 MZVPV256HDGL m.2 PCI-e | MSI GT73VR-6RE16SR451 2x Samsung SM951 MZVPV256HDGL (RAID 0) | MSI GT72VR 6RE-015US SanDisk SD8SNAT256G1122 | Asus G752VS-XB78K Toshiba NVMe THNSN5512GPU7 | |
|---|---|---|---|---|
| CrystalDiskMark 3.0 | 53% | -61% | 16% | |
| Read Seq | 1917 | 3285 71% | 529 -72% | 1718 -10% |
| Write Seq | 1283 | 2560 100% | 338.5 -74% | 1305 2% |
| Read 512 | 871 | 1775 104% | 288.9 -67% | 1250 44% |
| Write 512 | 1199 | 2327 94% | 319.2 -73% | 1438 20% |
| Read 4k | 51 | 52.2 2% | 23.1 -55% | 44.42 -13% |
| Write 4k | 142.1 | 153.1 8% | 99.4 -30% | 154.4 9% |
| Read 4k QD32 | 603 | 627 4% | 147.5 -76% | 744 23% |
| Write 4k QD32 | 382.4 | 527 38% | 236.9 -38% | 578 51% |

| 3DMark | |
| 1920x1080 Fire Strike Graphics | |
| MSI GT73VR-6RE16SR451 | |
| MSI GT72VR 6RE-015US | |
| Asus G752VS-XB78K | |
| Nexoc G734III | |
| Acer Predator 17 G9-793-77LG | |
| 2560x1440 Time Spy Graphics | |
| MSI GT73VR-6RE16SR451 | |
| Asus G752VS-XB78K | |
| Nexoc G734III | |
| 3DMark 11 - 1280x720 Performance GPU | |
| MSI GT73VR-6RE16SR451 | |
| Asus G752VS-XB78K | |
| Acer Predator 17 G9-793-77LG | |
| Nexoc G734III | |
| MSI GT72VR 6RE-015US | |
| 3DMark 11 Performance | 15486 pontos | |
| 3DMark Ice Storm Standard Score | 85380 pontos | |
| 3DMark Cloud Gate Standard Score | 22639 pontos | |
| 3DMark Fire Strike Score | 12458 pontos | |
| 3DMark Time Spy Score | 4990 pontos | |
Ajuda | ||
| The Witcher 3 - 1920x1080 Ultra Graphics & Postprocessing (HBAO+) | |
| Acer Predator 17 G9-793-77LG | |
| Asus G752VS-XB78K | |
| Nexoc G734III | |
| Doom - 1920x1080 Ultra Preset AA:SM | |
| Nexoc G734III | |
| MSI GT72VR 6RE-015US | |
| BioShock Infinite - 1920x1080 Ultra Preset, DX11 (DDOF) | |
| Asus G752VS-XB78K | |
| MSI GT72VR 6RE-015US | |
| Nexoc G734III | |
| baixo | média | alto | ultra | |
| BioShock Infinite (2013) | 194 | 178.8 | 152.6 | 122 |
| The Witcher 3 (2015) | 203 | 157 | 98.1 | 53.2 |
| Doom (2016) | 149 | 142 | 127 | 119.7 |
Barulho
| Ocioso |
| 31 / 32 / 33 dB |
| Carga |
| 49 / 50 dB |
 | ||
30 dB silencioso 40 dB(A) audível 50 dB(A) ruidosamente alto |
||
min: | ||
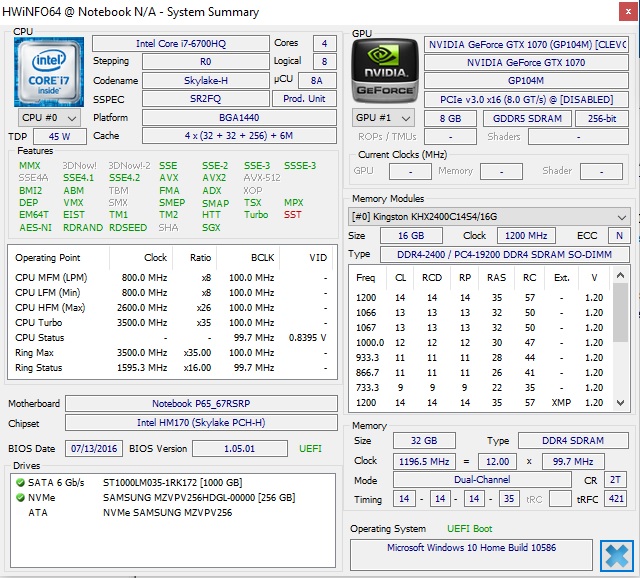
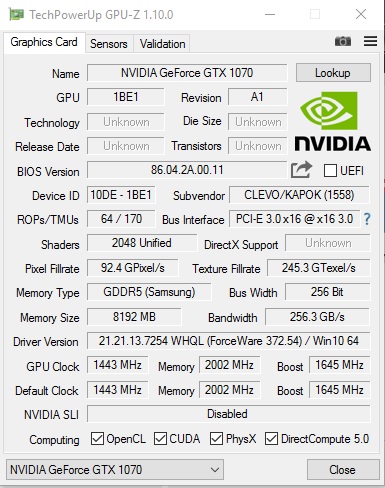
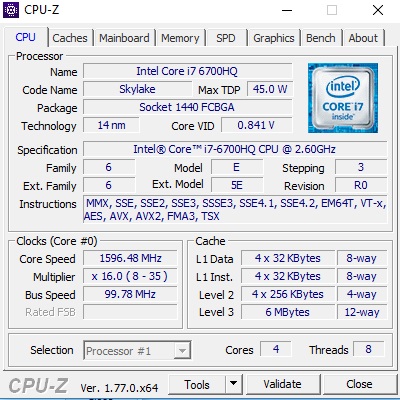
| Nexoc G734III GeForce GTX 1070 Mobile, 6700HQ | MSI GT73VR-6RE16SR451 GeForce GTX 1070 Mobile, 6820HK | MSI GT72VR 6RE-015US GeForce GTX 1070 Mobile, 6700HQ | Asus G752VS-XB78K GeForce GTX 1070 Mobile, 6820HK | Acer Predator 17 G9-793-77LG GeForce GTX 1070 Mobile, 6700HQ | |
|---|---|---|---|---|---|
| Noise | 3% | 3% | 4% | -4% | |
| off / environment * | 30 | 30 -0% | 28.9 4% | 30 -0% | 31 -3% |
| Idle Minimum * | 31 | 32 -3% | 32.4 -5% | 31 -0% | 33 -6% |
| Idle Average * | 32 | 33 -3% | 32.4 -1% | 32 -0% | 34 -6% |
| Idle Maximum * | 33 | 35 -6% | 32.4 2% | 33 -0% | 40 -21% |
| Load Average * | 49 | 35 29% | 39.4 20% | 40 18% | 44 10% |
| Load Maximum * | 50 | 49 2% | 52 -4% | 47 6% | 50 -0% |
* ... smaller is better
(-) The maximum temperature on the upper side is 50 °C / 122 F, compared to the average of 40.4 °C / 105 F, ranging from 21.2 to 68.8 °C for the class Gaming.
(-) The bottom heats up to a maximum of 60.5 °C / 141 F, compared to the average of 43.2 °C / 110 F
(+) In idle usage, the average temperature for the upper side is 27.1 °C / 81 F, compared to the device average of 33.8 °C / 93 F.
(+) The palmrests and touchpad are reaching skin temperature as a maximum (33.6 °C / 92.5 F) and are therefore not hot.
(-) The average temperature of the palmrest area of similar devices was 28.9 °C / 84 F (-4.7 °C / -8.5 F).
| Nexoc G734III GeForce GTX 1070 Mobile, 6700HQ | MSI GT73VR-6RE16SR451 GeForce GTX 1070 Mobile, 6820HK | MSI GT72VR 6RE-015US GeForce GTX 1070 Mobile, 6700HQ | Asus G752VS-XB78K GeForce GTX 1070 Mobile, 6820HK | Acer Predator 17 G9-793-77LG GeForce GTX 1070 Mobile, 6700HQ | |
|---|---|---|---|---|---|
| Heat | -4% | 5% | 7% | 5% | |
| Maximum Upper Side * | 50 | 44.9 10% | 40.6 19% | 42.9 14% | 42.6 15% |
| Maximum Bottom * | 60.5 | 51.2 15% | 59.4 2% | 41.5 31% | 44.9 26% |
| Idle Upper Side * | 29.1 | 32.7 -12% | 28.2 3% | 31.6 -9% | 33.1 -14% |
| Idle Bottom * | 26.9 | 34.2 -27% | 27.8 -3% | 29.5 -10% | 28.9 -7% |
* ... smaller is better
Nexoc G734III audio analysis
(±) | speaker loudness is average but good (74 dB)
Bass 100 - 315 Hz
(±) | reduced bass - on average 14.7% lower than median
(-) | bass is not linear (15.4% delta to prev. frequency)
Mids 400 - 2000 Hz
(+) | balanced mids - only 2.9% away from median
(±) | linearity of mids is average (7.4% delta to prev. frequency)
Highs 2 - 16 kHz
(+) | balanced highs - only 1.9% away from median
(+) | highs are linear (4.8% delta to prev. frequency)
Overall 100 - 16.000 Hz
(±) | linearity of overall sound is average (16.2% difference to median)
Compared to same class
» 37% of all tested devices in this class were better, 7% similar, 56% worse
» The best had a delta of 6%, average was 18%, worst was 132%
Compared to all devices tested
» 21% of all tested devices were better, 5% similar, 74% worse
» The best had a delta of 4%, average was 25%, worst was 134%
MSI GT73VR-6RE16SR451 audio analysis
(+) | speakers can play relatively loud (82 dB)
Bass 100 - 315 Hz
(±) | reduced bass - on average 6.2% lower than median
(+) | bass is linear (6.4% delta to prev. frequency)
Mids 400 - 2000 Hz
(+) | balanced mids - only 1.6% away from median
(+) | mids are linear (5.3% delta to prev. frequency)
Highs 2 - 16 kHz
(±) | higher highs - on average 6.6% higher than median
(+) | highs are linear (6.8% delta to prev. frequency)
Overall 100 - 16.000 Hz
(+) | overall sound is linear (13.8% difference to median)
Compared to same class
» 20% of all tested devices in this class were better, 6% similar, 74% worse
» The best had a delta of 6%, average was 18%, worst was 132%
Compared to all devices tested
» 12% of all tested devices were better, 3% similar, 85% worse
» The best had a delta of 4%, average was 25%, worst was 134%
Asus G752VS-XB78K audio analysis
(±) | speaker loudness is average but good (76 dB)
Bass 100 - 315 Hz
(±) | reduced bass - on average 9.6% lower than median
(±) | linearity of bass is average (10.7% delta to prev. frequency)
Mids 400 - 2000 Hz
(+) | balanced mids - only 4.7% away from median
(±) | linearity of mids is average (10.3% delta to prev. frequency)
Highs 2 - 16 kHz
(±) | reduced highs - on average 8.3% lower than median
(±) | linearity of highs is average (9.7% delta to prev. frequency)
Overall 100 - 16.000 Hz
(±) | linearity of overall sound is average (22.4% difference to median)
Compared to same class
» 77% of all tested devices in this class were better, 6% similar, 16% worse
» The best had a delta of 6%, average was 18%, worst was 132%
Compared to all devices tested
» 60% of all tested devices were better, 6% similar, 33% worse
» The best had a delta of 4%, average was 25%, worst was 134%
| desligado | |
| Ocioso | |
| Carga |
|
| Nexoc G734III GeForce GTX 1070 Mobile, 6700HQ | MSI GT73VR-6RE16SR451 GeForce GTX 1070 Mobile, 6820HK | MSI GT72VR 6RE-015US GeForce GTX 1070 Mobile, 6700HQ | Asus G752VS-XB78K GeForce GTX 1070 Mobile, 6820HK | Acer Predator 17 G9-793-77LG GeForce GTX 1070 Mobile, 6700HQ | |
|---|---|---|---|---|---|
| Power Consumption | -57% | -37% | -35% | -51% | |
| Idle Minimum * | 13 | 31 -138% | 22.3 -72% | 24 -85% | 25 -92% |
| Idle Average * | 20 | 35 -75% | 27.3 -37% | 31 -55% | 35 -75% |
| Idle Maximum * | 27 | 40 -48% | 30 -11% | 36 -33% | 46 -70% |
| Load Average * | 90 | 106 -18% | 152.2 -69% | 94 -4% | 103 -14% |
| Load Maximum * | 210 | 218 -4% | 204.2 3% | 204 3% | 223 -6% |
* ... smaller is better
| Nexoc G734III 60 Wh | MSI GT73VR-6RE16SR451 75.2 Wh | MSI GT72VR 6RE-015US 83 Wh | Asus G752VS-XB78K 90 Wh | Acer Predator 17 G9-793-77LG 88 Wh | |
|---|---|---|---|---|---|
| Battery Runtime | -12% | -0% | -7% | -8% | |
| Reader / Idle | 400 | 290 -27% | 322 -19% | 311 -22% | 278 -30% |
| H.264 | 208 | 186 -11% | |||
| WiFi v1.3 | 177 | 206 16% | 224 27% | 210 19% | 200 13% |
| Load | 95 | 72 -24% | 86 -9% | 84 -12% | 89 -6% |
Pro
Contra
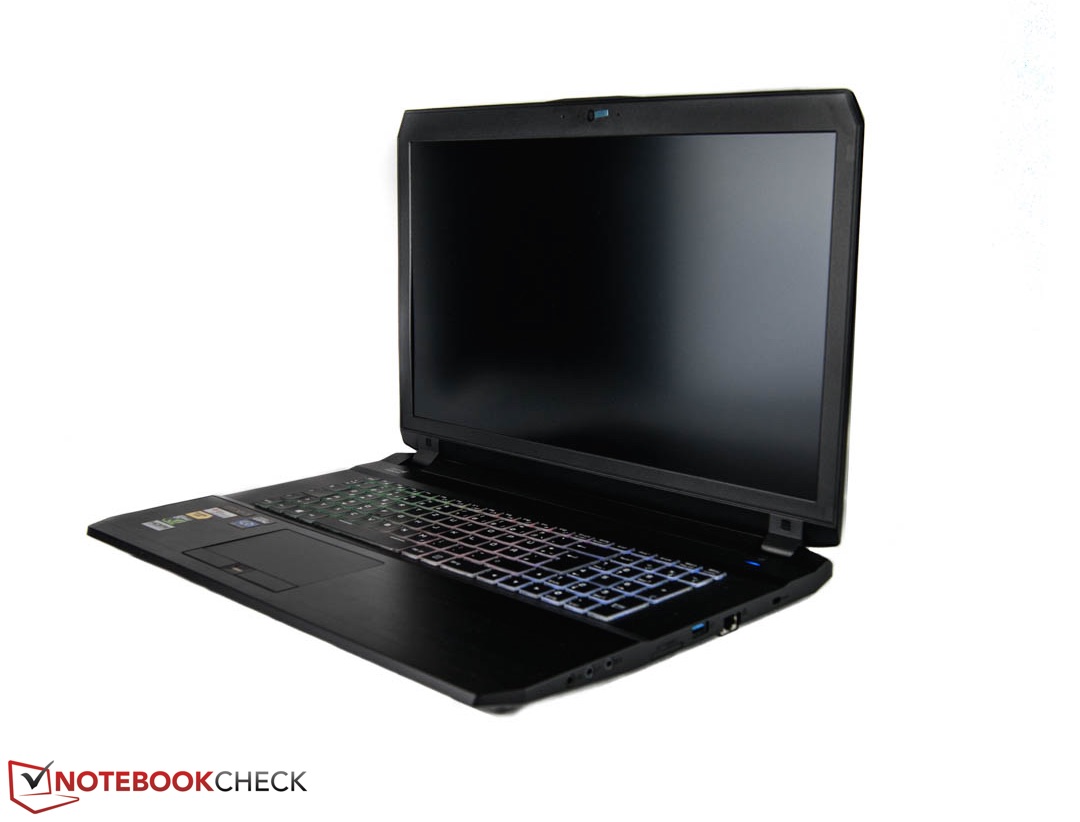
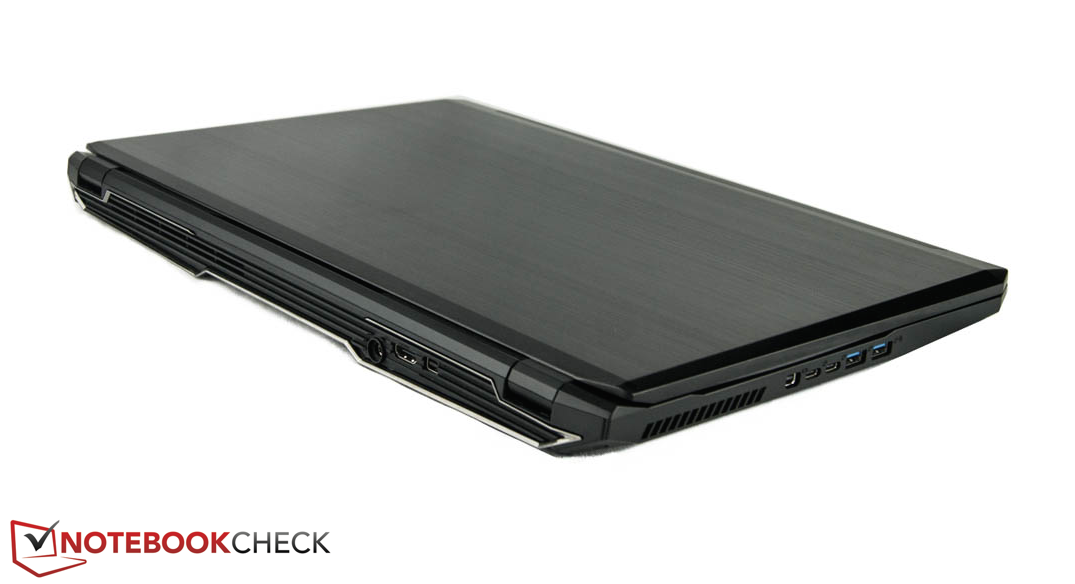
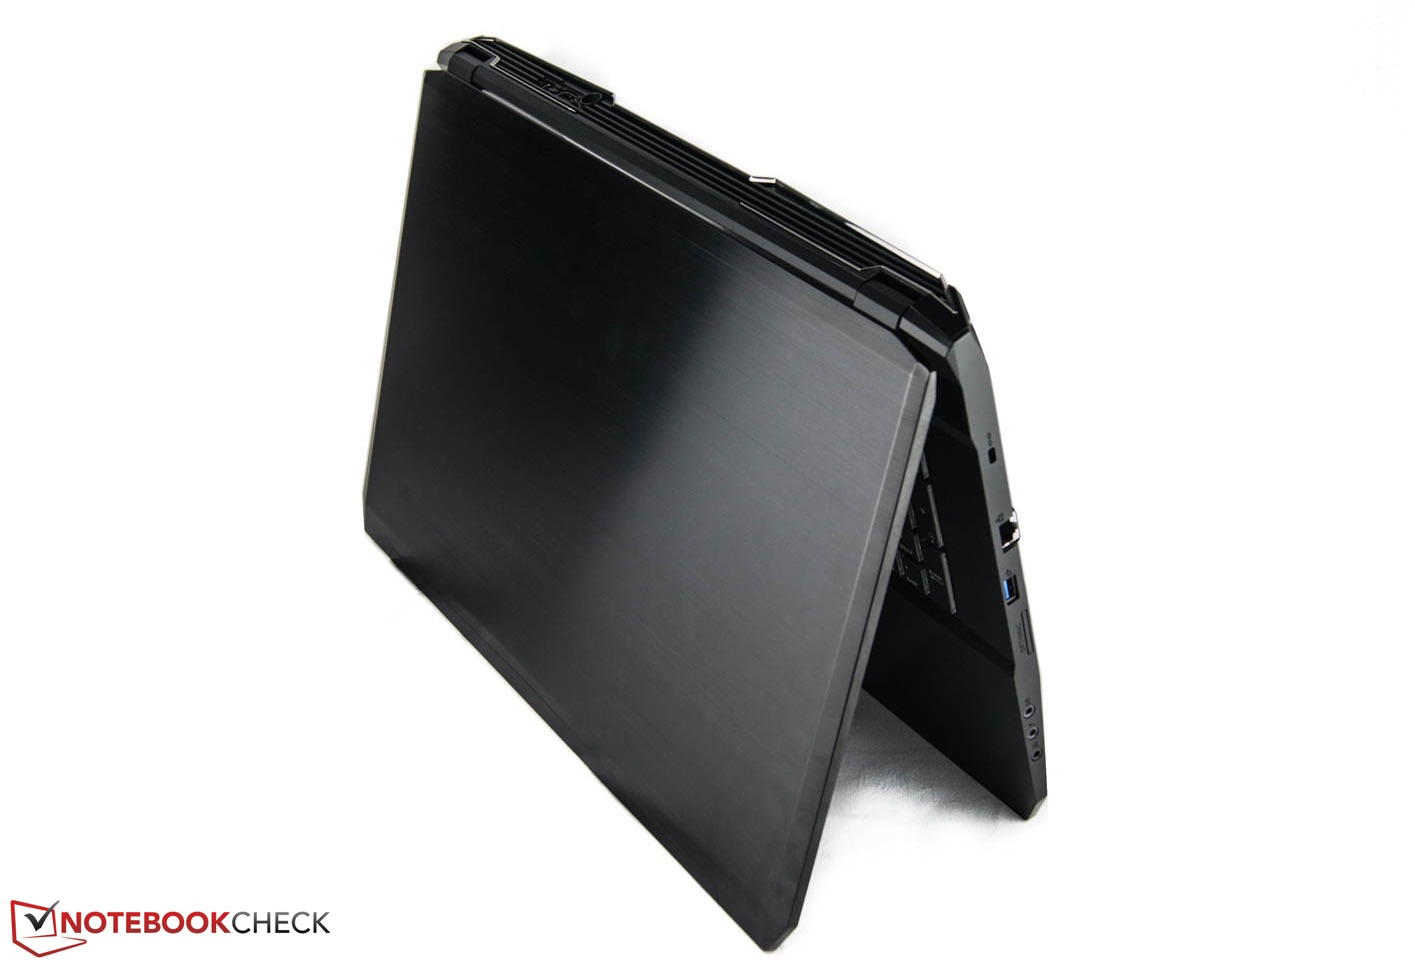
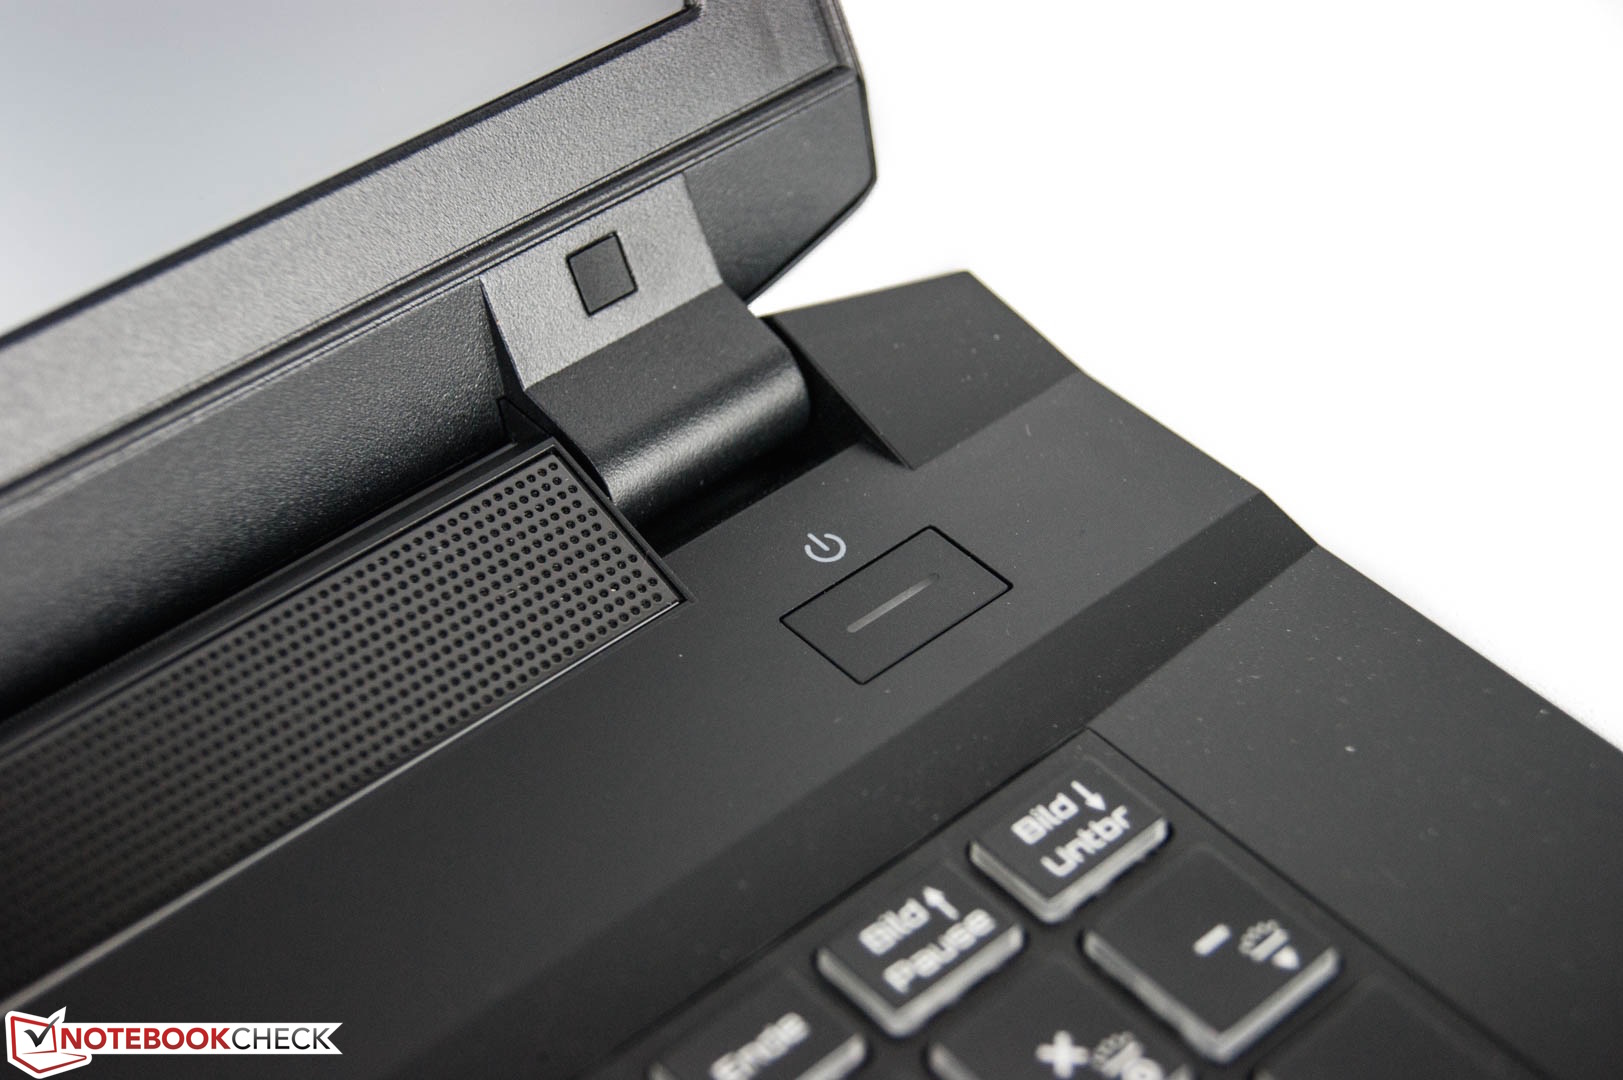
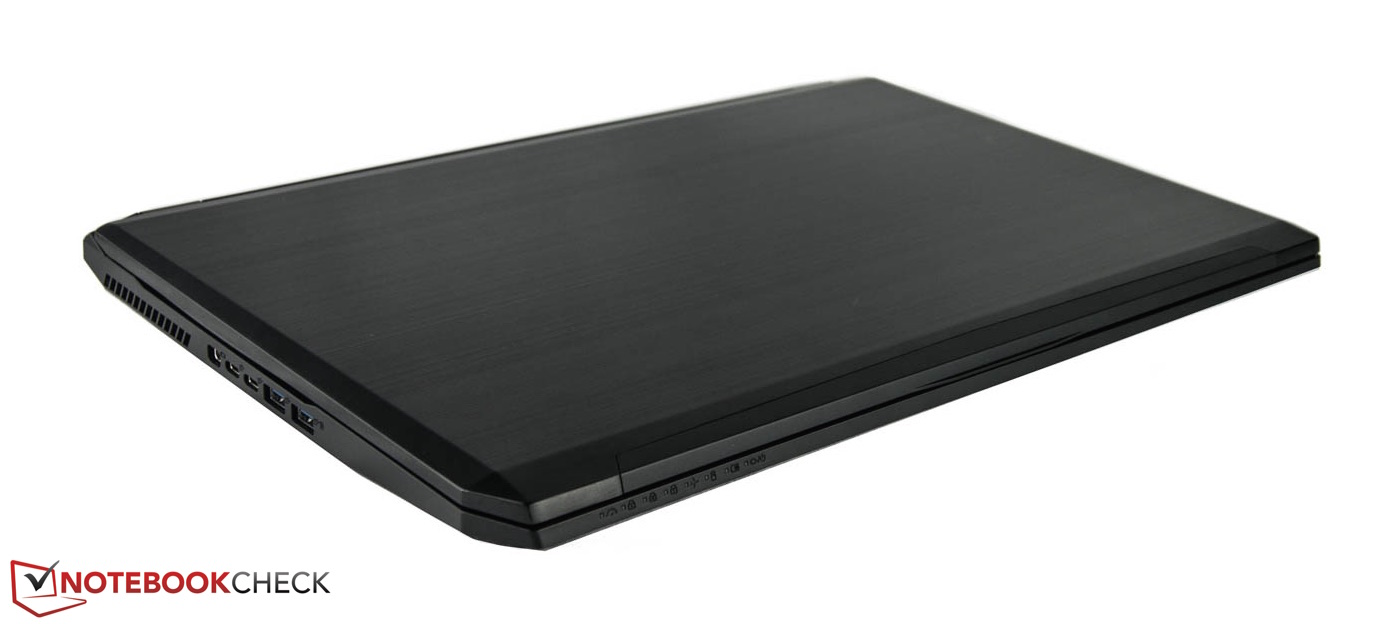
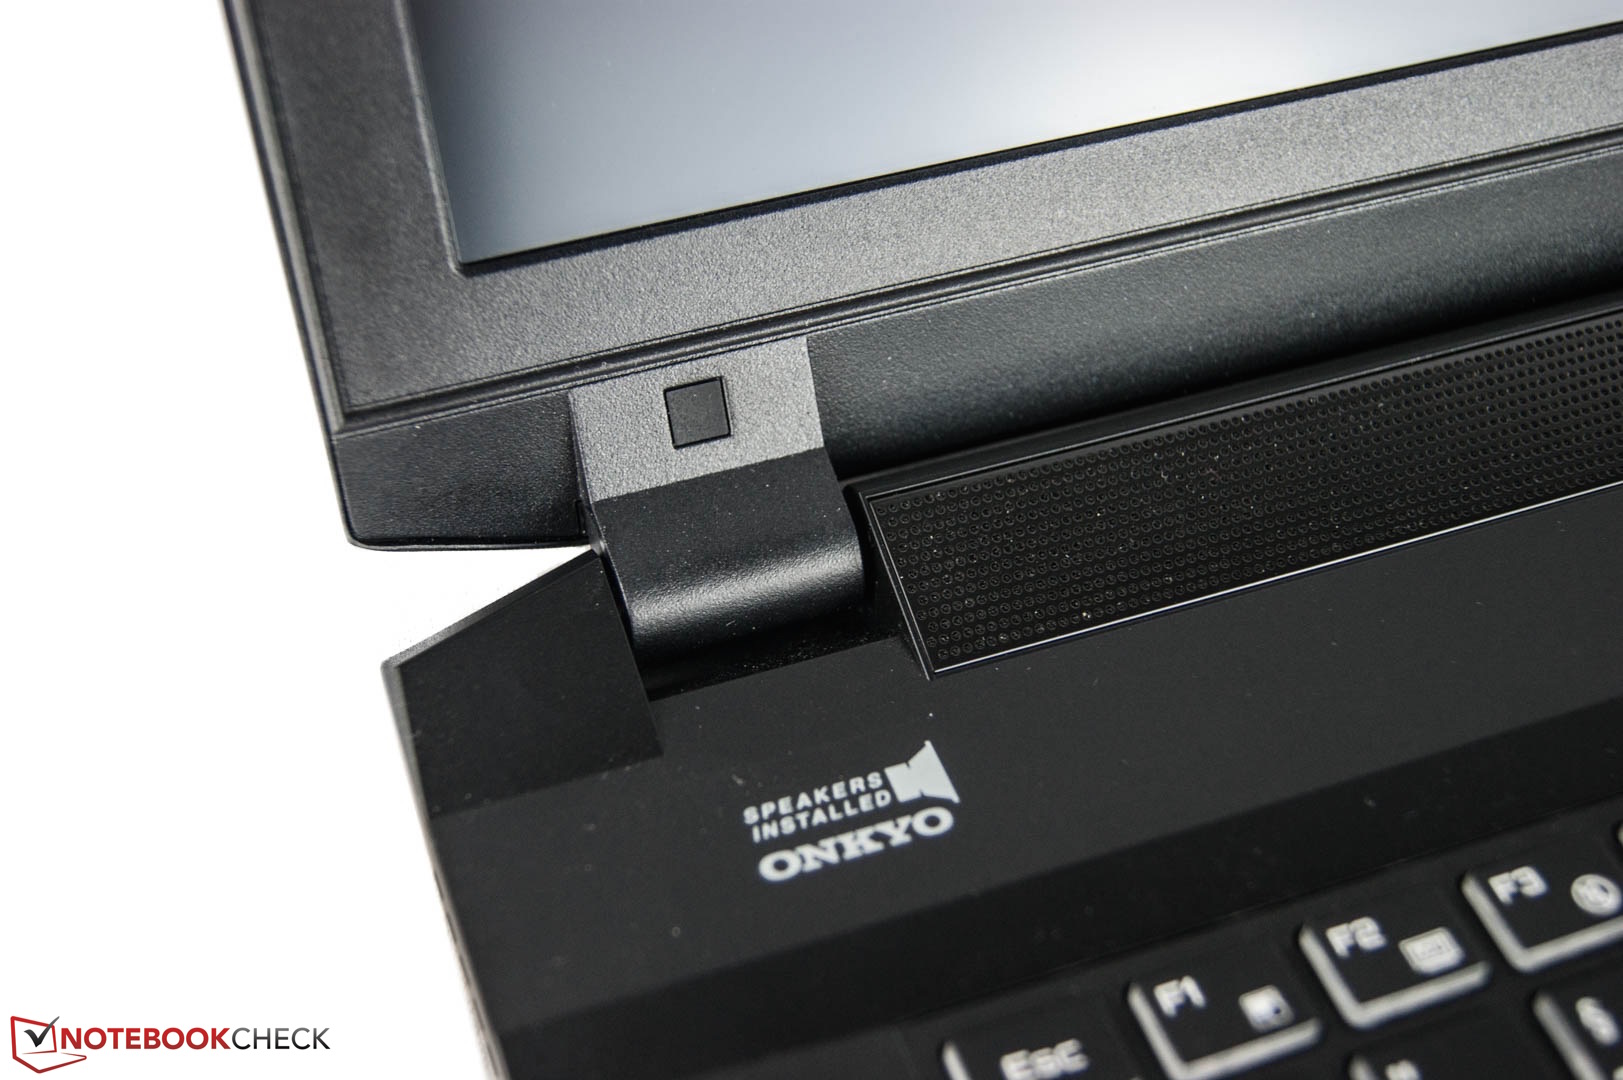
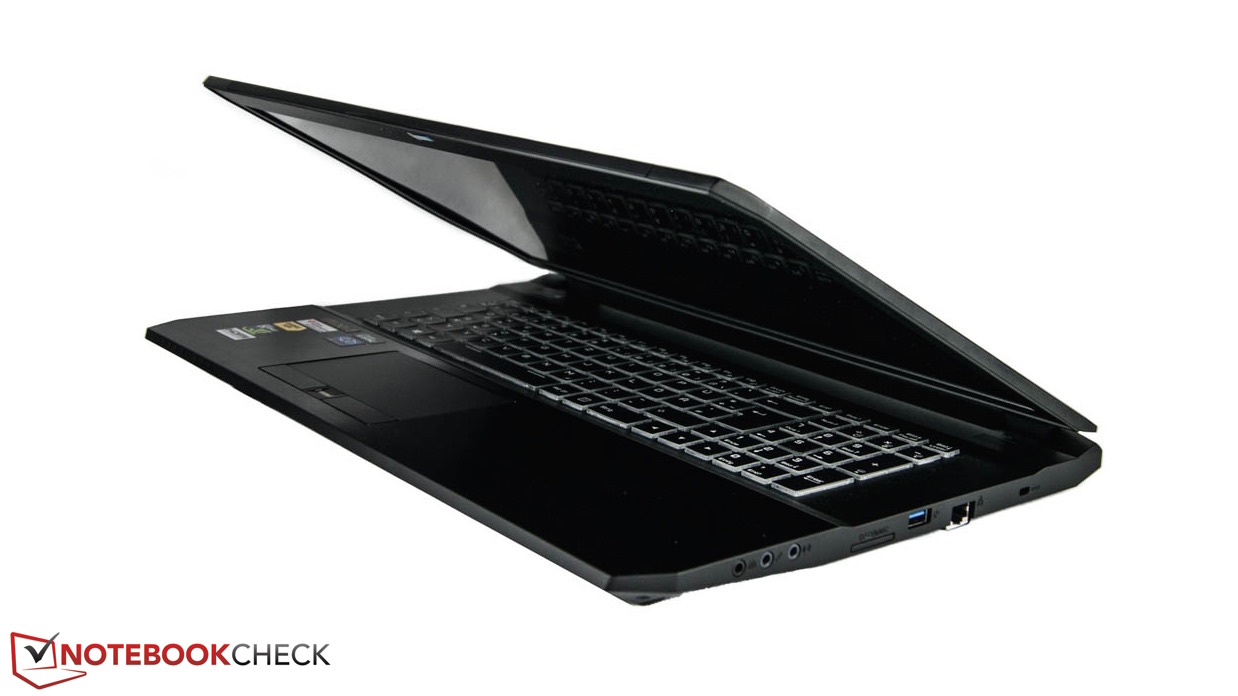
Além de pequenas falhas, o Nexoc G734III (Clevo P670RS-G) é convincente. A carcaça de gama alta ganha pontos com sua boa qualidade construção e altura relativamente baixa. No geral, o aparelho de 17 polegadas não consegue brilhar com a portabilidade, mas é mais fácil de carregar que outros portáteis de gama alta. Infelizmente, não existem escotilhas de manutenção, que poderiam oferecer acesso rápido aos componentes internos. Ao mesmo tempo, gostamos da iluminação do teclado e do touchpad.
Outro pro é a a tela IPS mate e rica em contraste com suporte para G-Sync. A GeForce GTX 1070 normalmente pode lidar com 1920x1080 pixels. O modelo Pascal atinge seu limite na faixa dos 4K de 3840x2160 pixels. Graças às placas de vídeo modernas, a maioria dos jogos roda fluentemente com configurações máximas.
No entanto, achamos irritante o ruído de alta frequência, o que pode ser resolvido utilizando um headset ou subindo o volume dos alto falantes. O aumento da temperatura também poderia ser controlado melhor. Finalmente, a duração da bateria é bastante modesta, apesar da alternância.
De outra maneira, o Nexoc G734III cumpre com todos os requisitos de um portátil para jogos.
Aqueles que têm um orçamento ainda mais alto e que desejam um melhor sistema de resfriamento, definitivamente deveriam considerar o MSI GT73VR ouGT72VR, o Acer Predator 17 ou o Asus G752VS.
Nexoc G734III
-
09/11/2016 v5.1(old)
Nino Ricchizzi