 Deutsch
 English
 Español
 Français
 Italiano
 Nederlands
 Polski
 Português
 Русский
 Türkçe
 Svenska
 Chinese
 Magyar
Breve Análise do Phablet Xiaomi Mi Mix

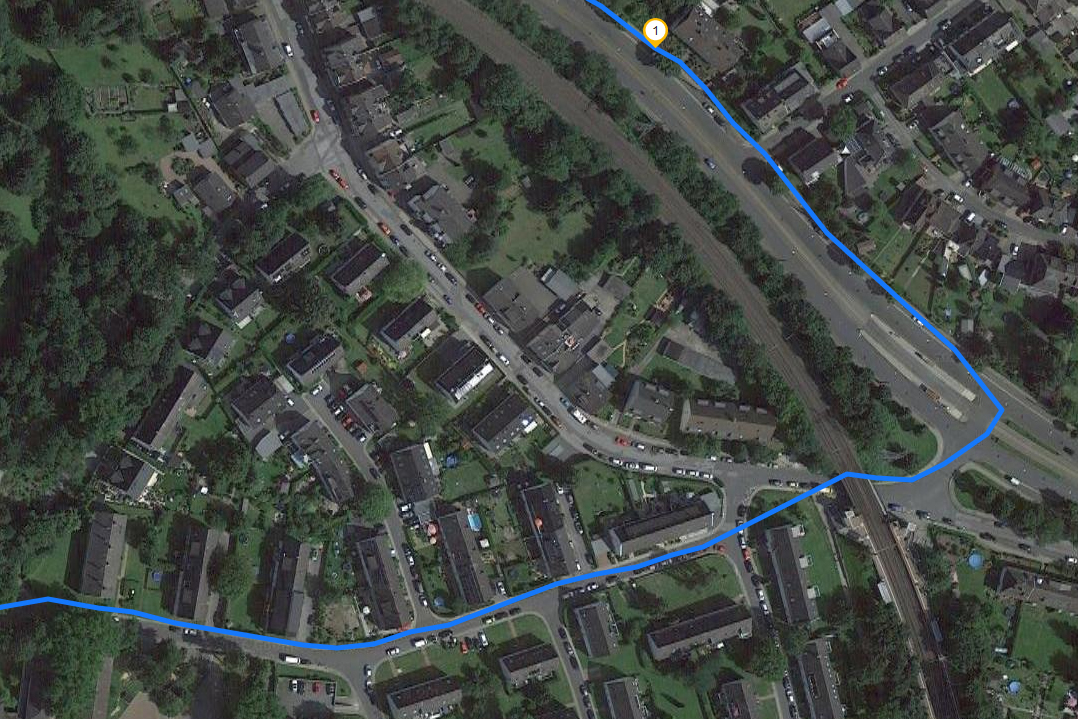
| Networking | |
| iperf3 transmit AX12 | |
| Apple iPhone 7 (Klaus I211) | |
| Google Pixel XL 2016 | |
| Samsung Galaxy S7 Edge | |
| OnePlus 3T | |
| Xiaomi Mi Mix | |
| Huawei Mate 9 | |
| iperf3 receive AX12 | |
| Apple iPhone 7 (Klaus I211) | |
| Google Pixel XL 2016 | |
| Xiaomi Mi Mix | |
| Samsung Galaxy S7 Edge | |
| Huawei Mate 9 | |
| OnePlus 3T | |


| |||||||||||||||||||||||||
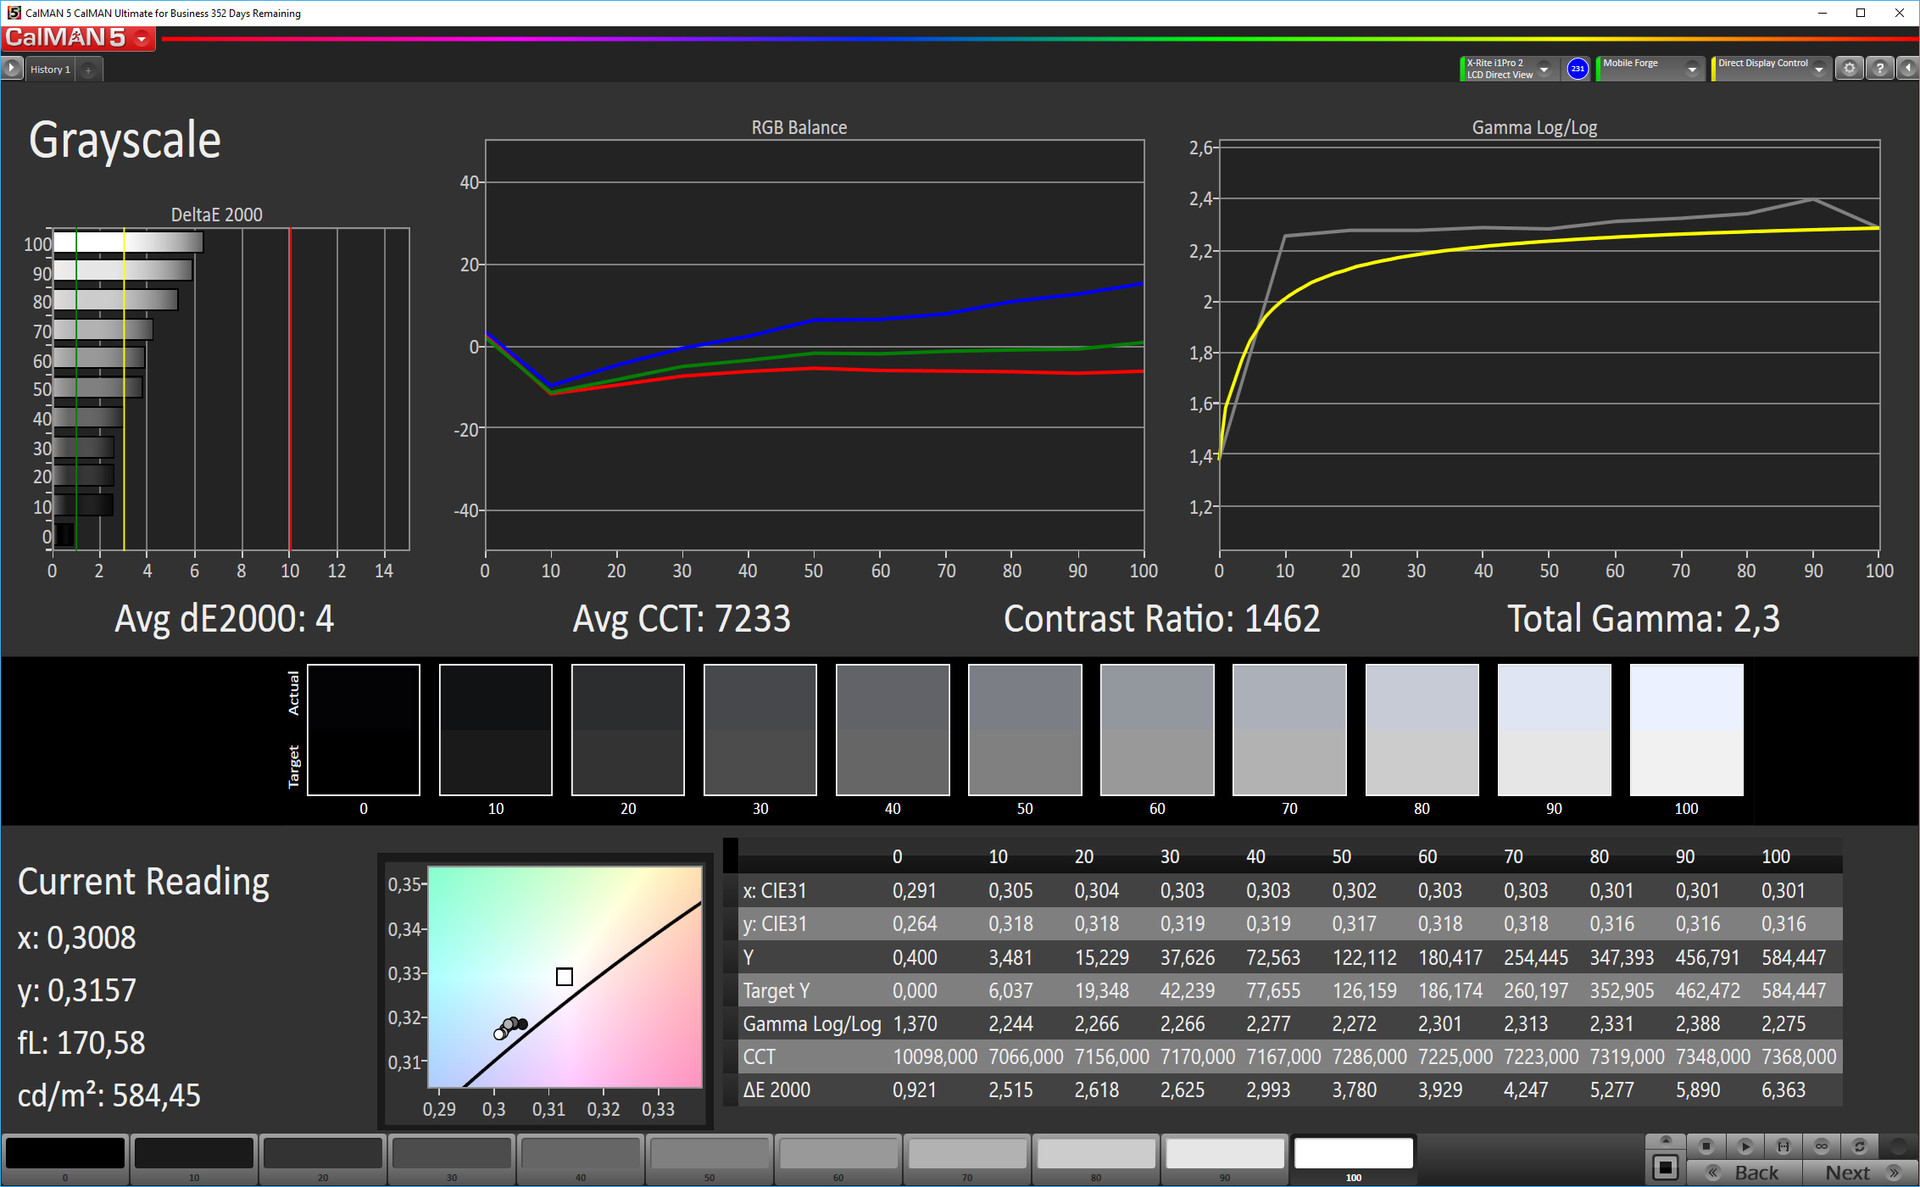
iluminação: 89 %
iluminação com acumulador: 530 cd/m²
Contraste: 1374:1 (Preto: 0.42 cd/m²)
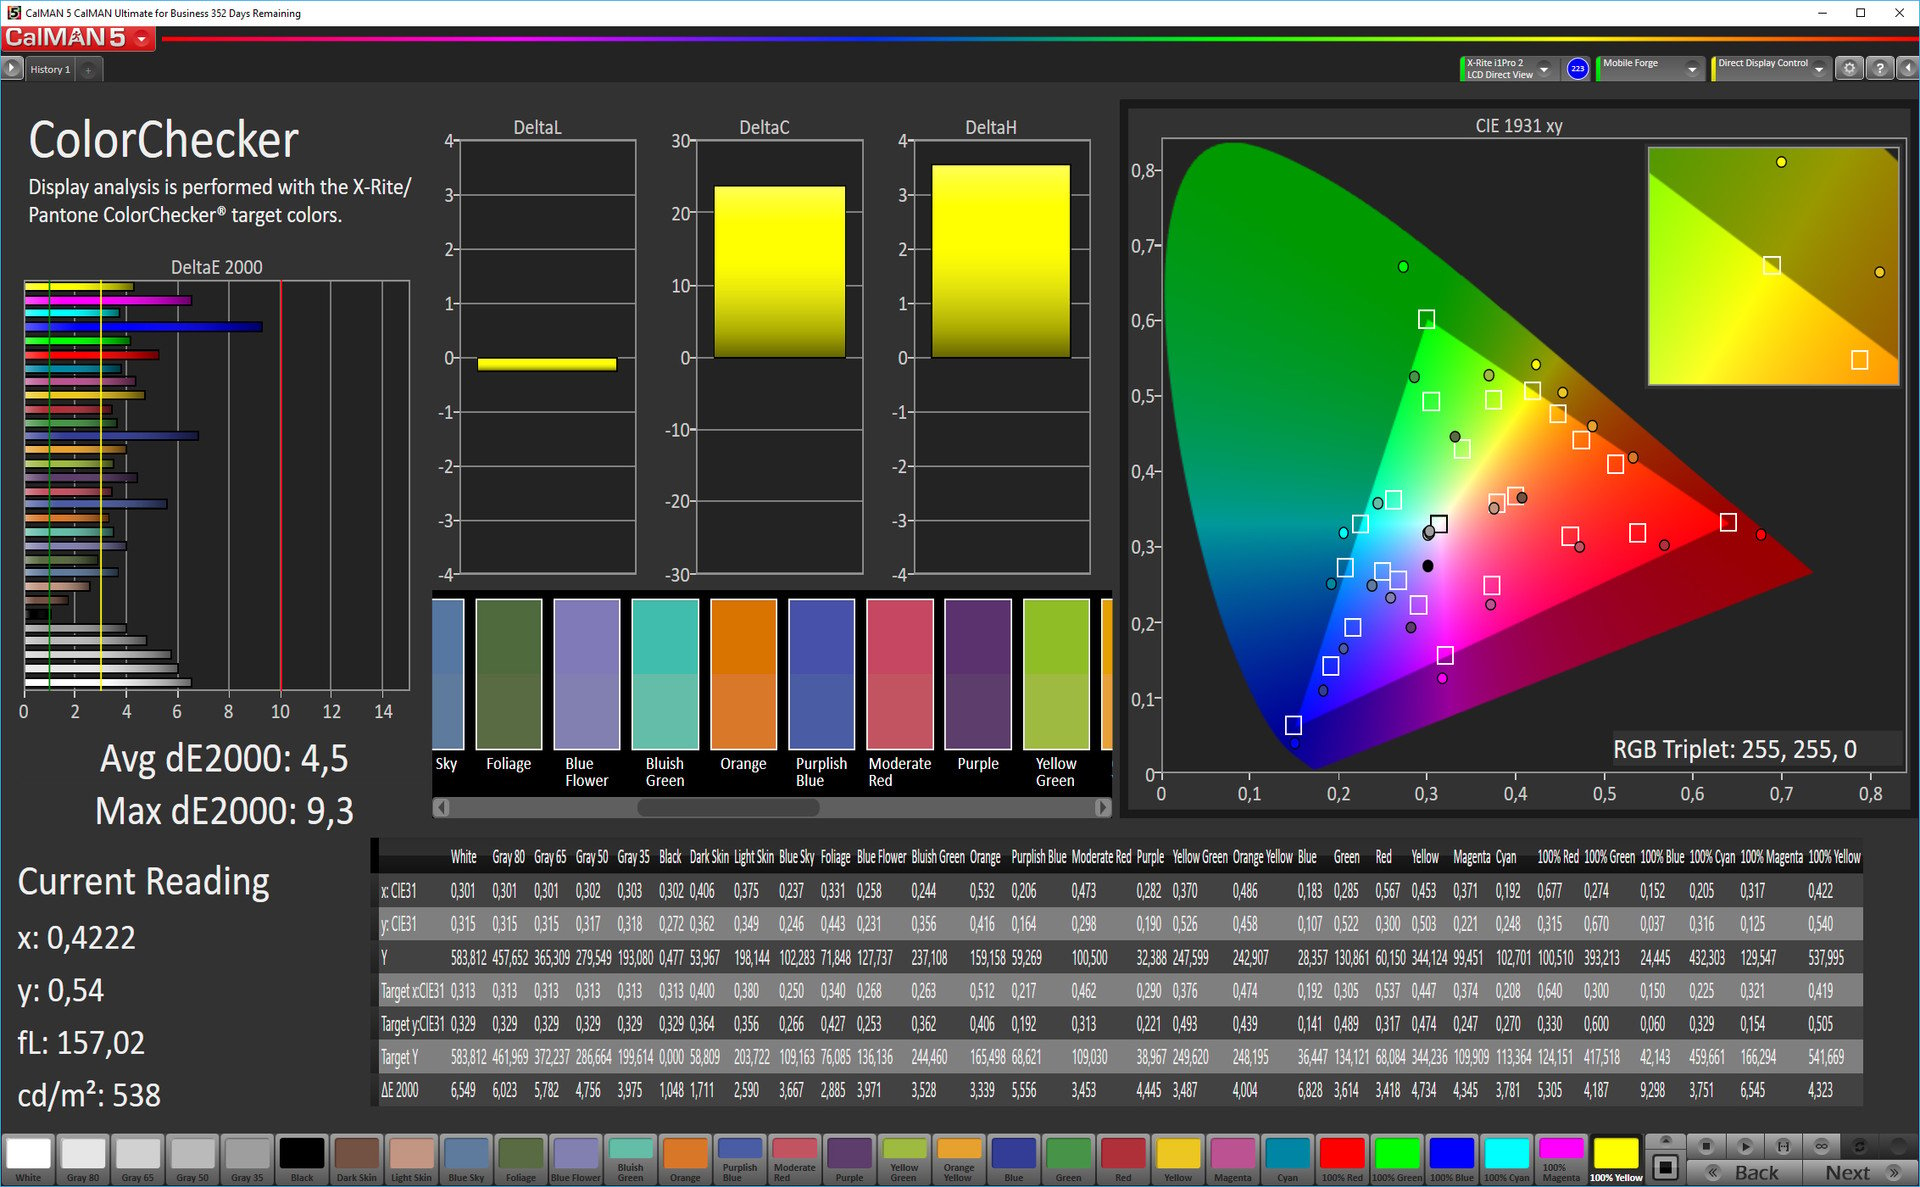
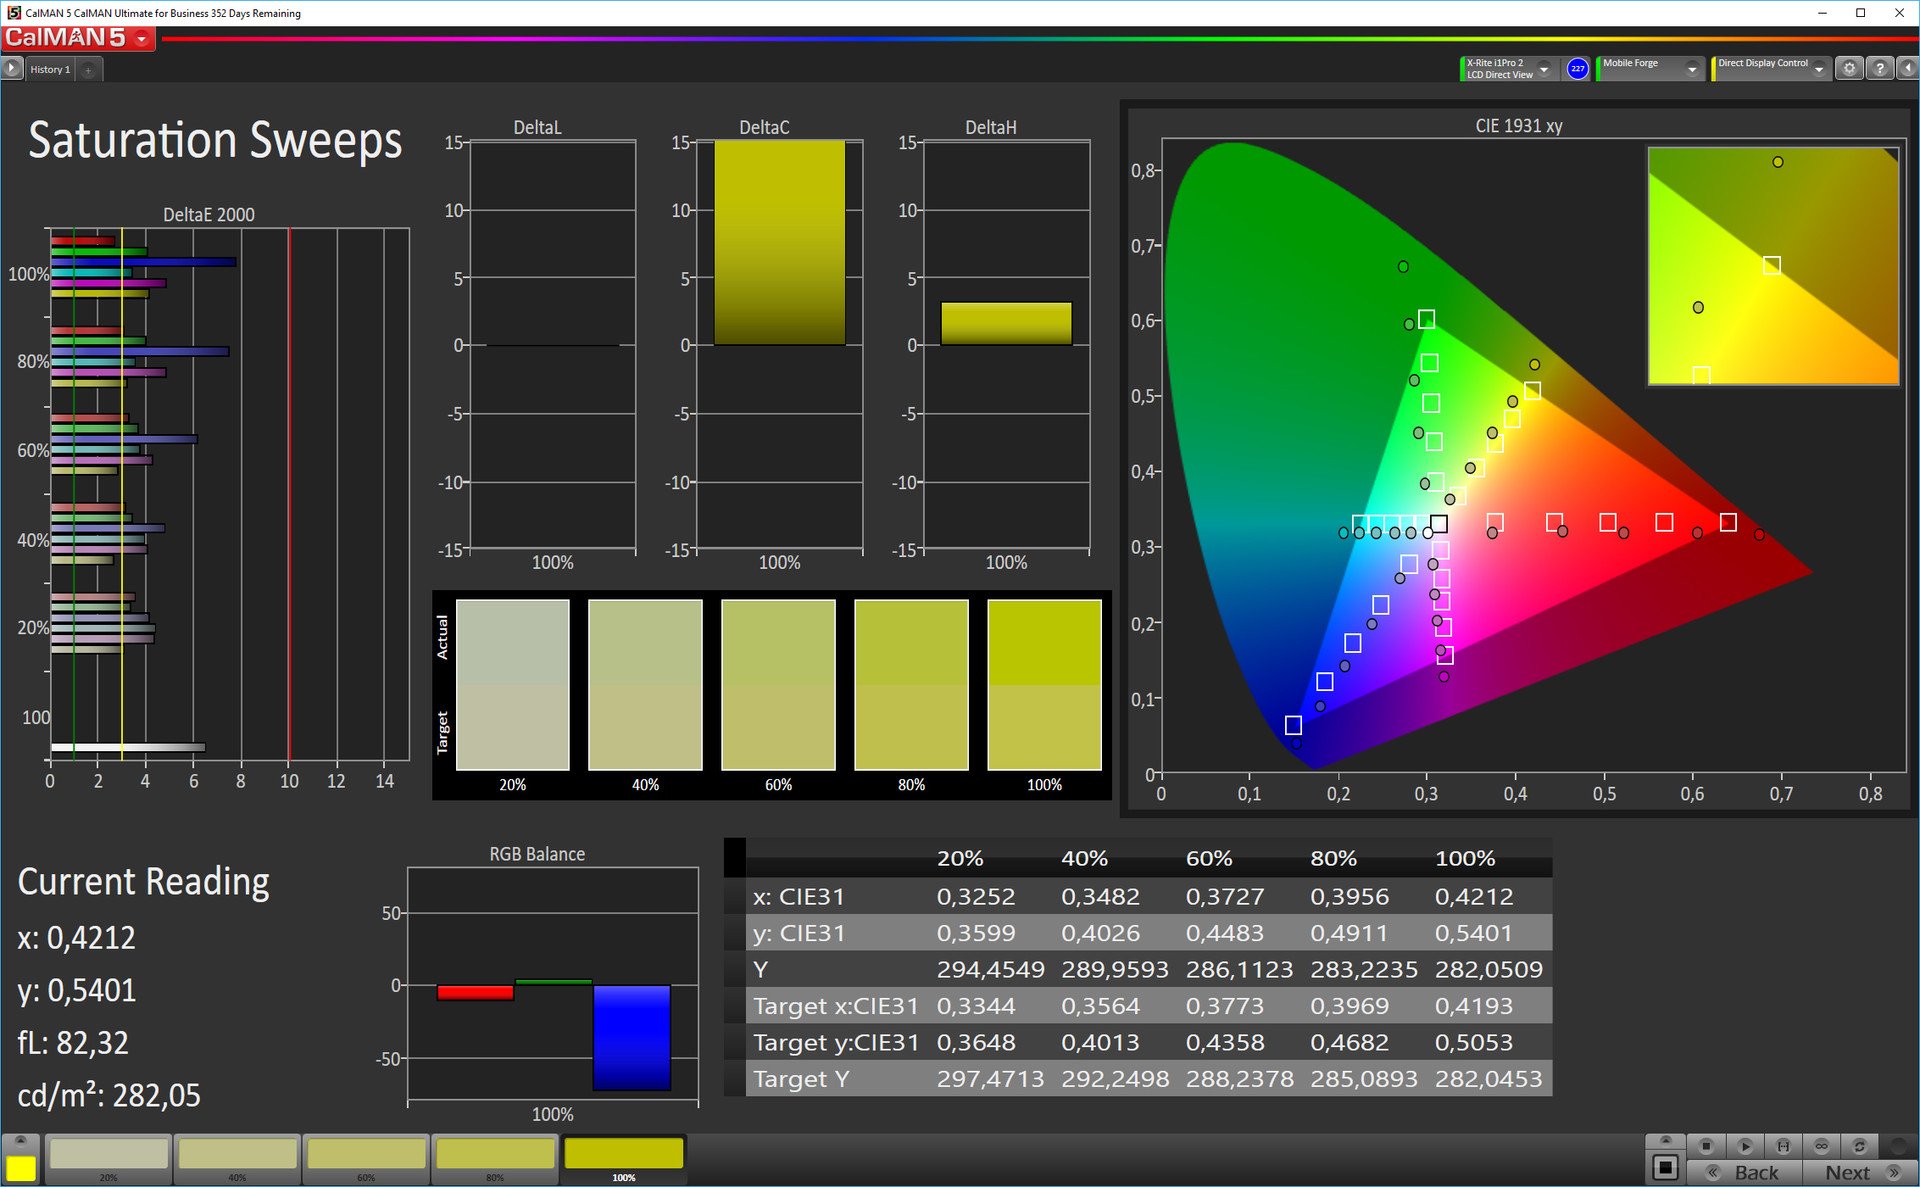
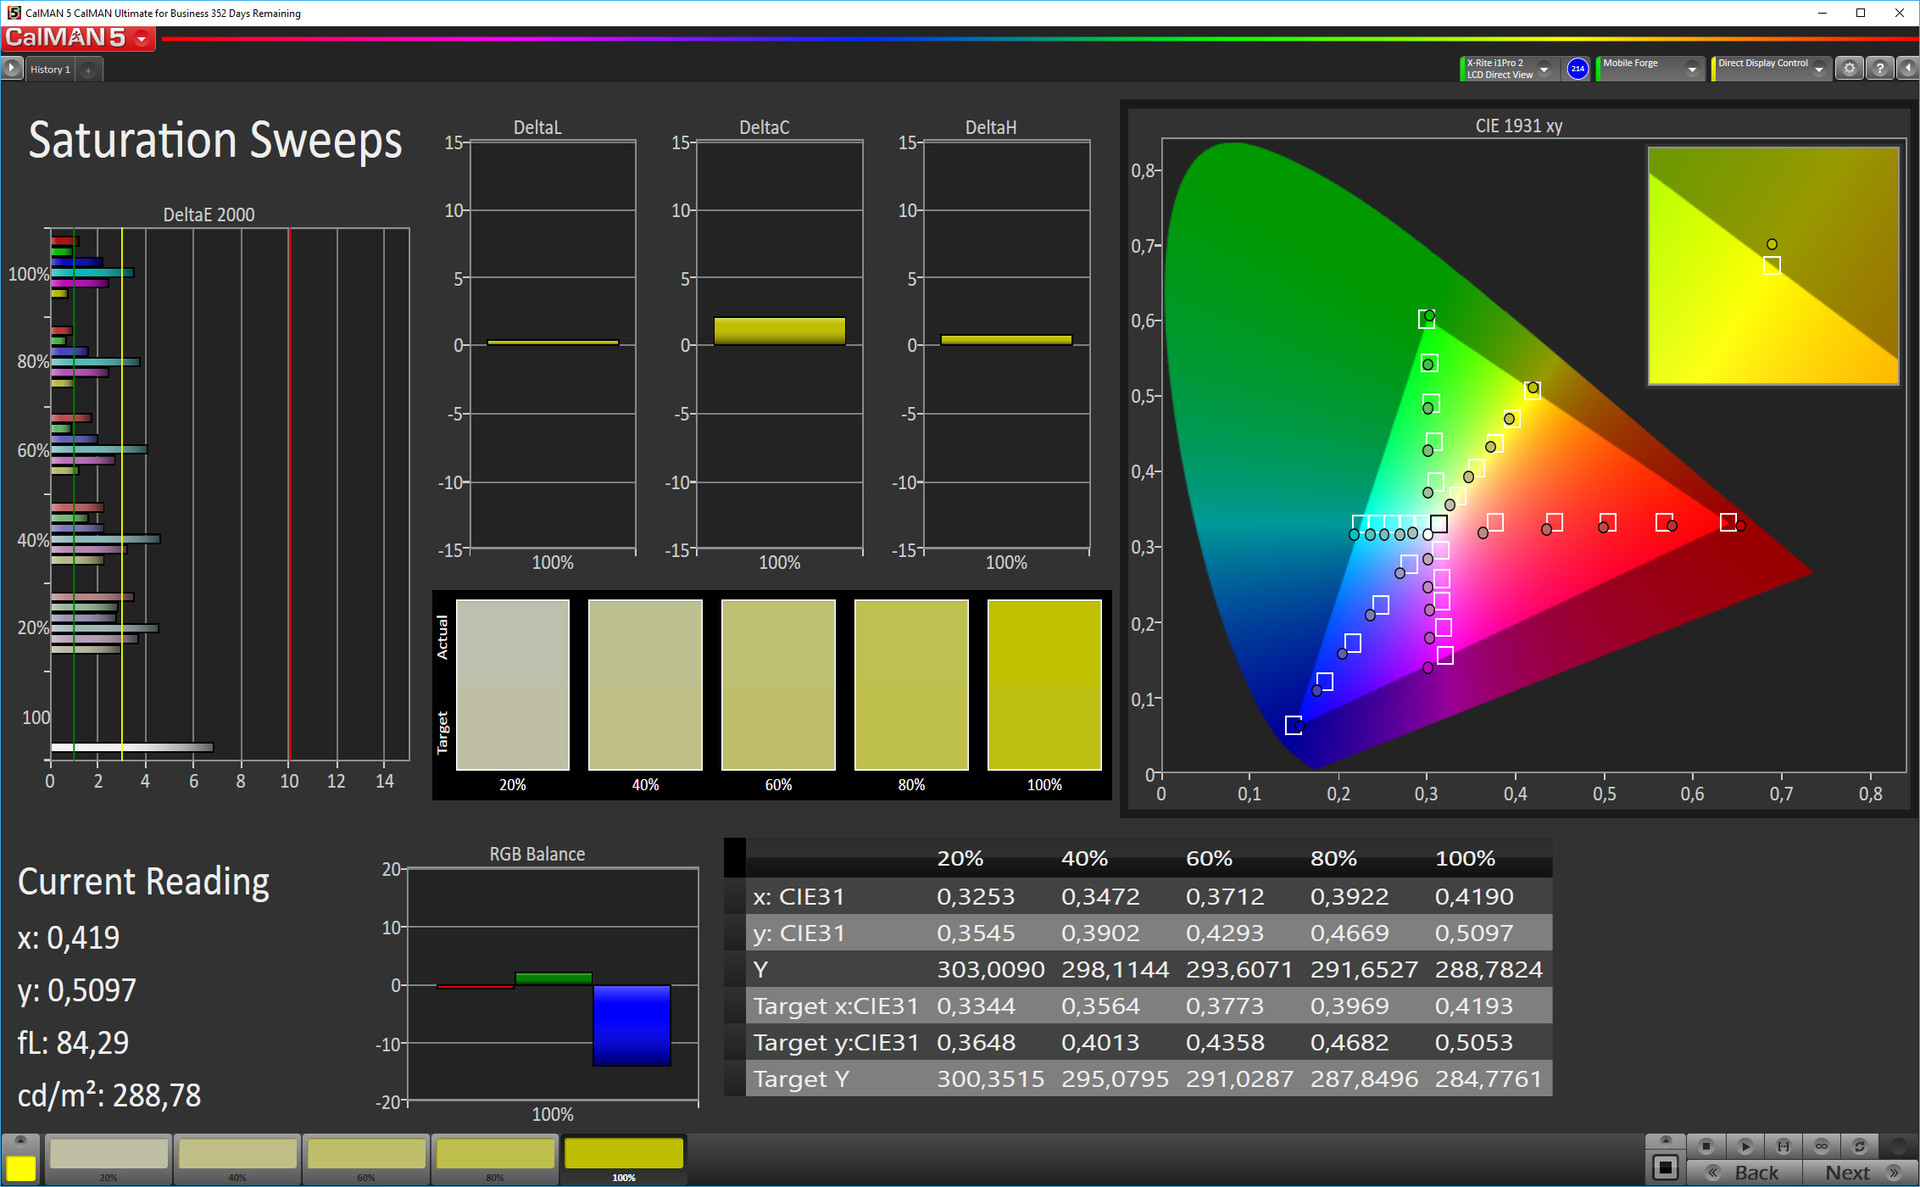
ΔE Color 2.7 | 0.5-29.43 Ø5
ΔE Greyscale 4.2 | 0.57-98 Ø5.3
Gamma: 2.23
| Xiaomi Mi Mix IPS, 2040x1080, 6.40 | Huawei Mate 9 IPS, 1920x1080, 5.90 | Samsung Galaxy S7 Edge Super AMOLED, 2560x1440, 5.50 | Google Pixel XL 2016 AMOLED, 2560x1440, 5.50 | OnePlus 3T Optic-AMOLED, 1920x1080, 5.50 | Microsoft Lumia 950 XL AMOLED, 2560x1440, 5.70 | Apple iPhone 7 Plus IPS, 1920x1080, 5.50 | |
|---|---|---|---|---|---|---|---|
| Screen | |||||||
| Brightness middle | 577 | 696 21% | 554 -4% | 402 -30% | 421 -27% | 297 -49% | 557 -3% |
| Brightness | 576 | 680 18% | 552 -4% | 408 -29% | 430 -25% | 297 -48% | 553 -4% |
| Brightness Distribution | 89 | 93 4% | 96 8% | 85 -4% | 84 -6% | 93 4% | 97 9% |
| Black Level * | 0.42 | 0.42 -0% | 0.35 17% | ||||
| Contrast | 1374 | 1657 21% | 1591 16% | ||||
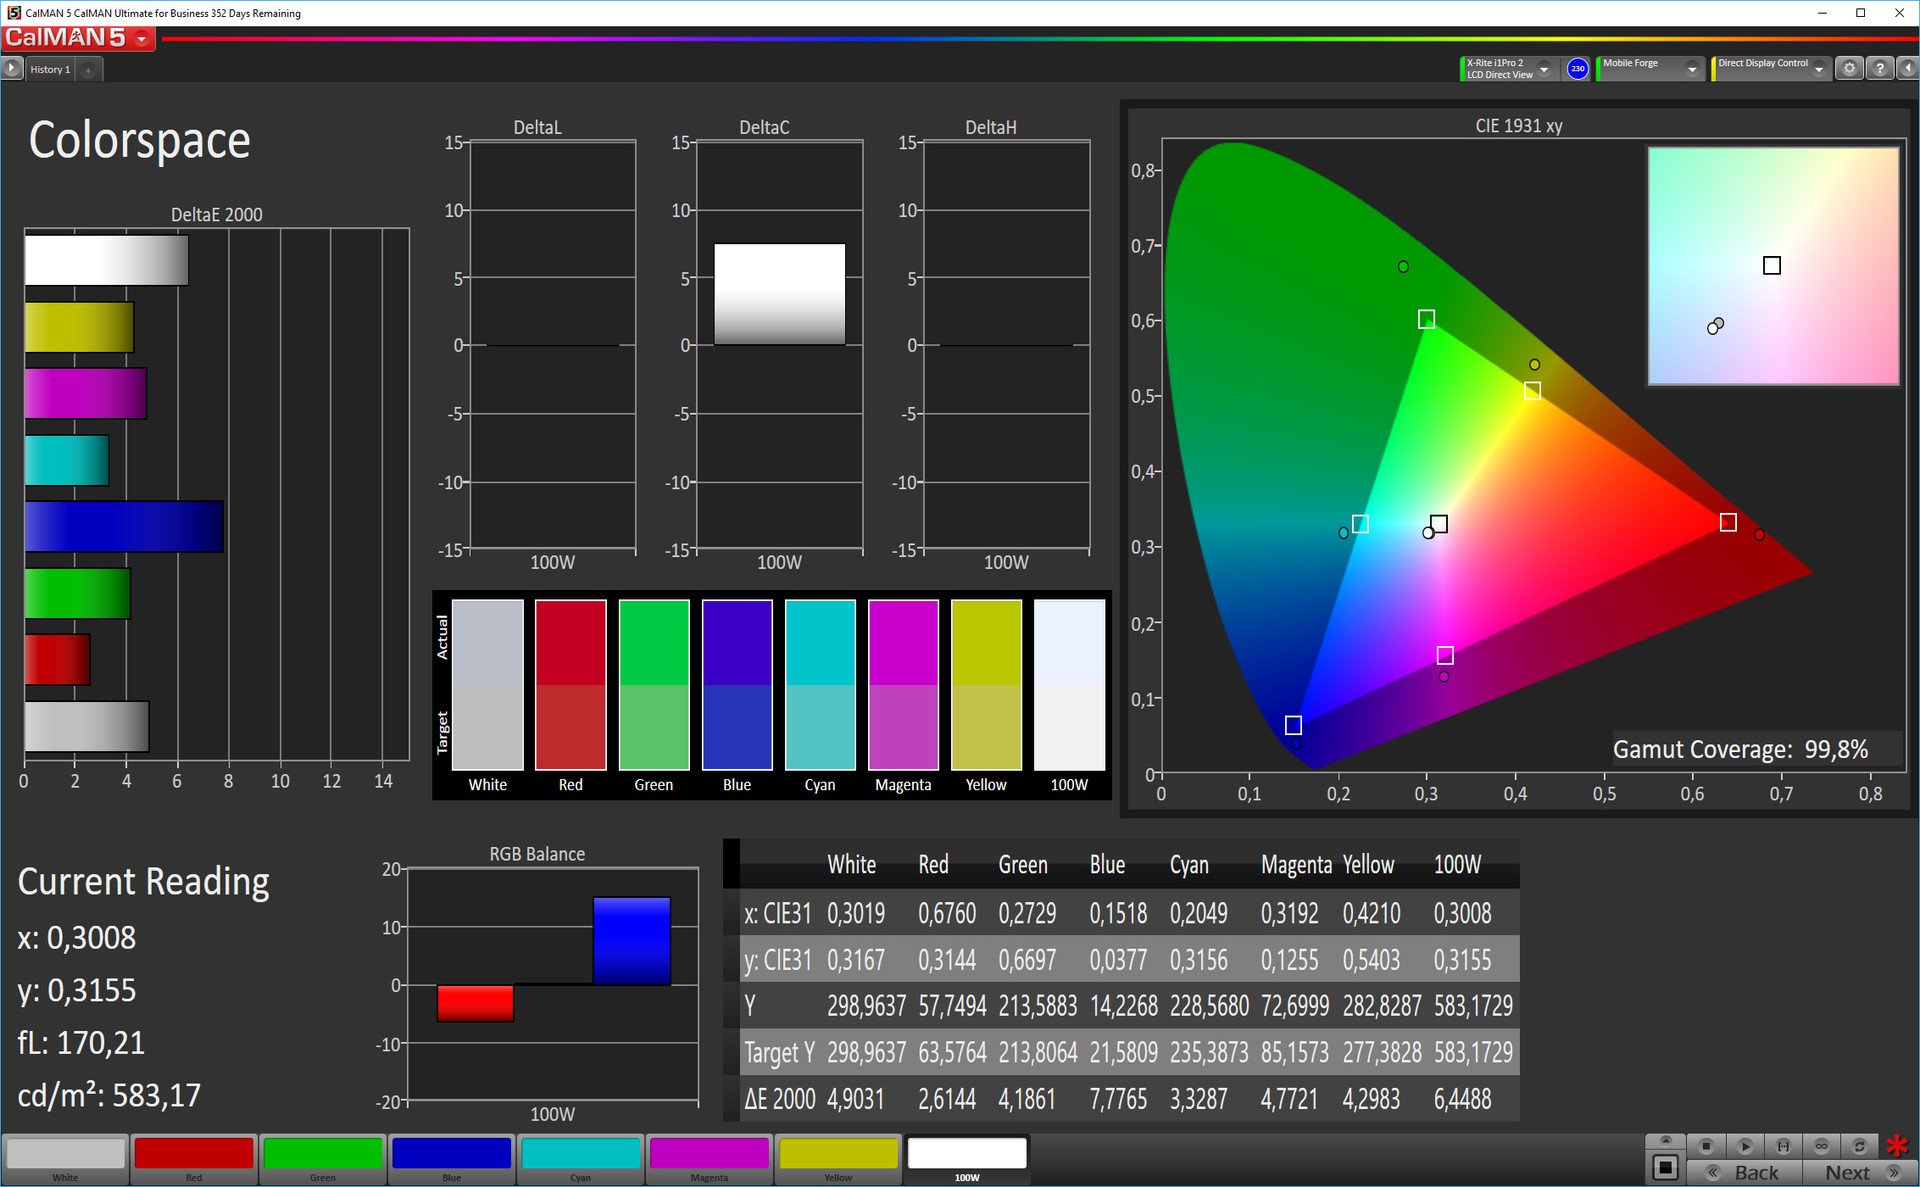
| Colorchecker dE 2000 * | 2.7 | 4.3 -59% | 1.59 41% | 4 -48% | 7.1 -163% | 2.67 1% | 1.4 48% |
| Colorchecker dE 2000 max. * | 6.9 | 9.4 -36% | 2.56 63% | 10.1 -46% | 15.3 -122% | 3.98 42% | 3.1 55% |
| Greyscale dE 2000 * | 4.2 | 4.8 -14% | 2.01 52% | 3.2 24% | 6.8 -62% | 2.81 33% | 1.3 69% |
| Gamma | 2.23 99% | 2.33 94% | 2.01 109% | 2.19 100% | 2.23 99% | 2.08 106% | 2.21 100% |
| CCT | 7287 89% | 7255 90% | 6321 103% | 7037 92% | 7866 83% | 6379 102% | 6667 97% |
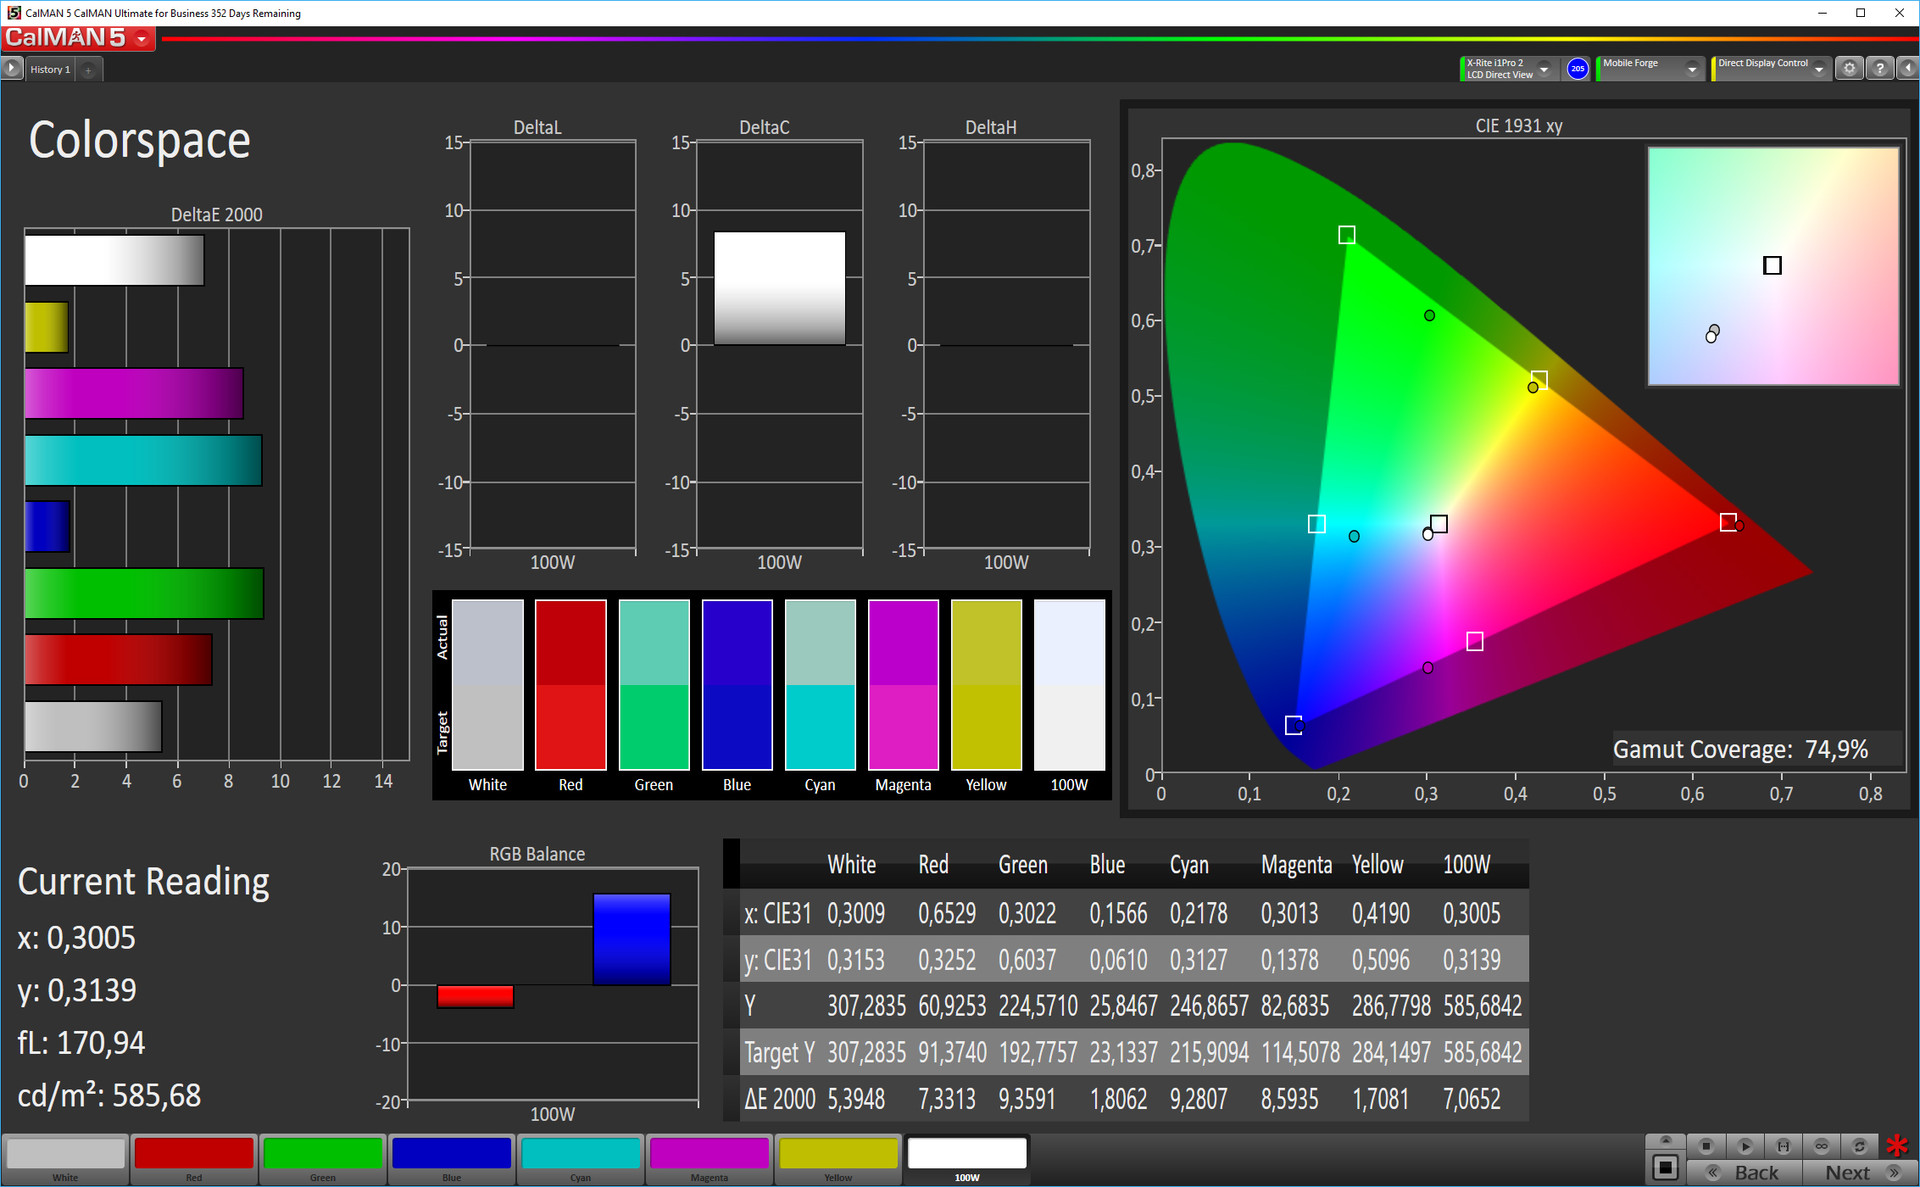
| Color Space (Percent of AdobeRGB 1998) | 82.12 | 66.31 | 63.1 | ||||
| Color Space (Percent of sRGB) | 99.98 | 99.79 | 99.83 |
* ... smaller is better
Screen Flickering / PWM (Pulse-Width Modulation)
| Screen flickering / PWM detected | 1136 Hz | ≤ 10 % brightness setting |  |
The display backlight flickers at 1136 Hz (worst case, e.g., utilizing PWM) Flickering detected at a brightness setting of 10 % and below. There should be no flickering or PWM above this brightness setting. The frequency of 1136 Hz is quite high, so most users sensitive to PWM should not notice any flickering. In comparison: 53 % of all tested devices do not use PWM to dim the display. If PWM was detected, an average of 17900 (minimum: 5 - maximum: 3846000) Hz was measured. | |||
Display Response Times
| ↔ Response Time Black to White | ||
|---|---|---|
| 37.2 ms ... rise ↗ and fall ↘ combined | ↗ 10.4 ms rise |  |
| ↘ 26.8 ms fall | ||
| The screen shows slow response rates in our tests and will be unsatisfactory for gamers. In comparison, all tested devices range from 0.1 (minimum) to 240 (maximum) ms. » 95 % of all devices are better. This means that the measured response time is worse than the average of all tested devices (21.5 ms). | ||
| ↔ Response Time 50% Grey to 80% Grey | ||
| 36 ms ... rise ↗ and fall ↘ combined | ↗ 14.8 ms rise | 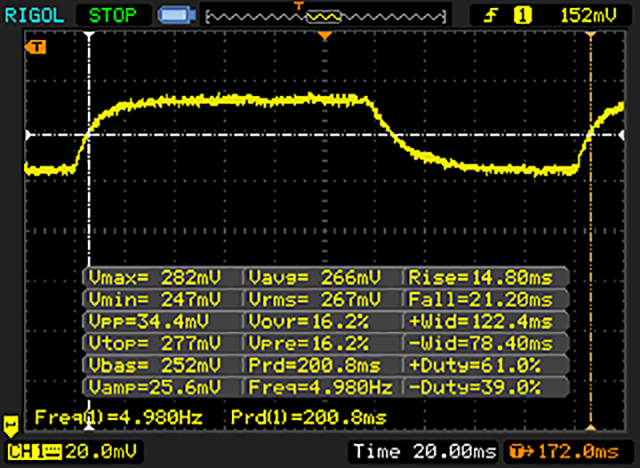 |
| ↘ 21.2 ms fall | ||
| The screen shows slow response rates in our tests and will be unsatisfactory for gamers. In comparison, all tested devices range from 0.2 (minimum) to 636 (maximum) ms. » 44 % of all devices are better. This means that the measured response time is similar to the average of all tested devices (33.7 ms). | ||


| AnTuTu v6 - Total Score (sort by value) | |
| Xiaomi Mi Mix | |
| Huawei Mate 9 | |
| Samsung Galaxy S7 Edge | |
| Google Pixel XL 2016 | |
| OnePlus 3T | |
| Microsoft Lumia 950 XL | |
| Apple iPhone 7 Plus | |
| Geekbench 4.0 | |
| 64 Bit Multi-Core Score (sort by value) | |
| Xiaomi Mi Mix | |
| Huawei Mate 9 | |
| Samsung Galaxy S7 Edge | |
| Google Pixel XL 2016 | |
| OnePlus 3T | |
| Apple iPhone 7 Plus | |
| 64 Bit Single-Core Score (sort by value) | |
| Xiaomi Mi Mix | |
| Huawei Mate 9 | |
| Samsung Galaxy S7 Edge | |
| Google Pixel XL 2016 | |
| OnePlus 3T | |
| Apple iPhone 7 Plus | |
| Compute RenderScript Score (sort by value) | |
| Xiaomi Mi Mix | |
| Huawei Mate 9 | |
| Samsung Galaxy S7 Edge | |
| Google Pixel XL 2016 | |
| PCMark for Android - Work performance score (sort by value) | |
| Xiaomi Mi Mix | |
| Huawei Mate 9 | |
| Samsung Galaxy S7 Edge | |
| Google Pixel XL 2016 | |
| OnePlus 3T | |
| GFXBench (DX / GLBenchmark) 2.7 | |
| T-Rex Onscreen (sort by value) | |
| Xiaomi Mi Mix | |
| Huawei Mate 9 | |
| Samsung Galaxy S7 Edge | |
| Google Pixel XL 2016 | |
| OnePlus 3T | |
| Microsoft Lumia 950 XL | |
| Apple iPhone 7 Plus | |
| 1920x1080 T-Rex Offscreen (sort by value) | |
| Xiaomi Mi Mix | |
| Huawei Mate 9 | |
| Samsung Galaxy S7 Edge | |
| Google Pixel XL 2016 | |
| OnePlus 3T | |
| Microsoft Lumia 950 XL | |
| Apple iPhone 7 Plus | |
| GFXBench 3.0 | |
| 1920x1080 1080p Manhattan Offscreen (sort by value) | |
| Xiaomi Mi Mix | |
| Huawei Mate 9 | |
| Samsung Galaxy S7 Edge | |
| Google Pixel XL 2016 | |
| OnePlus 3T | |
| Microsoft Lumia 950 XL | |
| Apple iPhone 7 Plus | |
| on screen Manhattan Onscreen OGL (sort by value) | |
| Xiaomi Mi Mix | |
| Huawei Mate 9 | |
| Samsung Galaxy S7 Edge | |
| Google Pixel XL 2016 | |
| OnePlus 3T | |
| Microsoft Lumia 950 XL | |
| Apple iPhone 7 Plus | |
| GFXBench 3.1 | |
| 1920x1080 Manhattan ES 3.1 Offscreen (sort by value) | |
| Xiaomi Mi Mix | |
| Huawei Mate 9 | |
| Samsung Galaxy S7 Edge | |
| Google Pixel XL 2016 | |
| OnePlus 3T | |
| Apple iPhone 7 Plus | |
| on screen Manhattan ES 3.1 Onscreen (sort by value) | |
| Xiaomi Mi Mix | |
| Huawei Mate 9 | |
| Samsung Galaxy S7 Edge | |
| Google Pixel XL 2016 | |
| OnePlus 3T | |
| Apple iPhone 7 Plus | |
| 3DMark | |
| 1280x720 offscreen Ice Storm Unlimited Score (sort by value) | |
| Xiaomi Mi Mix | |
| Huawei Mate 9 | |
| Samsung Galaxy S7 Edge | |
| Google Pixel XL 2016 | |
| OnePlus 3T | |
| Apple iPhone 7 Plus | |
| 1280x720 offscreen Ice Storm Unlimited Graphics Score (sort by value) | |
| Xiaomi Mi Mix | |
| Huawei Mate 9 | |
| Samsung Galaxy S7 Edge | |
| Google Pixel XL 2016 | |
| OnePlus 3T | |
| Apple iPhone 7 Plus | |
| 1280x720 offscreen Ice Storm Unlimited Physics (sort by value) | |
| Xiaomi Mi Mix | |
| Huawei Mate 9 | |
| Samsung Galaxy S7 Edge | |
| Google Pixel XL 2016 | |
| OnePlus 3T | |
| Apple iPhone 7 Plus | |
| 2560x1440 Sling Shot OpenGL ES 3.0 Physics (sort by value) | |
| Xiaomi Mi Mix | |
| Huawei Mate 9 | |
| Samsung Galaxy S7 Edge | |
| Google Pixel XL 2016 | |
| OnePlus 3T | |
| Apple iPhone 7 Plus | |
| 2560x1440 Sling Shot OpenGL ES 3.0 Graphics (sort by value) | |
| Xiaomi Mi Mix | |
| Huawei Mate 9 | |
| Samsung Galaxy S7 Edge | |
| Google Pixel XL 2016 | |
| OnePlus 3T | |
| Apple iPhone 7 Plus | |
| 2560x1440 Sling Shot OpenGL ES 3.0 (sort by value) | |
| Xiaomi Mi Mix | |
| Huawei Mate 9 | |
| Samsung Galaxy S7 Edge | |
| Google Pixel XL 2016 | |
| OnePlus 3T | |
| Apple iPhone 7 Plus | |
| Mozilla Kraken 1.1 - Total (sort by value) | |
| Xiaomi Mi Mix | |
| Huawei Mate 9 | |
| Samsung Galaxy S7 Edge | |
| Google Pixel XL 2016 | |
| OnePlus 3T | |
| Microsoft Lumia 950 XL | |
| Apple iPhone 7 Plus | |
| Octane V2 - Total Score (sort by value) | |
| Xiaomi Mi Mix | |
| Huawei Mate 9 | |
| Samsung Galaxy S7 Edge | |
| Google Pixel XL 2016 | |
| OnePlus 3T | |
| Microsoft Lumia 950 XL | |
| Apple iPhone 7 Plus | |
| WebXPRT 2015 - Overall (sort by value) | |
| Xiaomi Mi Mix | |
| Huawei Mate 9 | |
| Samsung Galaxy S7 Edge | |
| Google Pixel XL 2016 | |
| OnePlus 3T | |
| Microsoft Lumia 950 XL | |
| Apple iPhone 7 Plus | |
| JetStream 1.1 - Total Score (sort by value) | |
| Xiaomi Mi Mix | |
| Huawei Mate 9 | |
| Samsung Galaxy S7 Edge | |
| Google Pixel XL 2016 | |
| OnePlus 3T | |
| Microsoft Lumia 950 XL | |
| Apple iPhone 7 Plus | |
* ... smaller is better
| Xiaomi Mi Mix | Huawei Mate 9 | Samsung Galaxy S7 Edge | Google Pixel XL 2016 | OnePlus 3T | Microsoft Lumia 950 XL | Apple iPhone 7 Plus | |
|---|---|---|---|---|---|---|---|
| AndroBench 3-5 | |||||||
| Random Read 4KB | 116.6 | 94.7 -19% | 86.7 -26% | 87.7 -25% | 123.6 6% | ||
| Random Write 4KB | 15.15 | 8.77 -42% | 15.79 4% | 14.56 -4% | 74.4 391% | ||
| Sequential Write 256KB | 161.3 | 142.9 -11% | 145.1 -10% | 83.4 -48% | 165.3 2% | ||
| Sequential Read 256KB | 409.9 | 594 45% | 487.3 19% | 258.2 -37% | 436.4 6% | ||
| Sequential Write 256KB SDCard | 29.53 | 50.4 | |||||
| Sequential Read 256KB SDCard | 54 | 76.4 | |||||
| BaseMark OS II | |||||||
| Memory | 1747 | 3850 120% | 2072 19% | 1677 -4% | 1954 12% | 1945 11% | 1319 -24% |
| Asphalt 8: Airborne | |||
| Configurações | Valor | ||
| high | 29 fps | ||
| very low | 29 fps | ||
| Real Racing 3 | |||
| Configurações | Valor | ||
| high | 51 fps | ||
| low | 60 fps | ||
(±) The maximum temperature on the upper side is 40.2 °C / 104 F, compared to the average of 35 °C / 95 F, ranging from 21.9 to 56 °C for the class Smartphone.
(+) The bottom heats up to a maximum of 36.2 °C / 97 F, compared to the average of 33.8 °C / 93 F
(±) In idle usage, the average temperature for the upper side is 32 °C / 90 F, compared to the device average of 32.7 °C / 91 F.
Xiaomi Mi Mix audio analysis
(+) | speakers can play relatively loud (88.4 dB)
Bass 100 - 315 Hz
(-) | nearly no bass - on average 21.8% lower than median
(±) | linearity of bass is average (10.6% delta to prev. frequency)
Mids 400 - 2000 Hz
(+) | balanced mids - only 3.2% away from median
(+) | mids are linear (3.7% delta to prev. frequency)
Highs 2 - 16 kHz
(±) | higher highs - on average 7.5% higher than median
(+) | highs are linear (3.2% delta to prev. frequency)
Overall 100 - 16.000 Hz
(±) | linearity of overall sound is average (18.9% difference to median)
Compared to same class
» 17% of all tested devices in this class were better, 9% similar, 74% worse
» The best had a delta of 12%, average was 38%, worst was 134%
Compared to all devices tested
» 39% of all tested devices were better, 8% similar, 54% worse
» The best had a delta of 4%, average was 25%, worst was 134%
Huawei Mate 9 audio analysis
(+) | speakers can play relatively loud (83.9 dB)
Bass 100 - 315 Hz
(-) | nearly no bass - on average 24.1% lower than median
(±) | linearity of bass is average (11.1% delta to prev. frequency)
Mids 400 - 2000 Hz
(+) | balanced mids - only 3.2% away from median
(±) | linearity of mids is average (8.6% delta to prev. frequency)
Highs 2 - 16 kHz
(±) | higher highs - on average 10.4% higher than median
(+) | highs are linear (3.8% delta to prev. frequency)
Overall 100 - 16.000 Hz
(±) | linearity of overall sound is average (25.2% difference to median)
Compared to same class
» 56% of all tested devices in this class were better, 8% similar, 36% worse
» The best had a delta of 12%, average was 38%, worst was 134%
Compared to all devices tested
» 73% of all tested devices were better, 6% similar, 21% worse
» The best had a delta of 4%, average was 25%, worst was 134%
| desligado | |
| Ocioso | |
| Carga |
|
| Xiaomi Mi Mix 4400 mAh | Huawei Mate 9 4000 mAh | Samsung Galaxy S7 Edge 3600 mAh | Google Pixel XL 2016 3450 mAh | OnePlus 3T 3400 mAh | Microsoft Lumia 950 XL 3340 mAh | Apple iPhone 7 Plus 2915 mAh | |
|---|---|---|---|---|---|---|---|
| Power Consumption | 18% | 37% | 45% | 21% | -57% | 19% | |
| Idle Minimum * | 0.87 | 0.78 10% | 0.63 28% | 0.53 39% | 0.61 30% | 2.85 -228% | 0.77 11% |
| Idle Average * | 2.16 | 2.13 1% | 1.1 49% | 1.07 50% | 1.77 18% | 2.95 -37% | 2.04 6% |
| Idle Maximum * | 2.28 | 2.17 5% | 1.56 32% | 1.12 51% | 1.81 21% | 3.26 -43% | 2.24 2% |
| Load Average * | 9.21 | 6.32 31% | 5.95 35% | 5.53 40% | 6.67 28% | 8.92 3% | 4.69 49% |
| Load Maximum * | 11.76 | 6.49 45% | 6.7 43% | 6.26 47% | 10.98 7% | 9.39 20% | 8.66 26% |
* ... smaller is better
| Xiaomi Mi Mix 4400 mAh | Huawei Mate 9 4000 mAh | Samsung Galaxy S7 Edge 3600 mAh | Google Pixel XL 2016 3450 mAh | OnePlus 3T 3400 mAh | Microsoft Lumia 950 XL 3340 mAh | Apple iPhone 7 Plus 2915 mAh | |
|---|---|---|---|---|---|---|---|
| Battery Runtime | -6% | 9% | -29% | -16% | -40% | -12% | |
| Reader / Idle | 1797 | 1538 -14% | 1663 -7% | 1333 -26% | 1423 -21% | 1078 -40% | 1835 2% |
| H.264 | 964 | 947 -2% | 914 -5% | 505 -48% | 810 -16% | 611 -37% | 813 -16% |
| WiFi v1.3 | 644 | 758 18% | 732 14% | 505 -22% | 494 -23% | 369 -43% | 587 -9% |
| Load | 292 | 219 -25% | 392 34% | 230 -21% | 282 -3% | 179 -39% | 225 -23% |
Pro
Contra
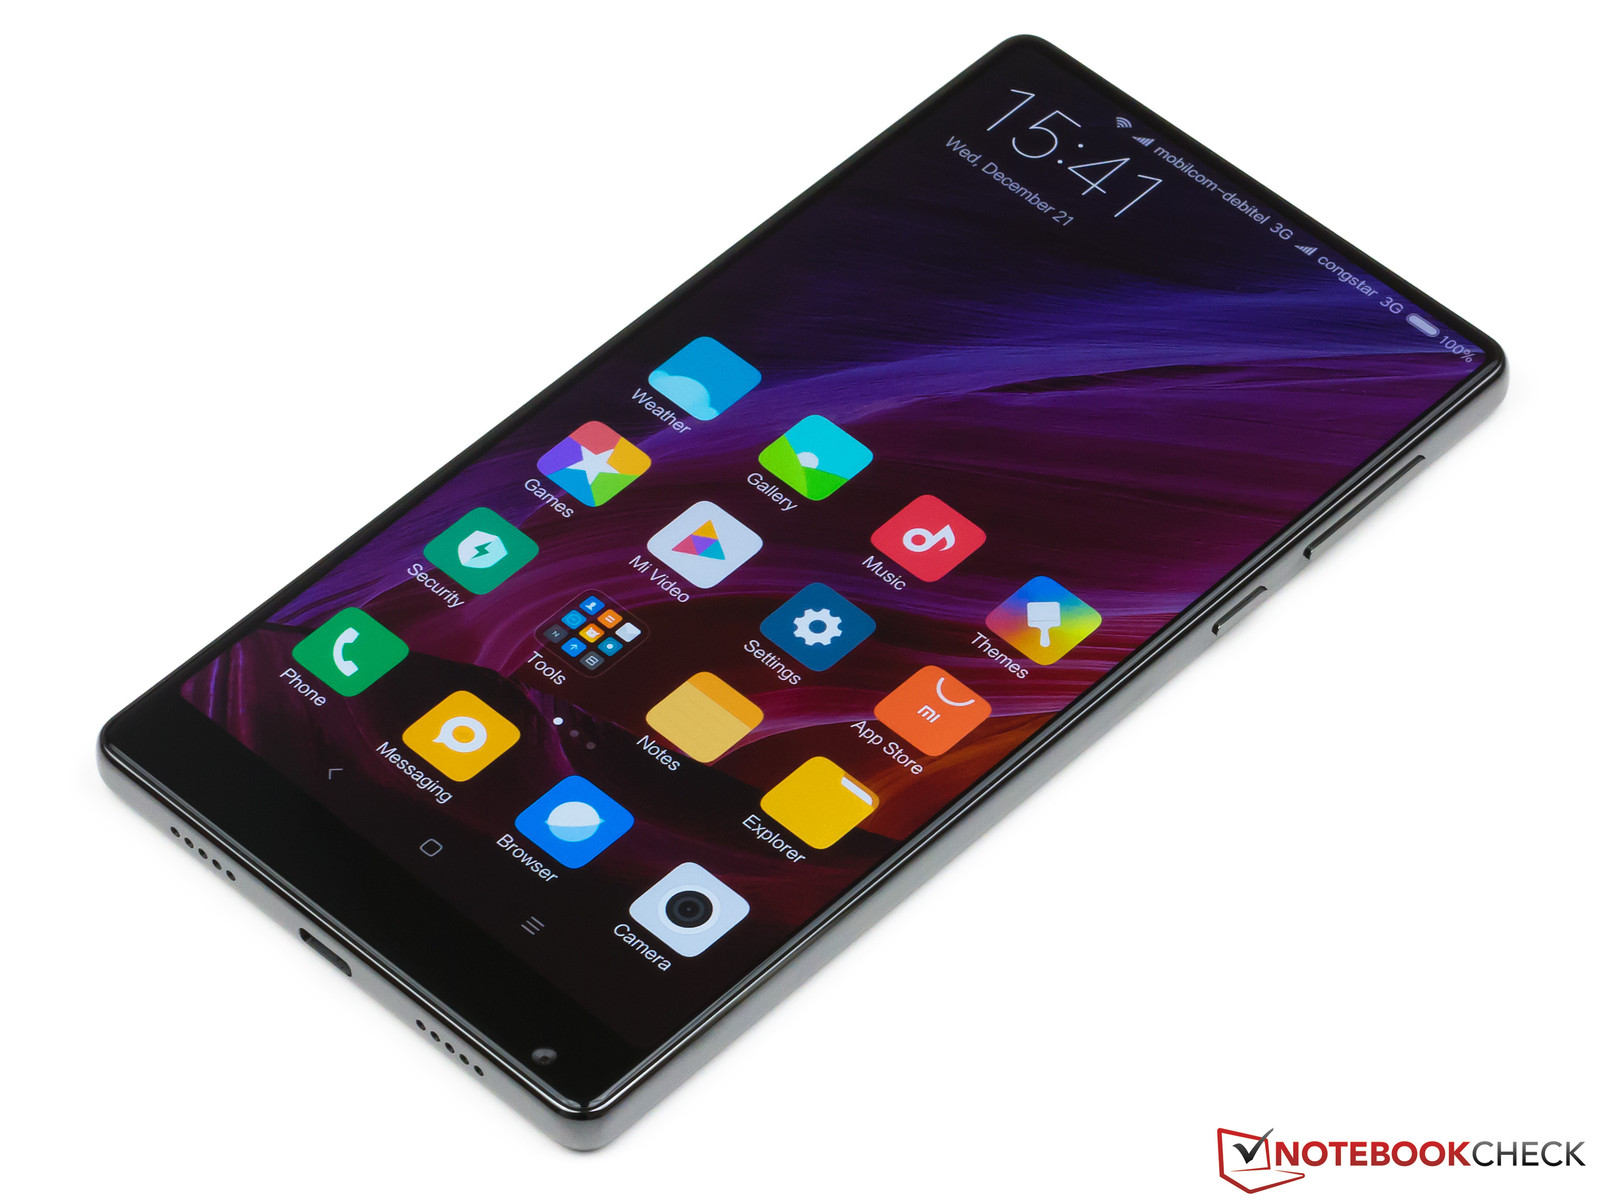
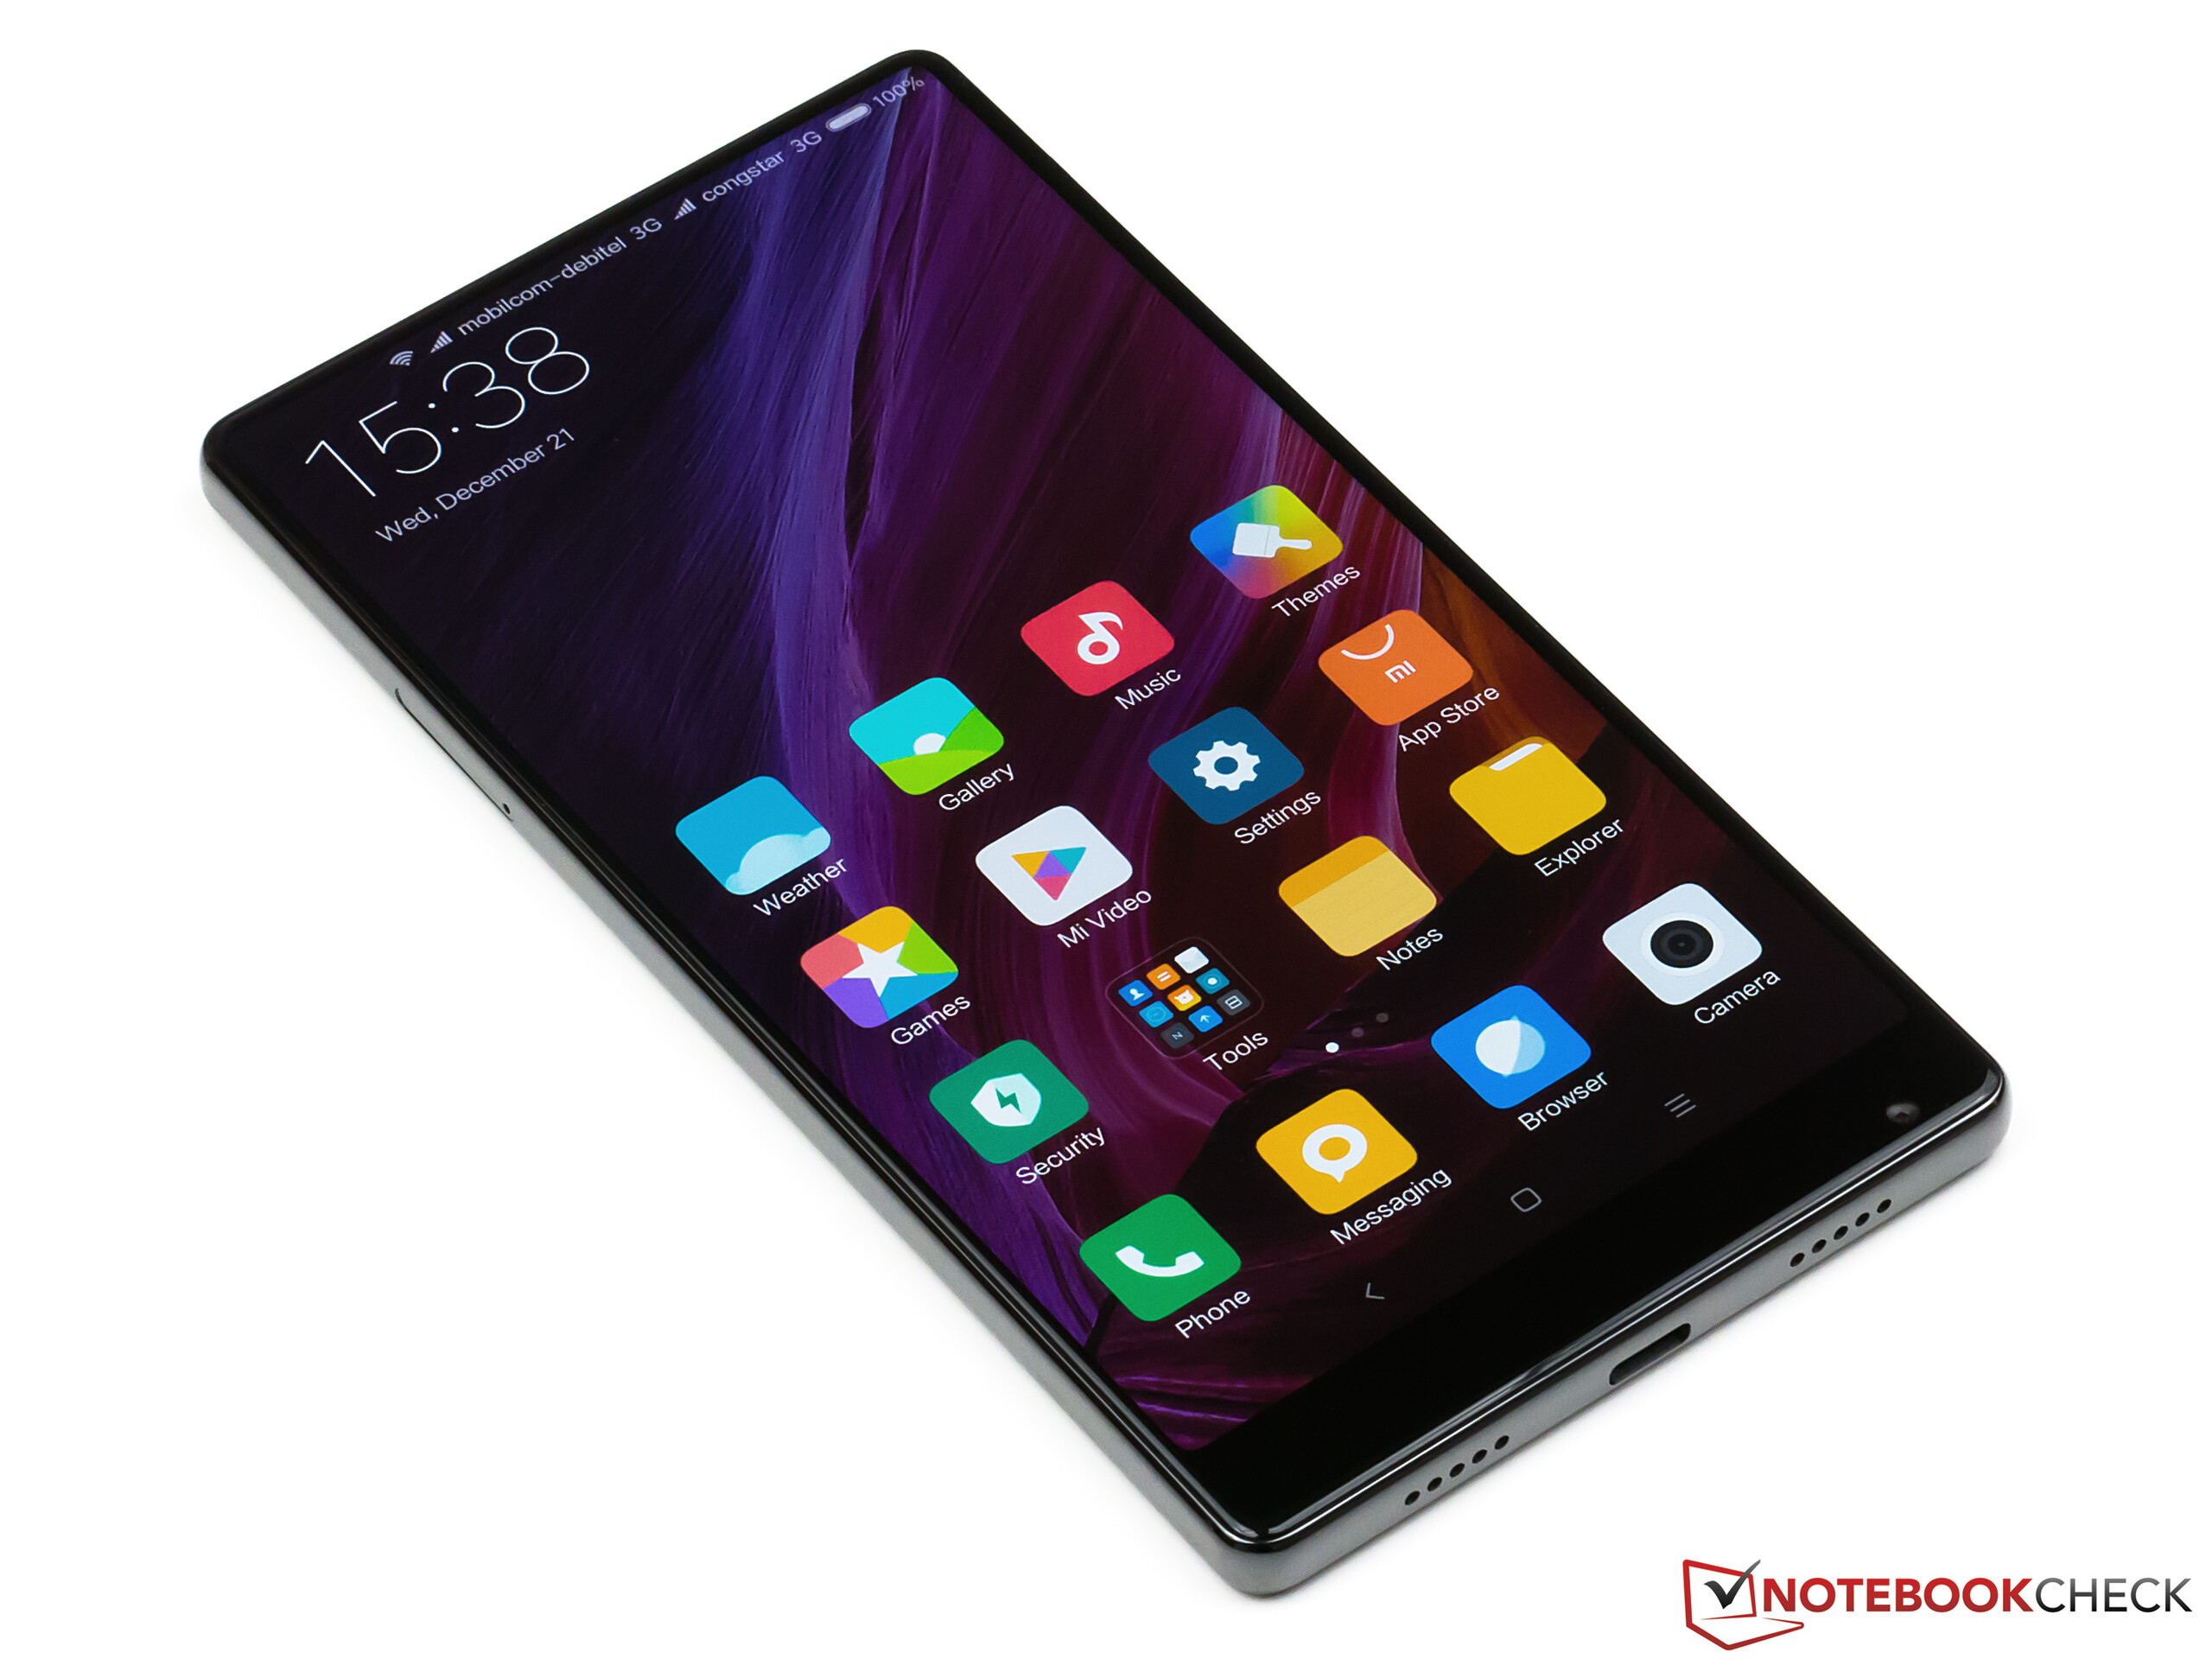
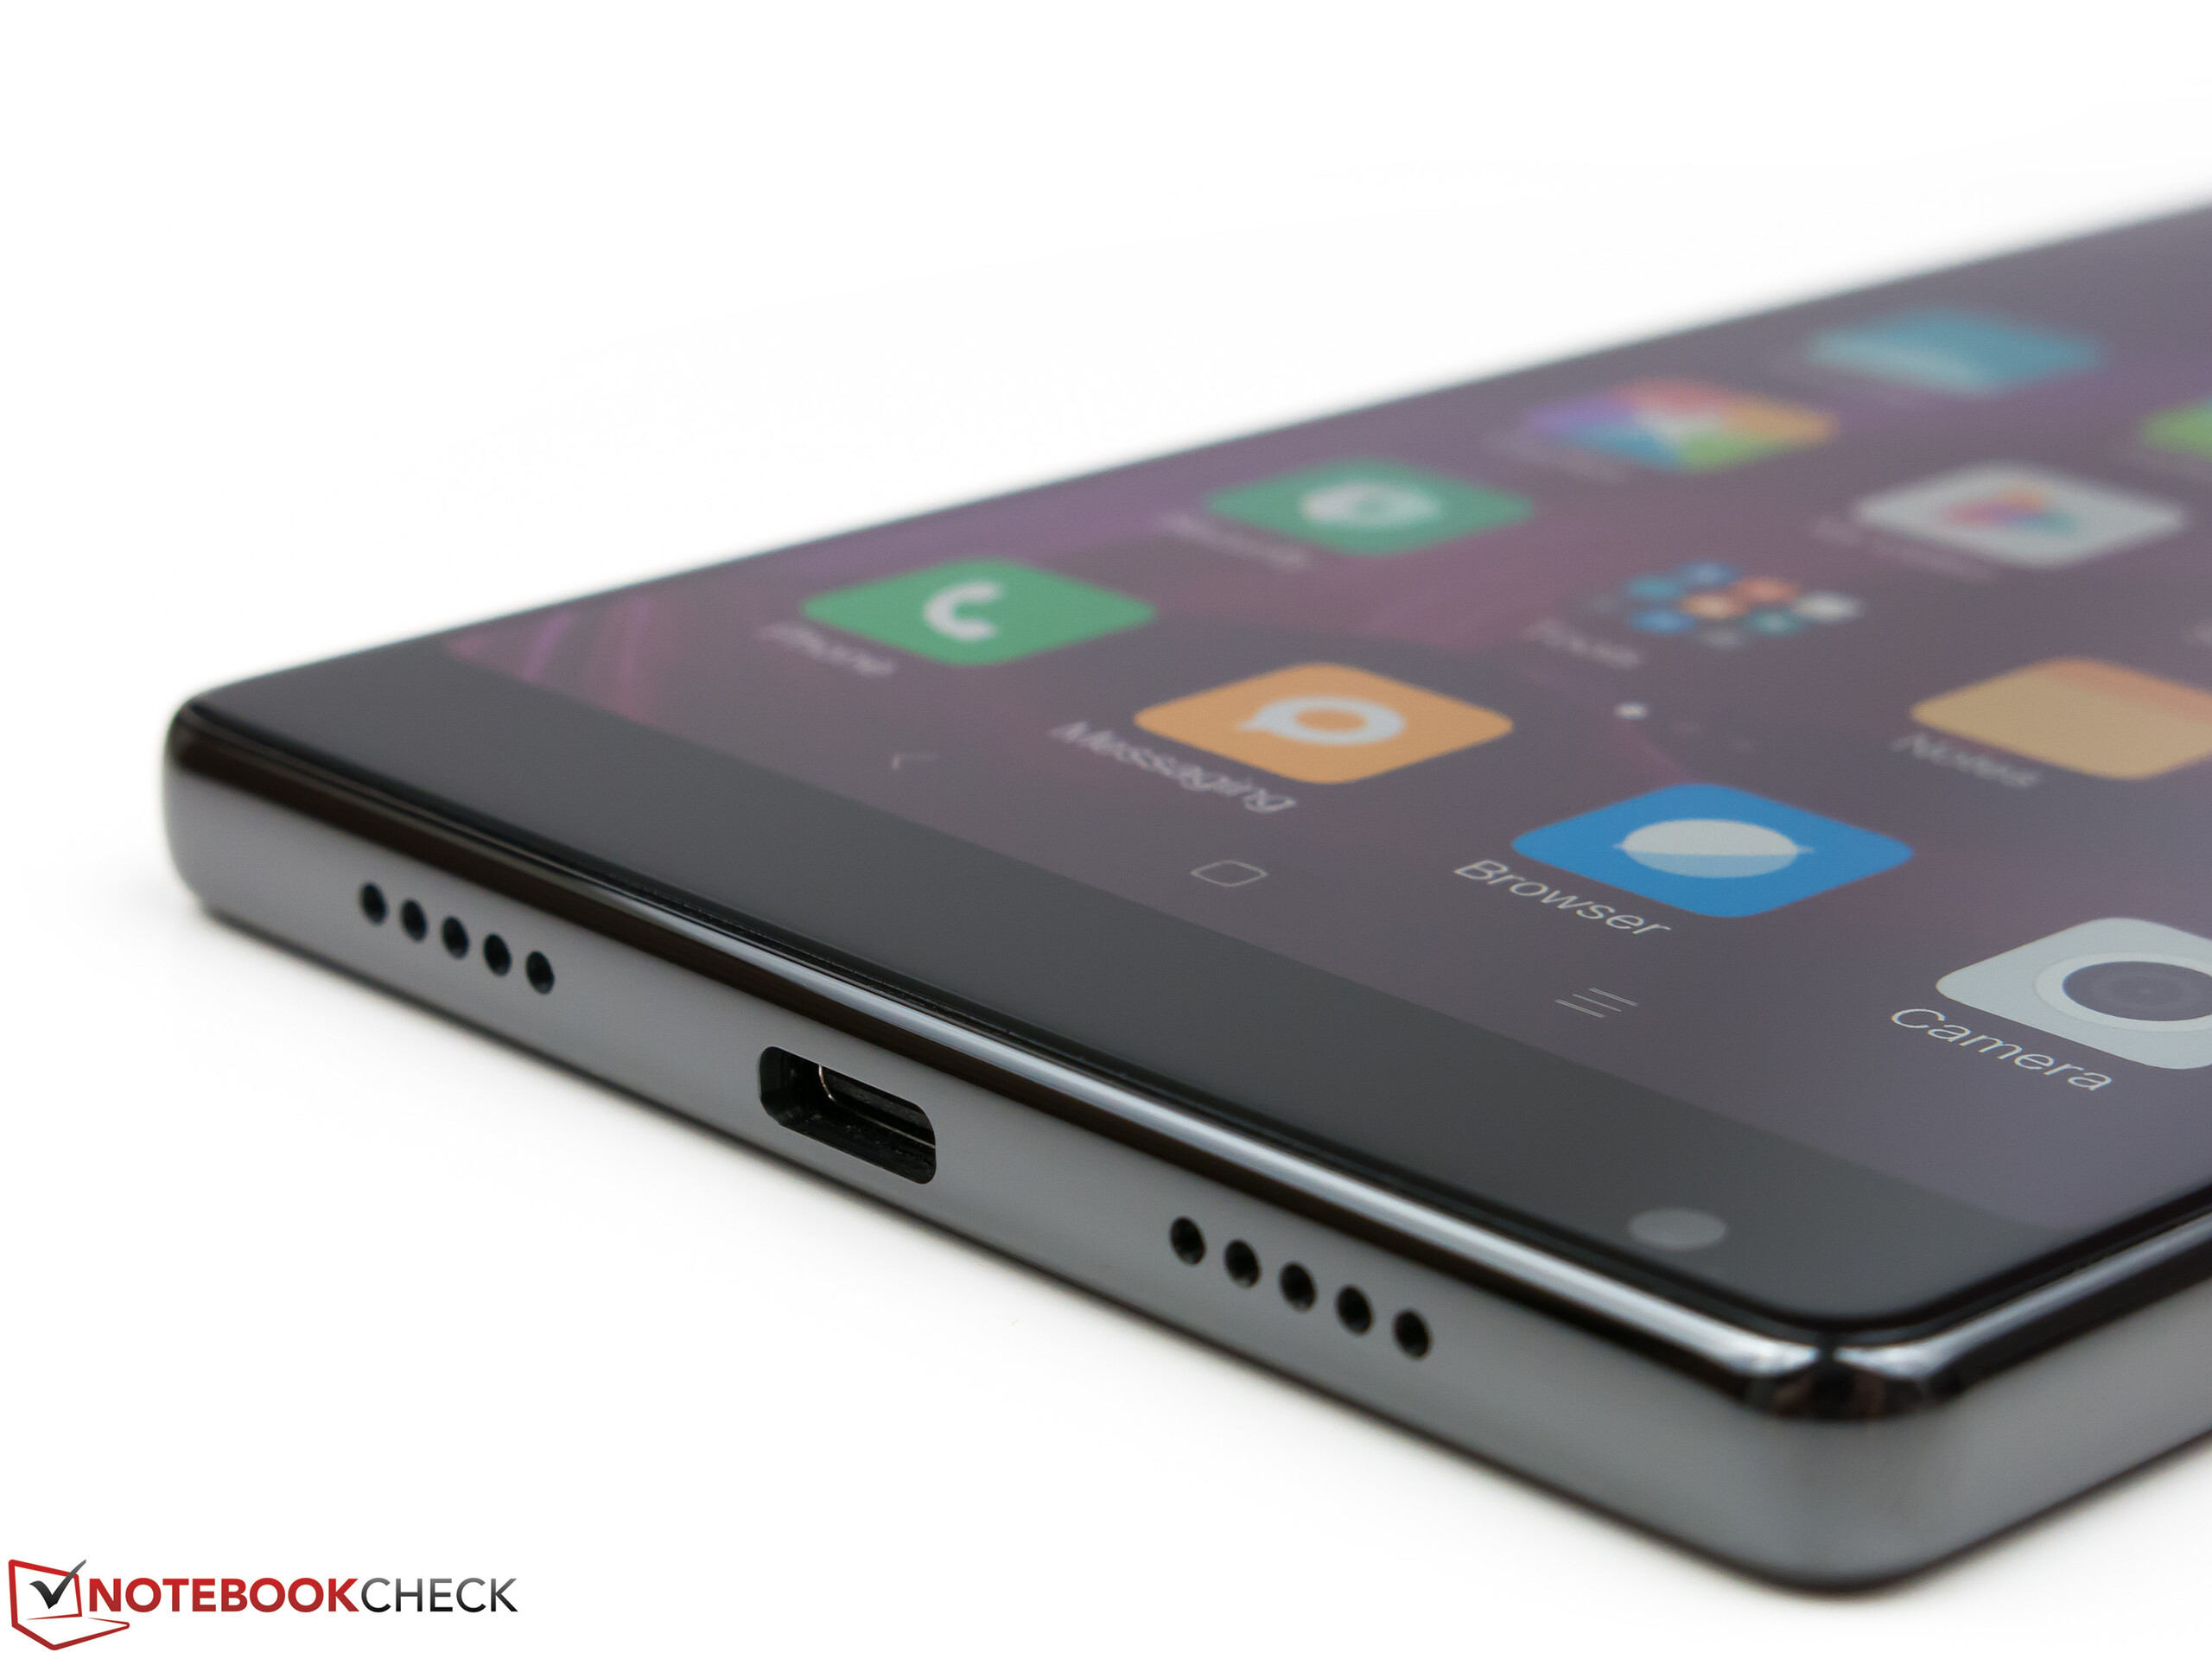
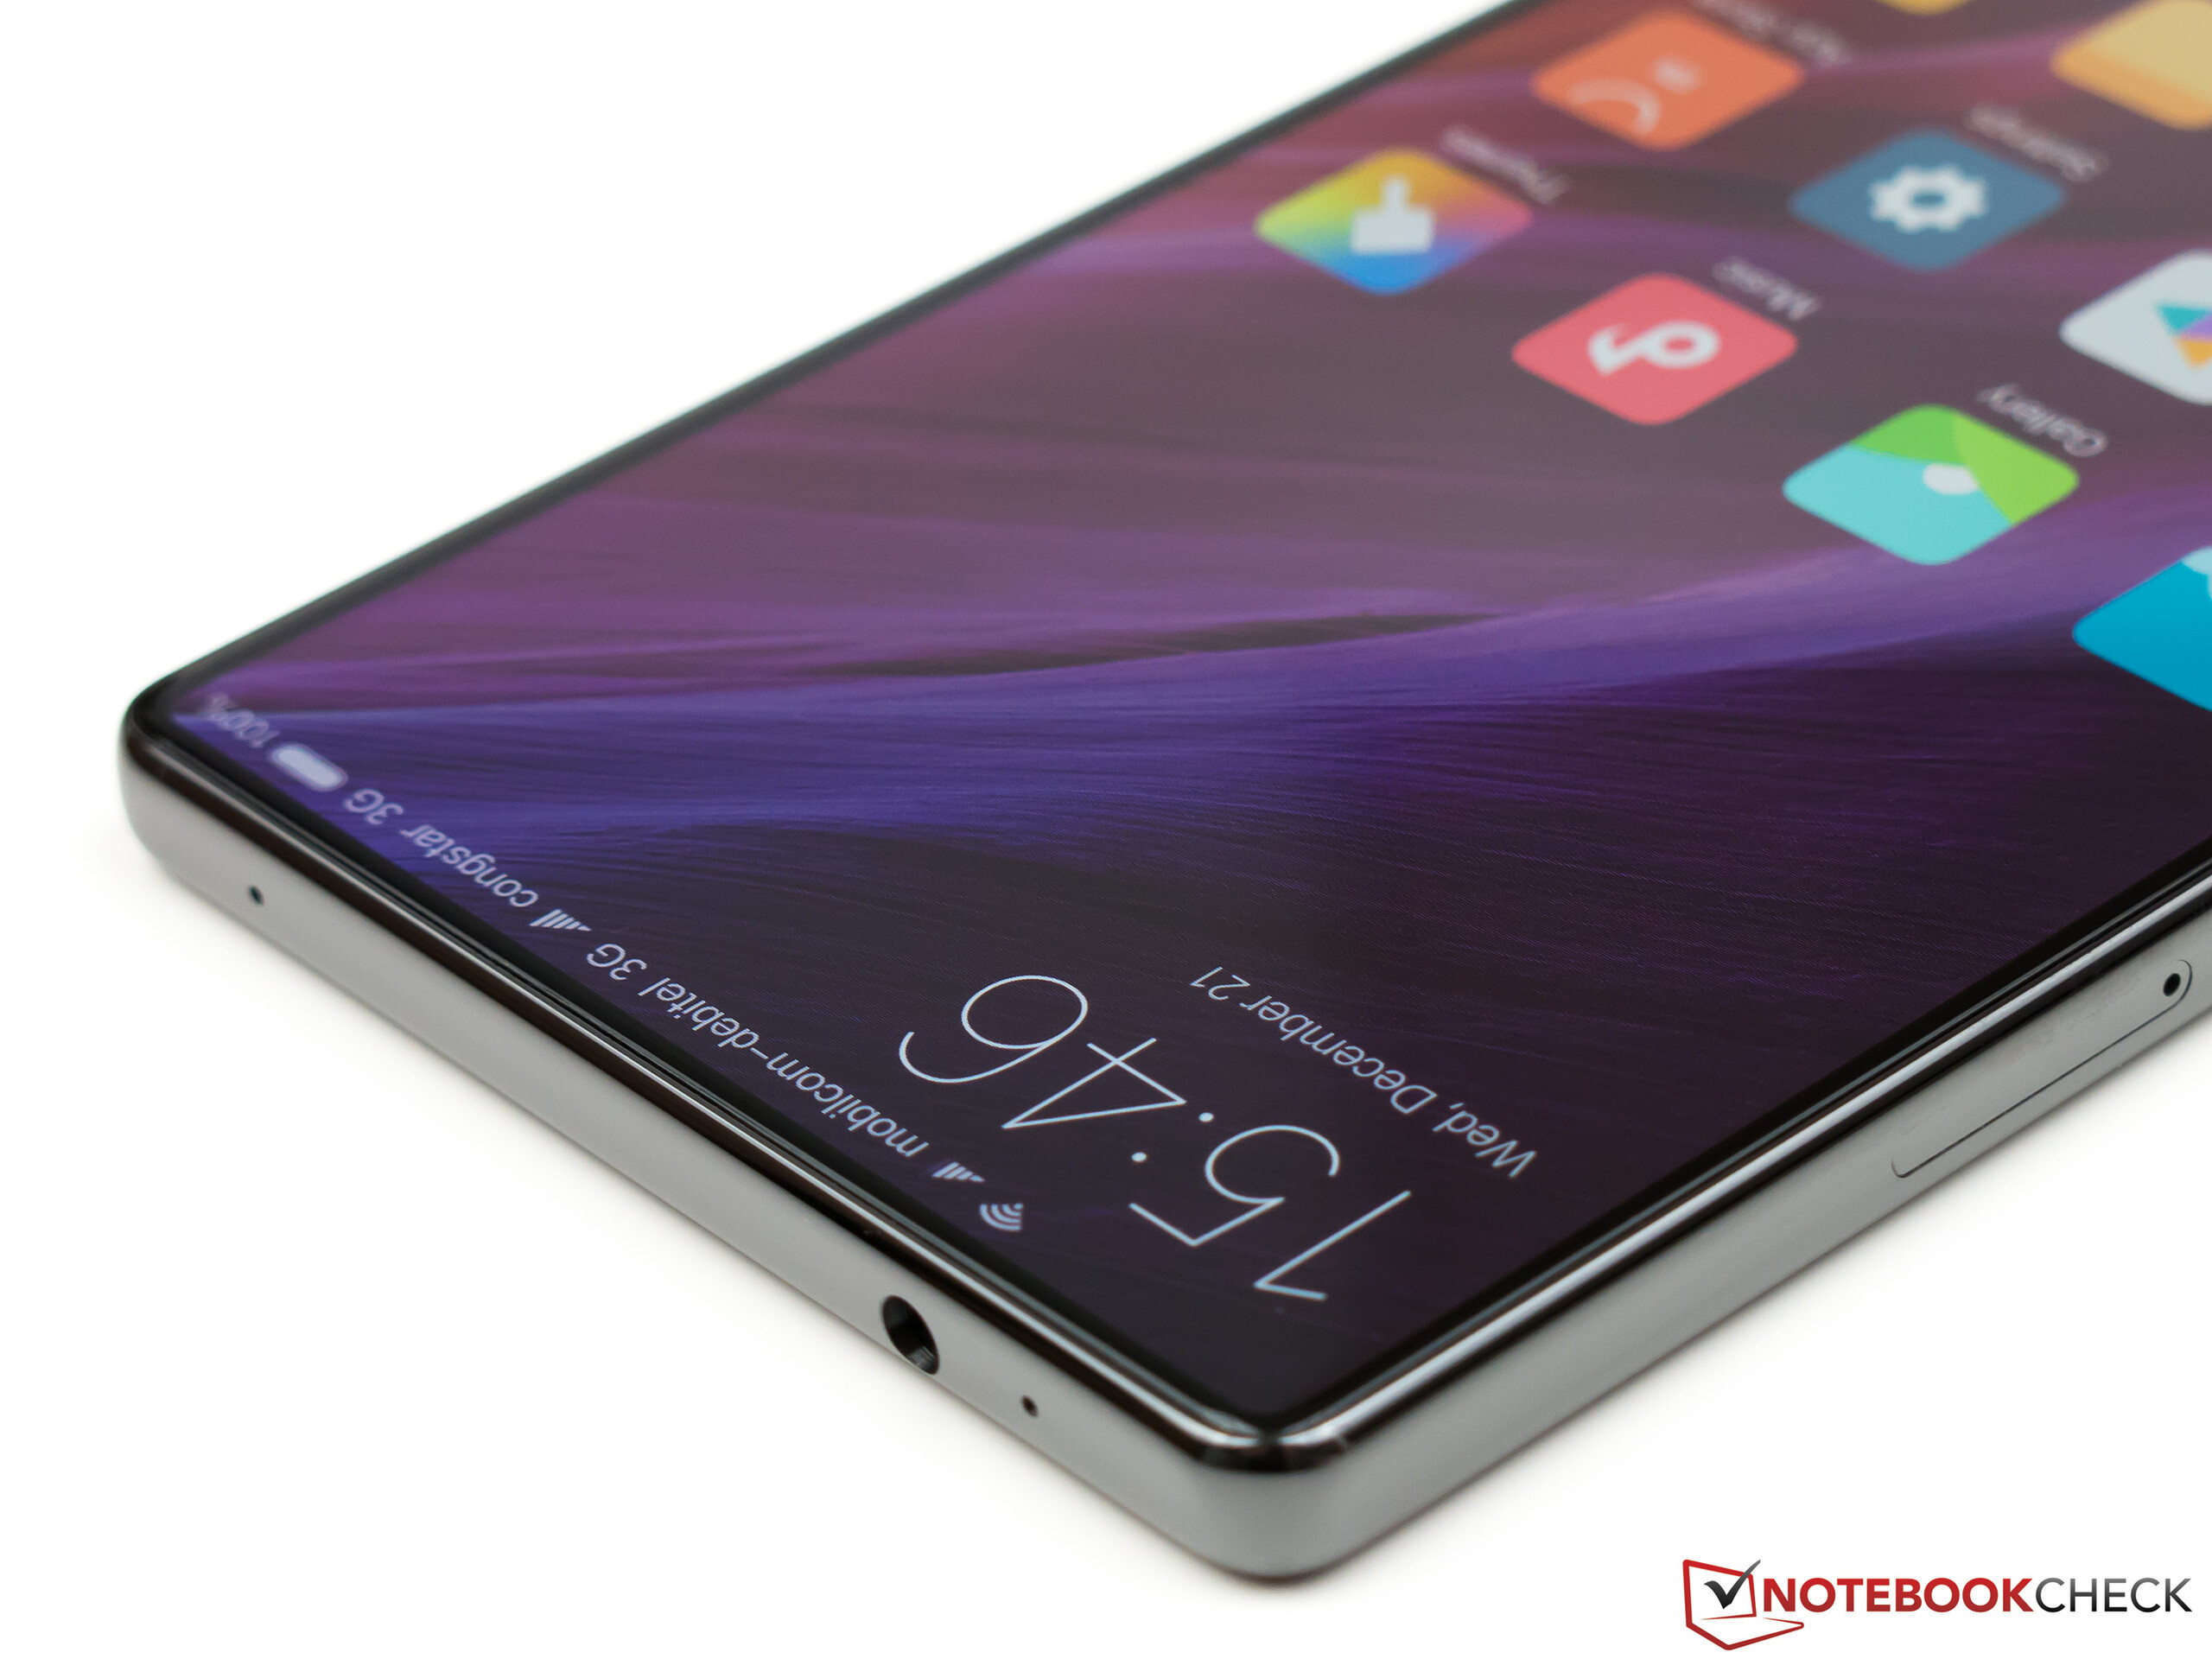
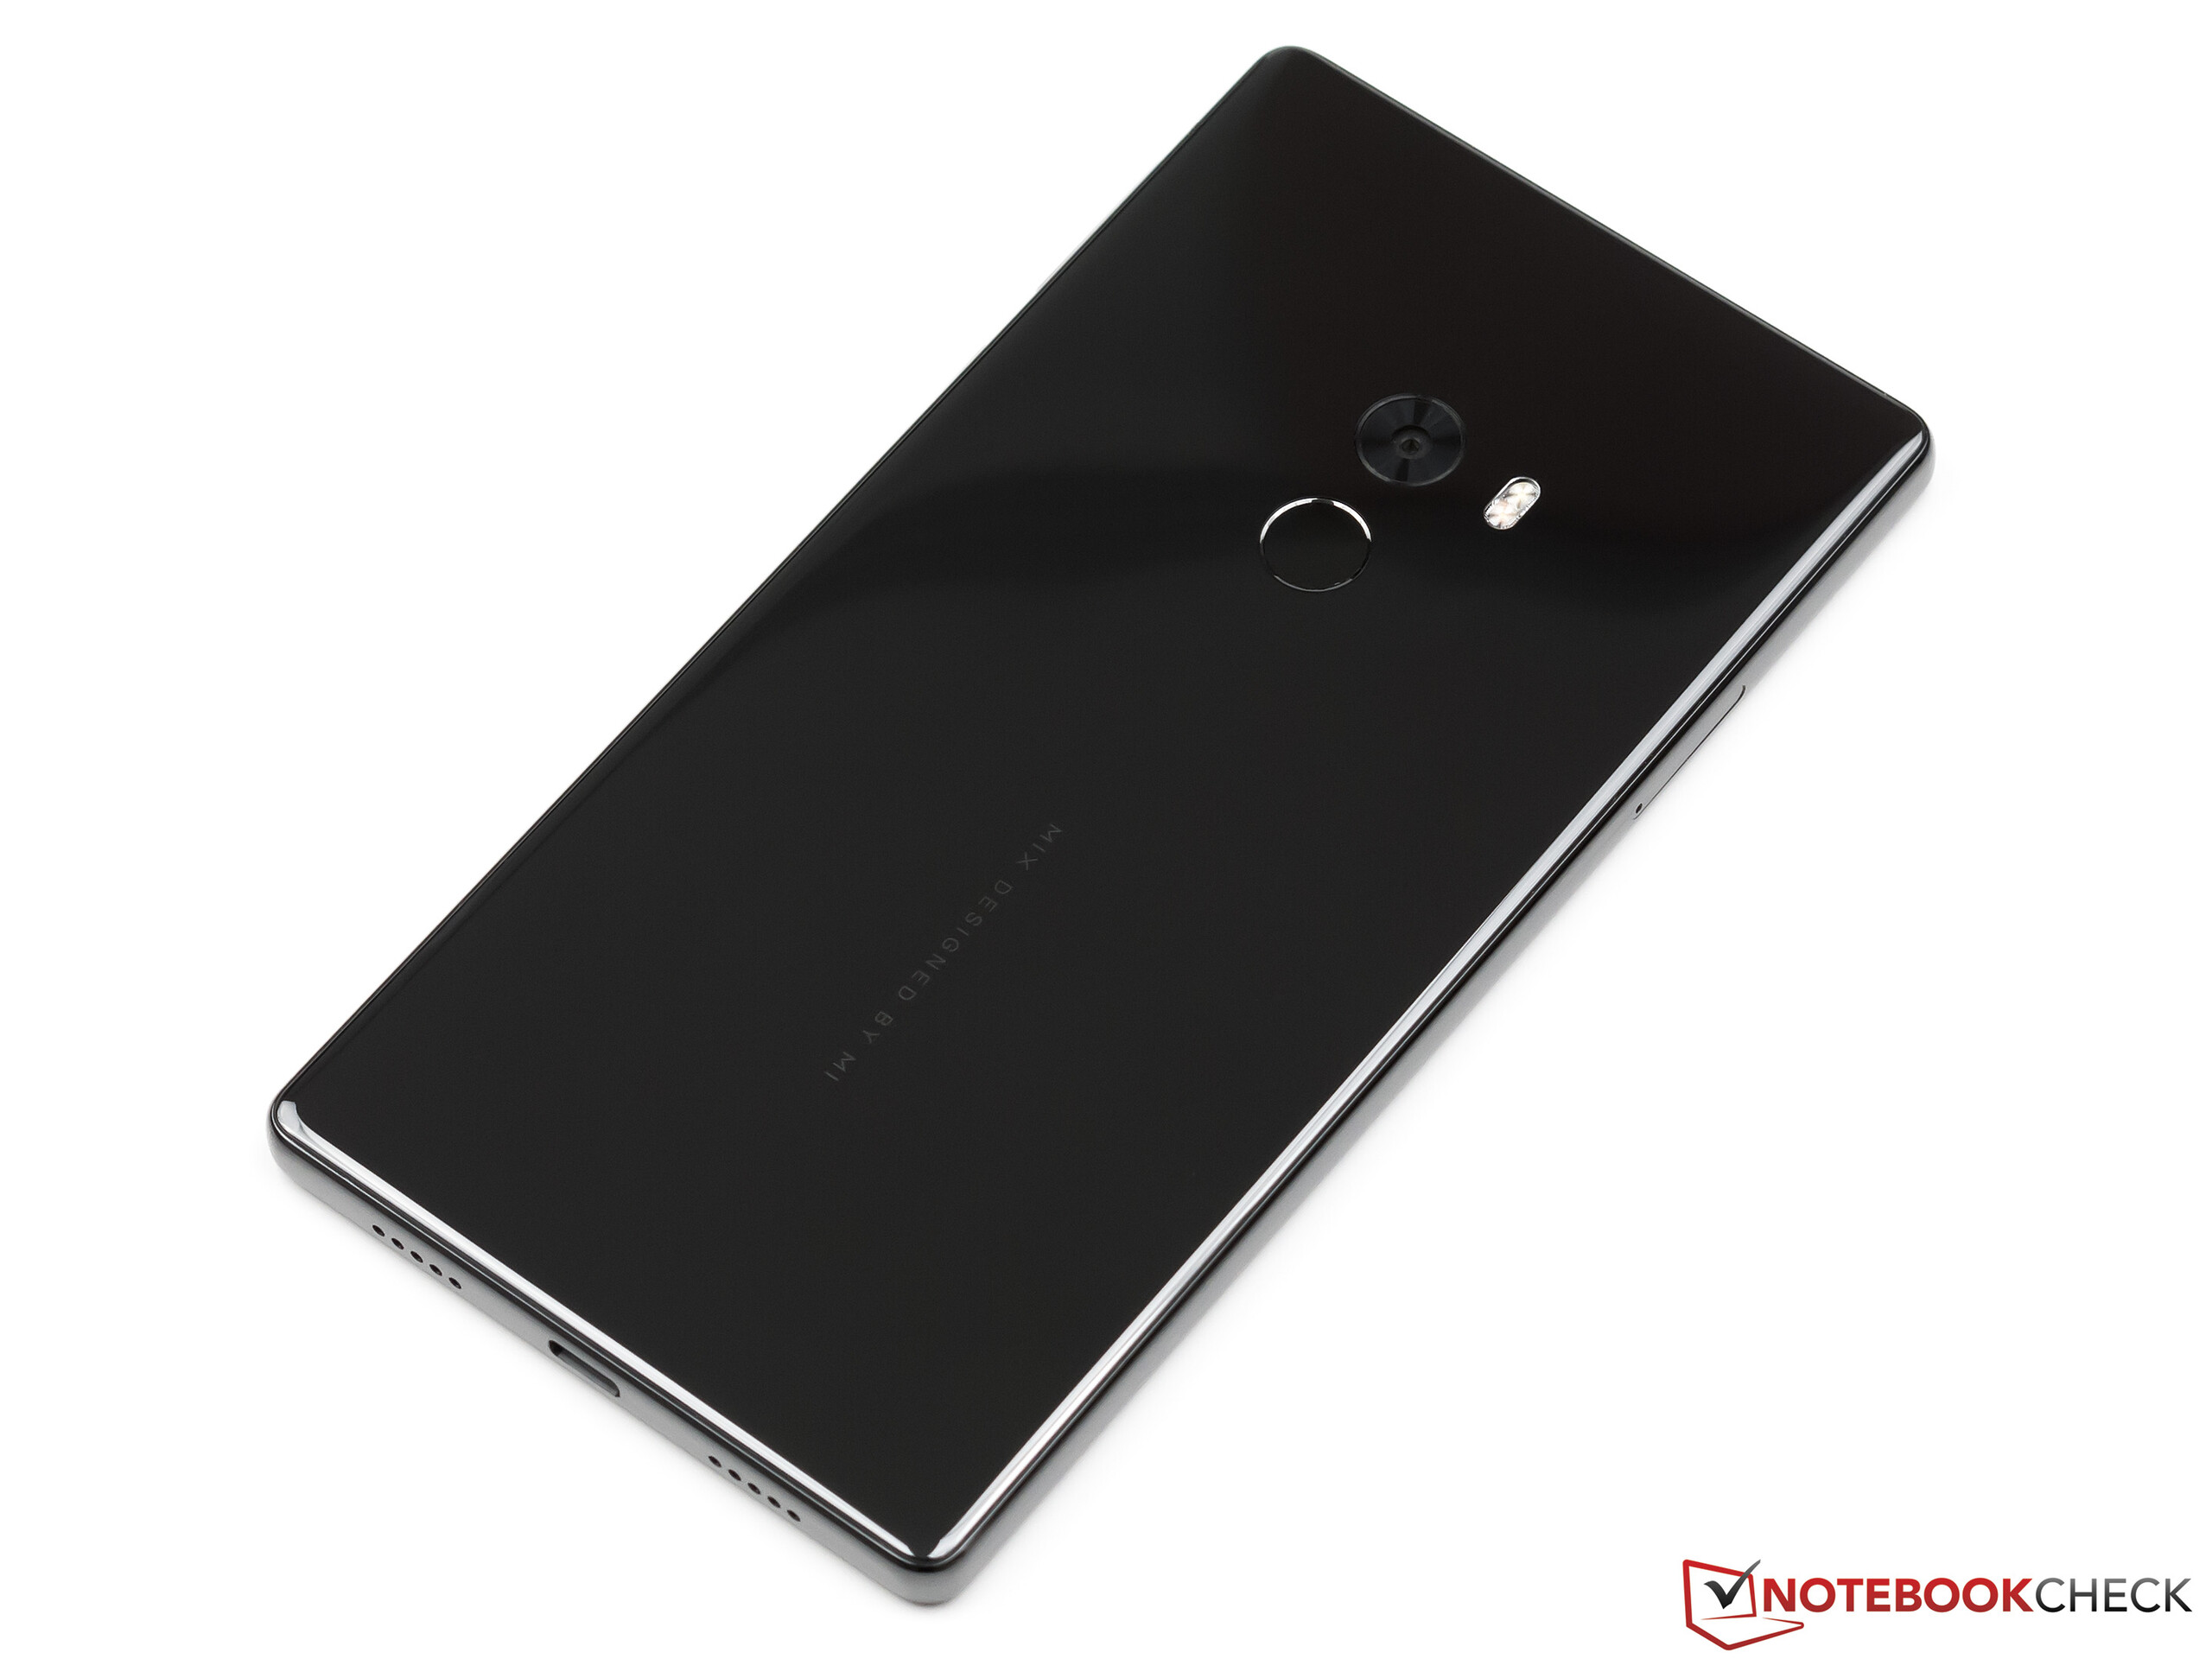
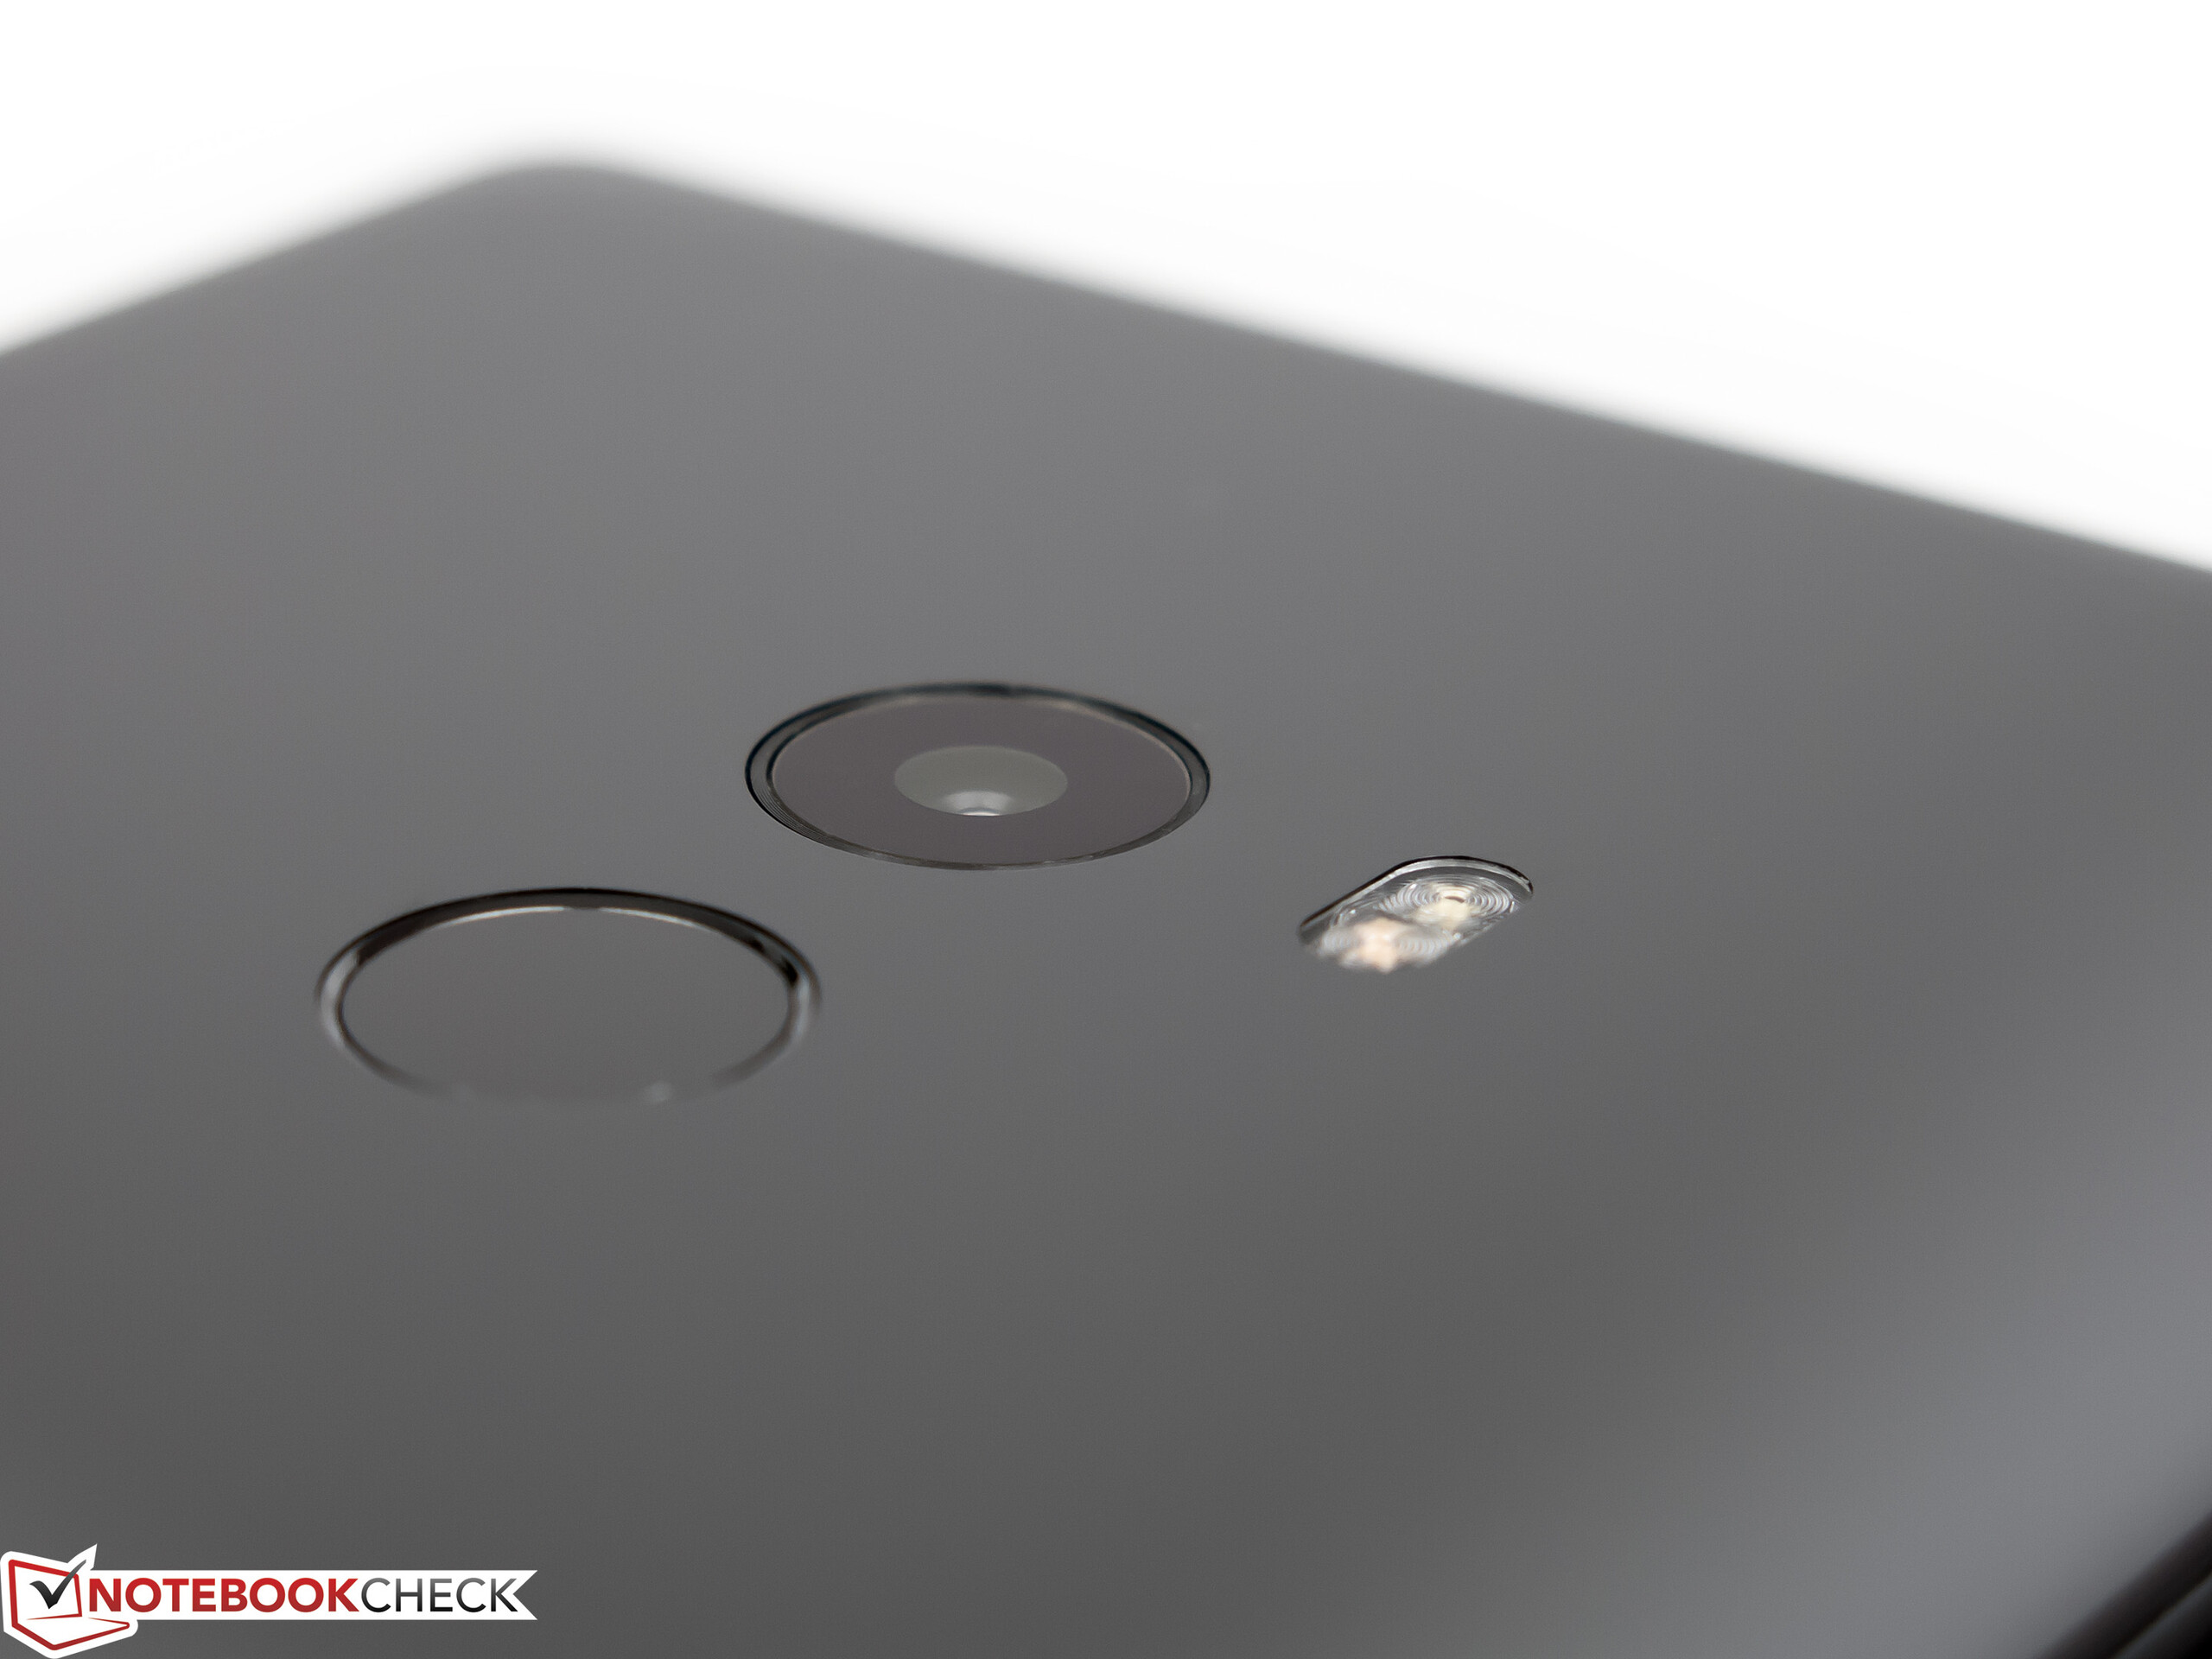
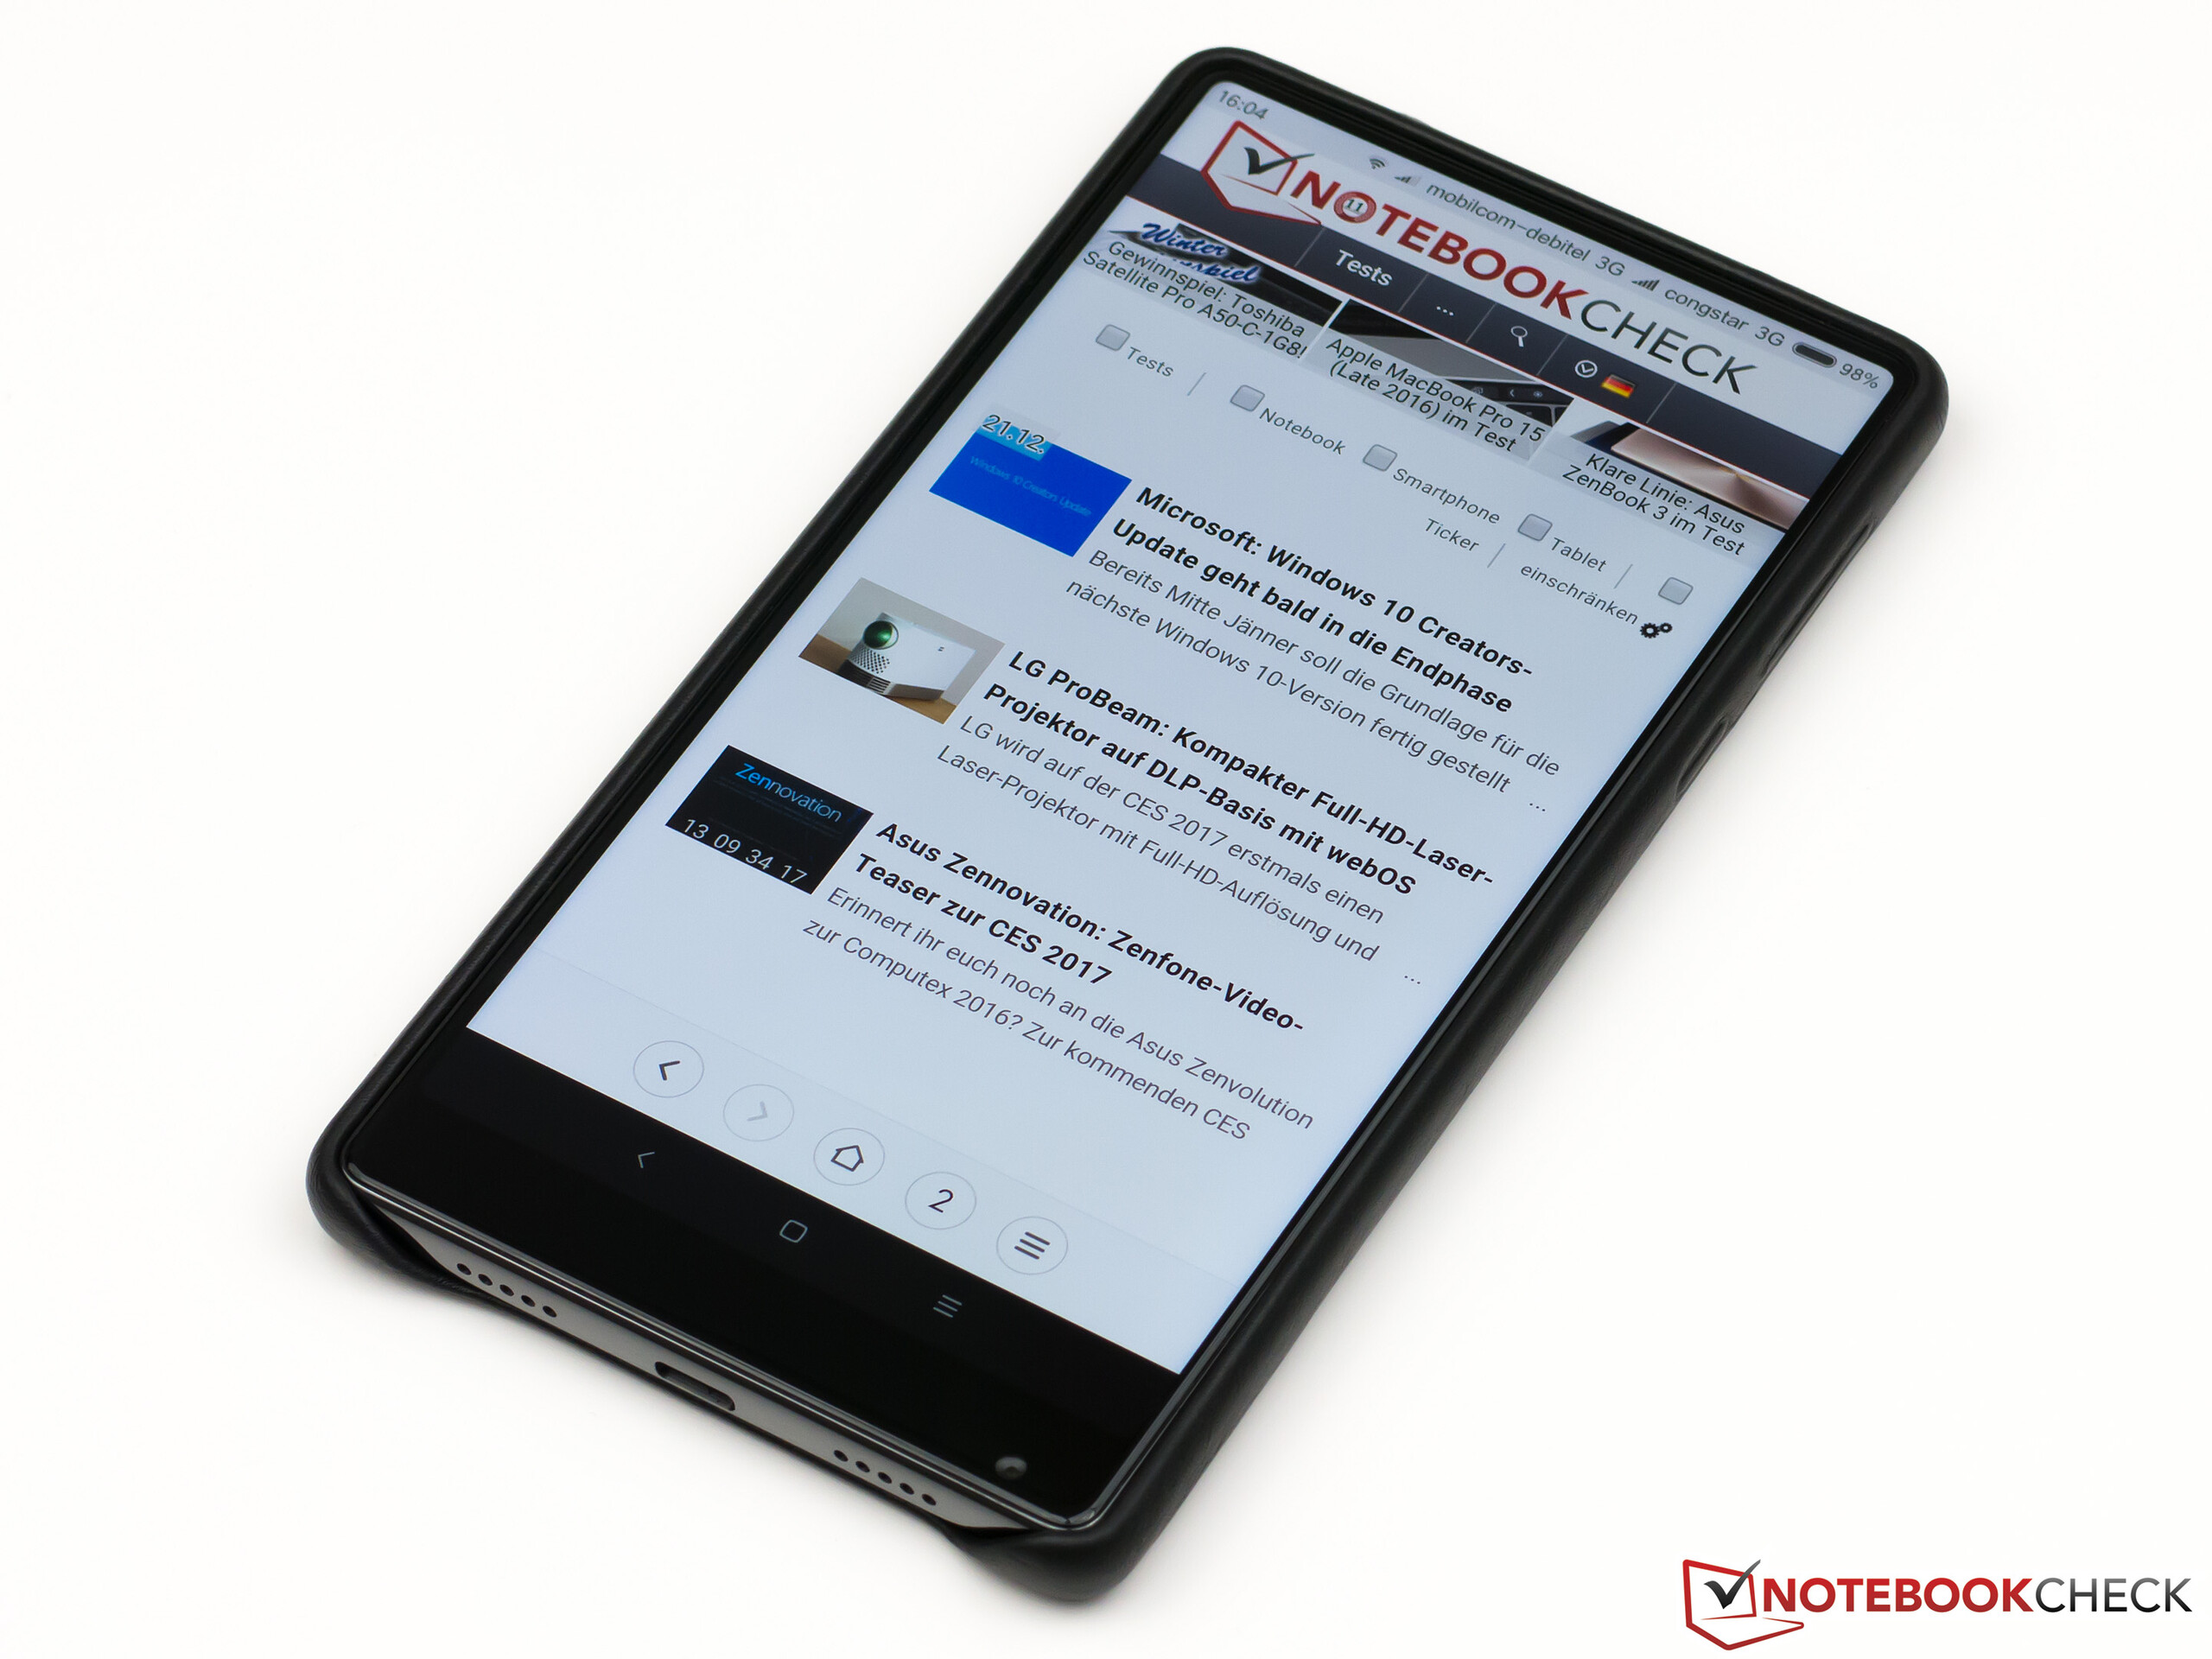
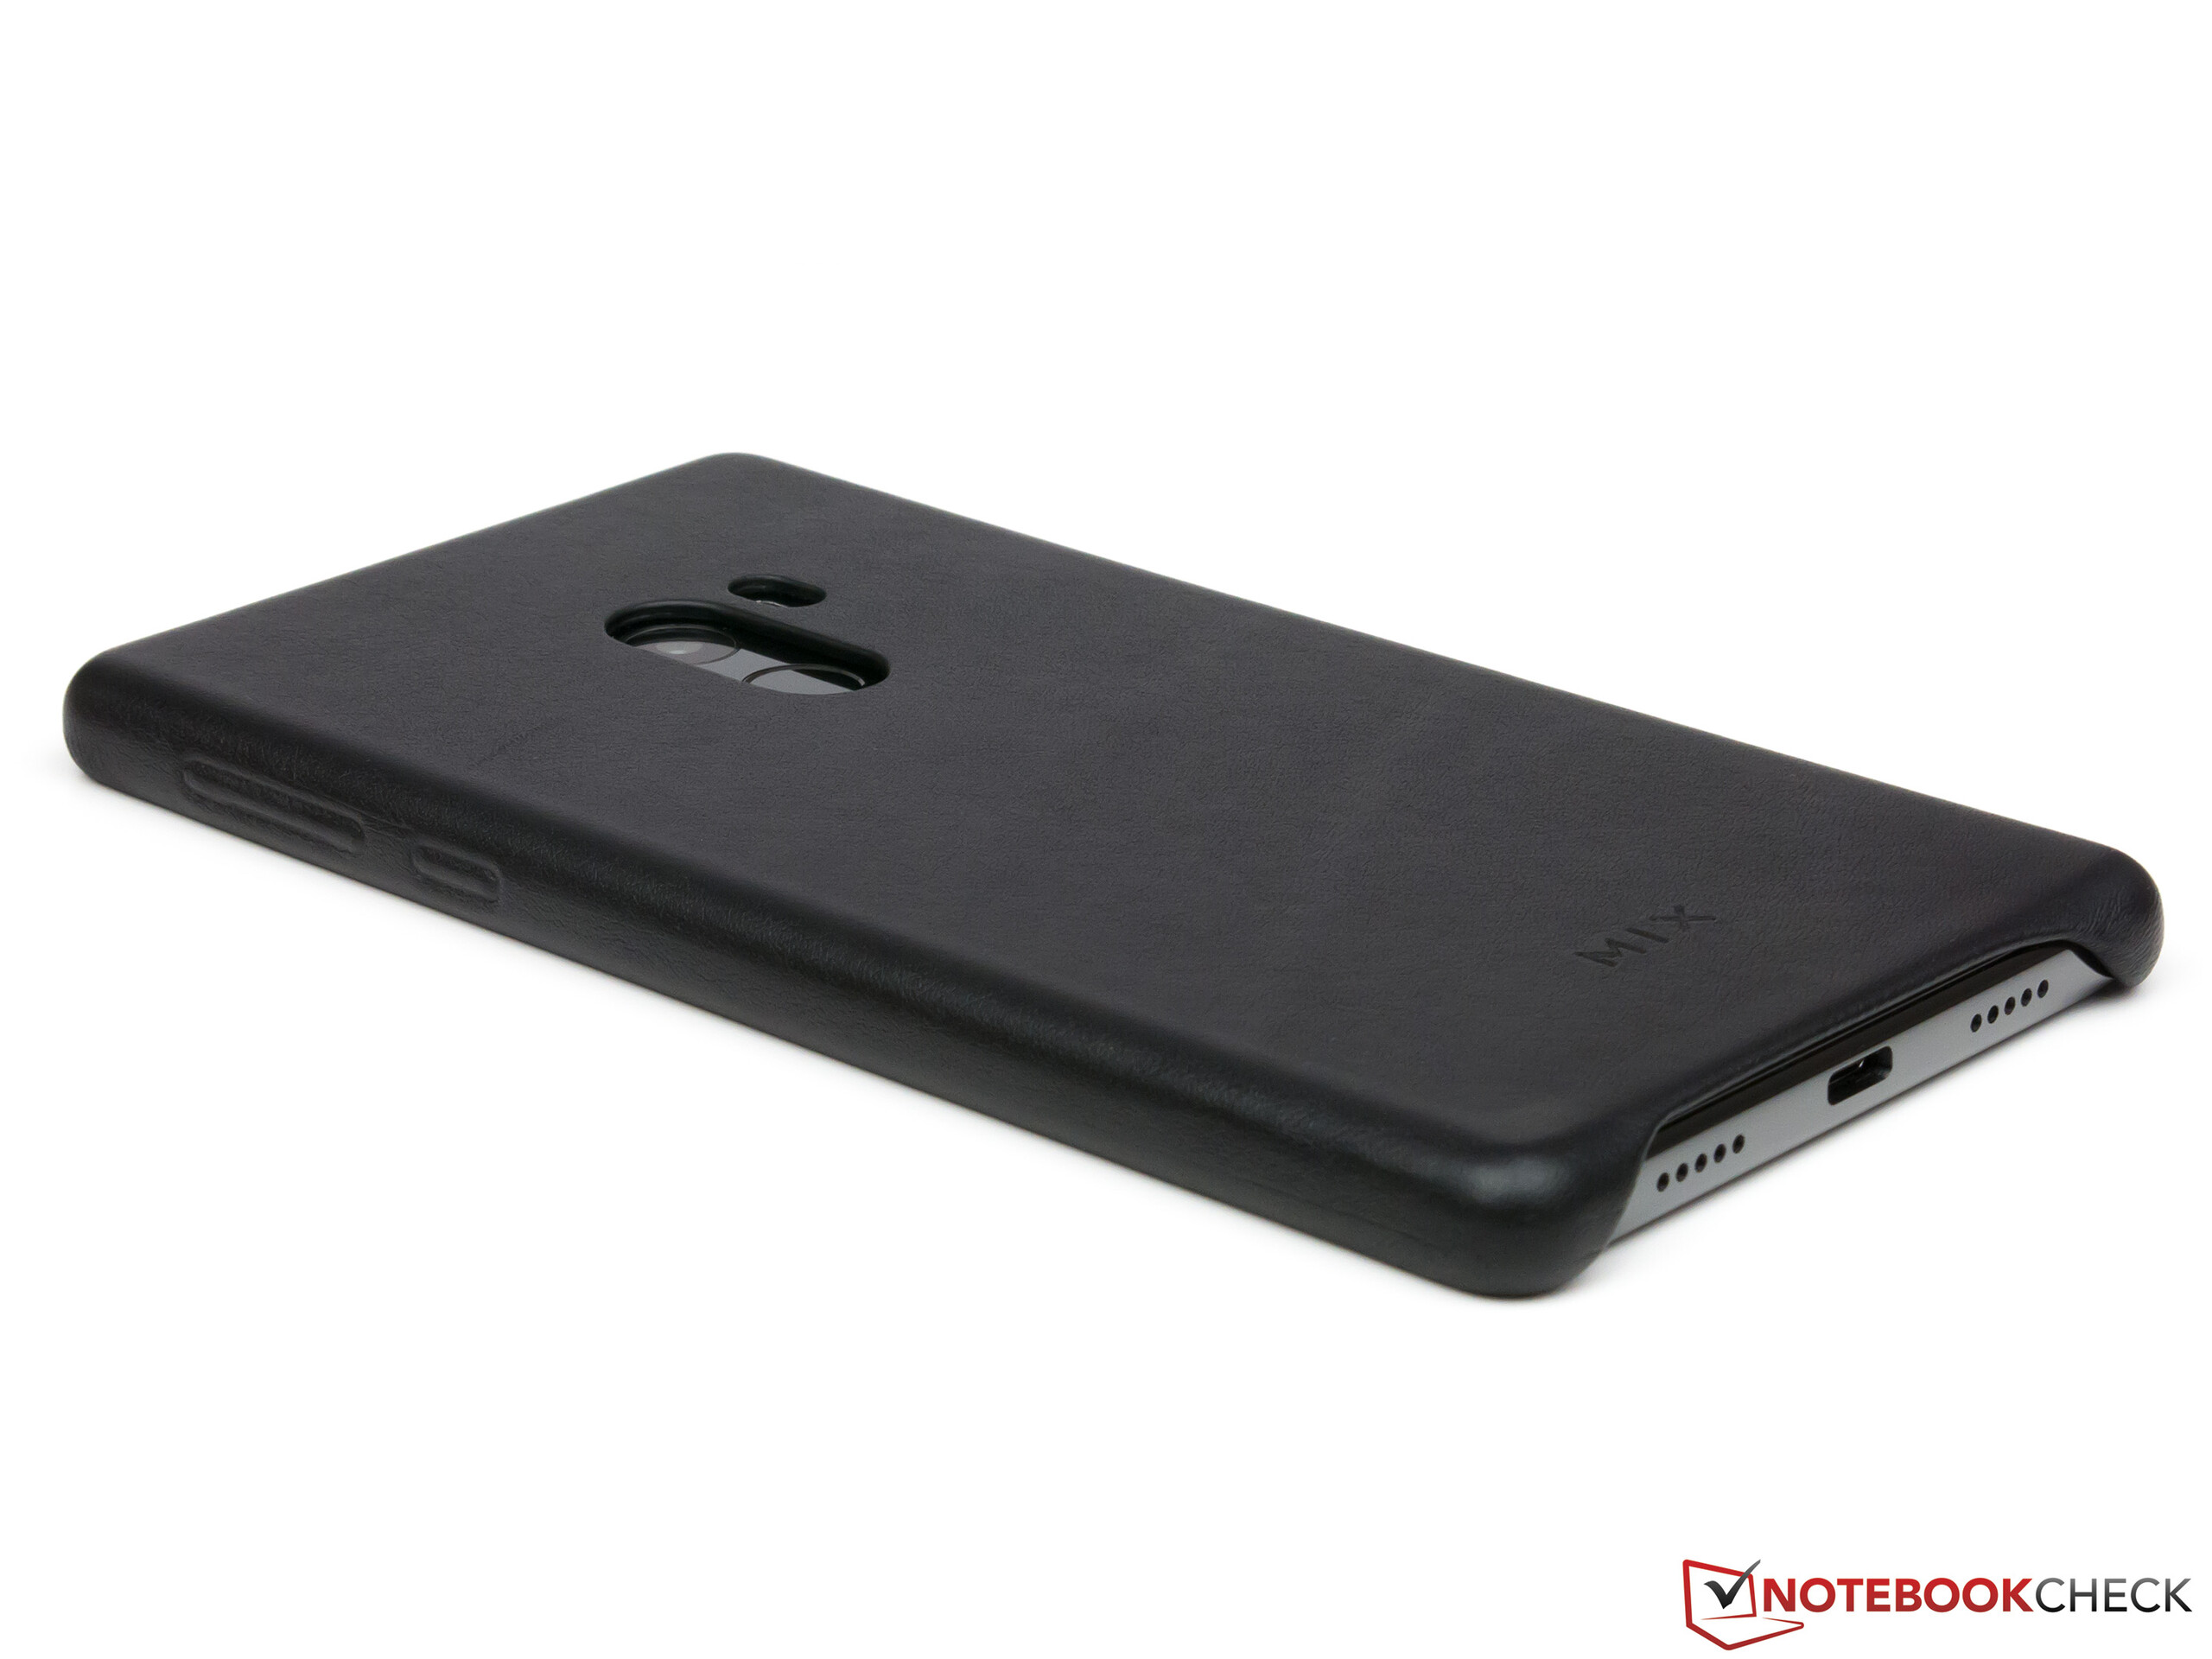
O destaque do Mi Mix certamente é sua incomum tela IPS de 6,4 polegadas que é incorporada quase sem bordas em uma elegante carcaça de cerâmica. Não apenas sua grande superfície é impressionante, mas também sua resolução, brilho, e contraste são aptos para o dia a dia. Os detalhes como as esquinas arredondadas fornecem à tela um visual futurista. O phablet também é bem atualizado. Com o SoC premium da Qualcomm, 4 GB de RAM, e armazenamento UFS 2.0 de 128 GB, o aparelho sempre funciona fluentemente e lança aplicativos sem longos tempos de espera. Não existem muito motivos de reclamo em termos de conectividade graças ao NFC integrado, USB OTG, Miracast, e Bluetooth 4.2. O confiável leitor de digitais, a capa de couro inclusa e a porta USB Type-C reversível também são recursos convenientes para o uso diários. É uma pena que a câmera não tenha um estabilizador ótico de imagem e que a banda 20 LTE, utilizada com frequência na Europa não seja suportada.
Os usuários europeus terão que fazer compromissos no software. A interface do usuário da Xiaomi vem com muitos extras úteis, mas um pacote do idioma alemão não está disponível e a tradução para o inglês não está completa. Além disso, os serviços Google não estão pré-carregados, à diferença de virtualmente todos os aparelhos Android oficialmente disponíveis na Alemanha. No entanto, os ROMs alternativos, ou a instalação da Play Store podem resolver esse problema.
O Xiaomi Mi Mix se destaca entre os outros smartphones e phablets de gama alta especialmente com seu inovador design da tela. Infelizmente, o aparelho não foi otimizado para seu uso na Europa como foi notado no limitado suporte para LTE e tradução incompleta.
O Mi Mix somente está disponível na Europe mediante importadores, como TradingShenzen que nos emprestou o modelo de teste. Ele atualmente custa 677 Euros (~$713) mais envio e um possível imposto de importação. Um alternativa interessante é definitivamente o novo phablet Huawei Mate 9 que atualmente custa cerca de 700 Euros (~$737). Embora o comprador não encontre a incomum tela do modelo de teste aqui, as redes LTE europeias e a interface do usuário feita para a China não serão problema.
Xiaomi Mi Mix
-
01/02/2017 v6(old)
Andreas Kilian