 Deutsch
 English
 Español
 Français
 Italiano
 Nederlands
 Polski
 Português
 Русский
 Türkçe
 Svenska
 Chinese
 Magyar
Breve Análise do Portátil Acer Aspire E5-774G-78NA (GeForce 940MX GDDR5)

| SD Card Reader | |
| average JPG Copy Test (av. of 3 runs) | |
| Acer Aspire E5-774G-78NA | |
| Toshiba Satellite C70-C-1FT | |
| Asus F756UX-T7013T | |
| Lenovo IdeaPad 300-17ISK 80QH001EGE | |
| maximum AS SSD Seq Read Test (1GB) | |
| Toshiba Satellite C70-C-1FT | |
| Acer Aspire E5-774G-78NA | |
| Asus F756UX-T7013T | |
| Lenovo IdeaPad 300-17ISK 80QH001EGE | |
| Networking | |
| iperf Server (receive) TCP 1 m | |
| Acer Aspire E5-774G-78NA (seb) | |
| iperf Client (transmit) TCP 1 m | |
| Acer Aspire E5-774G-78NA (seb) | |
| |||||||||||||||||||||||||
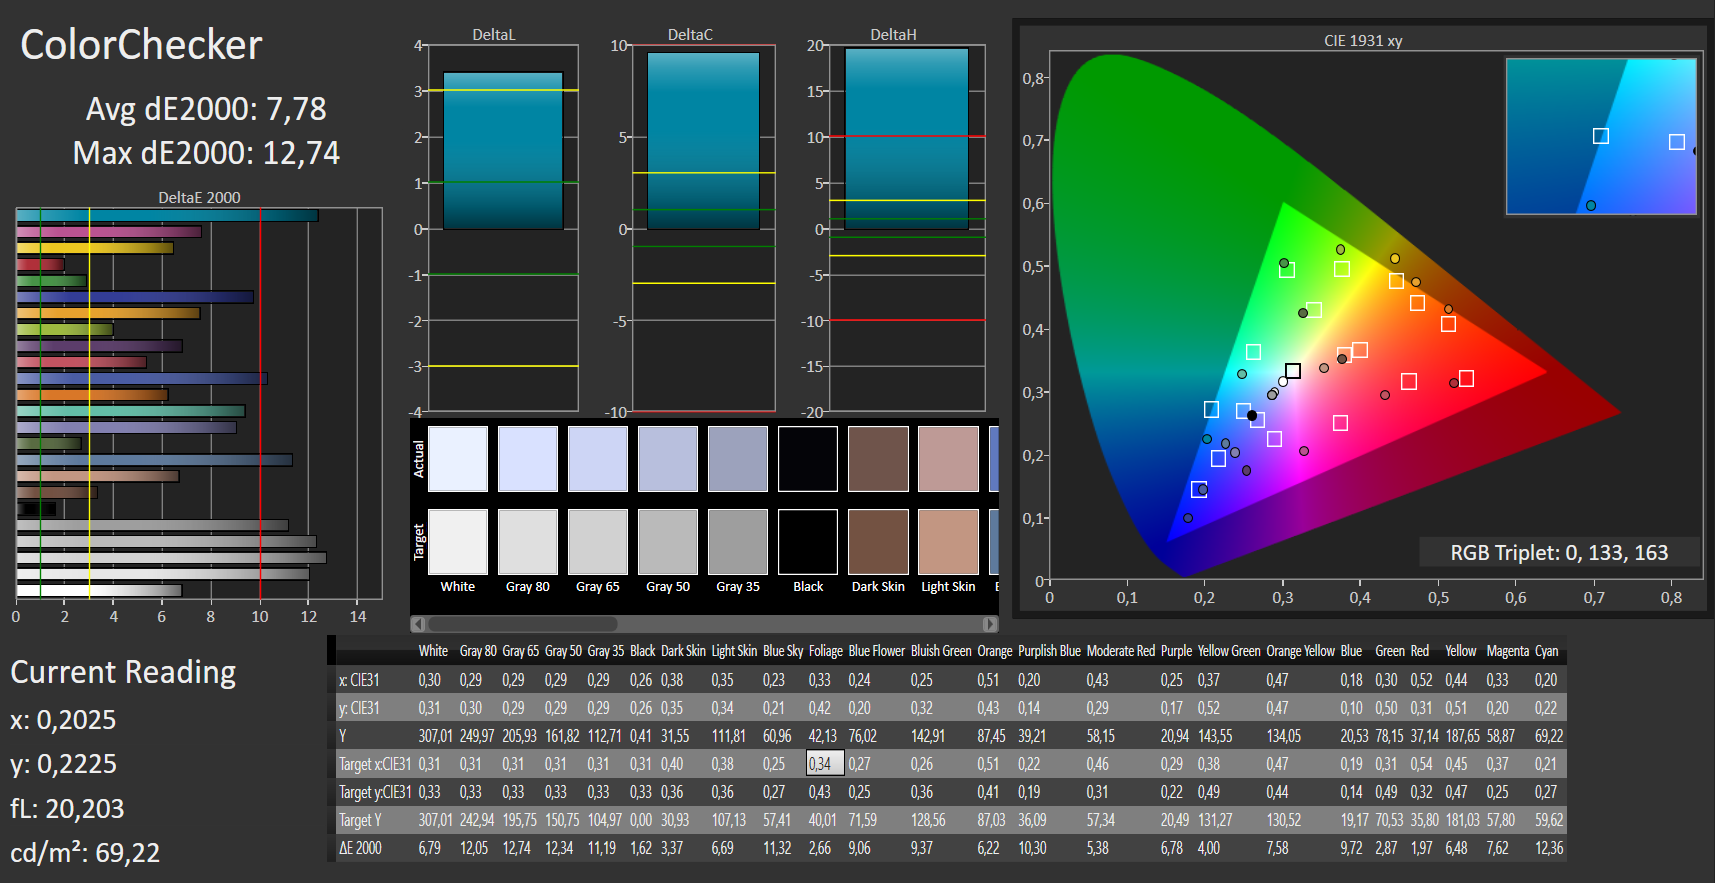
iluminação: 86 %
iluminação com acumulador: 320 cd/m²
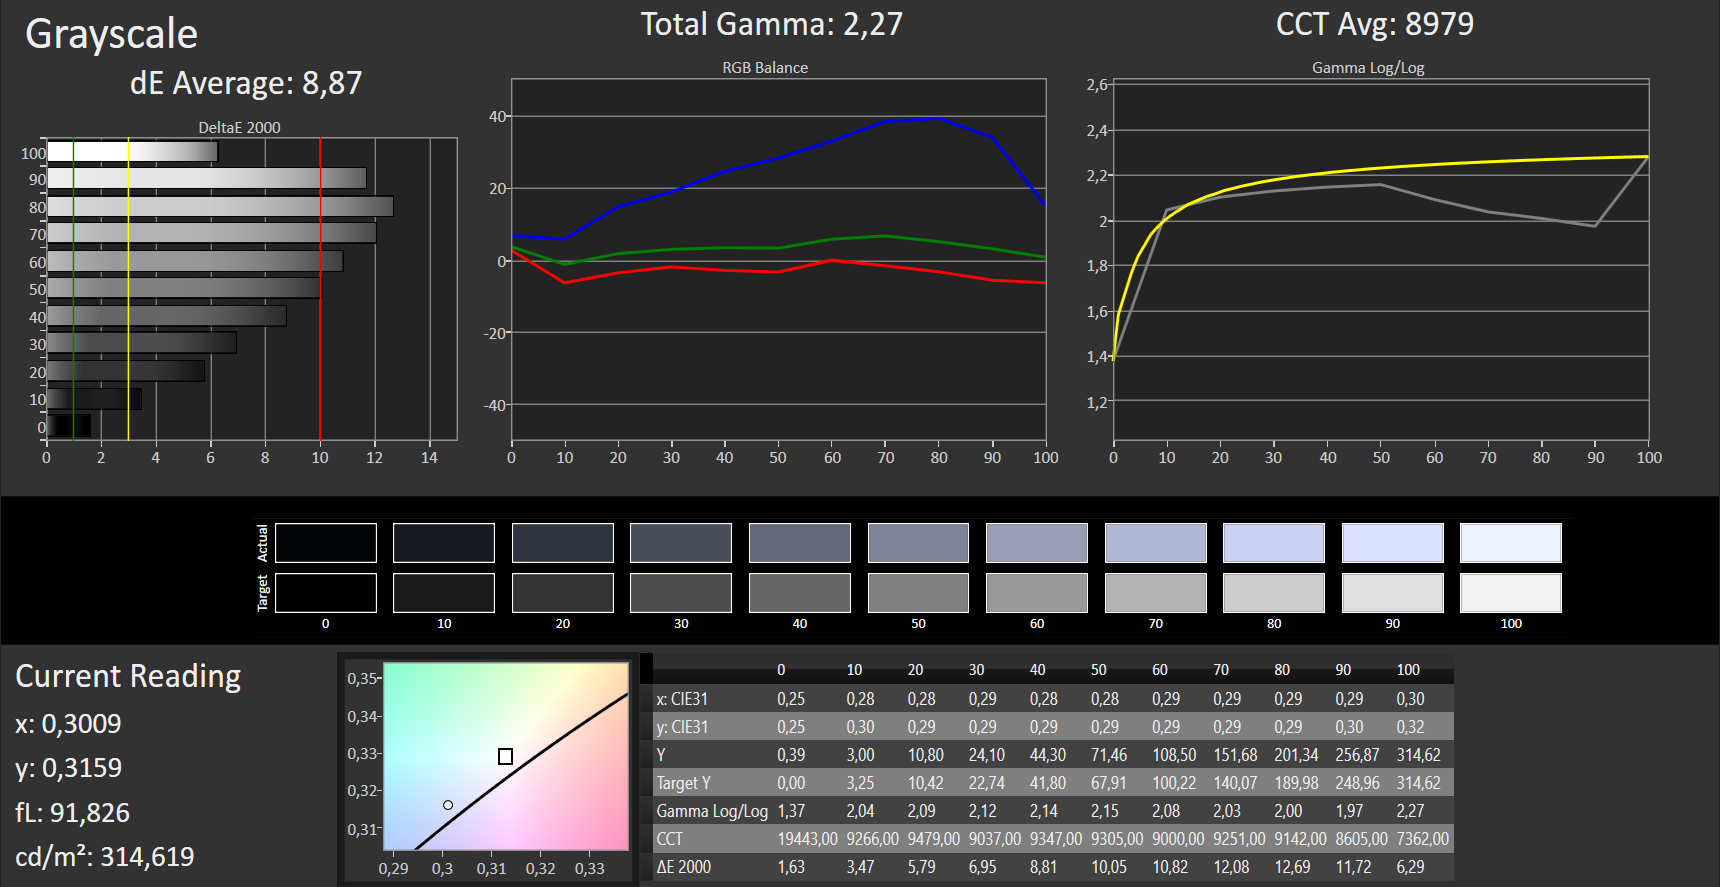
Contraste: 800:1 (Preto: 0.4 cd/m²)
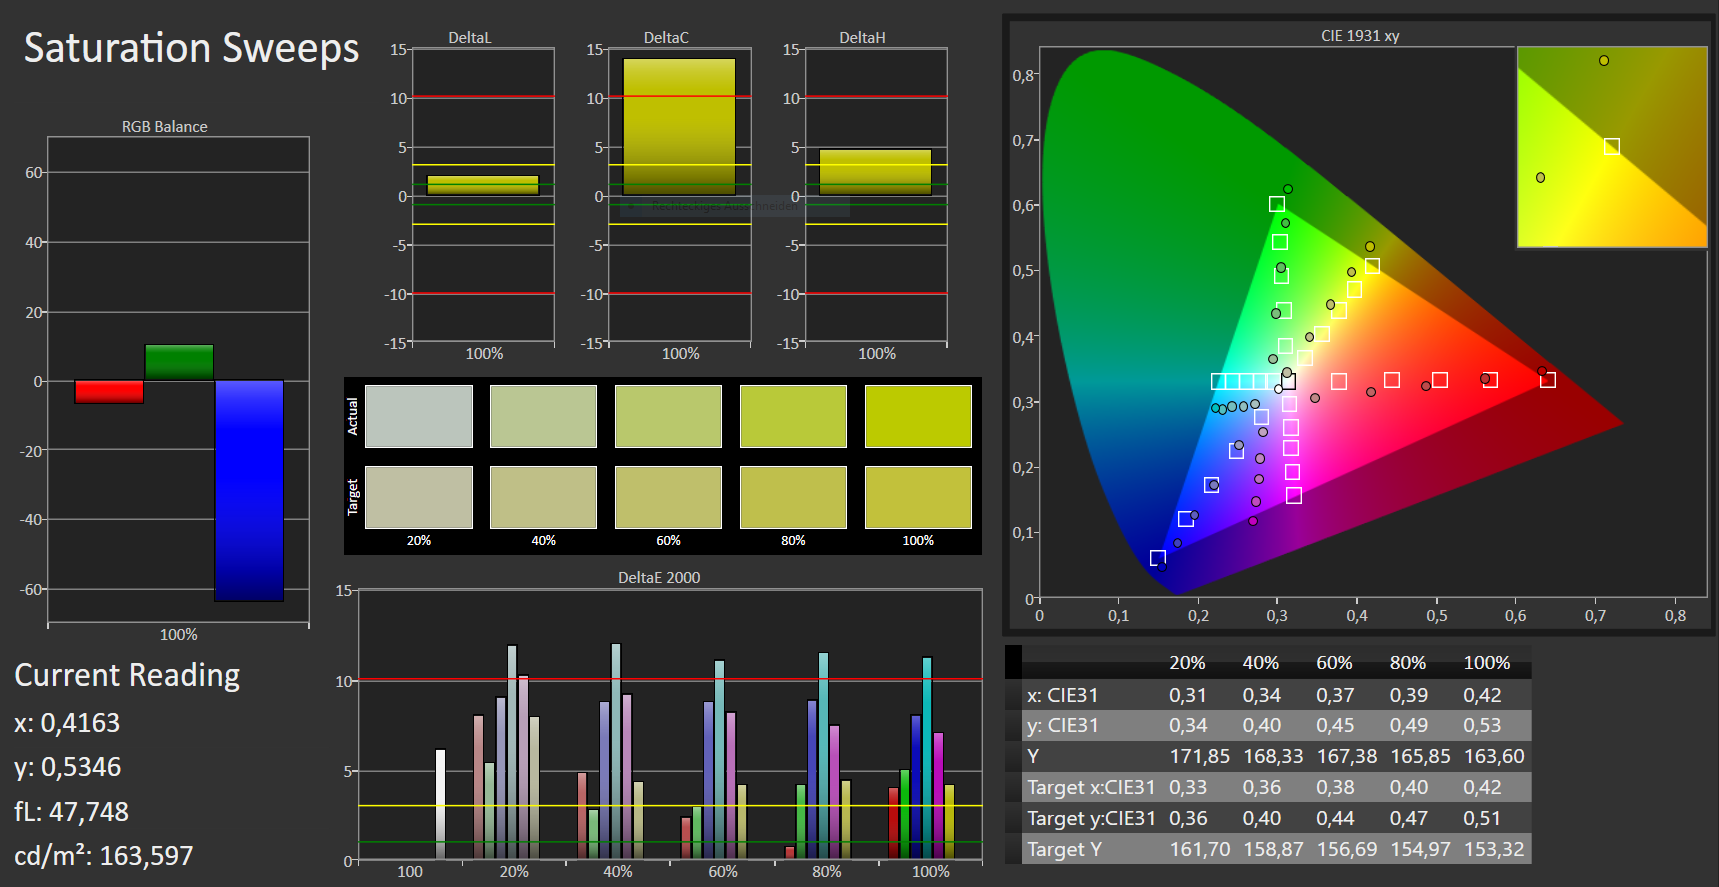
ΔE Color 7.78 | 0.5-29.43 Ø5
ΔE Greyscale 8.87 | 0.57-98 Ø5.3
95% sRGB (Argyll 1.6.3 3D)
62% AdobeRGB 1998 (Argyll 1.6.3 3D)
69.3% AdobeRGB 1998 (Argyll 2.2.0 3D)
94.8% sRGB (Argyll 2.2.0 3D)
72.3% Display P3 (Argyll 2.2.0 3D)
Gamma: 2.27
| Acer Aspire E5-774G-78NA TN LED, 1920x1080 | Acer Aspire E5-772G-70VP TN LED, 1920x1080 | HP Pavilion 17-g120ng IPS, 1920x1080 | Asus F756UX-T7013T TN LED, 1920x1080 | Toshiba Satellite C70-C-1FT TN LED, 1600x900 | Lenovo IdeaPad 300-17ISK 80QH001EGE TN LED, 1600x900 | |
|---|---|---|---|---|---|---|
| Display | -3% | -3% | -7% | -26% | -23% | |
| Display P3 Coverage | 72.3 | 69.4 -4% | 65.7 -9% | 63.9 -12% | 52.4 -28% | 52.4 -28% |
| sRGB Coverage | 94.8 | 91.9 -3% | 97.6 3% | 93.7 -1% | 70.9 -25% | 76.1 -20% |
| AdobeRGB 1998 Coverage | 69.3 | 67.3 -3% | 67.7 -2% | 64.6 -7% | 52 -25% | 54.2 -22% |
| Response Times | -84% | 2% | 7% | -4% | ||
| Response Time Grey 50% / Grey 80% * | 43 ? | 70 ? -63% | 42 ? 2% | 17 ? 60% | 42 ? 2% | |
| Response Time Black / White * | 22 ? | 46 ? -109% | 21 ? 5% | 10 ? 55% | 24 ? -9% | |
| PWM Frequency | 1000 ? | 200 ? -80% | 1000 ? 0% | 50 ? -95% | ||
| Screen | -21% | 17% | 14% | -52% | -26% | |
| Brightness middle | 320 | 243 -24% | 309 -3% | 268 -16% | 263 -18% | 205 -36% |
| Brightness | 302 | 284 -6% | 292 -3% | 255 -16% | 257 -15% | 182 -40% |
| Brightness Distribution | 86 | 79 -8% | 86 0% | 83 -3% | 86 0% | 77 -10% |
| Black Level * | 0.4 | 0.45 -13% | 0.27 32% | 0.17 57% | 1 -150% | 0.43 -8% |
| Contrast | 800 | 540 -32% | 1144 43% | 1576 97% | 263 -67% | 477 -40% |
| Colorchecker dE 2000 * | 7.78 | 12.04 -55% | 4.53 42% | 7.18 8% | 13.6 -75% | 9.75 -25% |
| Colorchecker dE 2000 max. * | 12.74 | 11.67 8% | 22.06 -73% | 16.02 -26% | ||
| Greyscale dE 2000 * | 8.87 | 13.25 -49% | 5.66 36% | 7.97 10% | 15.27 -72% | 12.09 -36% |
| Gamma | 2.27 97% | 2.6 85% | 2.62 84% | 2.34 94% | 1.94 113% | 2.62 84% |
| CCT | 8979 72% | 14950 43% | 7893 82% | 8541 76% | 16460 39% | 12875 50% |
| Color Space (Percent of AdobeRGB 1998) | 62 | 60 -3% | 62 0% | 59 -5% | 46 -26% | 49 -21% |
| Color Space (Percent of sRGB) | 95 | 92 -3% | 98 3% | 94 -1% | 71 -25% | 76 -20% |
| Total Average (Program / Settings) | -12% /
-17% | -23% /
-7% | 3% /
8% | -24% /
-36% | -18% /
-23% |
* ... smaller is better
Screen Flickering / PWM (Pulse-Width Modulation)
| Screen flickering / PWM detected | 1000 Hz | ≤ 90 % brightness setting | 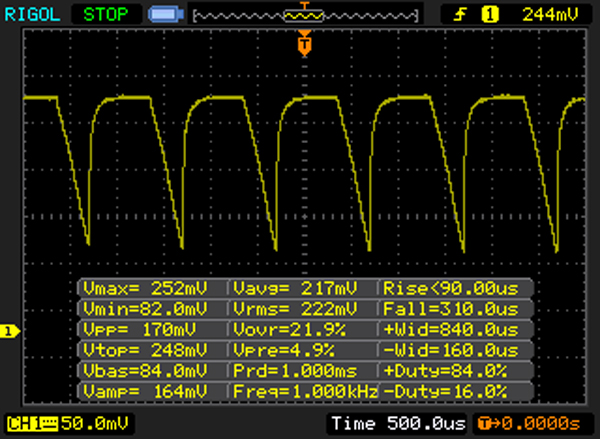 |
The display backlight flickers at 1000 Hz (worst case, e.g., utilizing PWM) Flickering detected at a brightness setting of 90 % and below. There should be no flickering or PWM above this brightness setting. The frequency of 1000 Hz is quite high, so most users sensitive to PWM should not notice any flickering. In comparison: 53 % of all tested devices do not use PWM to dim the display. If PWM was detected, an average of 17933 (minimum: 5 - maximum: 3846000) Hz was measured. | |||
Display Response Times
| ↔ Response Time Black to White | ||
|---|---|---|
| 22 ms ... rise ↗ and fall ↘ combined | ↗ 5 ms rise | 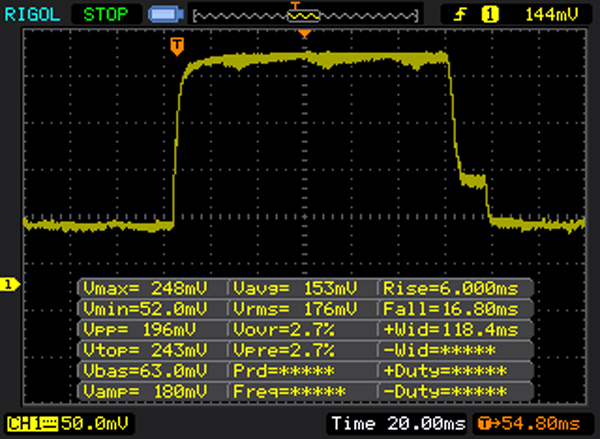 |
| ↘ 17 ms fall | ||
| The screen shows good response rates in our tests, but may be too slow for competitive gamers. In comparison, all tested devices range from 0.1 (minimum) to 240 (maximum) ms. » 42 % of all devices are better. This means that the measured response time is similar to the average of all tested devices (21.5 ms). | ||
| ↔ Response Time 50% Grey to 80% Grey | ||
| 43 ms ... rise ↗ and fall ↘ combined | ↗ 23 ms rise | 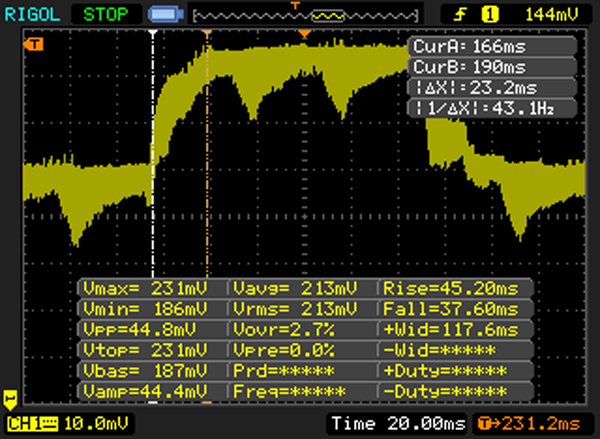 |
| ↘ 20 ms fall | ||
| The screen shows slow response rates in our tests and will be unsatisfactory for gamers. In comparison, all tested devices range from 0.2 (minimum) to 636 (maximum) ms. » 67 % of all devices are better. This means that the measured response time is worse than the average of all tested devices (33.8 ms). | ||
| Cinebench R15 | |
| CPU Single 64Bit | |
| MSI CX72-7QL | |
| Acer Aspire E5-774G-78NA | |
| HP Pavilion 17-g120ng | |
| Acer Aspire E5-772G-70VP | |
| Lenovo IdeaPad 300-17ISK 80QH001EGE | |
| Toshiba Satellite C70-C-1FT | |
| Asus F756UX-T7013T | |
| CPU Multi 64Bit | |
| MSI CX72-7QL | |
| Acer Aspire E5-774G-78NA | |
| HP Pavilion 17-g120ng | |
| Acer Aspire E5-772G-70VP | |
| Lenovo IdeaPad 300-17ISK 80QH001EGE | |
| Asus F756UX-T7013T | |
| Toshiba Satellite C70-C-1FT | |
| Cinebench R10 | |
| Rendering Multiple CPUs 32Bit | |
| MSI CX72-7QL | |
| Acer Aspire E5-774G-78NA | |
| Lenovo IdeaPad 300-17ISK 80QH001EGE | |
| Acer Aspire E5-772G-70VP | |
| Asus F756UX-T7013T | |
| HP Pavilion 17-g120ng | |
| Rendering Single 32Bit | |
| MSI CX72-7QL | |
| Acer Aspire E5-774G-78NA | |
| Acer Aspire E5-772G-70VP | |
| Lenovo IdeaPad 300-17ISK 80QH001EGE | |
| Asus F756UX-T7013T | |
| HP Pavilion 17-g120ng | |
| Geekbench 3 | |
| 32 Bit Single-Core Score | |
| MSI CX72-7QL | |
| Acer Aspire E5-774G-78NA | |
| Lenovo IdeaPad 300-17ISK 80QH001EGE | |
| 32 Bit Multi-Core Score | |
| MSI CX72-7QL | |
| Acer Aspire E5-774G-78NA | |
| Lenovo IdeaPad 300-17ISK 80QH001EGE | |
| JetStream 1.1 - Total Score | |
| MSI CX72-7QL | |
| Acer Aspire E5-774G-78NA | |
| Lenovo IdeaPad 300-17ISK 80QH001EGE | |
| Mozilla Kraken 1.1 - Total | |
| Acer Aspire E5-772G-70VP | |
| Lenovo IdeaPad 300-17ISK 80QH001EGE | |
| Acer Aspire E5-774G-78NA | |
| MSI CX72-7QL | |
| Octane V2 - Total Score | |
| MSI CX72-7QL | |
| Acer Aspire E5-774G-78NA | |
| Lenovo IdeaPad 300-17ISK 80QH001EGE | |
| Acer Aspire E5-772G-70VP | |
* ... smaller is better
| PCMark 7 Score | 5479 pontos | |
| PCMark 8 Home Score Accelerated v2 | 3734 pontos | |
| PCMark 8 Creative Score Accelerated v2 | 4350 pontos | |
| PCMark 8 Work Score Accelerated v2 | 4545 pontos | |
Ajuda | ||
| PCMark 8 | |
| Home Score Accelerated v2 | |
| Acer Aspire E5-774G-78NA | |
| Acer Aspire E5-772G-70VP | |
| Lenovo IdeaPad 300-17ISK 80QH001EGE | |
| Asus F756UX-T7013T | |
| Toshiba Satellite C70-C-1FT | |
| Work Score Accelerated v2 | |
| Acer Aspire E5-774G-78NA | |
| Acer Aspire E5-772G-70VP | |
| Lenovo IdeaPad 300-17ISK 80QH001EGE | |
| Asus F756UX-T7013T | |

| Acer Aspire E5-774G-78NA Lite-On CV1-8B256 | Acer Aspire E5-772G-70VP Kingston RBU-SNS8100S3128GD | HP Pavilion 17-g120ng Toshiba MQ01ABD100 | Asus F756UX-T7013T HGST Travelstar 5K1000 HTS541010A9E680 | Toshiba Satellite C70-C-1FT Toshiba MQ01ABD100 | Lenovo IdeaPad 300-17ISK 80QH001EGE Toshiba MQ01ABD100 | |
|---|---|---|---|---|---|---|
| CrystalDiskMark 3.0 | -8% | -91% | -91% | -91% | -91% | |
| Read Seq | 520 | 515 -1% | 104.6 -80% | 105.8 -80% | 107.4 -79% | 100.6 -81% |
| Write Seq | 332.8 | 343.2 3% | 96.3 -71% | 105 -68% | 106.7 -68% | 96.3 -71% |
| Read 512 | 382.8 | 341.1 -11% | 30.33 -92% | 33.33 -91% | 30.73 -92% | 28.15 -93% |
| Write 512 | 357.7 | 337.2 -6% | 36.95 -90% | 39.12 -89% | 24.93 -93% | 43.34 -88% |
| Read 4k | 32.31 | 31.24 -3% | 0.358 -99% | 0.413 -99% | 0.386 -99% | 0.312 -99% |
| Write 4k | 85.1 | 86.6 2% | 0.815 -99% | 0.947 -99% | 0.809 -99% | 0.792 -99% |
| Read 4k QD32 | 277.7 | 178.5 -36% | 0.679 -100% | 0.812 -100% | 0.773 -100% | 0.708 -100% |
| Write 4k QD32 | 269.8 | 242.4 -10% | 0.79 -100% | 0.968 -100% | 0.807 -100% | 0.764 -100% |
| 3DMark 05 Standard | 21714 pontos | |
| 3DMark 06 Standard Score | 15623 pontos | |
| 3DMark Vantage P Result | 9862 pontos | |
| 3DMark 11 Performance | 3008 pontos | |
| 3DMark Ice Storm Standard Score | 43456 pontos | |
| 3DMark Cloud Gate Standard Score | 7667 pontos | |
| 3DMark Fire Strike Score | 2049 pontos | |
| 3DMark Fire Strike Extreme Score | 979 pontos | |
| 3DMark Time Spy Score | 710 pontos | |
Ajuda | ||
| 3DMark 11 - 1280x720 Performance GPU | |
| Asus F756UX-T7013T | |
| Acer Aspire E5-774G-78NA | |
| Dell Inspiron 17 7778 | |
| Acer Aspire E5-772G-70VP | |
| HP Pavilion 17-g120ng | |
| Lenovo Ideapad 510-15ISK | |
| Asus VivoBook X556UQ-XO076T | |
| Toshiba Satellite C70-C-1FT | |
| Lenovo IdeaPad 300-17ISK 80QH001EGE | |
| 3DMark | |
| 1280x720 Cloud Gate Standard Graphics | |
| Asus F756UX-T7013T | |
| Acer Aspire E5-774G-78NA | |
| Dell Inspiron 17 7778 | |
| Acer Aspire E5-772G-70VP | |
| Lenovo Ideapad 510-15ISK | |
| HP Pavilion 17-g120ng | |
| Asus VivoBook X556UQ-XO076T | |
| Lenovo IdeaPad 300-17ISK 80QH001EGE | |
| 1920x1080 Fire Strike Graphics | |
| Asus F756UX-T7013T | |
| Acer Aspire E5-774G-78NA | |
| Dell Inspiron 17 7778 | |
| Acer Aspire E5-772G-70VP | |
| HP Pavilion 17-g120ng | |
| Lenovo Ideapad 510-15ISK | |
| Asus VivoBook X556UQ-XO076T | |
| Lenovo IdeaPad 300-17ISK 80QH001EGE | |
| baixo | média | alto | ultra | |
| Tomb Raider (2013) | 181.4 | 96.4 | 62.3 | 29.2 |
| BioShock Infinite (2013) | 116.4 | 71.4 | 62.1 | 22 |
| Battlefield 4 (2013) | 88.6 | 61.3 | 44.4 | 18 |
| Dragon Age: Inquisition (2014) | 77.2 | 49.1 | 17.8 | 11.7 |
| GTA V (2015) | 91 | 80.2 | 22.3 | 9.8 |
| Dirt Rally (2015) | 187.2 | 69.4 | 37 | 16.8 |
| The Witcher 3 (2015) | 37.9 | 23.8 | 13 | 7.1 |
| Batman: Arkham Knight (2015) | 37 | 32 | 13 | 8 |
| Mad Max (2015) | 54 | 27.2 | 24.7 | |
| Anno 2205 (2015) | 64 | 36 | 16.7 | 6.6 |
| Call of Duty: Black Ops 3 (2015) | 64.8 | 39 | 20.1 | 19.1 |
| Fallout 4 (2015) | 43.3 | 28.7 | 15.8 | 12.6 |
| Star Wars Battlefront (2015) | 70.8 | 45 | 20.4 | 17.3 |
| Assassin's Creed Syndicate (2015) | 34.4 | 26.4 | 15.3 | 5.8 |
| Rainbow Six Siege (2015) | 96.1 | 61.7 | 31.9 | 26.4 |
| Just Cause 3 (2015) | 48 | 37.5 | 18.2 | 17 |
| Rise of the Tomb Raider (2016) | 34.7 | 24 | 14.7 | 12.7 |
| XCOM 2 (2016) | 45.7 | 16.2 | 10.3 | 4.1 |
| Far Cry Primal (2016) | 41 | 19 | 17 | 12 |
| The Division (2016) | 49.2 | 30.7 | 13.7 | 10.4 |
| Hitman 2016 (2016) | 26.7 | 27.9 | 15.2 | 14.7 |
| Need for Speed 2016 (2016) | 52.1 | 43.5 | 23.2 | 18 |
| Ashes of the Singularity (2016) | 22.6 | 14 | 12.1 | |
| Doom (2016) | 49.7 | 38.9 | 15.8 | 12.7 |
| Mirror's Edge Catalyst (2016) | 54.1 | 33.8 | 15.8 | 12.8 |
| No Man's Sky (2016) | 30.5 | 24.3 | 14.3 | 6.2 |
| Deus Ex Mankind Divided (2016) | 24.7 | 18.4 | 10.4 | 4.9 |
| BioShock Infinite - 1366x768 High Preset | |
| HP Pavilion 17 FHD V3A33AV | |
| Acer Aspire F15 F5-573G-53V1 | |
| Acer Aspire V Nitro VN7-792G-55SF | |
| Asus F756UX-T7013T | |
| Medion Erazer P6661 MD 99873 | |
| Acer Aspire E5-774G-78NA | |
| Dell Inspiron 17 7778 | |
| Acer Aspire E5-772G-70VP | |
| Lenovo Ideapad 510-15ISK | |
| Asus VivoBook X556UQ-XO076T | |
| Toshiba Satellite C70-C-1FT | |
| HP ProBook 470 G3 W4P78EA | |
| Lenovo IdeaPad 300-17ISK 80QH001EGE | |
| Acer Aspire E17 E5-752G-T7WY | |
| Tomb Raider - 1366x768 High Preset AA:FX AF:8x | |
| Acer Aspire V Nitro VN7-792G-55SF | |
| Acer Aspire E5-774G-78NA | |
| Asus VivoBook X556UQ-XO076T | |
| Toshiba Satellite C70-C-1FT | |
| Battlefield 4 - 1366x768 High Preset | |
| Acer Aspire F15 F5-573G-53V1 | |
| Acer Aspire V Nitro VN7-792G-55SF | |
| Medion Erazer P6661 MD 99873 | |
| Acer Aspire E5-774G-78NA | |
| Dell Inspiron 17 7778 | |
| Asus VivoBook X556UQ-XO076T | |
| Acer Aspire E5-772G-70VP | |
| Star Wars Battlefront - 1024x768 Low Preset | |
| Acer Aspire E5-774G-78NA | |
| Asus VivoBook X556UQ-XO076T | |
| Dell Inspiron 17 7778 | |
| Mirror's Edge Catalyst - 1280x720 Low Preset AF:2x | |
| Acer Aspire E5-774G-78NA | |
| Asus VivoBook X556UQ-XO076T | |
| Dell Inspiron 17 7778 | |
| Dirt Rally - 1366x768 Medium Preset | |
| Acer Aspire V Nitro VN7-792G-55SF | |
| Acer Aspire E5-774G-78NA | |
| Medion Erazer P6661 MD 99873 | |
| Dell Inspiron 17 7778 | |
Barulho
| Ocioso |
| 33.2 / 33.2 / 33.7 dB |
| HDD |
| 33 dB |
| DVD |
| 36.6 / dB |
| Carga |
| 36 / 40 dB |
 | ||
30 dB silencioso 40 dB(A) audível 50 dB(A) ruidosamente alto |
||
min: | ||
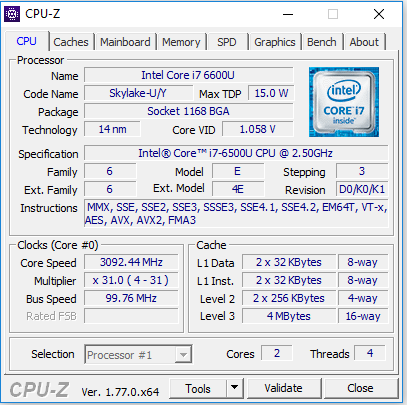
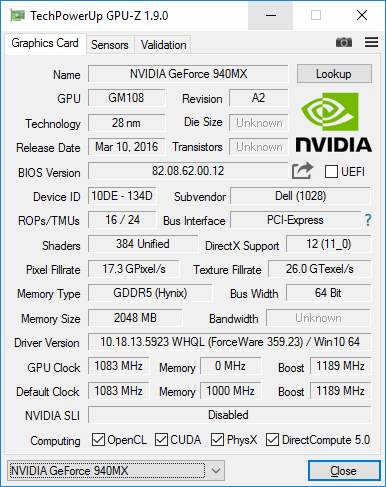
| Acer Aspire E5-774G-78NA 6500U, GeForce 940MX | Acer Aspire E5-772G-70VP 5500U, GeForce 940M | HP Pavilion 17-g120ng 6500U, GeForce 940M | Asus F756UX-T7013T 6200U, GeForce GTX 950M | Toshiba Satellite C70-C-1FT 6200U, GeForce 930M | Lenovo IdeaPad 300-17ISK 80QH001EGE 6200U, Radeon R5 M330 | |
|---|---|---|---|---|---|---|
| Noise | -2% | -9% | -4% | 2% | 1% | |
| off / environment * | 31.2 | 31.2 -0% | 31.2 -0% | 31.2 -0% | ||
| Idle Minimum * | 33.2 | 32 4% | 33.5 -1% | 32.4 2% | 32.3 3% | 32.5 2% |
| Idle Average * | 33.2 | 32.3 3% | 33.5 -1% | 32.6 2% | 32.3 3% | 33.4 -1% |
| Idle Maximum * | 33.7 | 32.6 3% | 33.5 1% | 32.6 3% | 33.2 1% | 33.4 1% |
| Load Average * | 36 | 41.2 -14% | 45 -25% | 42 -17% | 34.9 3% | 36.1 -0% |
| Load Maximum * | 40 | 41.6 -4% | 47 -18% | 45.2 -13% | 40.3 -1% | 38.8 3% |
* ... smaller is better
(+) The maximum temperature on the upper side is 37.1 °C / 99 F, compared to the average of 36.9 °C / 98 F, ranging from 21.1 to 71 °C for the class Multimedia.
(-) The bottom heats up to a maximum of 48 °C / 118 F, compared to the average of 39.1 °C / 102 F
(+) In idle usage, the average temperature for the upper side is 25.3 °C / 78 F, compared to the device average of 31.2 °C / 88 F.
(±) The palmrests and touchpad can get very hot to the touch with a maximum of 36.1 °C / 97 F.
(-) The average temperature of the palmrest area of similar devices was 28.8 °C / 83.8 F (-7.3 °C / -13.2 F).
| Acer Aspire E5-774G-78NA 6500U, GeForce 940MX | Acer Aspire E5-772G-70VP 5500U, GeForce 940M | HP Pavilion 17-g120ng 6500U, GeForce 940M | Asus F756UX-T7013T 6200U, GeForce GTX 950M | Toshiba Satellite C70-C-1FT 6200U, GeForce 930M | Lenovo IdeaPad 300-17ISK 80QH001EGE 6200U, Radeon R5 M330 | |
|---|---|---|---|---|---|---|
| Heat | -20% | -10% | -5% | 7% | 4% | |
| Maximum Upper Side * | 37.1 | 46.9 -26% | 46 -24% | 42 -13% | 37.4 -1% | 36.6 1% |
| Maximum Bottom * | 48 | 54.7 -14% | 47 2% | 50.5 -5% | 37.6 22% | 41.4 14% |
| Idle Upper Side * | 26.1 | 32.6 -25% | 29.7 -14% | 27.2 -4% | 26.7 -2% | 26.2 -0% |
| Idle Bottom * | 27.6 | 31.3 -13% | 29.1 -5% | 27 2% | 25.6 7% | 28 -1% |
* ... smaller is better
Acer Aspire E5-774G-78NA audio analysis
(±) | speaker loudness is average but good (75 dB)
Bass 100 - 315 Hz
(-) | nearly no bass - on average 23.7% lower than median
(±) | linearity of bass is average (10% delta to prev. frequency)
Mids 400 - 2000 Hz
(±) | reduced mids - on average 5.6% lower than median
(±) | linearity of mids is average (11.1% delta to prev. frequency)
Highs 2 - 16 kHz
(±) | higher highs - on average 6.6% higher than median
(+) | highs are linear (6.2% delta to prev. frequency)
Overall 100 - 16.000 Hz
(±) | linearity of overall sound is average (27.7% difference to median)
Compared to same class
» 93% of all tested devices in this class were better, 1% similar, 6% worse
» The best had a delta of 5%, average was 18%, worst was 45%
Compared to all devices tested
» 81% of all tested devices were better, 4% similar, 15% worse
» The best had a delta of 4%, average was 25%, worst was 134%
Apple MacBook 12 (Early 2016) 1.1 GHz audio analysis
(+) | speakers can play relatively loud (83.6 dB)
Bass 100 - 315 Hz
(±) | reduced bass - on average 11.3% lower than median
(±) | linearity of bass is average (14.2% delta to prev. frequency)
Mids 400 - 2000 Hz
(+) | balanced mids - only 2.4% away from median
(+) | mids are linear (5.5% delta to prev. frequency)
Highs 2 - 16 kHz
(+) | balanced highs - only 2% away from median
(+) | highs are linear (4.5% delta to prev. frequency)
Overall 100 - 16.000 Hz
(+) | overall sound is linear (10.2% difference to median)
Compared to same class
» 5% of all tested devices in this class were better, 2% similar, 93% worse
» The best had a delta of 5%, average was 19%, worst was 53%
Compared to all devices tested
» 3% of all tested devices were better, 1% similar, 96% worse
» The best had a delta of 4%, average was 25%, worst was 134%
| desligado | |
| Ocioso | |
| Carga |
|
| Acer Aspire E5-774G-78NA 6500U, GeForce 940MX | Acer Aspire E5-772G-70VP 5500U, GeForce 940M | HP Pavilion 17-g120ng 6500U, GeForce 940M | Asus F756UX-T7013T 6200U, GeForce GTX 950M | Toshiba Satellite C70-C-1FT 6200U, GeForce 930M | Lenovo IdeaPad 300-17ISK 80QH001EGE 6200U, Radeon R5 M330 | |
|---|---|---|---|---|---|---|
| Power Consumption | -5% | 15% | -2% | -5% | 36% | |
| Idle Minimum * | 8.2 | 6 27% | 4.8 41% | 5.8 29% | 10.6 -29% | 4.5 45% |
| Idle Average * | 12.6 | 12.2 3% | 10.1 20% | 11.2 11% | 13.5 -7% | 8.1 36% |
| Idle Maximum * | 13 | 14.5 -12% | 10.4 20% | 11.9 8% | 14 -8% | 8.7 33% |
| Load Average * | 51 | 54 -6% | 45.4 11% | 54 -6% | 44 14% | 29.8 42% |
| Load Maximum * | 54.6 | 73.7 -35% | 63 -15% | 84 -54% | 52 5% | 42 23% |
* ... smaller is better
| Acer Aspire E5-774G-78NA 41 Wh | Acer Aspire E5-772G-70VP 37 Wh | HP Pavilion 17-g120ng 41 Wh | Asus F756UX-T7013T 38 Wh | Toshiba Satellite C70-C-1FT 44 Wh | Lenovo IdeaPad 300-17ISK 80QH001EGE 41 Wh | |
|---|---|---|---|---|---|---|
| Battery Runtime | -12% | -20% | -13% | -22% | 26% | |
| Reader / Idle | 702 | 454 -35% | 491 -30% | |||
| H.264 | 299 | |||||
| WiFi v1.3 | 322 | 259 -20% | 256 -20% | 217 -33% | 252 -22% | 406 26% |
| Load | 60 | 72 20% | 75 25% |
Pro
Contra
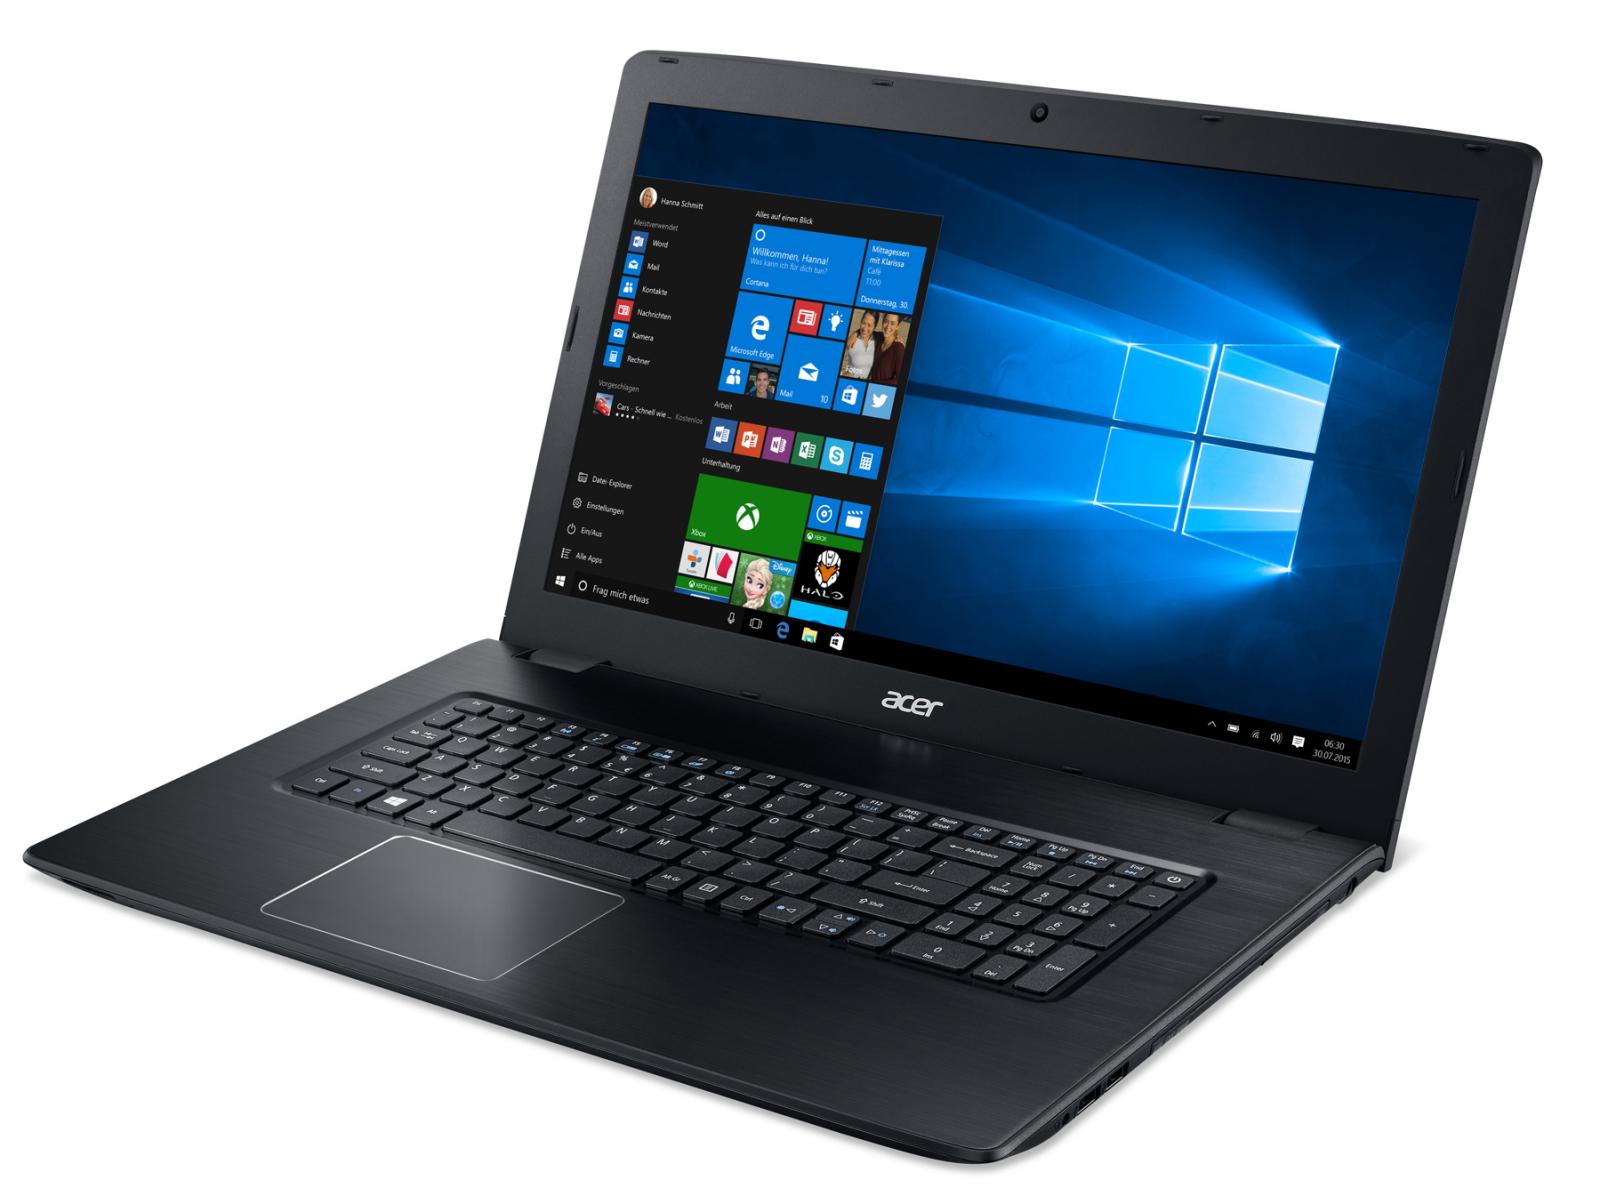
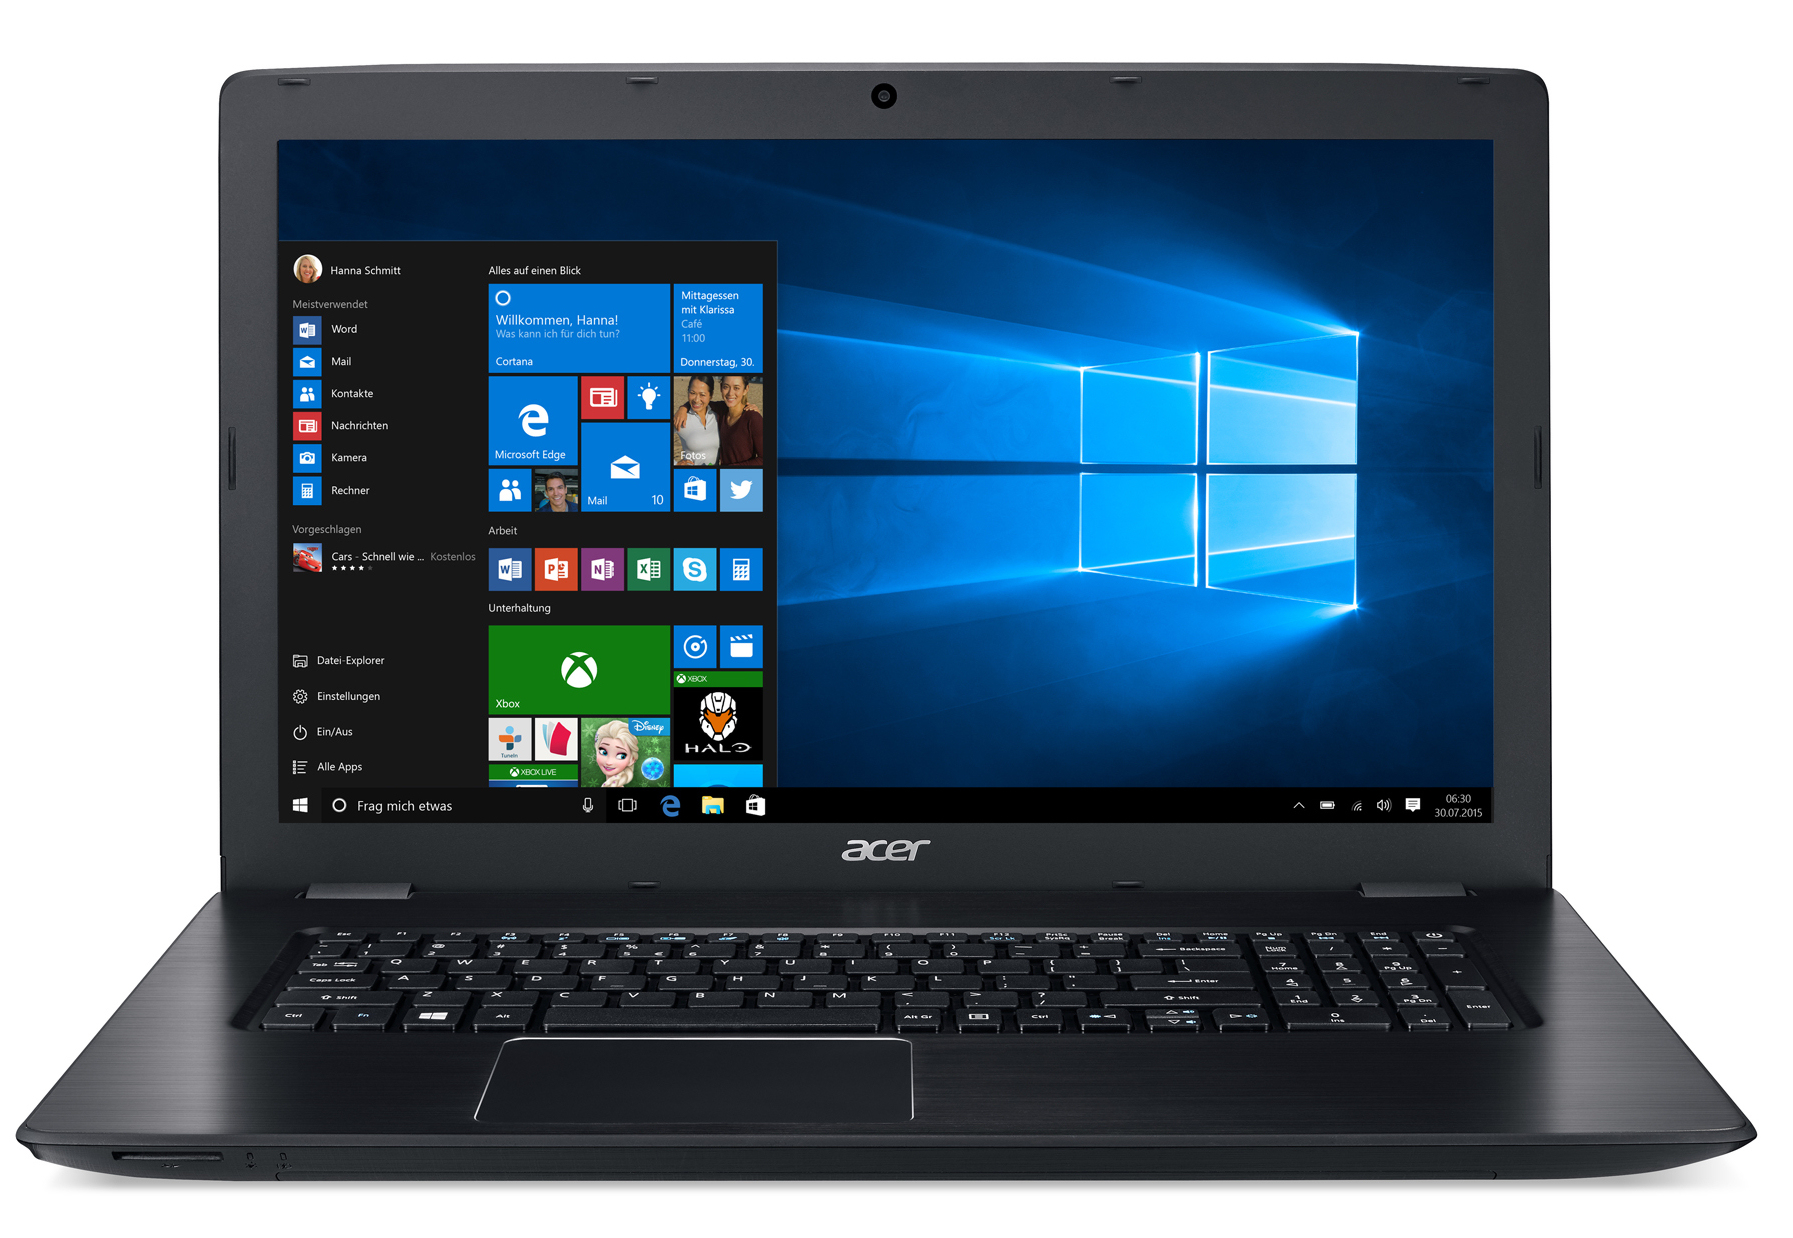
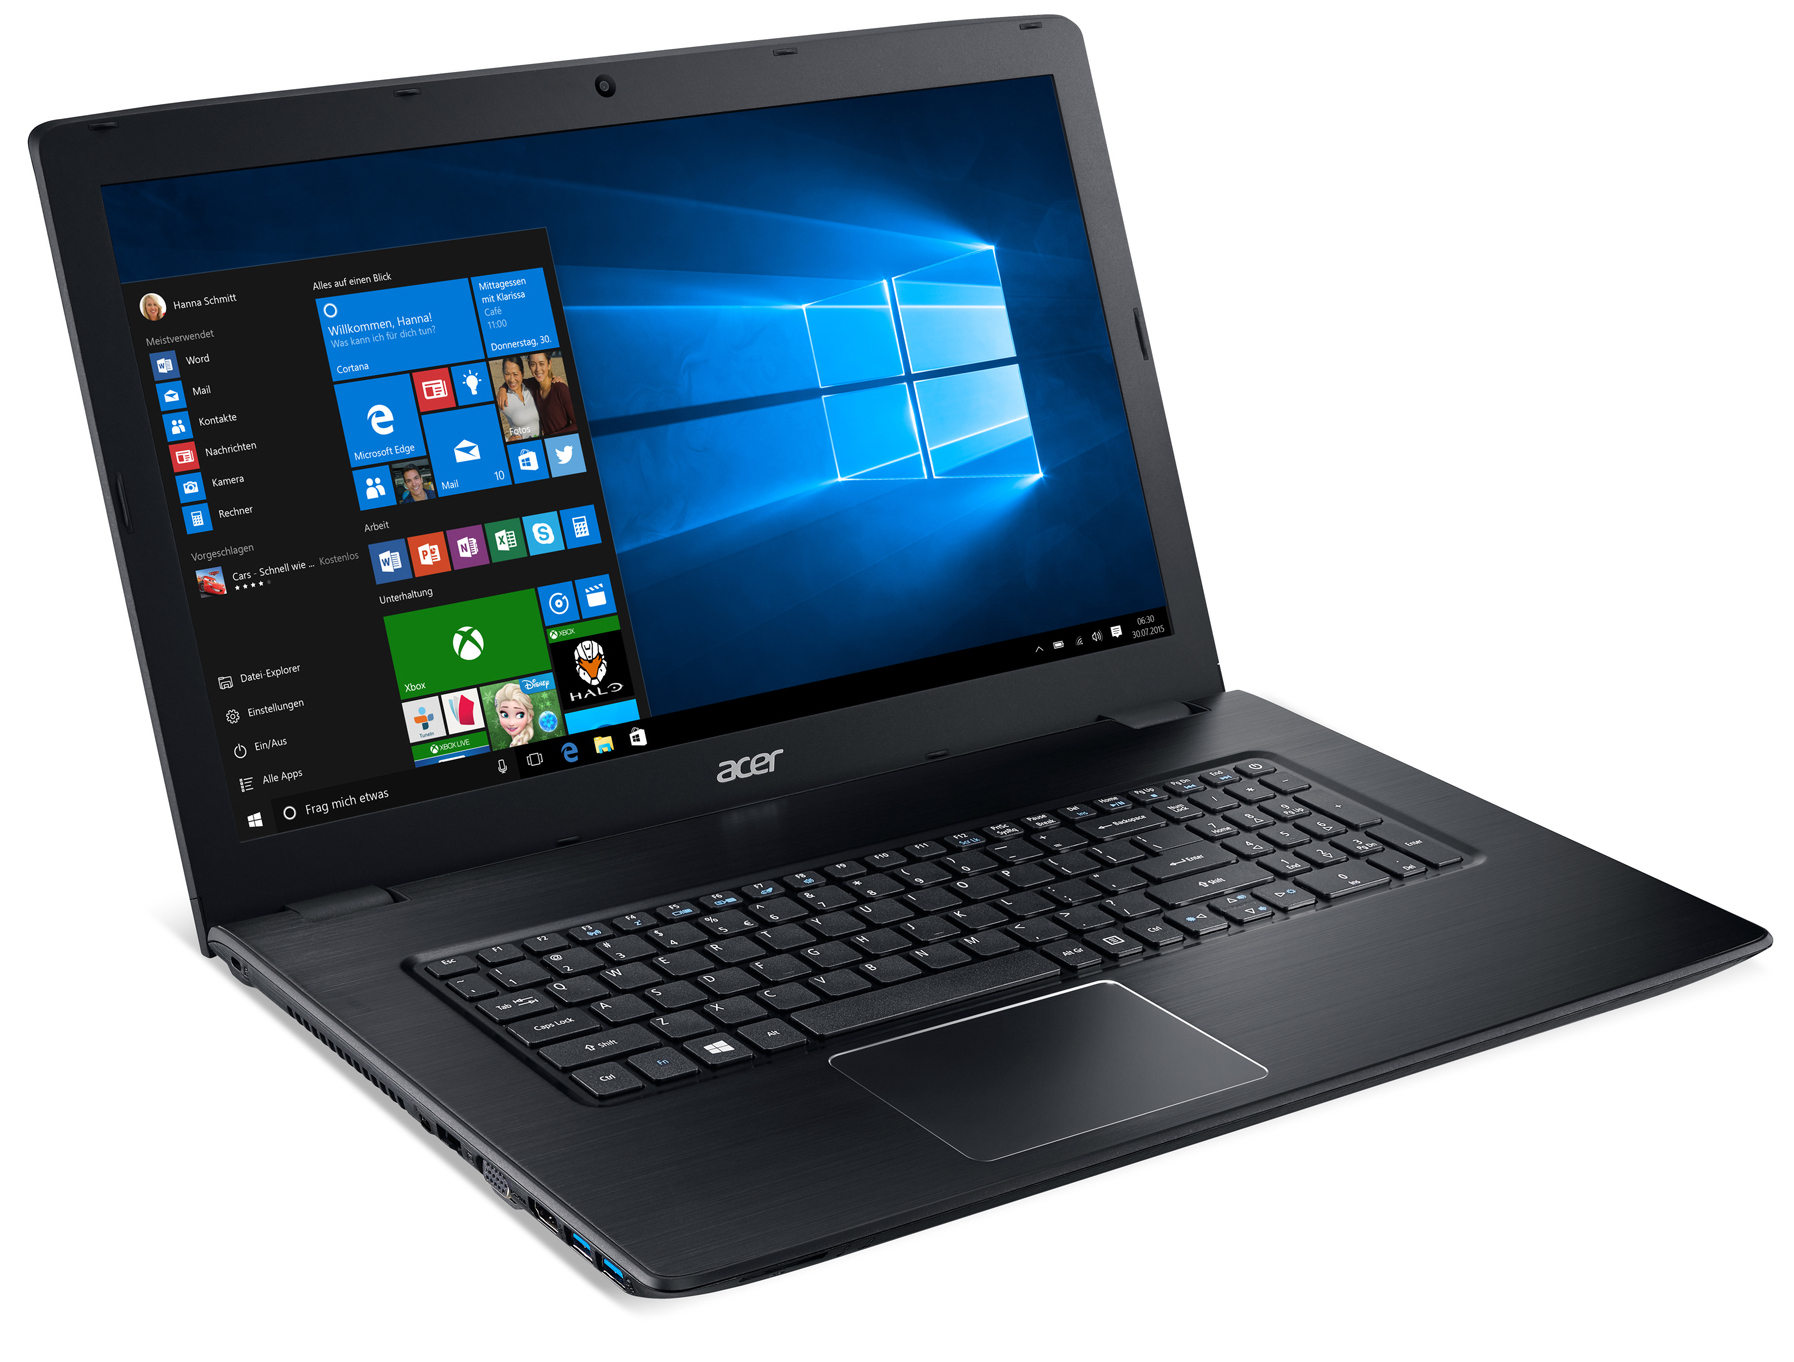
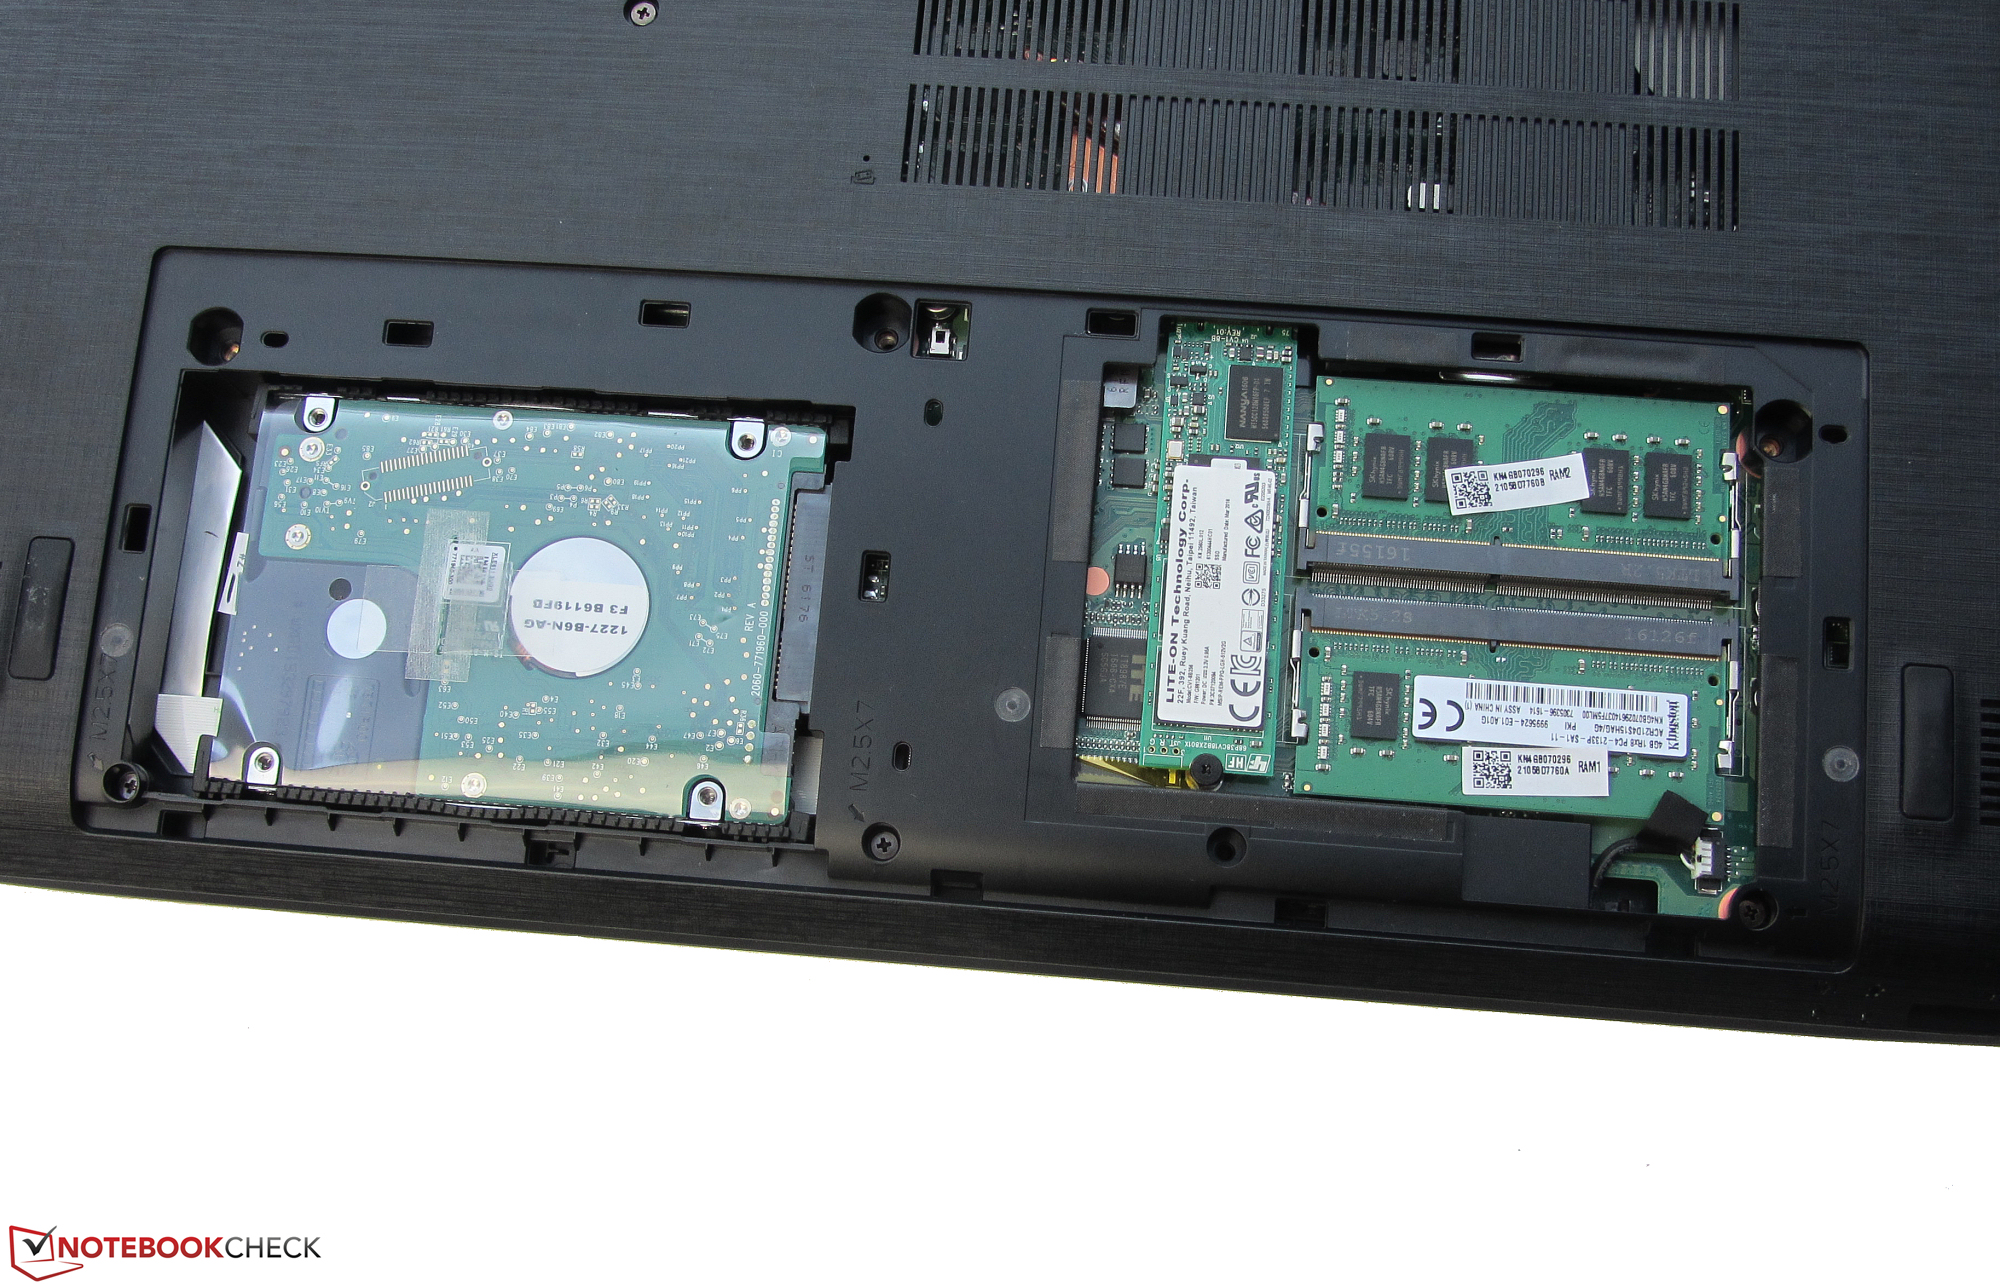
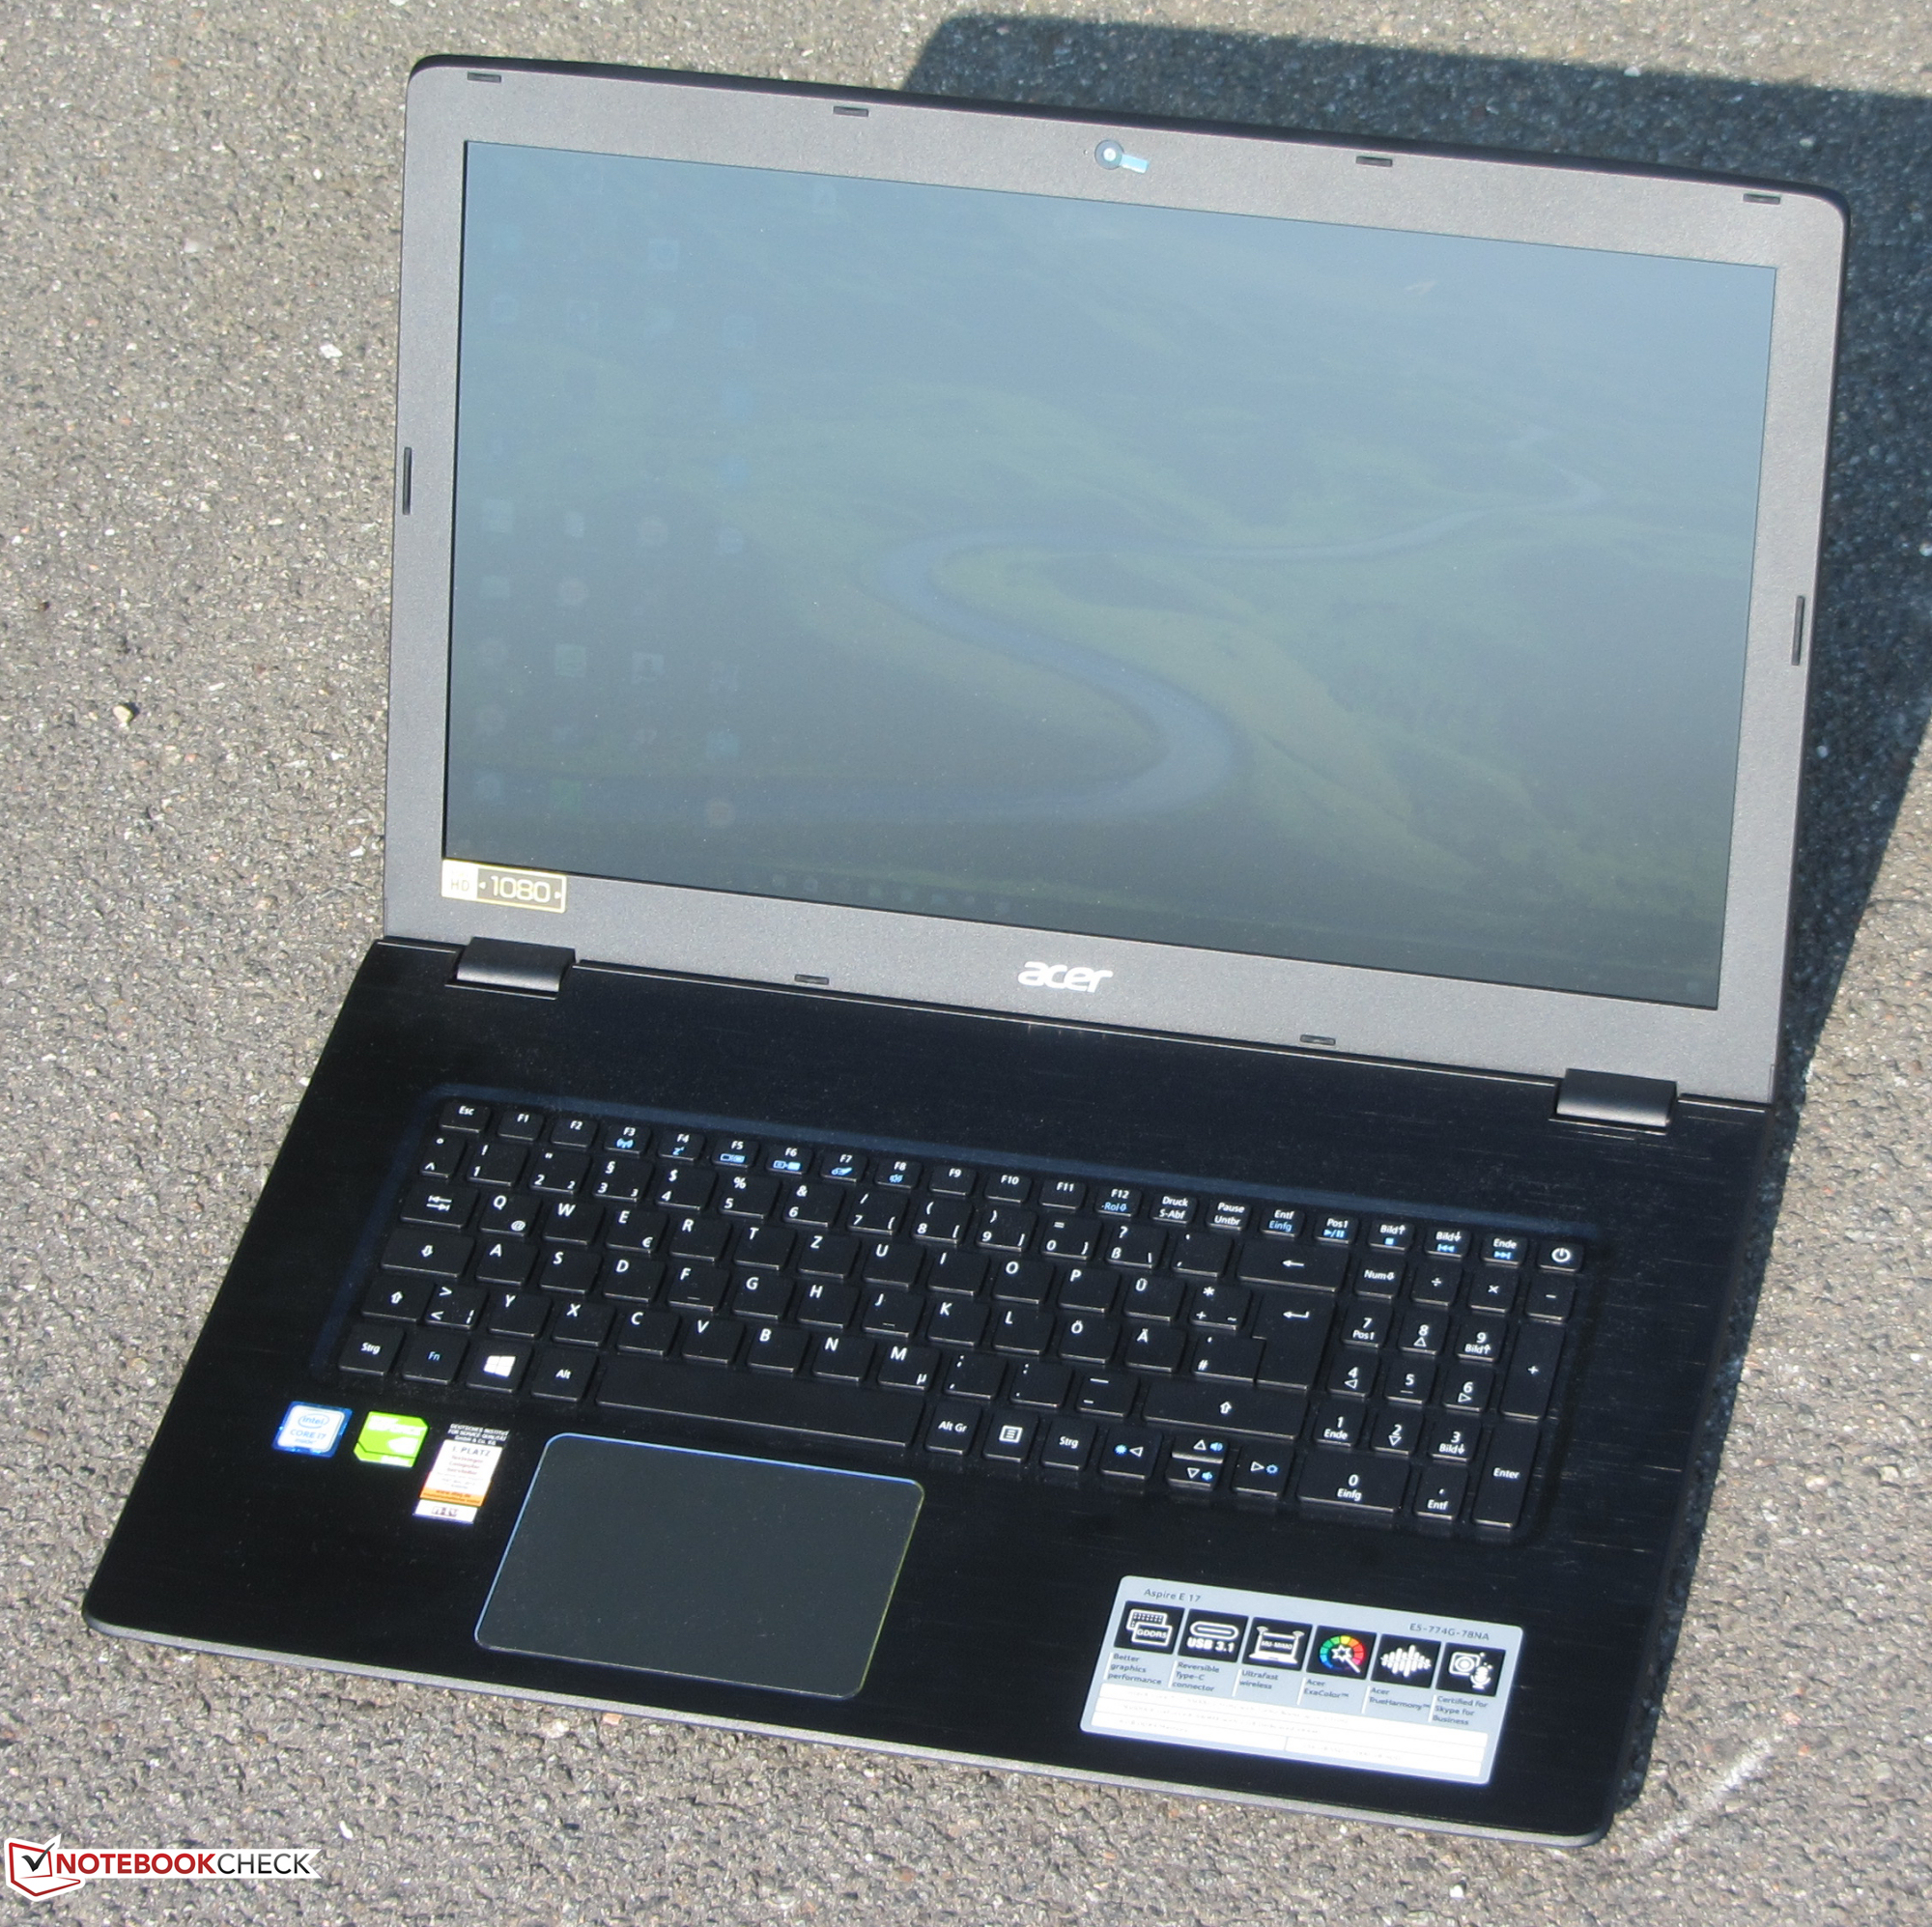
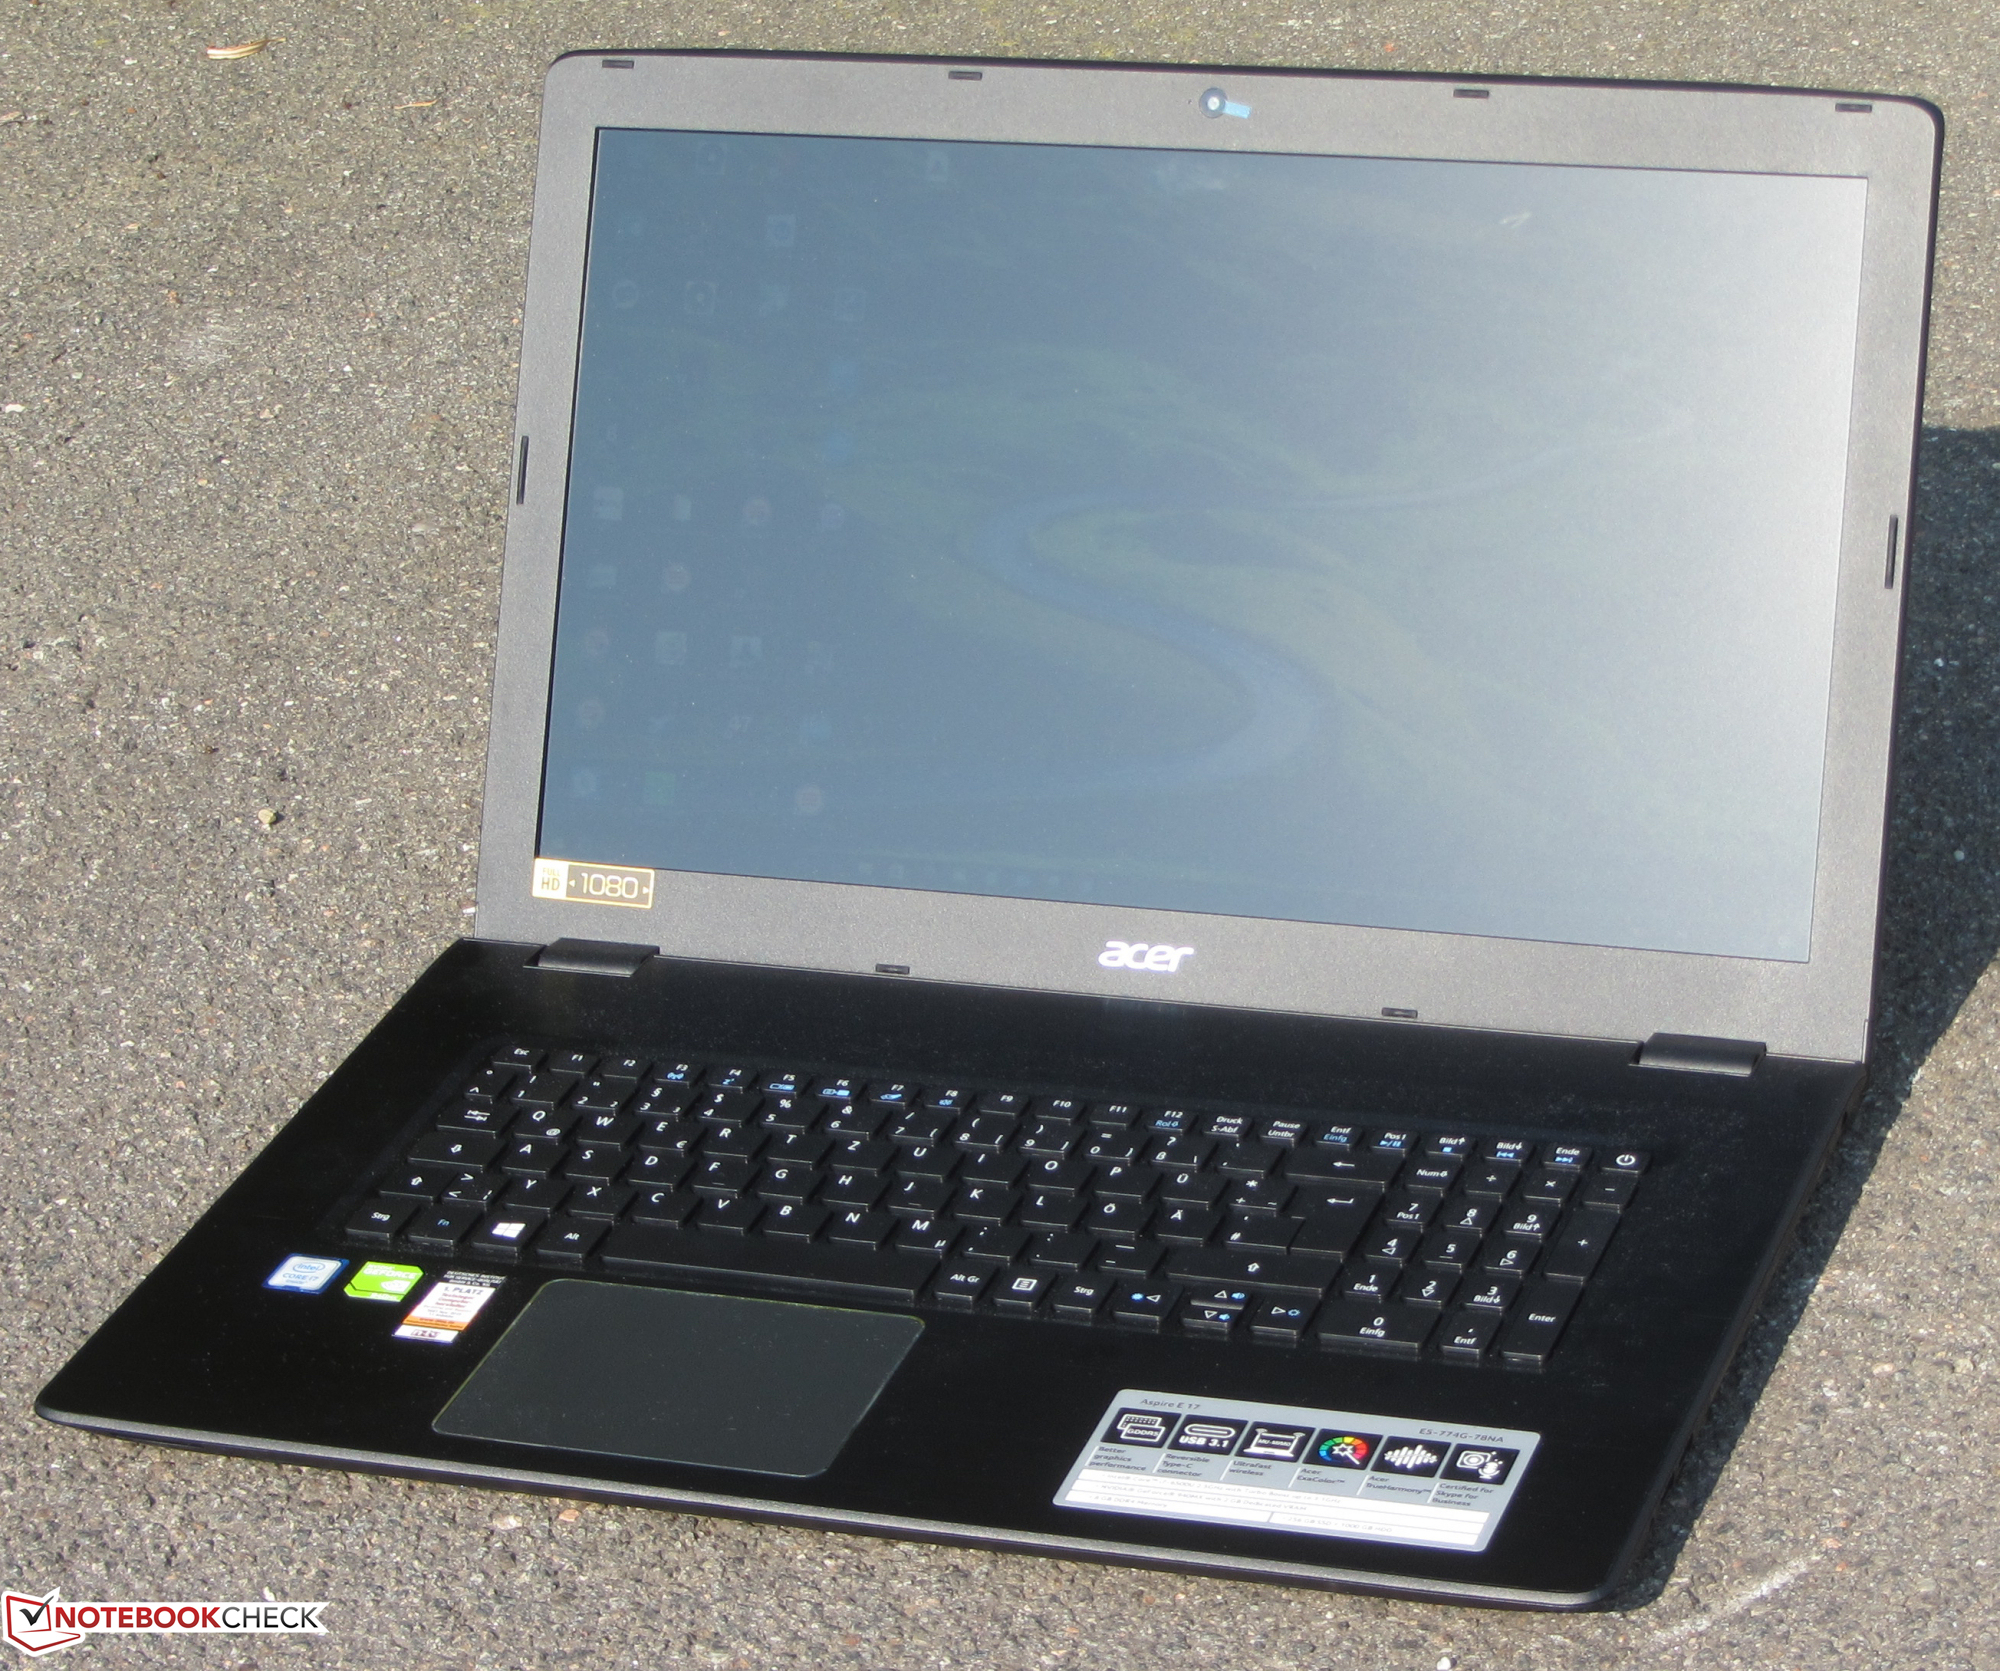
O portátil Acer de 17,3 polegadas consegue oferecer uma boa quantidade de desempenho para aplicativos. Além disso, o portátil reproduz fluentemente muitos jogos de computadores atuais e a maioria dos antigos sem se tornar muito barulhento. O ruído é mantido dentro dos limites durante todo o período sob uso intenso. O mesmo acontece com as temperaturas. Um veloz SSD garante um sistema veloz, e um disco rígido de 2,5-polegadas fornece muito espaço de armazenamento. Ambos os dispositivos de armazenamento poderiam ser substituídos facilmente, dado que a Acer equipou o portátil com uma escotilha de manutenção. O teclado instalado não é um modelo top, mas nos atraiu bastante. A duração da bateria está em um bom nível para um portátil de 17,3-polegadas.
A Acer entrega um poli funcional de sucesso para o home desk com o seu Aspire E5-774G.
A tela do portátil não dá muitos motivos para reclamar. Ela é brilhante, tem alto contraste e a cobertura do espaço de cores é boa. A única desvantagem: A Acer instala um painel TN dependente dos ângulos de visão. Embora seja um modelo superior, uma tela IPS teria completado muito bem o portátil. Isto, no entanto, é tolerável em um portátil que serve com um substituto de desktop.
Acer Aspire E5-774G-78NA
-
09/16/2016 v5.1(old)
Sascha Mölck