 Deutsch
 English
 Español
 Français
 Italiano
 Nederlands
 Polski
 Português
 Русский
 Türkçe
 Svenska
 Chinese
 Magyar
Breve Análise do Portátil Apple MacBook Pro 13 (Final de 2016, 2,9 GHz i5, Touch Bar)
| Networking | |
| iperf3 transmit AX12 | |
| Apple MacBook Pro 15 2016 (2.6 GHz, 450) (Klaus I211) | |
| Apple MacBook Pro 13 2016 (2.9 GHz) | |
| Apple MacBook Pro 13 2016 (Klaus I211) | |
| Dell XPS 13 9360 QHD+ i7 | |
| Lenovo ThinkPad T460s-20FA003GGE | |
| iperf3 receive AX12 | |
| Apple MacBook Pro 13 2016 (2.9 GHz) | |
| Apple MacBook Pro 15 2016 (2.6 GHz, 450) (Klaus I211) | |
| Apple MacBook Pro 13 2016 (Klaus I211) | |
| Dell XPS 13 9360 QHD+ i7 | |
| Lenovo ThinkPad T460s-20FA003GGE | |
| |||||||||||||||||||||||||
iluminação: 90 %
iluminação com acumulador: 569 cd/m²
Contraste: 1016:1 (Preto: 0.56 cd/m²)
ΔE Color 1.4 | 0.5-29.43 Ø5
ΔE Greyscale 1.8 | 0.57-98 Ø5.3
99.3% sRGB (Argyll 1.6.3 3D)
78.4% AdobeRGB 1998 (Argyll 1.6.3 3D)
87.6% AdobeRGB 1998 (Argyll 2.2.0 3D)
99.9% sRGB (Argyll 2.2.0 3D)
99.2% Display P3 (Argyll 2.2.0 3D)
Gamma: 2.16
| Apple MacBook Pro 13 2016 (2.9 GHz) APPA033, , 2560x1600, 13.30 | Apple MacBook Pro 13 2016 APPA034, , 2560x1600, 13.30 | Apple MacBook Pro Retina 13 inch 2015-03 APPA02A, , 2560x1600, 13.30 | Dell XPS 13 9360 QHD+ i7 Sharp SHP144A, , 3200x1800, 13.30 | Lenovo ThinkPad X1 Carbon 20FB003RGE VVX14T058J00, , 2560x1440, 14.00 | |
|---|---|---|---|---|---|
| Display | -1% | -20% | -25% | -20% | |
| Display P3 Coverage | 99.2 | 97.1 -2% | 65.9 -34% | 62.8 -37% | 66.7 -33% |
| sRGB Coverage | 99.9 | 99.8 0% | 97 -3% | 89.4 -11% | 94.7 -5% |
| AdobeRGB 1998 Coverage | 87.6 | 86.7 -1% | 67.4 -23% | 64.6 -26% | 68.4 -22% |
| Response Times | 2% | 27% | 31% | ||
| Response Time Grey 50% / Grey 80% * | 47.2 ? | 47.2 ? -0% | 43.6 ? 8% | 44 ? 7% | |
| Response Time Black / White * | 53 ? | 51.6 ? 3% | 29.2 ? 45% | 24 ? 55% | |
| PWM Frequency | 220 ? | ||||
| Screen | -2% | -12% | -48% | -39% | |
| Brightness middle | 569 | 600 5% | 361 -37% | 396.2 -30% | 272 -52% |
| Brightness | 542 | 564 4% | 342 -37% | 357 -34% | 268 -51% |
| Brightness Distribution | 90 | 89 -1% | 81 -10% | 84 -7% | 95 6% |
| Black Level * | 0.56 | 0.57 -2% | 0.361 36% | 0.266 52% | 0.32 43% |
| Contrast | 1016 | 1053 4% | 1000 -2% | 1489 47% | 850 -16% |
| Colorchecker dE 2000 * | 1.4 | 1.5 -7% | 1.82 -30% | 3.9 -179% | 2.61 -86% |
| Colorchecker dE 2000 max. * | 2.9 | 2.9 -0% | 3.26 -12% | 7.58 -161% | 6.43 -122% |
| Greyscale dE 2000 * | 1.8 | 2 -11% | 1.8 -0% | 4.16 -131% | 3.31 -84% |
| Gamma | 2.16 102% | 2.27 97% | 2.49 88% | 2.31 95% | 2.35 94% |
| CCT | 6877 95% | 6855 95% | 6417 101% | 6514 100% | 6360 102% |
| Color Space (Percent of AdobeRGB 1998) | 78.4 | 77 -2% | 61.9 -21% | 57.5 -27% | 63 -20% |
| Color Space (Percent of sRGB) | 99.3 | 92 -7% | 96.9 -2% | 88.7 -11% | 95 -4% |
| Total Average (Program / Settings) | -0% /
-1% | -16% /
-13% | -15% /
-33% | -9% /
-26% |
* ... smaller is better
Display Response Times
| ↔ Response Time Black to White | ||
|---|---|---|
| 53 ms ... rise ↗ and fall ↘ combined | ↗ 10 ms rise | 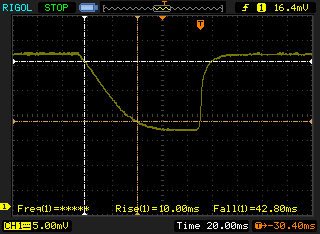 |
| ↘ 43 ms fall | ||
| The screen shows slow response rates in our tests and will be unsatisfactory for gamers. In comparison, all tested devices range from 0.1 (minimum) to 240 (maximum) ms. » 99 % of all devices are better. This means that the measured response time is worse than the average of all tested devices (21.5 ms). | ||
| ↔ Response Time 50% Grey to 80% Grey | ||
| 47.2 ms ... rise ↗ and fall ↘ combined | ↗ 19.6 ms rise | 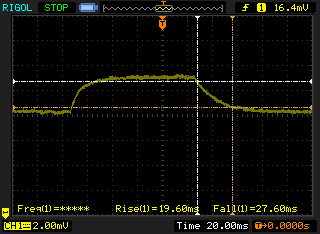 |
| ↘ 27.6 ms fall | ||
| The screen shows slow response rates in our tests and will be unsatisfactory for gamers. In comparison, all tested devices range from 0.2 (minimum) to 636 (maximum) ms. » 79 % of all devices are better. This means that the measured response time is worse than the average of all tested devices (33.7 ms). | ||
Screen Flickering / PWM (Pulse-Width Modulation)
| Screen flickering / PWM not detected | 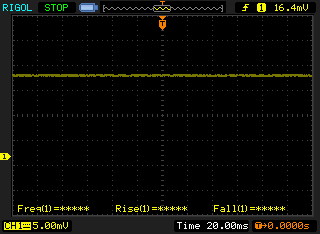 | ||
In comparison: 53 % of all tested devices do not use PWM to dim the display. If PWM was detected, an average of 17900 (minimum: 5 - maximum: 3846000) Hz was measured. | |||


| PCMark 8 Home Score Accelerated v2 | 3738 pontos | |
| PCMark 8 Work Score Accelerated v2 | 4218 pontos | |
Ajuda | ||

| 3DMark 06 Standard Score | 15951 pontos | |
| 3DMark 11 Performance | 2881 pontos | |
| 3DMark Cloud Gate Standard Score | 8105 pontos | |
| 3DMark Fire Strike Score | 1550 pontos | |
| 3DMark Time Spy Score | 620 pontos | |
Ajuda | ||
| The Witcher 3 - 1024x768 Low Graphics & Postprocessing | |
| Asus Zenbook UX310UQ-GL011T | |
| Apple MacBook Pro 13 2016 (2.9 GHz) | |
| Apple MacBook Pro 13 2016 | |
| Dell XPS 13 9360 QHD+ i7 | |
| Razer Blade Stealth QHD i7-7500U | |
| Rise of the Tomb Raider - 1024x768 Lowest Preset | |
| Apple MacBook Pro 13 2016 (2.9 GHz) | |
| Apple MacBook Pro 13 2016 | |
| Dell XPS 13 9360 QHD+ i7 | |
| Razer Blade Stealth QHD i7-7500U | |
| Deus Ex Mankind Divided - 1280x720 Low Preset AF:1x | |
| Apple MacBook Pro 13 2016 (2.9 GHz) | |
| Apple MacBook Pro 13 2016 | |
| Apple MacBook Pro 13 2016 | |
| baixo | média | alto | ultra | |
| BioShock Infinite (2013) | 103 | 56.2 | 47.9 | 13.8 |
| The Witcher 3 (2015) | 21.6 | 14.9 | ||
| Dota 2 Reborn (2015) | 40.3 | 33.6 | ||
| Rainbow Six Siege (2015) | 52.9 | 32.3 | 19 | 14.6 |
| Rise of the Tomb Raider (2016) | 27.3 | 21.9 | ||
| Far Cry Primal (2016) | 27 | 14 | ||
| Overwatch (2016) | 86 | 58.8 | 26.2 | |
| Deus Ex Mankind Divided (2016) | 26 | |||
| Battlefield 1 (2016) | 49.6 | 29.8 | 15.1 | |
| Farming Simulator 17 (2016) | 93 | 34.7 | 20.8 | |
| Titanfall 2 (2016) | 65 | 45.2 | 17.7 | |
| Watch Dogs 2 (2016) | 23.4 | 19.9 |
Barulho
| Ocioso |
| 30.2 / 30.2 / 30.2 dB |
| Carga |
| 33 / 36.2 dB |
 | ||
30 dB silencioso 40 dB(A) audível 50 dB(A) ruidosamente alto |
||
min: | ||
(±) The maximum temperature on the upper side is 45 °C / 113 F, compared to the average of 35.9 °C / 97 F, ranging from 21.4 to 59 °C for the class Subnotebook.
(+) The bottom heats up to a maximum of 39 °C / 102 F, compared to the average of 39.4 °C / 103 F
(+) In idle usage, the average temperature for the upper side is 23.9 °C / 75 F, compared to the device average of 30.7 °C / 87 F.
(+) The palmrests and touchpad are cooler than skin temperature with a maximum of 29 °C / 84.2 F and are therefore cool to the touch.
(±) The average temperature of the palmrest area of similar devices was 28.3 °C / 82.9 F (-0.7 °C / -1.3 F).
Apple MacBook Pro 13 2016 (2.9 GHz) audio analysis
(+) | speakers can play relatively loud (86.9 dB)
Bass 100 - 315 Hz
(±) | reduced bass - on average 13.2% lower than median
(±) | linearity of bass is average (10.7% delta to prev. frequency)
Mids 400 - 2000 Hz
(+) | balanced mids - only 4.1% away from median
(+) | mids are linear (6.3% delta to prev. frequency)
Highs 2 - 16 kHz
(+) | balanced highs - only 2.9% away from median
(+) | highs are linear (4% delta to prev. frequency)
Overall 100 - 16.000 Hz
(+) | overall sound is linear (12.2% difference to median)
Compared to same class
» 12% of all tested devices in this class were better, 4% similar, 85% worse
» The best had a delta of 5%, average was 19%, worst was 53%
Compared to all devices tested
» 7% of all tested devices were better, 2% similar, 91% worse
» The best had a delta of 4%, average was 25%, worst was 134%
Apple MacBook Pro 13 2016 audio analysis
(+) | speakers can play relatively loud (83.2 dB)
Bass 100 - 315 Hz
(±) | reduced bass - on average 8.4% lower than median
(-) | bass is not linear (16.7% delta to prev. frequency)
Mids 400 - 2000 Hz
(+) | balanced mids - only 4.7% away from median
(+) | mids are linear (6.3% delta to prev. frequency)
Highs 2 - 16 kHz
(+) | balanced highs - only 1.1% away from median
(+) | highs are linear (2.6% delta to prev. frequency)
Overall 100 - 16.000 Hz
(+) | overall sound is linear (9.8% difference to median)
Compared to same class
» 4% of all tested devices in this class were better, 2% similar, 94% worse
» The best had a delta of 5%, average was 19%, worst was 53%
Compared to all devices tested
» 3% of all tested devices were better, 1% similar, 96% worse
» The best had a delta of 4%, average was 25%, worst was 134%
Apple MacBook Pro 15 2016 (2.6 GHz, 450) audio analysis
(+) | speakers can play relatively loud (86 dB)
Bass 100 - 315 Hz
(±) | reduced bass - on average 6.9% lower than median
(±) | linearity of bass is average (12.7% delta to prev. frequency)
Mids 400 - 2000 Hz
(±) | higher mids - on average 5% higher than median
(±) | linearity of mids is average (9.5% delta to prev. frequency)
Highs 2 - 16 kHz
(+) | balanced highs - only 2% away from median
(+) | highs are linear (4.3% delta to prev. frequency)
Overall 100 - 16.000 Hz
(+) | overall sound is linear (9.7% difference to median)
Compared to same class
» 8% of all tested devices in this class were better, 0% similar, 91% worse
» The best had a delta of 5%, average was 18%, worst was 45%
Compared to all devices tested
» 3% of all tested devices were better, 1% similar, 97% worse
» The best had a delta of 4%, average was 25%, worst was 134%
| desligado | |
| Ocioso | |
| Carga |
|
| Apple MacBook Pro 13 2016 (2.9 GHz) 6267U, Iris Graphics 550, 2560x1600, 13.30 | Apple MacBook Pro 13 2016 6360U, Iris Graphics 540, 2560x1600, 13.30 | Apple MacBook Pro Retina 13 inch 2015-03 5257U, Iris Graphics 6100, 2560x1600, 13.30 | Apple MacBook Air 13 inch 2015-03 5650U, HD Graphics 6000, 1440x900, 13.30 | Dell XPS 13 9360 QHD+ i7 i7-7500U, HD Graphics 620, 3200x1800, 13.30 | Lenovo ThinkPad X1 Carbon 20FB003RGE 6500U, HD Graphics 520, 2560x1440, 14.00 | Lenovo ThinkPad T460s-20FA003GGE 6600U, HD Graphics 520, 2560x1440, 14.00 | |
|---|---|---|---|---|---|---|---|
| Power Consumption | -3% | -7% | 21% | -16% | 1% | -2% | |
| Idle Minimum * | 2.1 | 3 -43% | 2.8 -33% | 2.7 -29% | 6.4 -205% | 3.8 -81% | 3.8 -81% |
| Idle Average * | 7.6 | 8.9 -17% | 7.8 -3% | 5.7 25% | 6.6 13% | 7.1 7% | 7.1 7% |
| Idle Maximum * | 8.2 | 8.9 -9% | 8.1 1% | 6 27% | 6.8 17% | 7.7 6% | 7.8 5% |
| Load Average * | 56.4 | 43.4 23% | 52.4 7% | 32.1 43% | 27.5 51% | 30.2 46% | 36.3 36% |
| Load Maximum * | 59.8 | 42.1 30% | 62.8 -5% | 36.2 39% | 32.4 46% | 44.7 25% | 46 23% |
* ... smaller is better
| Apple MacBook Pro 13 2016 (2.9 GHz) 6267U, Iris Graphics 550, 49.2 Wh | Apple MacBook Pro 13 2016 6360U, Iris Graphics 540, 54 Wh | Apple MacBook Pro Retina 13 inch 2015-03 5257U, Iris Graphics 6100, 75 Wh | Apple MacBook Air 13 inch 2015-03 5650U, HD Graphics 6000, 54 Wh | Dell XPS 13 9360 QHD+ i7 i7-7500U, HD Graphics 620, 60 Wh | Lenovo ThinkPad X1 Carbon 20FB003RGE 6500U, HD Graphics 520, 52 Wh | Lenovo ThinkPad T460s-20FA003GGE 6600U, HD Graphics 520, 49 Wh | |
|---|---|---|---|---|---|---|---|
| Battery Runtime | 34% | 19% | 29% | 43% | 19% | -21% | |
| H.264 | 483 | 620 28% | 581 20% | 510 6% | 397 -18% | ||
| WiFi v1.3 | 566 | 686 21% | 539 -5% | 620 10% | 516 -9% | 429 -24% | 340 -40% |
| Load | 66 | 101 53% | 94 42% | 97 47% | 129 95% | 115 74% | 62 -6% |
Pro
Contra
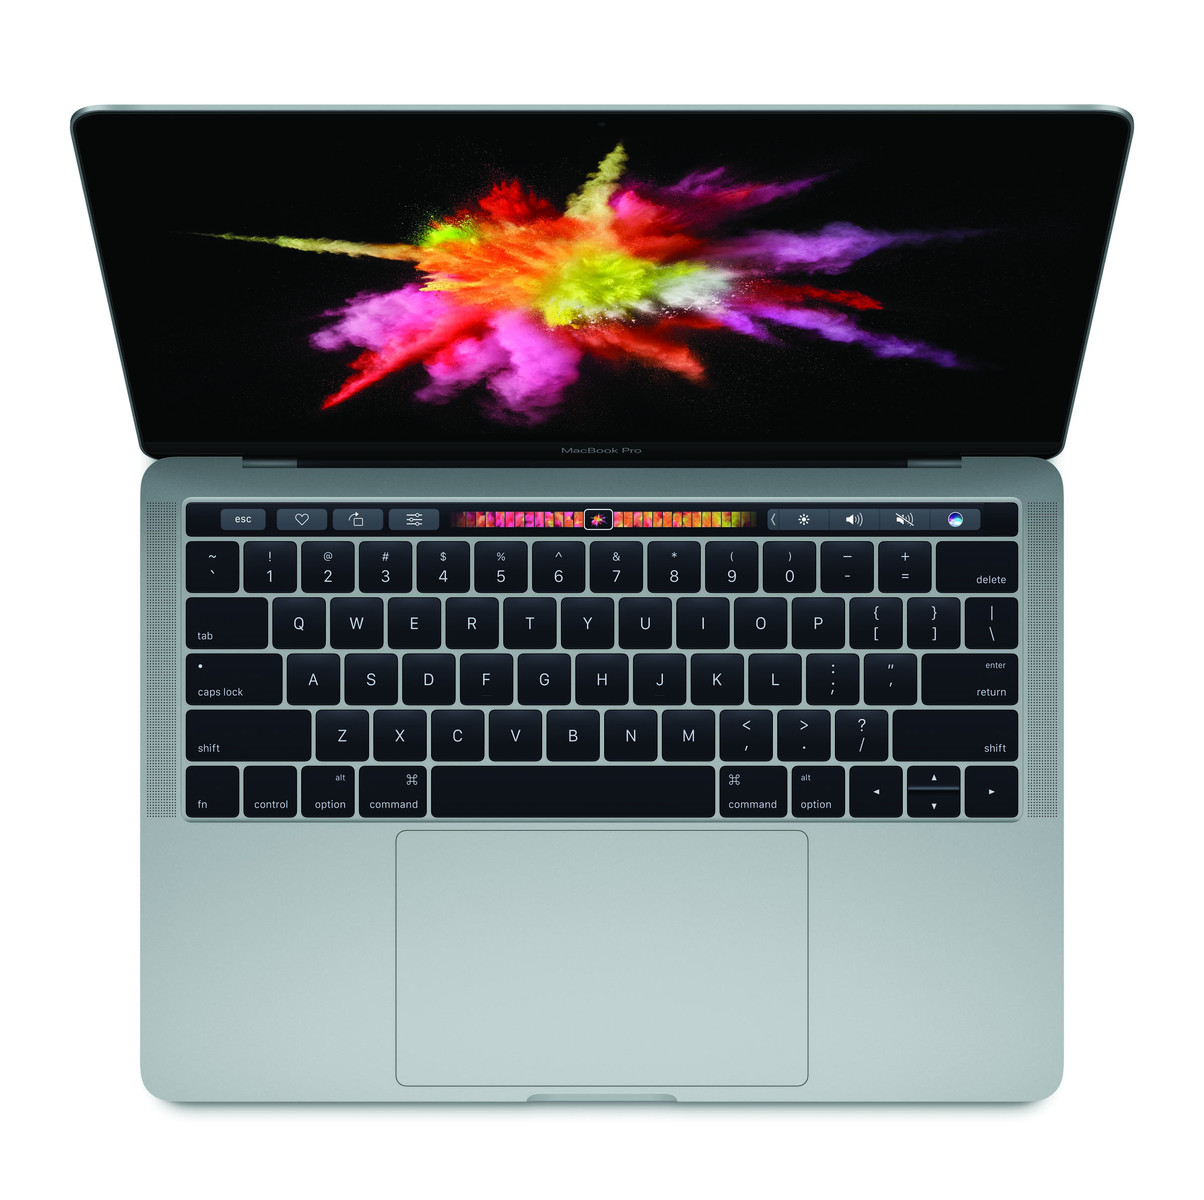
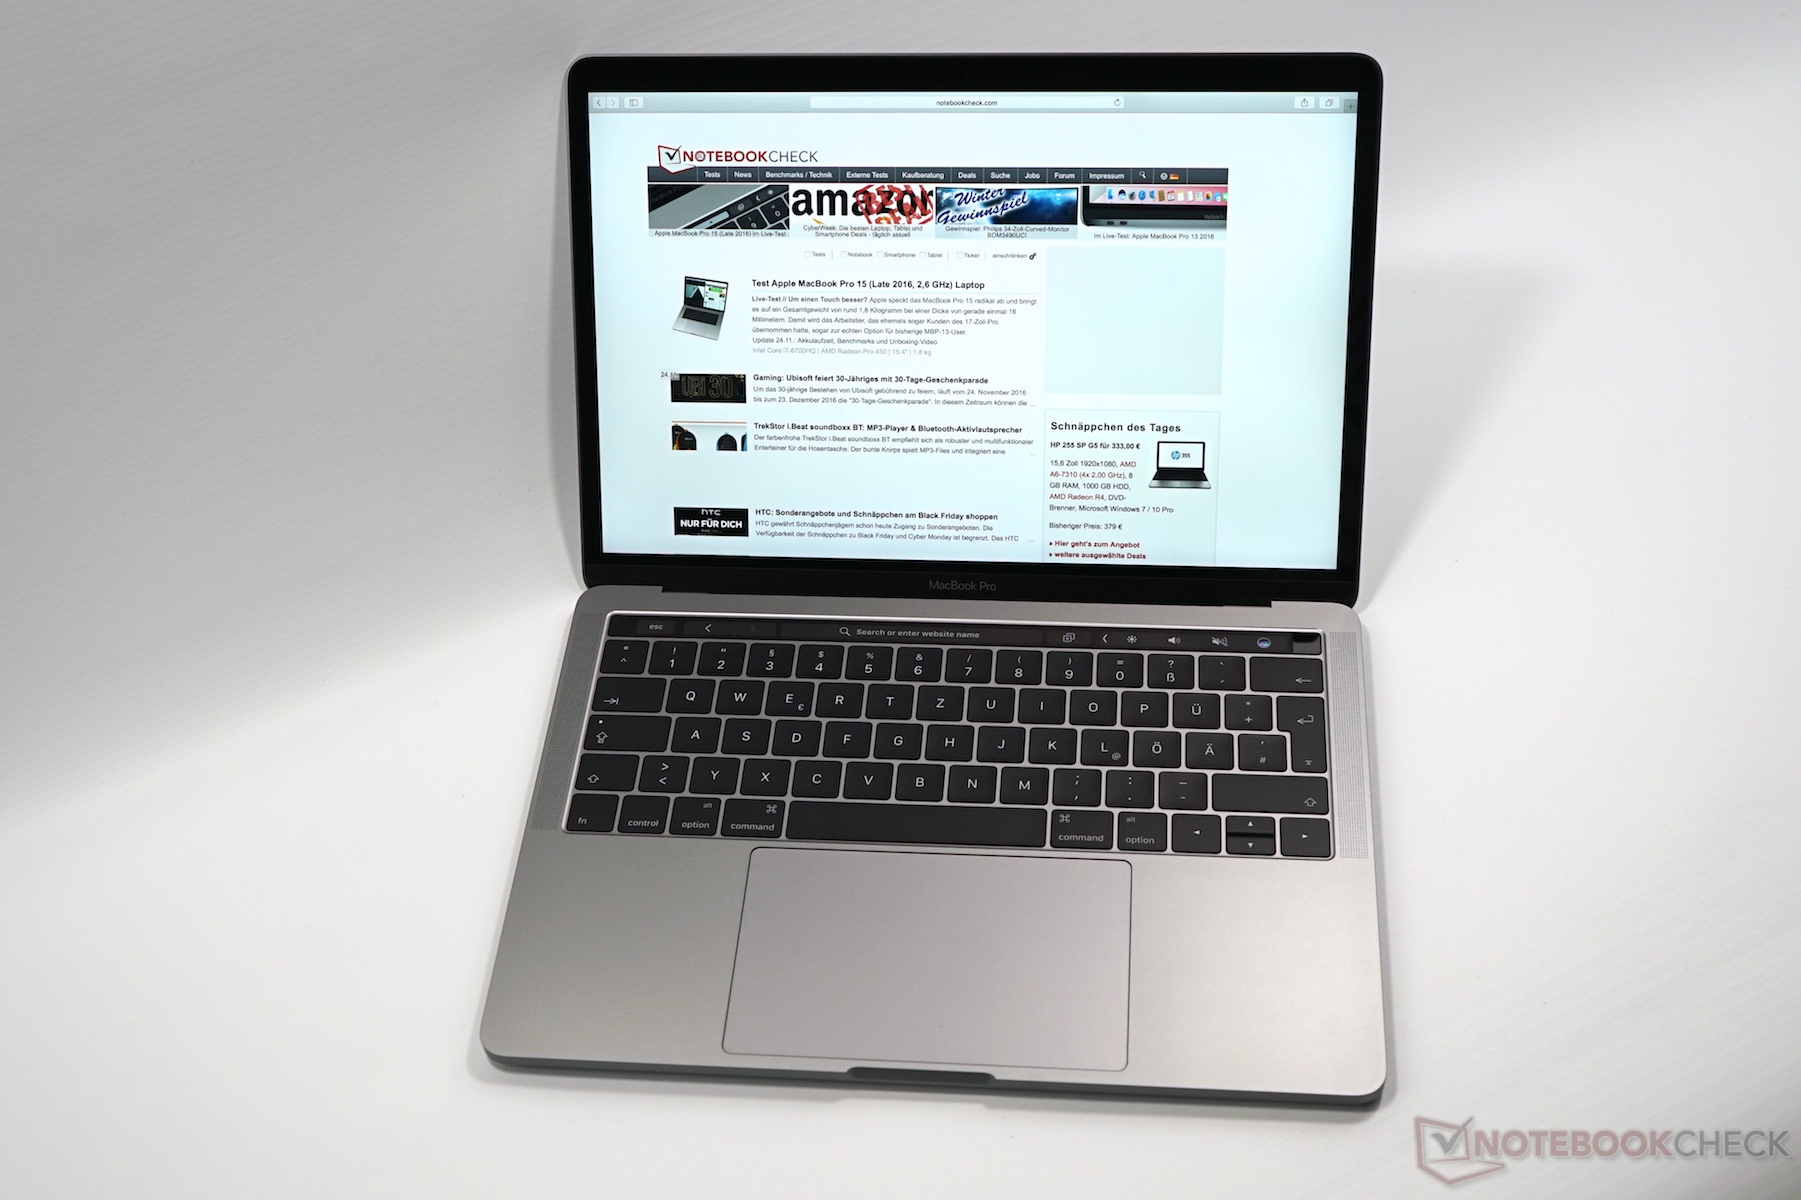
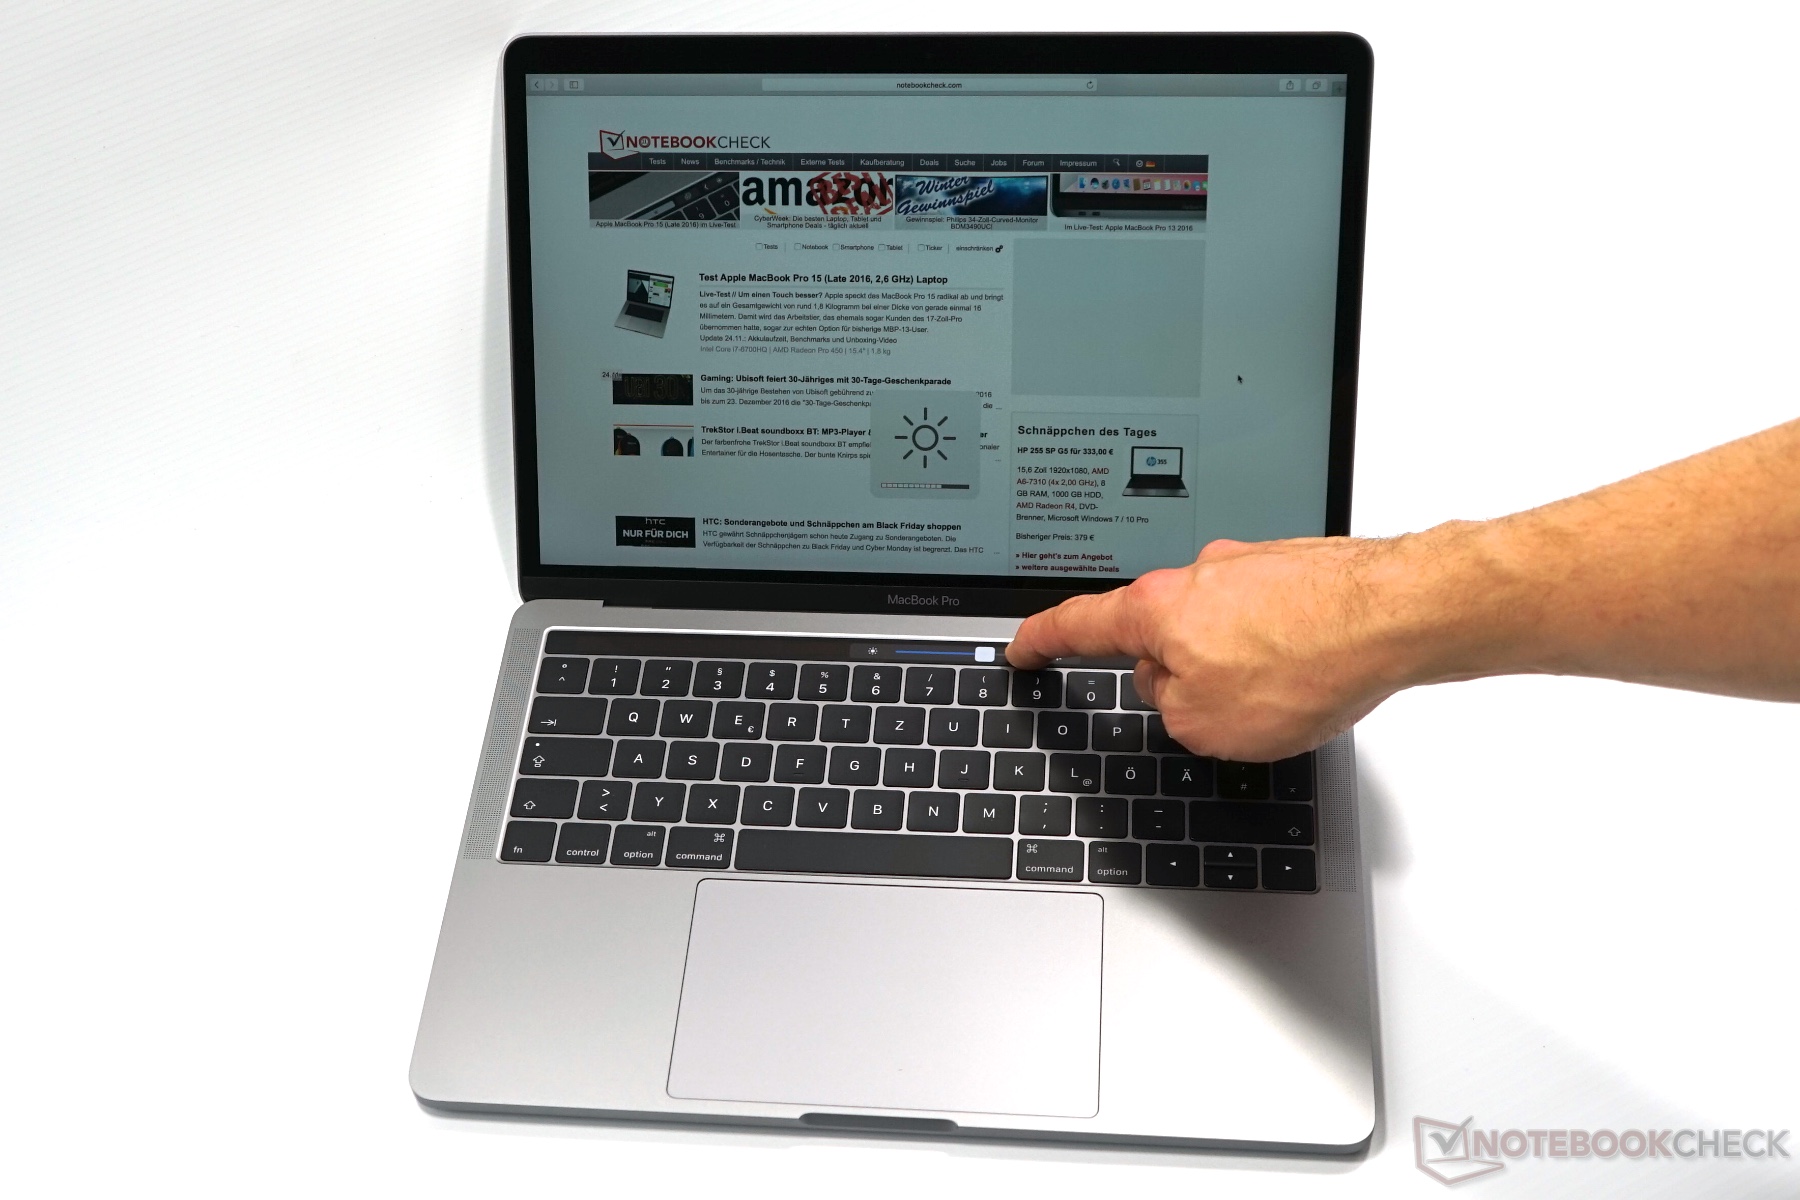
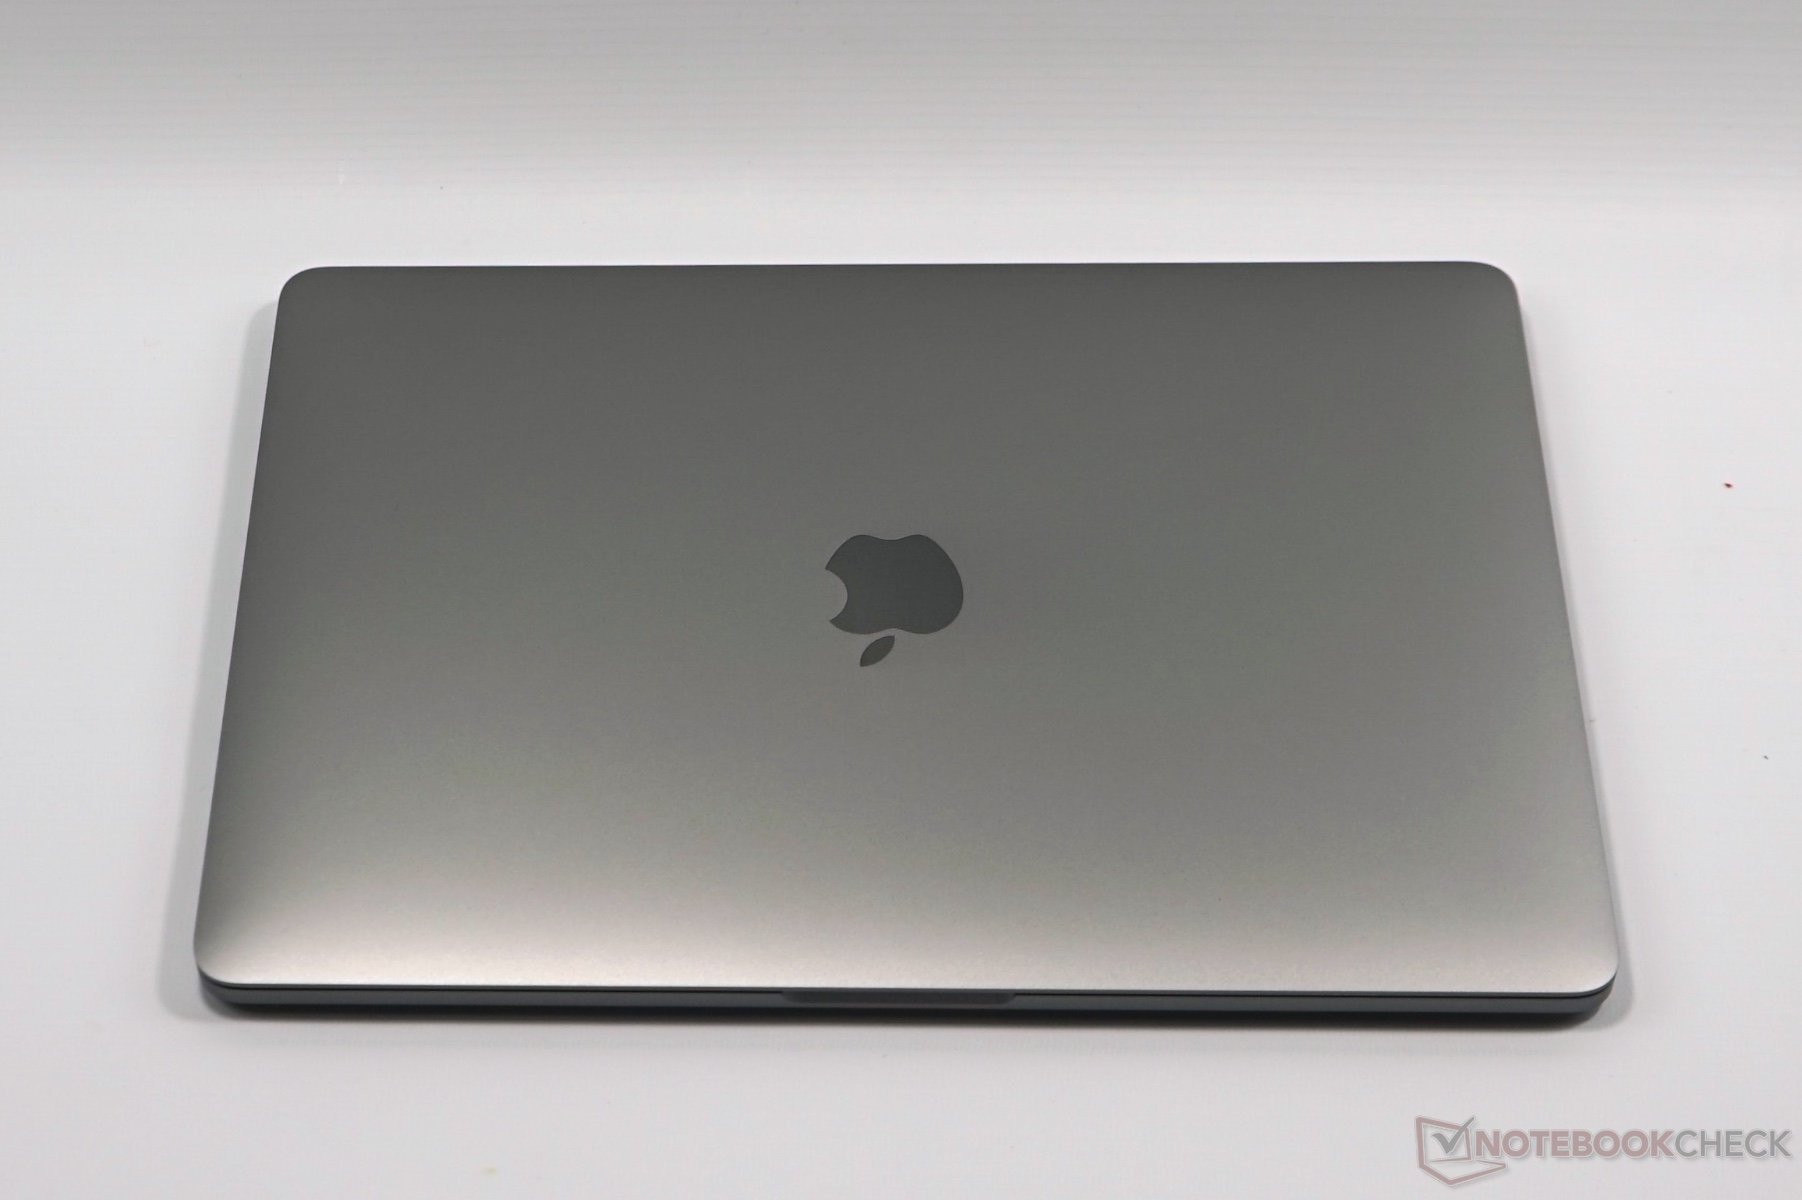
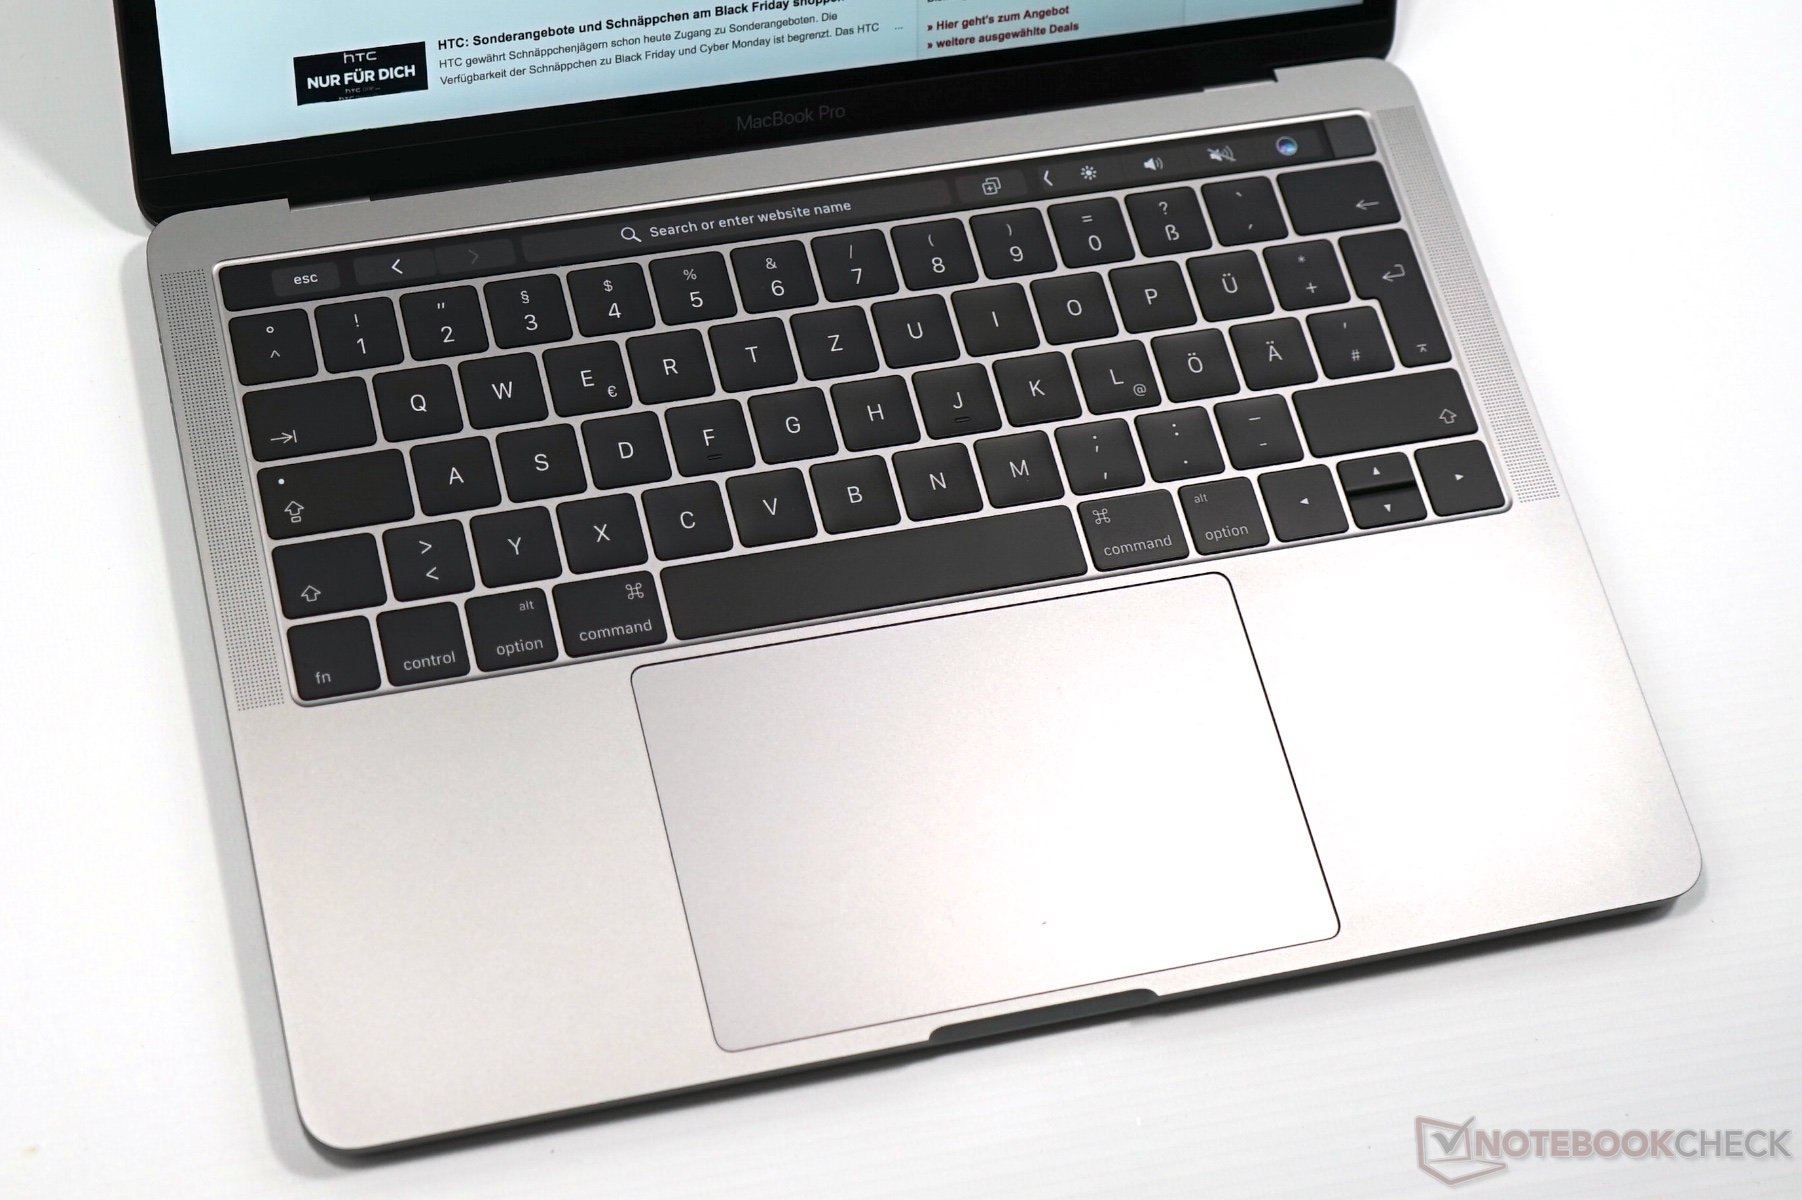
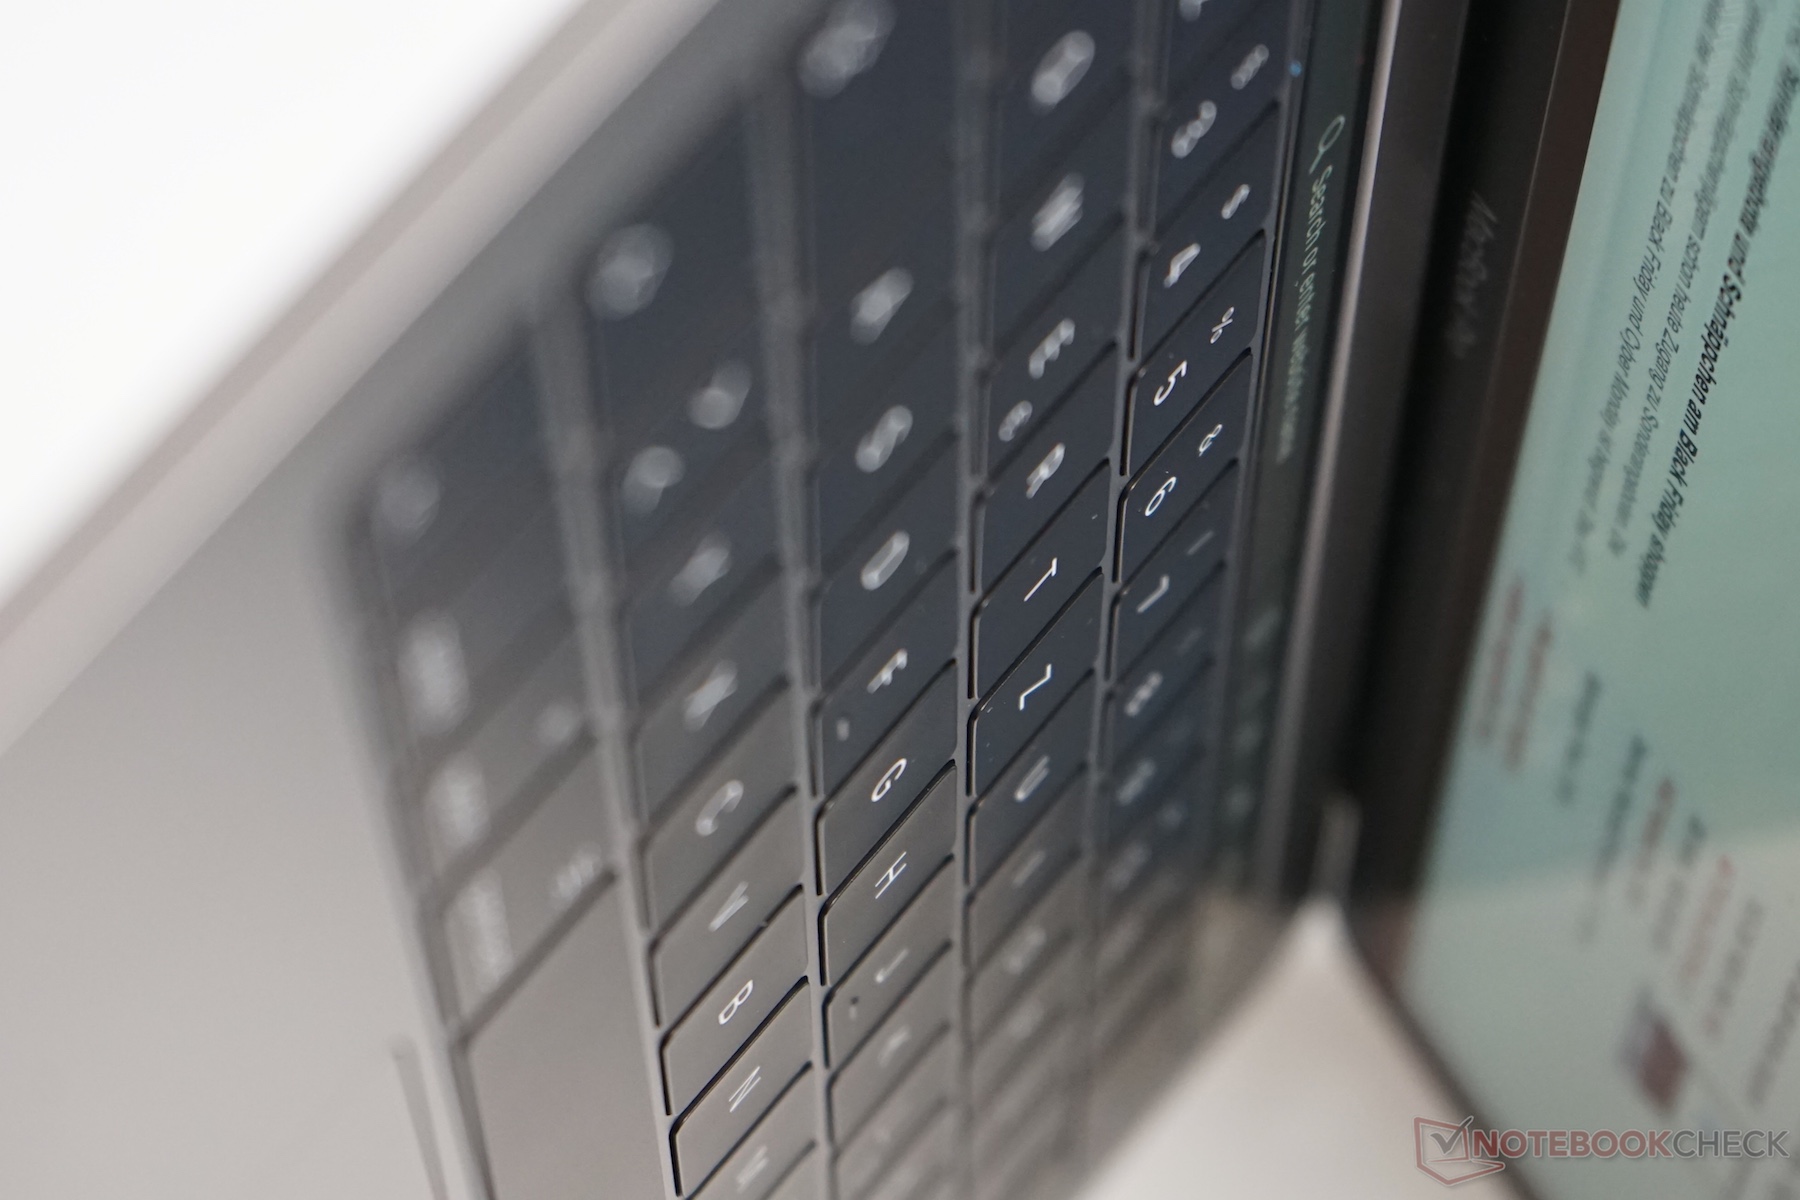
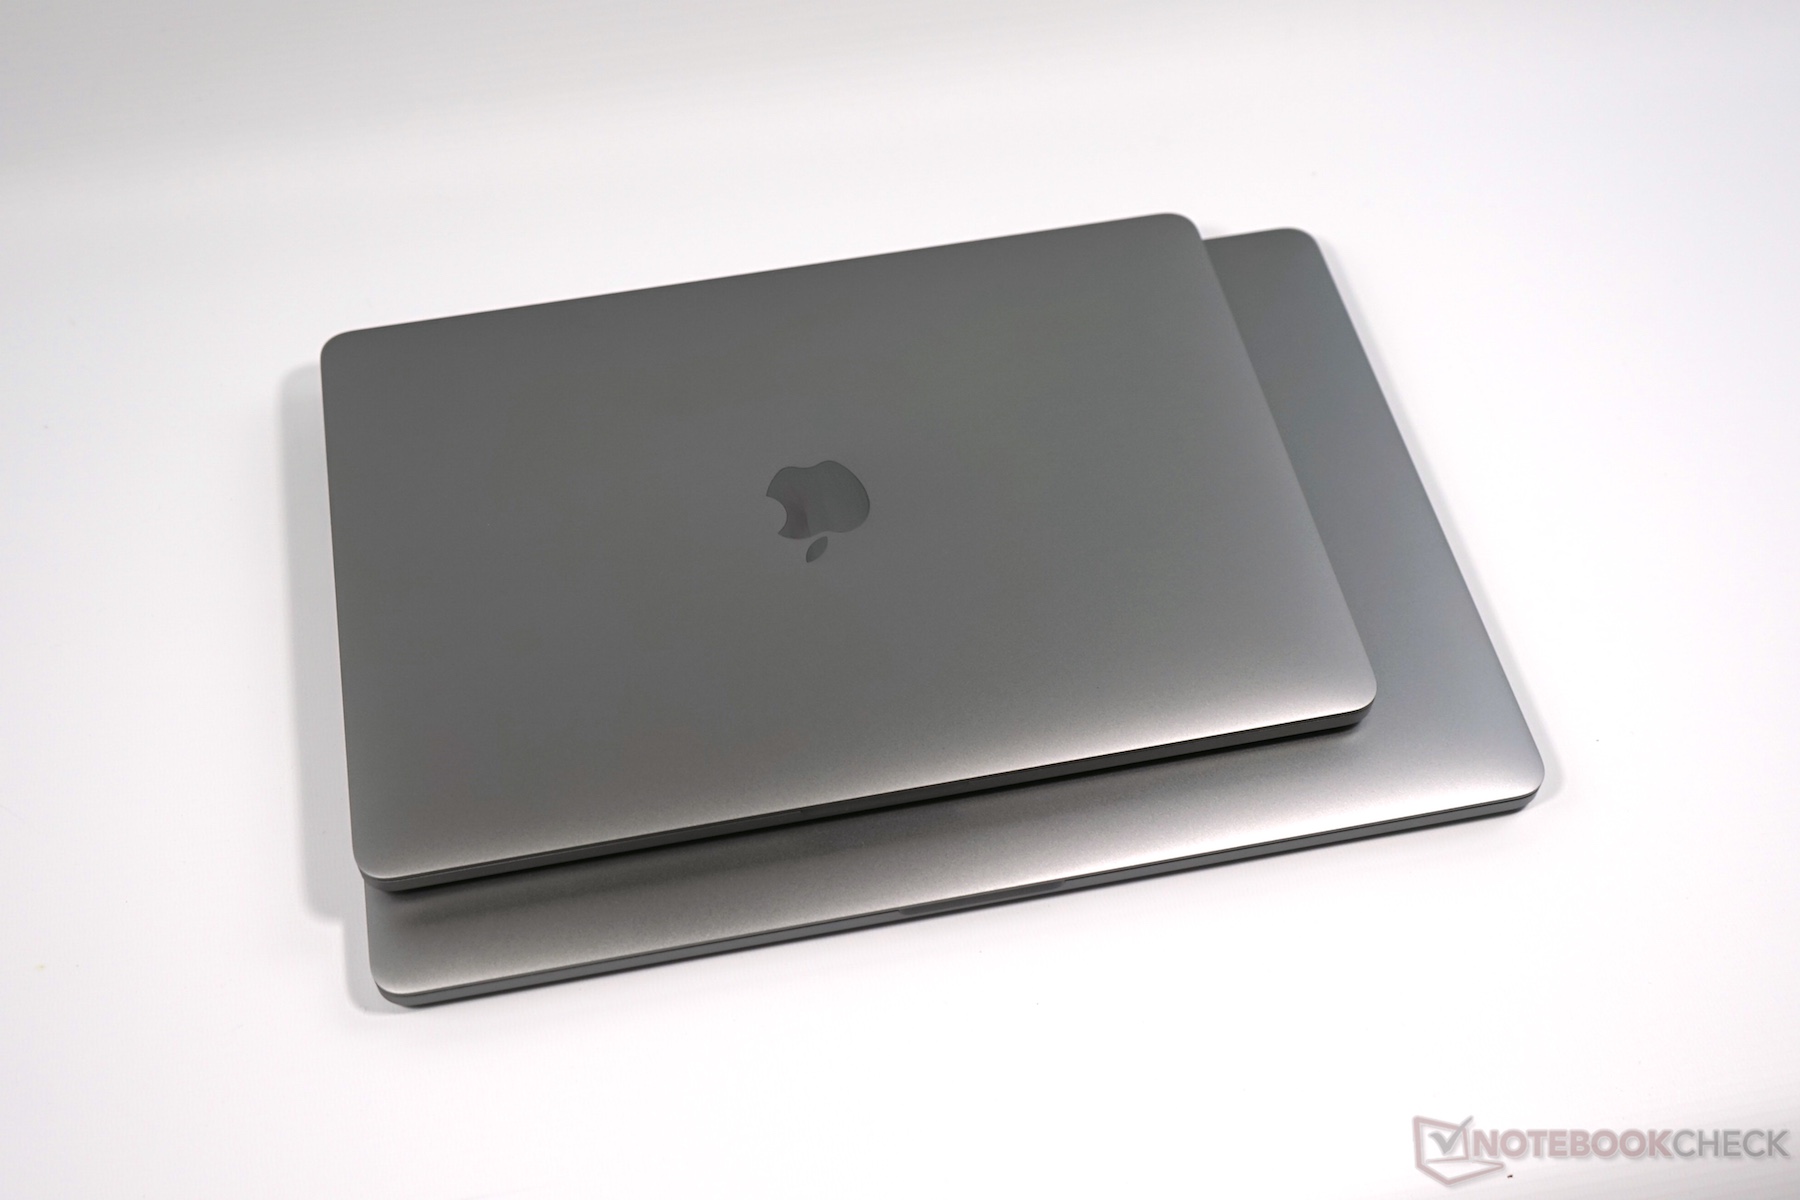
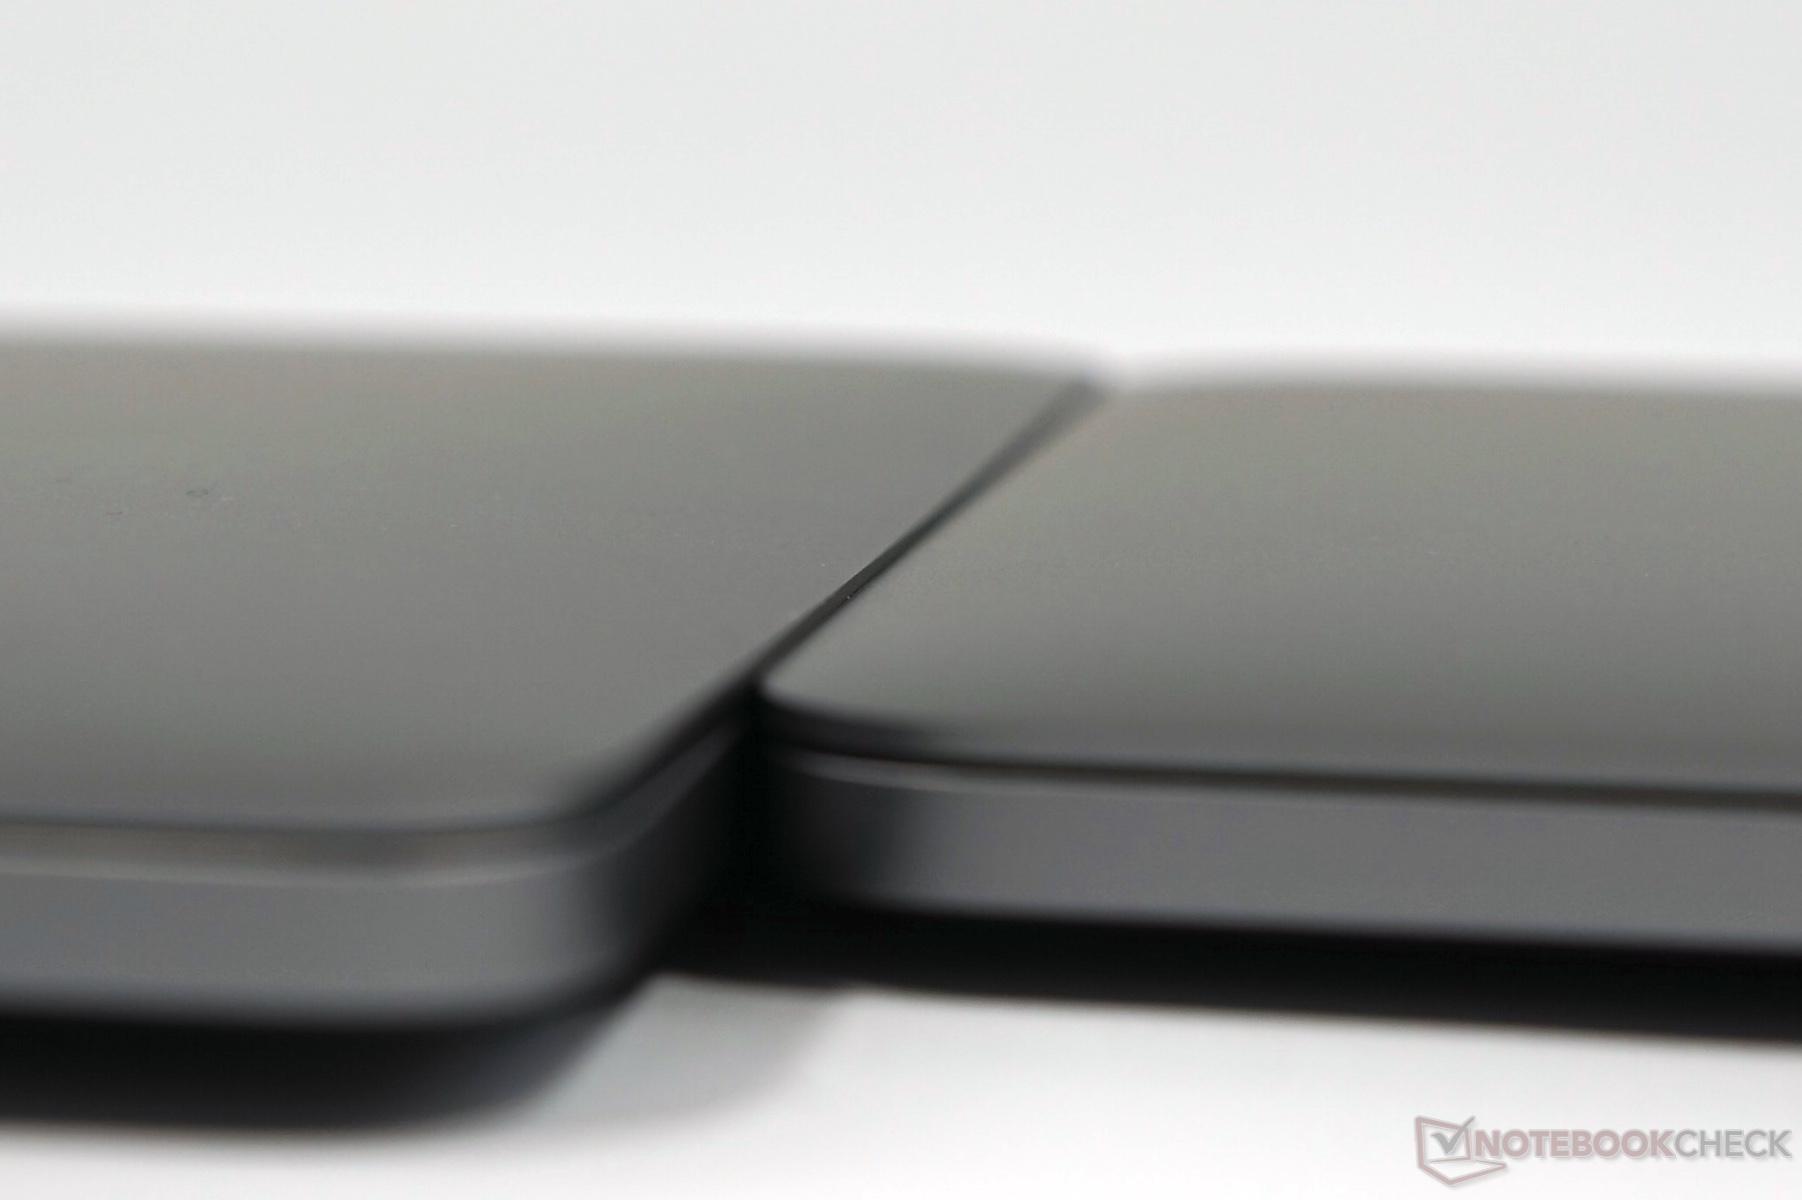
Os dois modelos do novo Apple MacBook Pro 13 são – como se espera – similares em muitos aspectos. Isto inclui o excelente chassi, que ainda é extremamente sólido, apesar da dieta. Você também recebe uma das melhores e mais brilhantes telas do mercado, independente do modelo. Este também é o caso para o trackpad, que agora é muito maior que antes. O teclado também é igual – exceto pelo Touch Bar. Por causa do curto deslocamento das teclas, a entrada precisa de algum tempo para se acostumar, mas convence com muita precisão na prática. A implementação do Touch Bar foi bem executada pela Apple, mas o sucesso dependerá do suporte para o software na prática. Por enquanto, é mais como um "gimmick" em nossa opinião, e pode tornar as coisas um pouco mais complicadas quando quiser utilizar as teclas de função normais, ou funções especiais, como o controle do brilho, por exemplo. Um novo recurso útil é o sensor Touch ID no botão de energia.
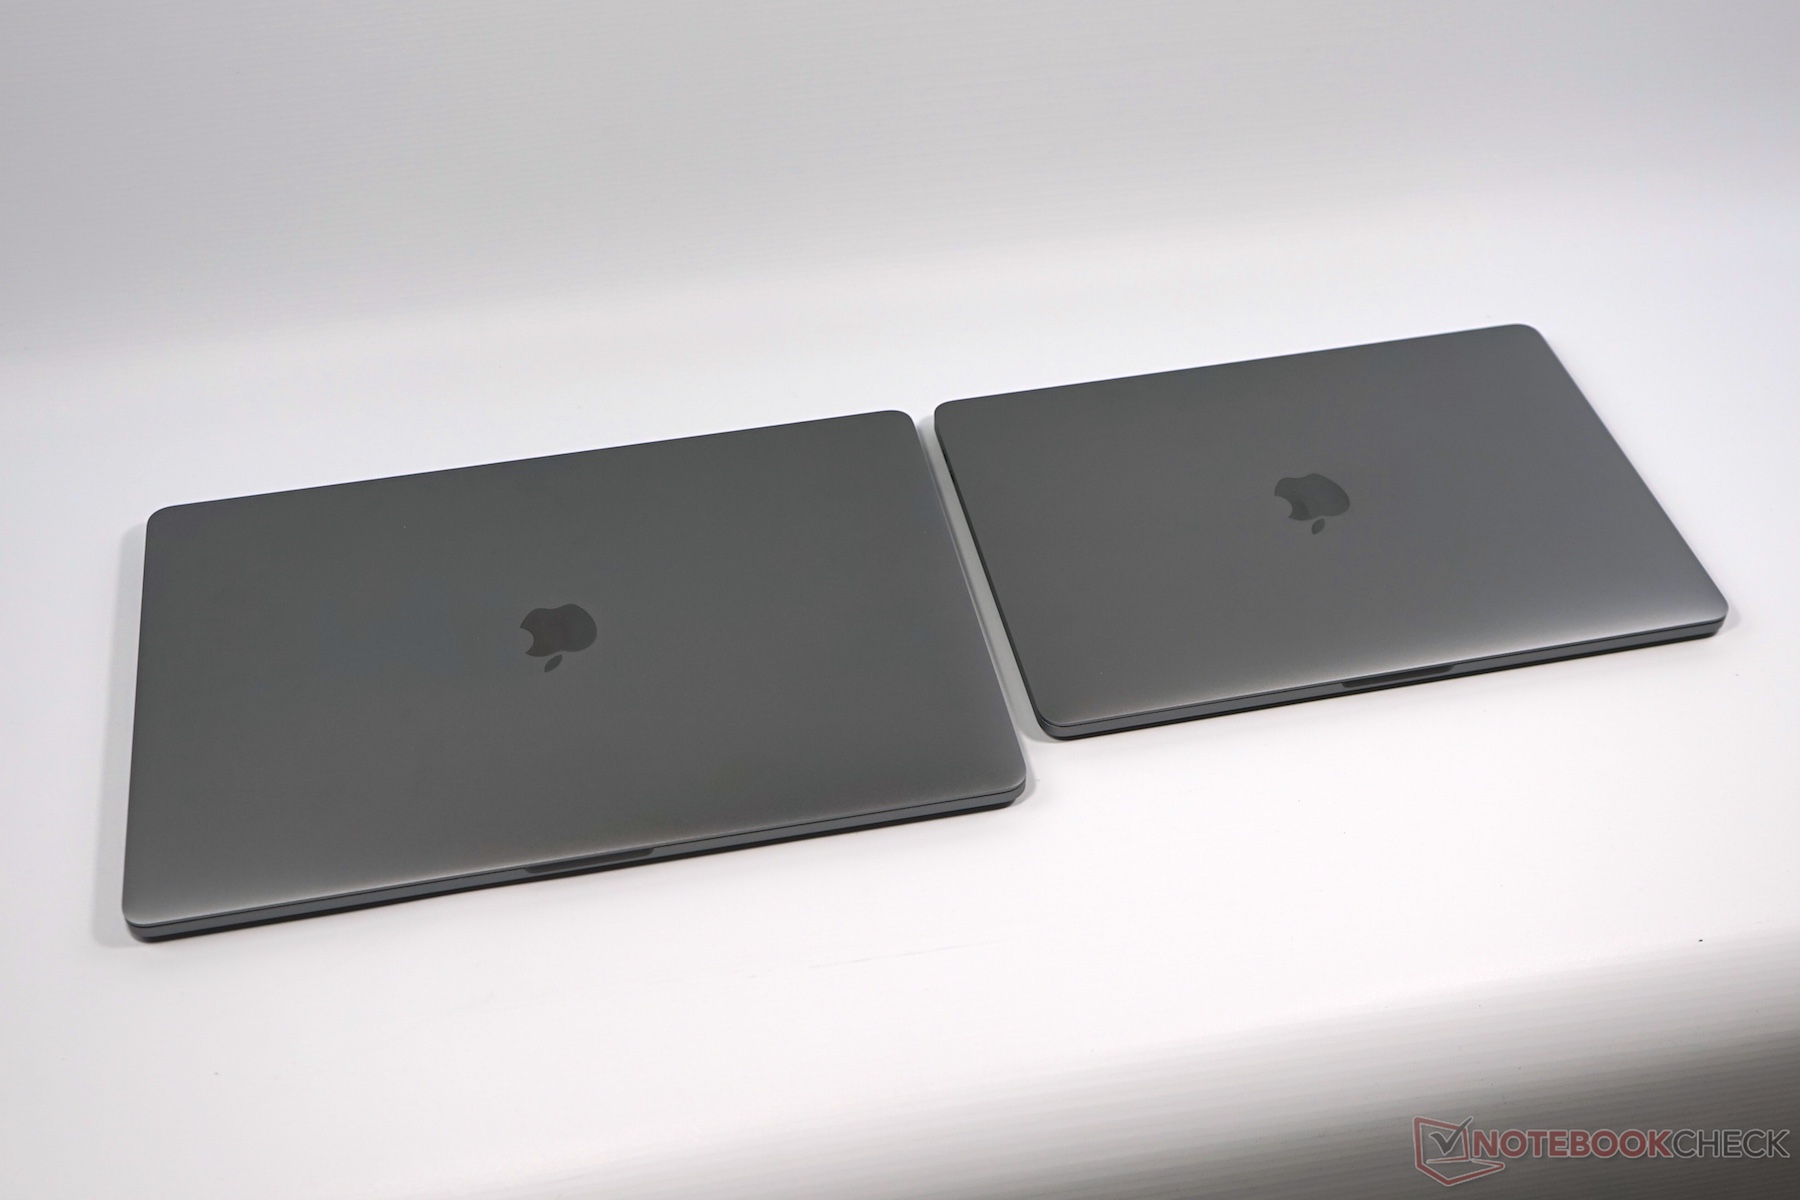
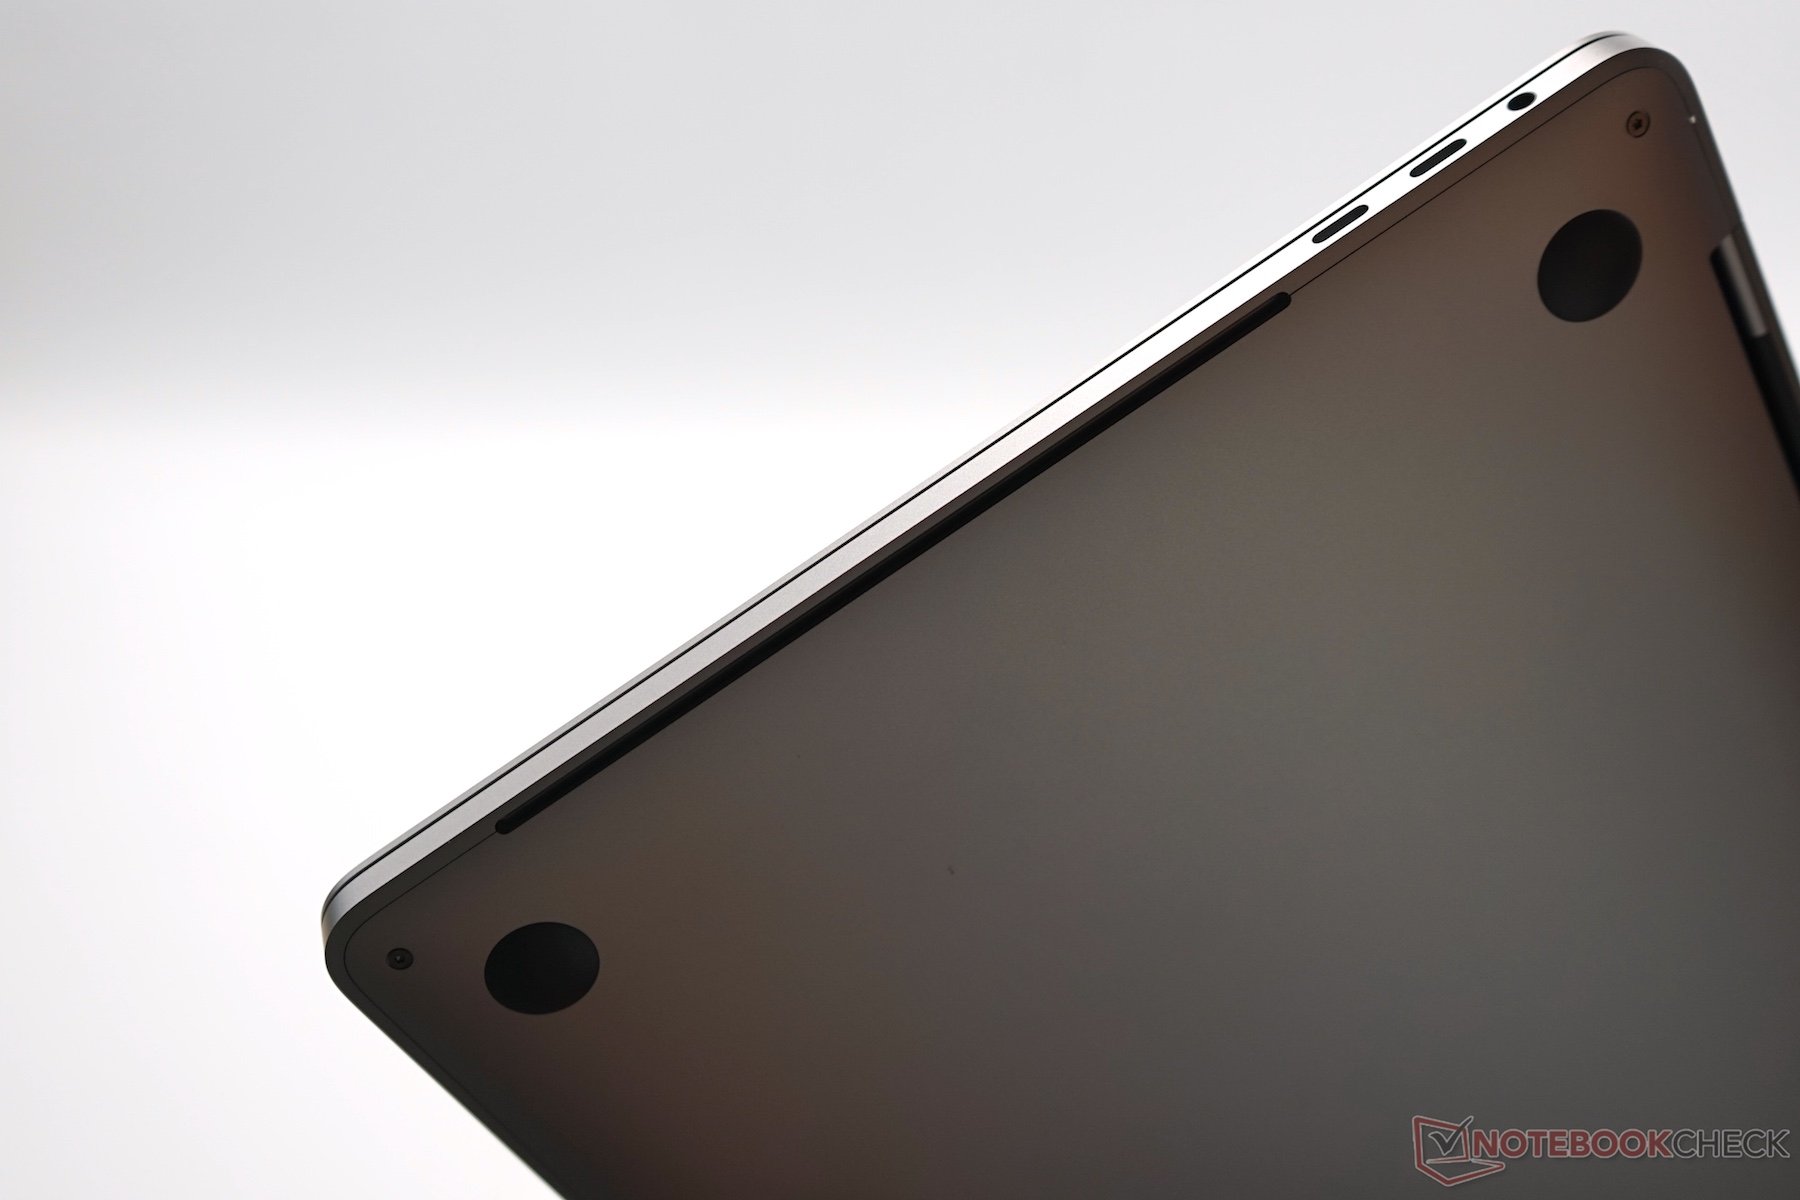
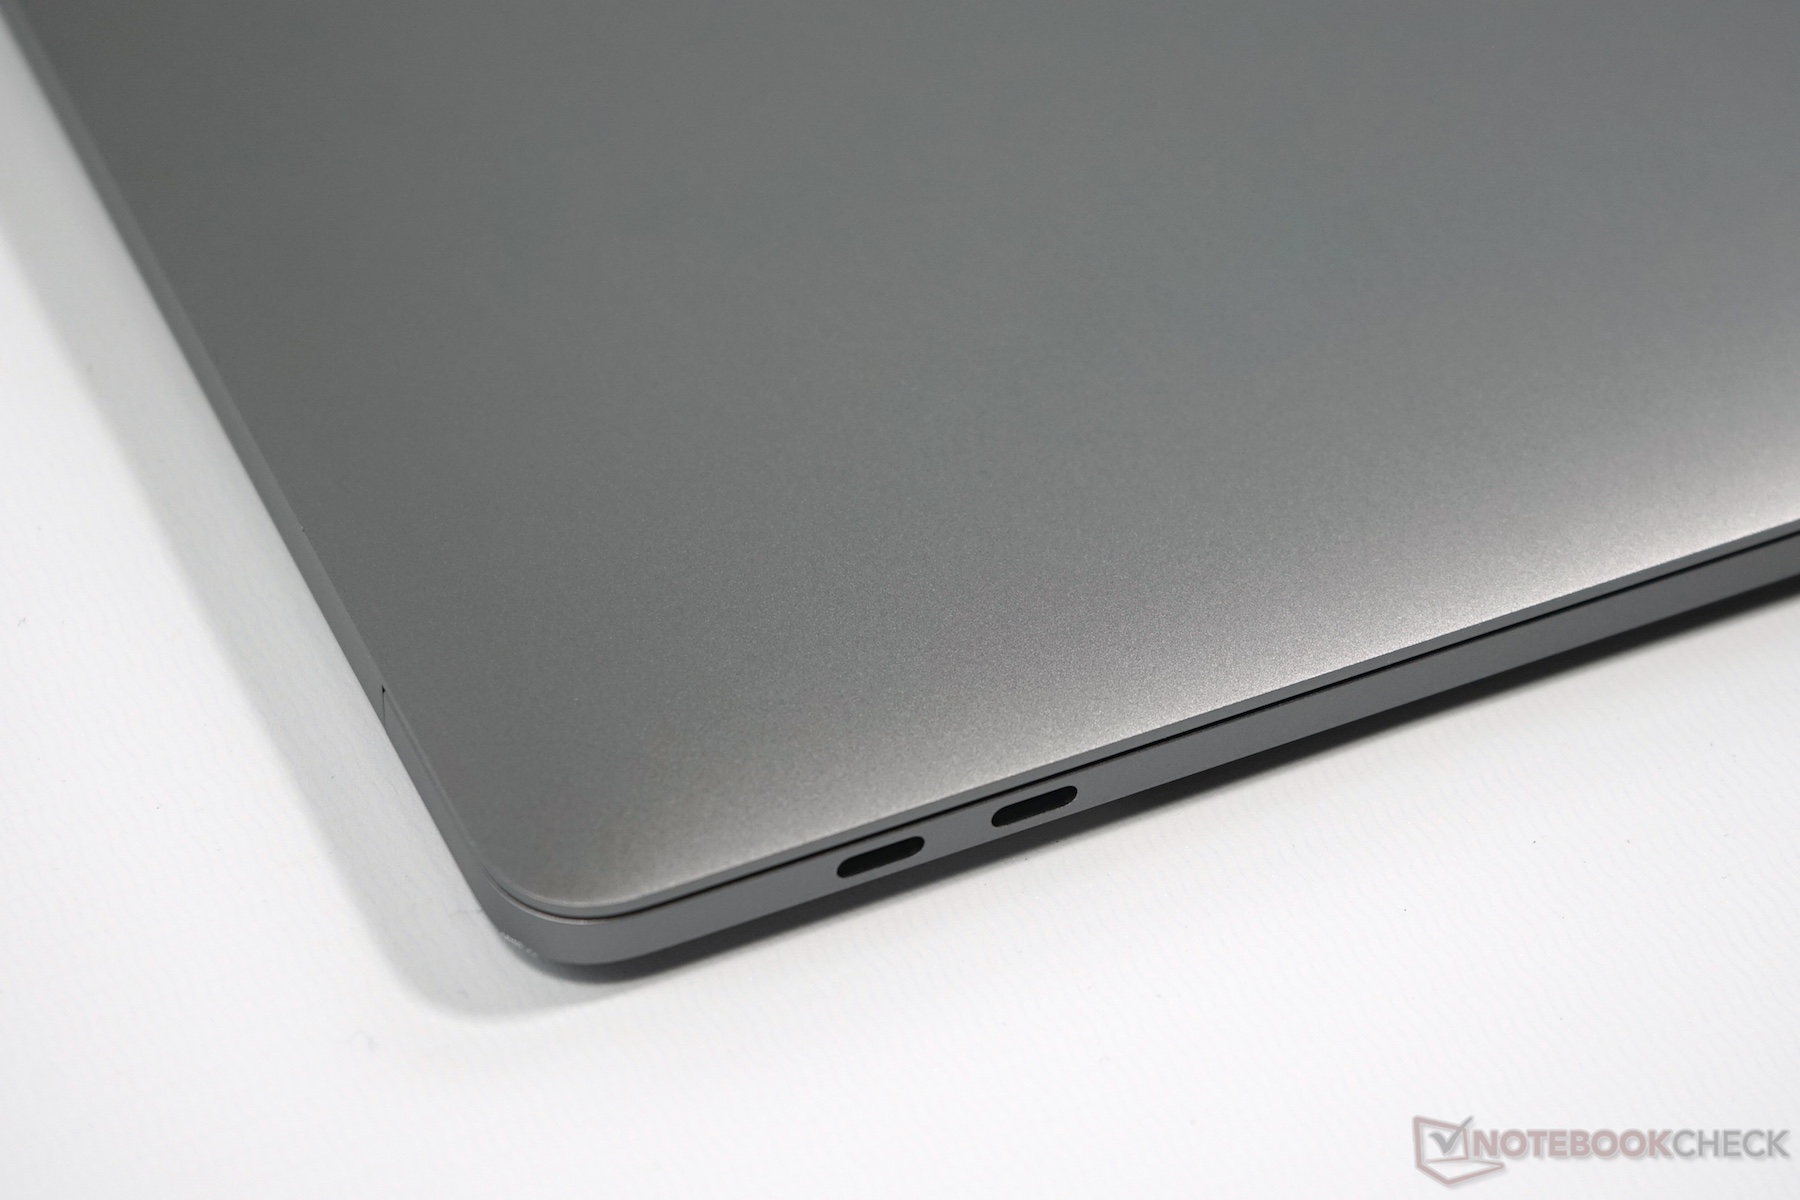
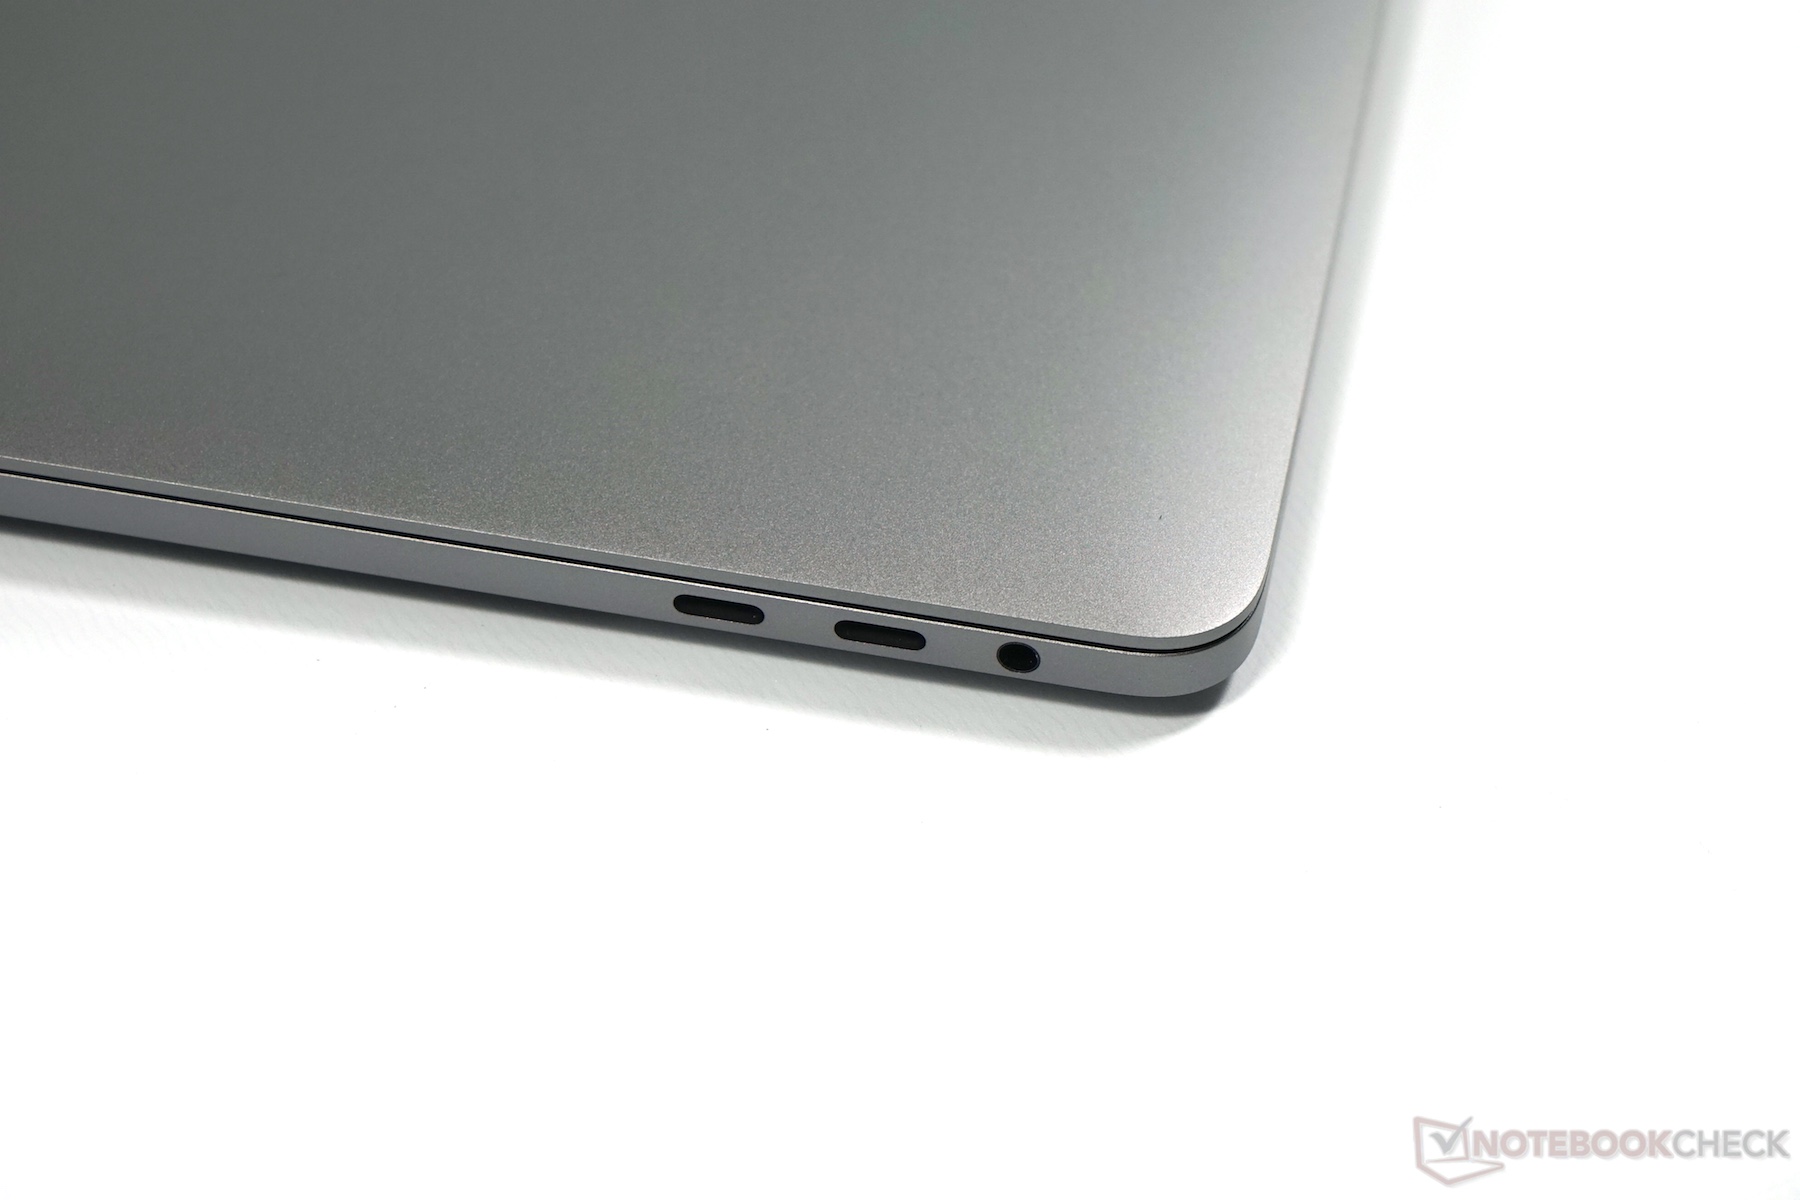
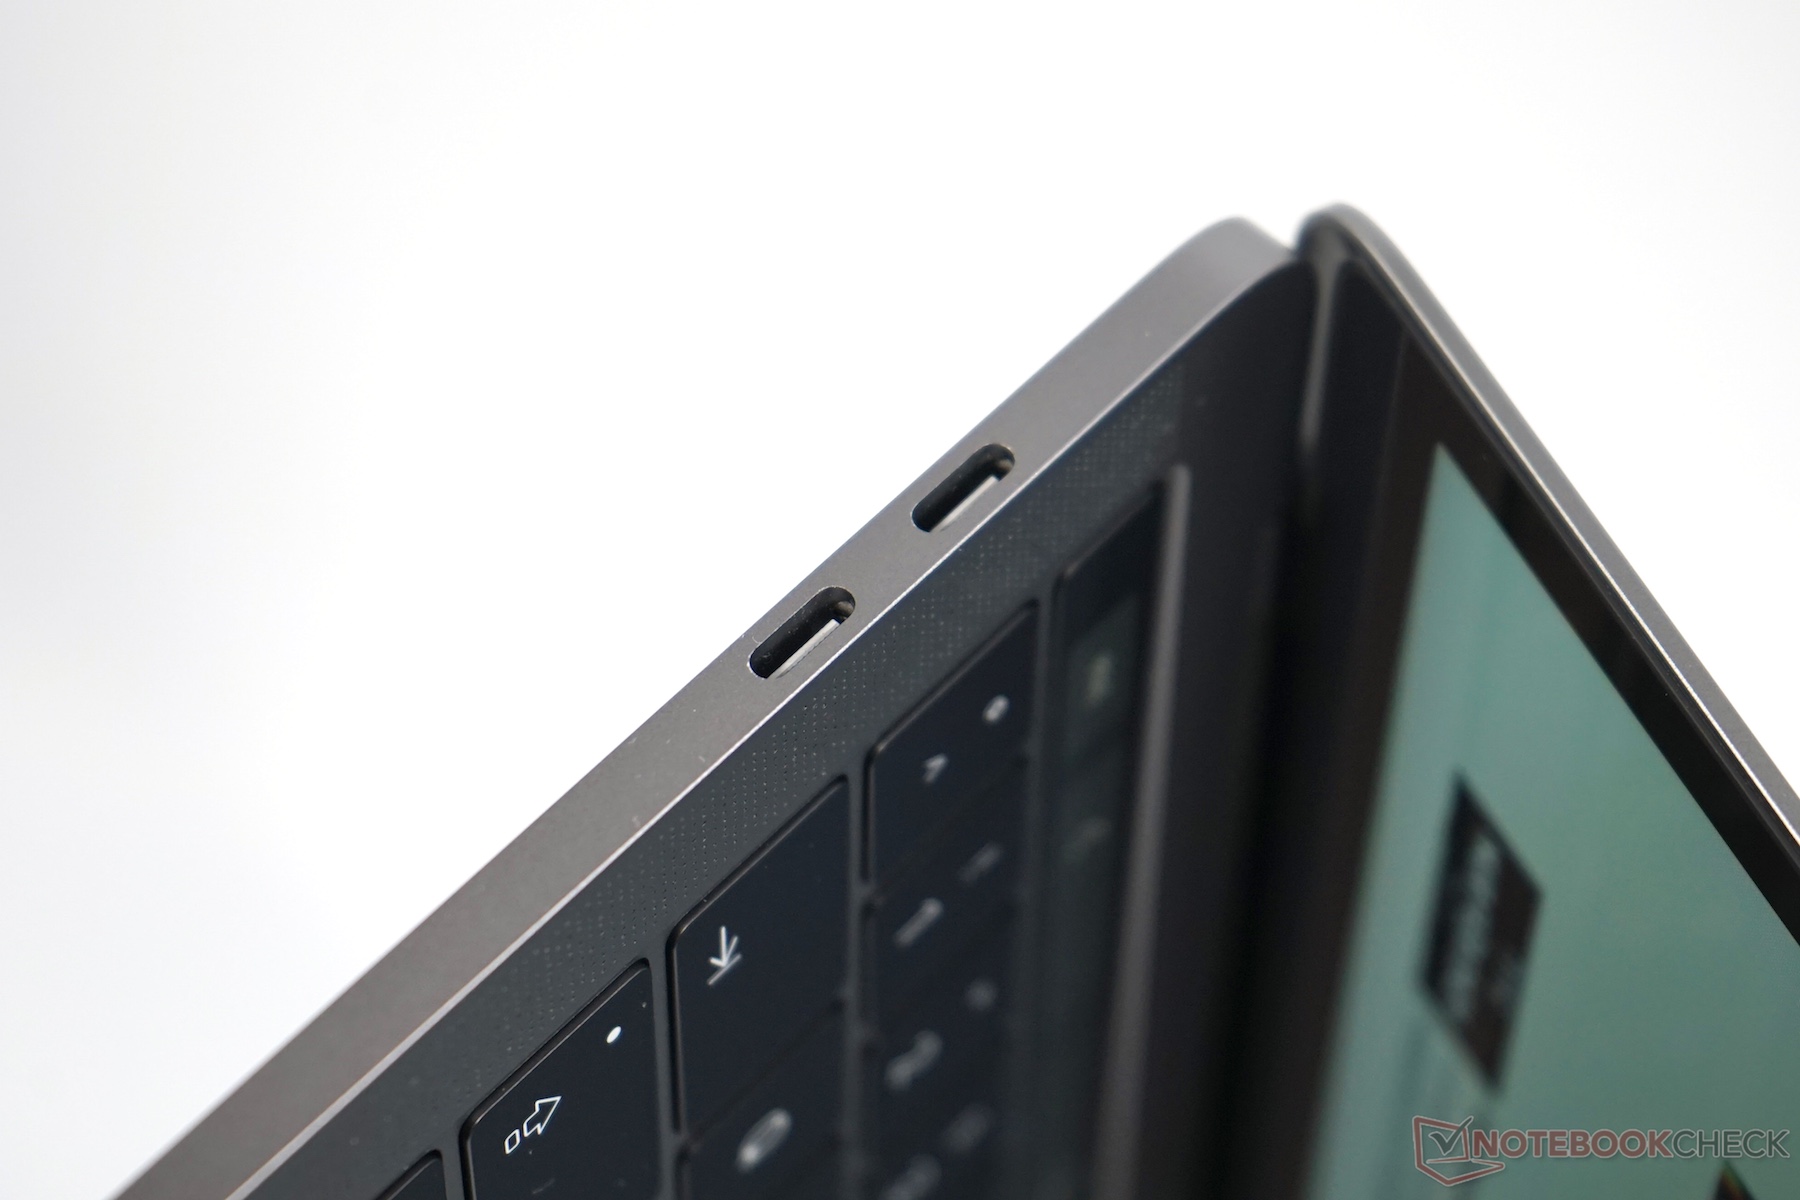
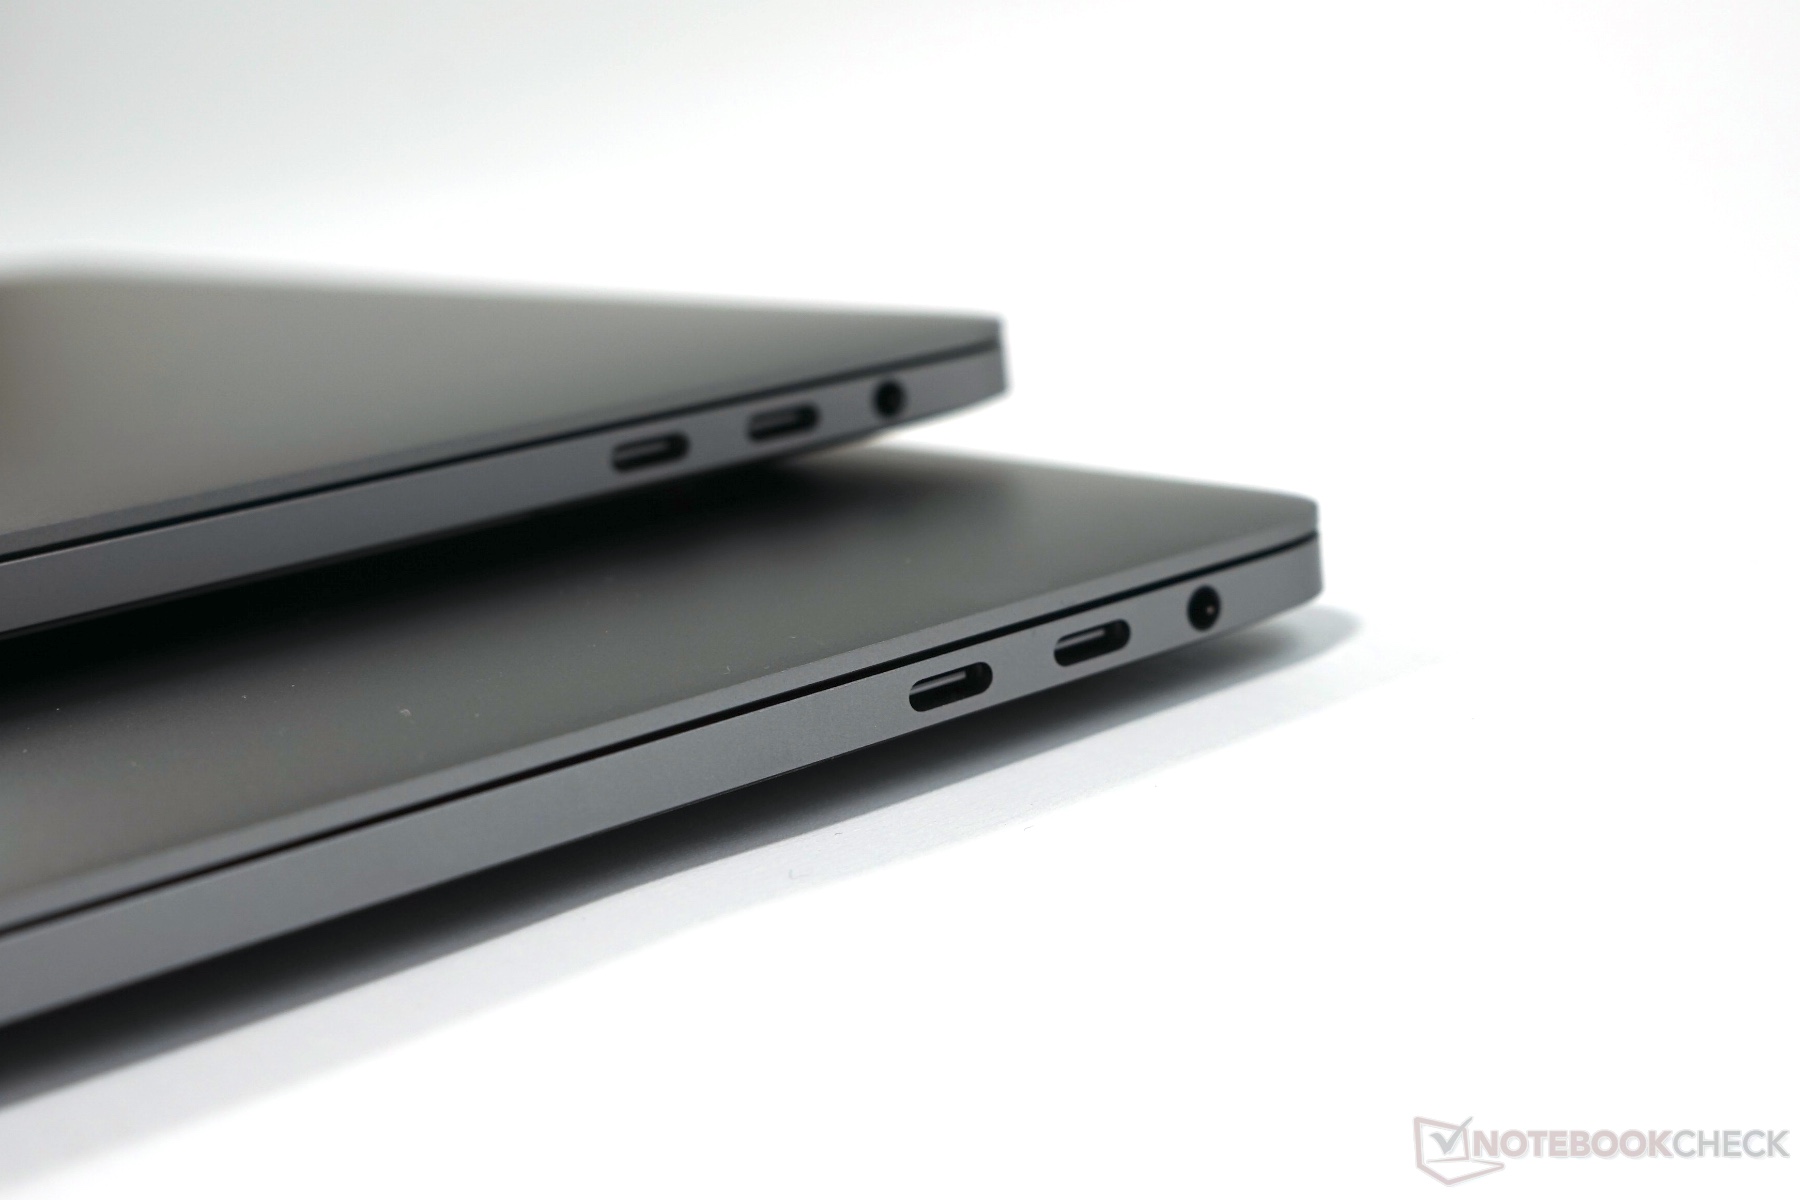
A Apple basicamente define o modelo mais caro pelo Touch Bar. Se você procurar dentro do chassi, no entanto, encontrará um sistema completamente diferente. A solução de resfriamento foi ajustada para os componentes mais poderosos (TDP de 28 vs. 15-Watt TDP) e gostamos muito disso, os componentes foram movidos e a capacidade da bateria é um pouco menor. Isto também afeta às durações da bateria, especialmente sob uso intenso, onde você terá que carregar o aparelho depois de pouco mais de uma hora. O mais caro MBP 13 também é derrotado pelo modelo sem Touch Bar nos testes práticos, mas as durações determinadas ainda são boas. Uma implementação parcial das duas portas Thunderbolt 3 adicionais. Contrário ao maior MacBook Pro 15, você não pode usar toda sua largura de banda, portanto, poderia ter sido melhor implementar outras portas.
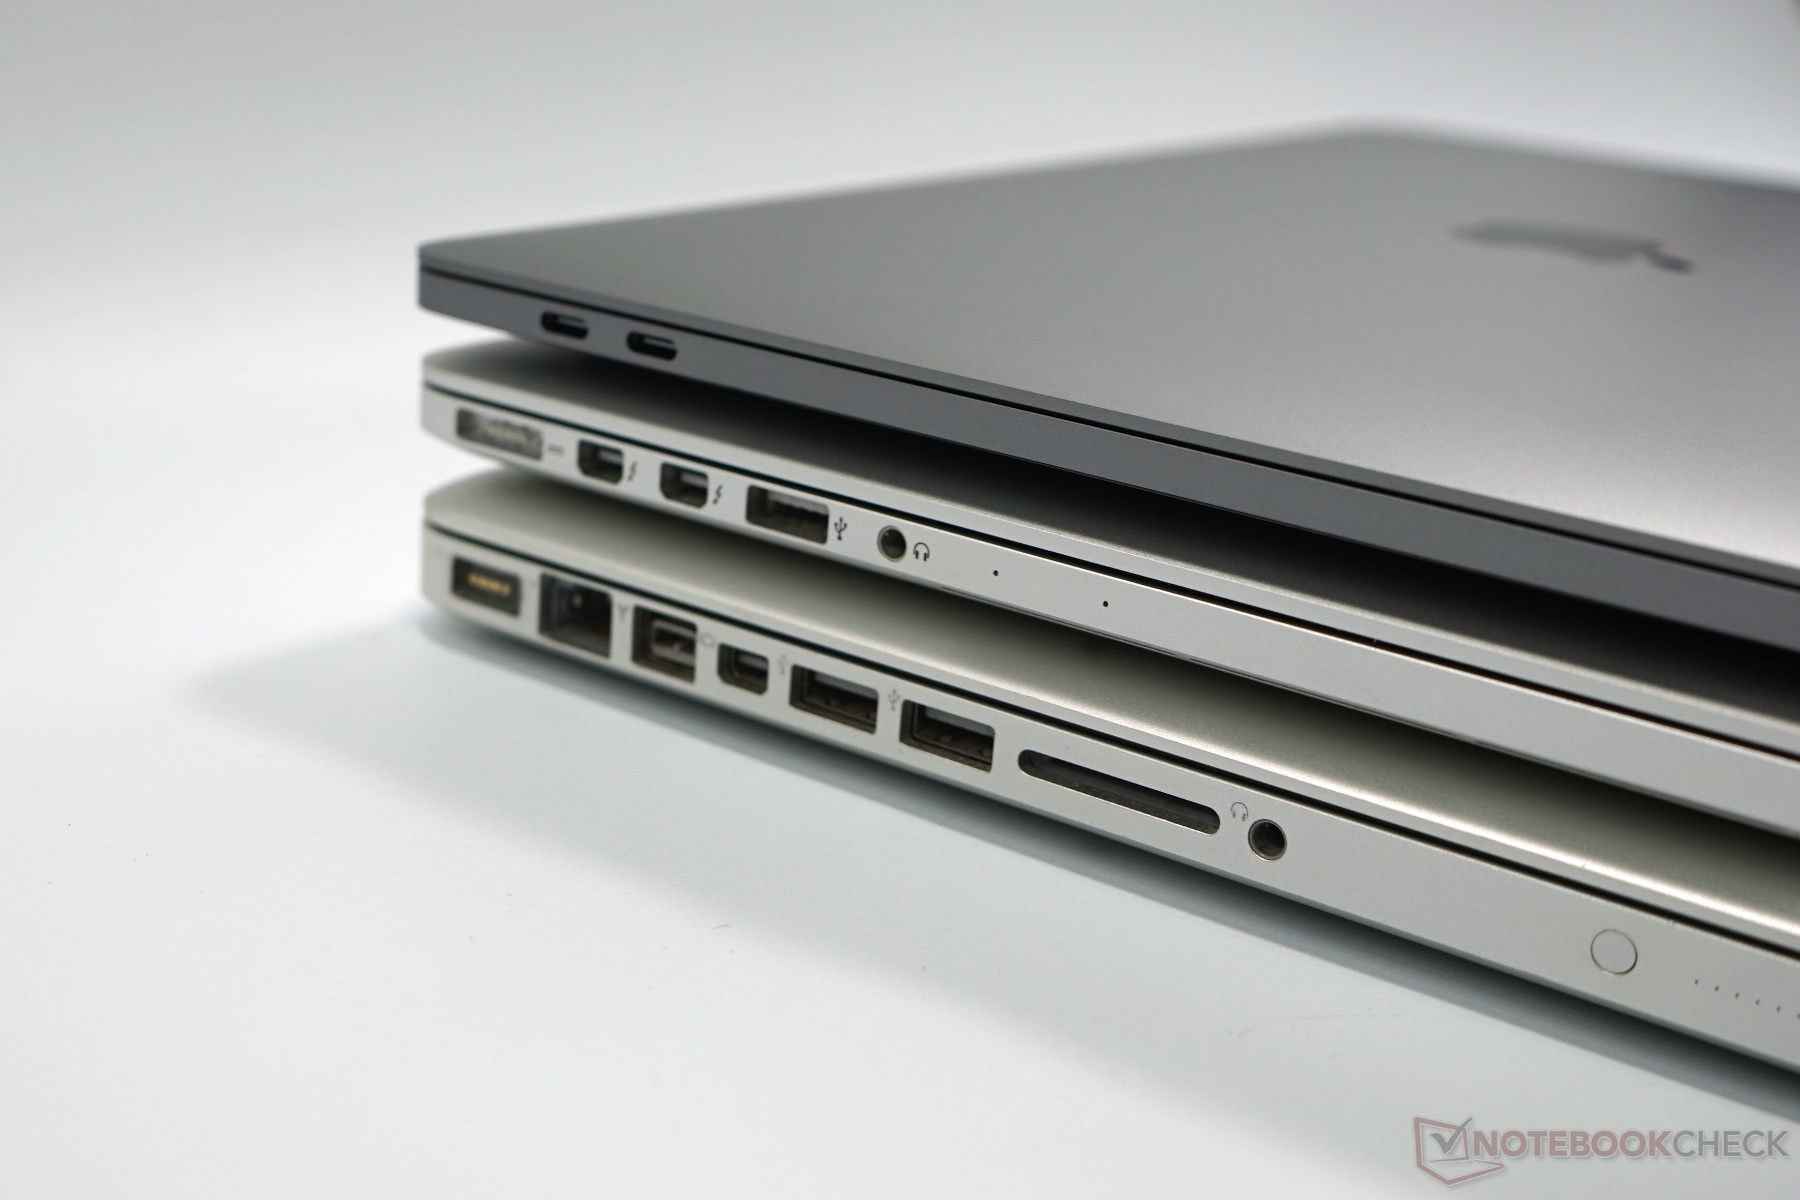
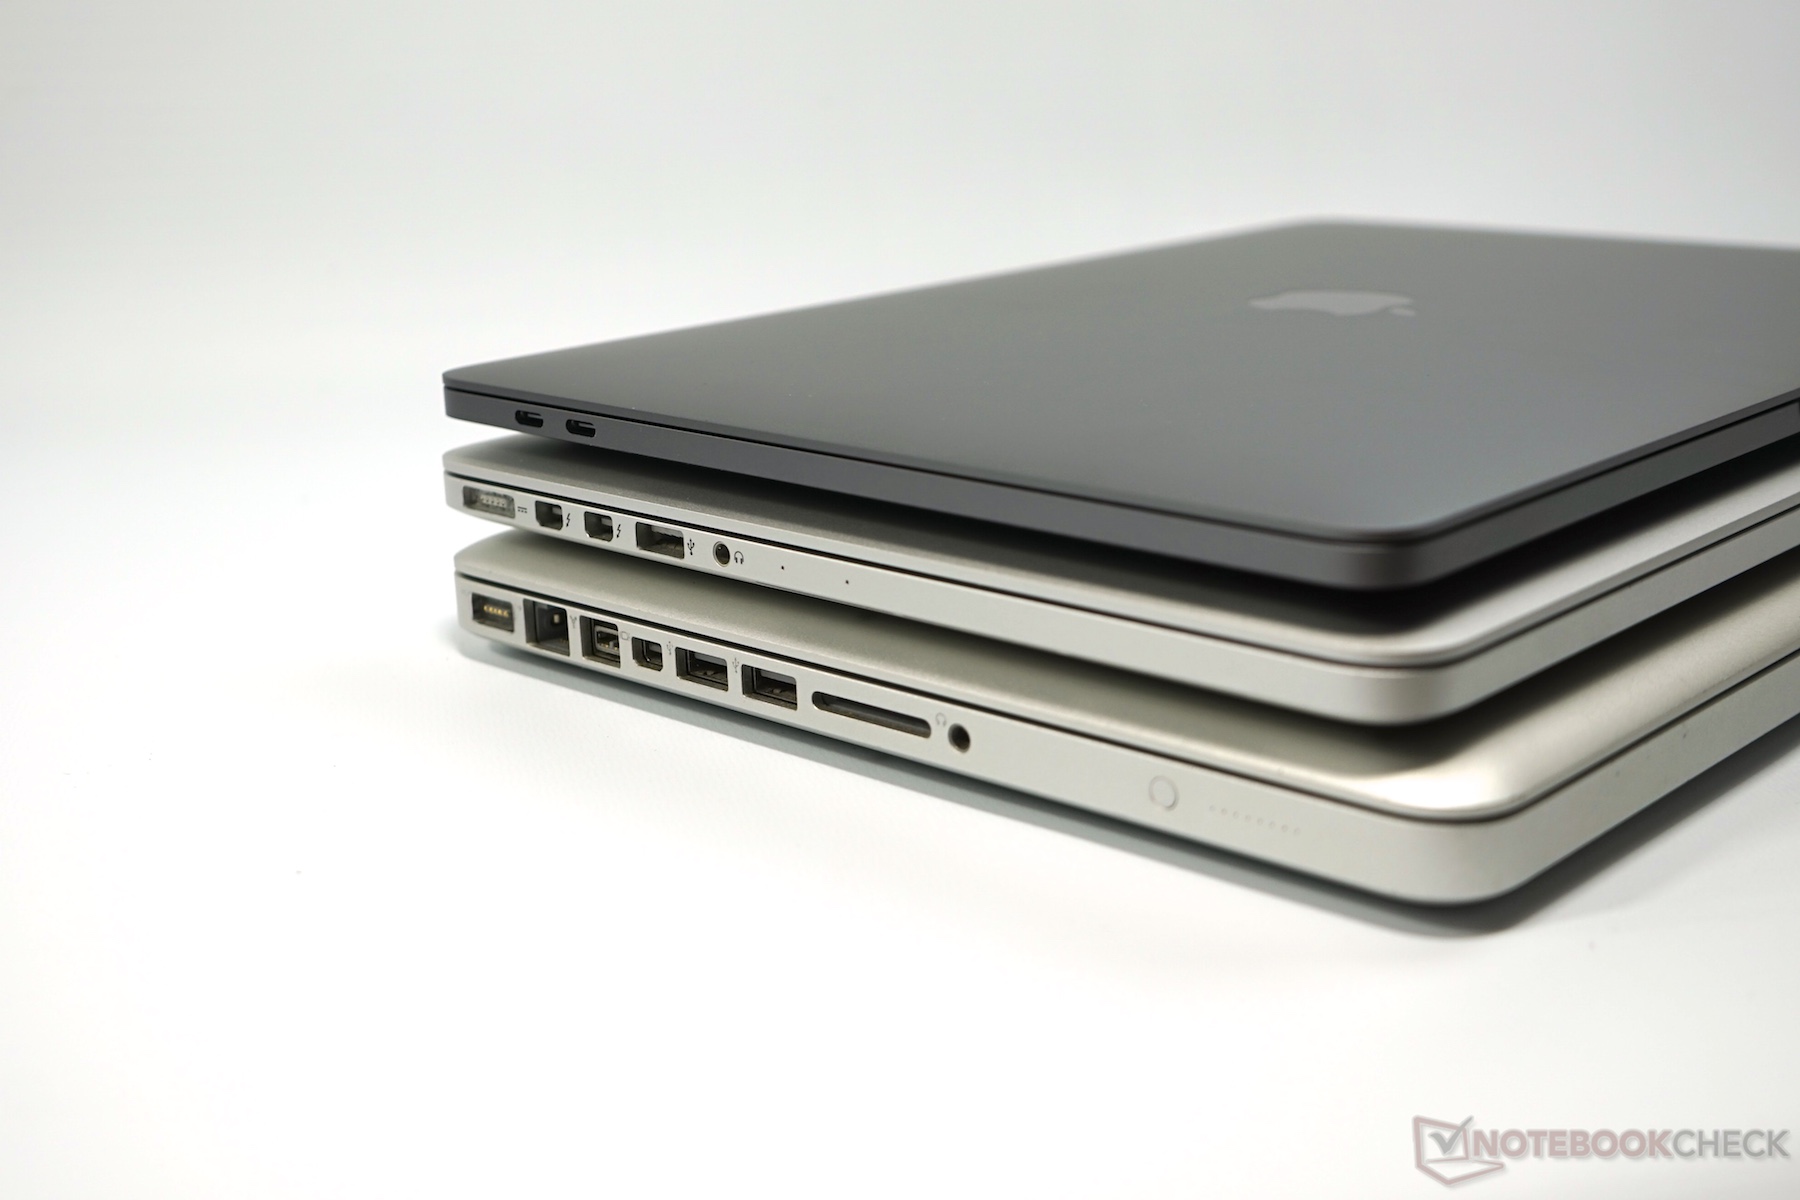
Isto nos traz os problemas. É quase impossível usar o novo MacBook Pro 13 sem adaptadores na prática. Quatro portas muito universais fazem com que o sistema seja bastante preparado para o futuro, porém, dois teriam sido suficientes, em nossa opinião. A falta do leitor de cartões SD também seria algo inadmissível para os fotógrafos, em particular. Depois está o problema do Wi-Fi de 2,4 GHz, porque pode haver problemas de conexão quando um aparelho com USB-C seja conectado. É questionável se haverá uma solução de software Similar ao irmão, portanto, deduzimos 2 % da pontuação final. Uma pena, especialmente porque o pequeno aparelho, consegue taxas de transferência muito boas.
Finalmente, está o preço, ou o preço adicional sobre o modelo menor, respectivamente. Um preço base de $1799 já é bastante alto, se se o Touch Bar e o desempenho um pouco mais alto realmente valem $300, é pelo menos questionável. Ambos os sistemas são muito rápidos com tarefas do dia a dia, e se os usuários pro estarão satisfeitos com o desempenho comparativamente pequeno (sem quad-core, sem GPU dedicada), é outra questão.
Em resumo, o novo MacBook Pro 13 Touch Bar da Apple é um subportátil muito bom. Mas será que consegue justificar a sua designação de "Pro"? Bom, isto depende principalmente de deus cenários de uso. É a referência em algumas categorias, mas muitos usuários muito provavelmente tenham um problema com a falta de padrões já aprovados (e ainda modernos).
Apple MacBook Pro 13 2016 (2.9 GHz)
-
12/07/2016 v6(old)
Klaus Hinum, Andreas Osthoff
Pricecompare
