 Deutsch
 English
 Español
 Français
 Italiano
 Nederlands
 Polski
 Português
 Русский
 Türkçe
 Svenska
 Chinese
 Magyar
Breve Análise do Portátil Apple MacBook Pro 15 (Late 2016, 2.6 GHz i7)


| Networking | |
| iperf3 transmit AX12 | |
| Apple MacBook Pro 15 2016 (2.6 GHz, 450) (Klaus I211) | |
| Apple MacBook Pro Retina 13 inch 2013-10 (Klaus I211) | |
| Apple MacBook Pro 13 2016 (Klaus I211) | |
| Acer Spin 7 SP714-51-M09D (jseb) | |
| Dell XPS 13 9360 QHD+ i7 | |
| Lenovo ThinkPad T460s-20FA003GGE | |
| iperf3 receive AX12 | |
| Apple MacBook Pro 15 2016 (2.6 GHz, 450) (Klaus I211) | |
| Apple MacBook Pro Retina 13 inch 2013-10 (Klaus I211) | |
| Apple MacBook Pro 13 2016 (Klaus I211) | |
| Dell XPS 13 9360 QHD+ i7 | |
| Lenovo ThinkPad T460s-20FA003GGE | |
| Acer Spin 7 SP714-51-M09D (jseb) | |
| |||||||||||||||||||||||||
iluminação: 92 %
iluminação com acumulador: 483 cd/m²
Contraste: 1464:1 (Preto: 0.33 cd/m²)
ΔE Color 1.4 | 0.5-29.43 Ø5
ΔE Greyscale 1.5 | 0.57-98 Ø5.3
Gamma: 2.34
| Apple MacBook Pro 15 2016 (2.6 GHz, 450) 2880x1800, 15.40 | Apple MacBook Pro 13 2016 APPA034, , 2560x1600, 13.30 | Apple MacBook Pro Retina 15 inch 2015-05 APPA02E, , 2880x1800, 15.40 | Dell XPS 15 9550 i7 FHD 1920x1080, 15.60 | Asus Zenbook UX510UW-CN044T LG Philips LP156WF6-SPB6, , 1920x1080, 15.60 | |
|---|---|---|---|---|---|
| Display | |||||
| Display P3 Coverage | 97.1 | 61.4 | 68.5 | 61.5 | |
| sRGB Coverage | 99.8 | 90.8 | 97.2 | 80.4 | |
| AdobeRGB 1998 Coverage | 86.7 | 62.9 | 70.4 | 58.8 | |
| Response Times | -33% | -48% | 16% | ||
| Response Time Grey 50% / Grey 80% * | 47.3 ? | 47.2 ? -0% | 64 ? -35% | 40 ? 15% | |
| Response Time Black / White * | 31.2 ? | 51.6 ? -65% | 50 ? -60% | 26 ? 17% | |
| PWM Frequency | 117000 ? | ||||
| Screen | -12% | -24% | -119% | -114% | |
| Brightness middle | 483 | 600 24% | 341 -29% | 371.5 -23% | 326 -33% |
| Brightness | 465 | 564 21% | 315 -32% | 356 -23% | 316 -32% |
| Brightness Distribution | 92 | 89 -3% | 82 -11% | 92 0% | 80 -13% |
| Black Level * | 0.33 | 0.57 -73% | 0.34 -3% | 0.252 24% | 0.35 -6% |
| Contrast | 1464 | 1053 -28% | 1003 -31% | 1474 1% | 931 -36% |
| Colorchecker dE 2000 * | 1.4 | 1.5 -7% | 2.07 -48% | 5.55 -296% | 5.49 -292% |
| Colorchecker dE 2000 max. * | 3 | 2.9 3% | 3.27 -9% | 10.95 -265% | 11.36 -279% |
| Greyscale dE 2000 * | 1.5 | 2 -33% | 1.9 -27% | 7.1 -373% | 4.84 -223% |
| Gamma | 2.34 94% | 2.27 97% | 2.62 84% | 2.1 105% | 2.23 99% |
| CCT | 6650 98% | 6855 95% | 6514 100% | 5971 109% | |
| Color Space (Percent of AdobeRGB 1998) | 77 | 58 | 63.4 | 53 | |
| Color Space (Percent of sRGB) | 92 | 91 | 97.9 | 80 | |
| Total Average (Program / Settings) | -23% /
-16% | -24% /
-24% | -84% /
-105% | -49% /
-88% |
* ... smaller is better
Display Response Times
| ↔ Response Time Black to White | ||
|---|---|---|
| 31.2 ms ... rise ↗ and fall ↘ combined | ↗ 16.7 ms rise | 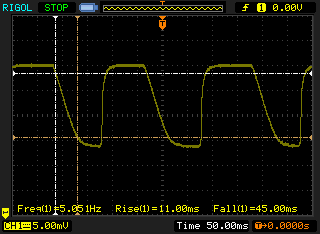 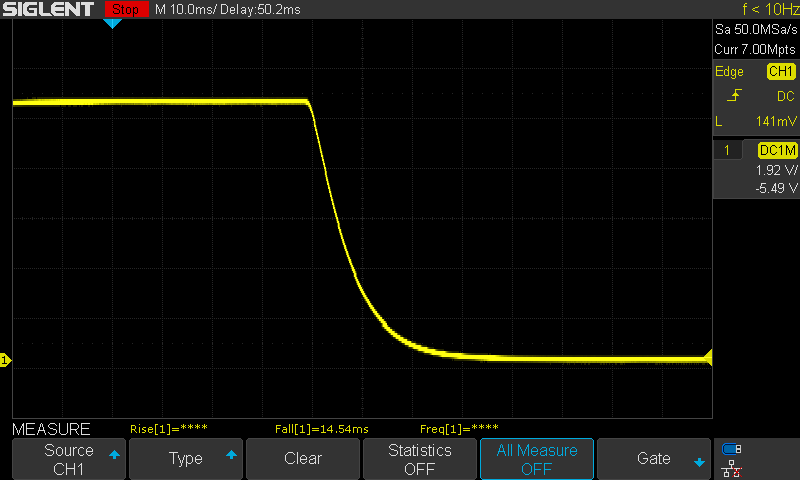 |
| ↘ 14.5 ms fall | ||
| The screen shows slow response rates in our tests and will be unsatisfactory for gamers. In comparison, all tested devices range from 0.1 (minimum) to 240 (maximum) ms. » 82 % of all devices are better. This means that the measured response time is worse than the average of all tested devices (21.5 ms). | ||
| ↔ Response Time 50% Grey to 80% Grey | ||
| 47.3 ms ... rise ↗ and fall ↘ combined | ↗ 22.1 ms rise |  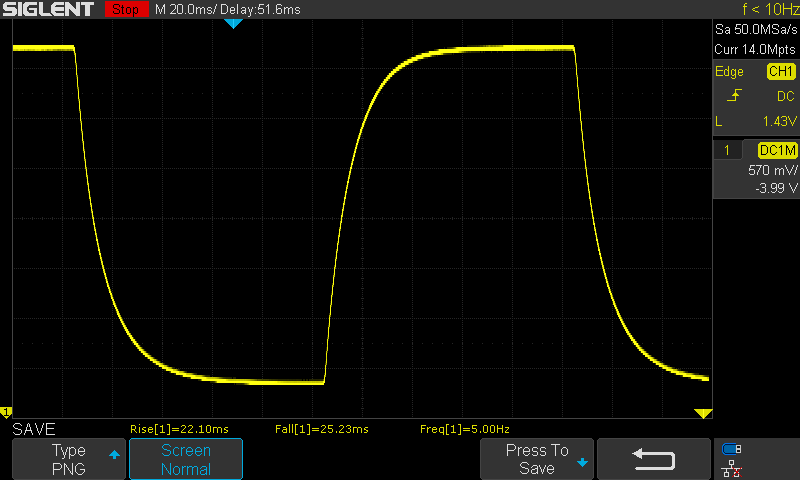 |
| ↘ 25.2 ms fall | ||
| The screen shows slow response rates in our tests and will be unsatisfactory for gamers. In comparison, all tested devices range from 0.2 (minimum) to 636 (maximum) ms. » 79 % of all devices are better. This means that the measured response time is worse than the average of all tested devices (33.7 ms). | ||
Screen Flickering / PWM (Pulse-Width Modulation)
| Screen flickering / PWM detected | 117000 Hz | ≤ 80 % brightness setting | 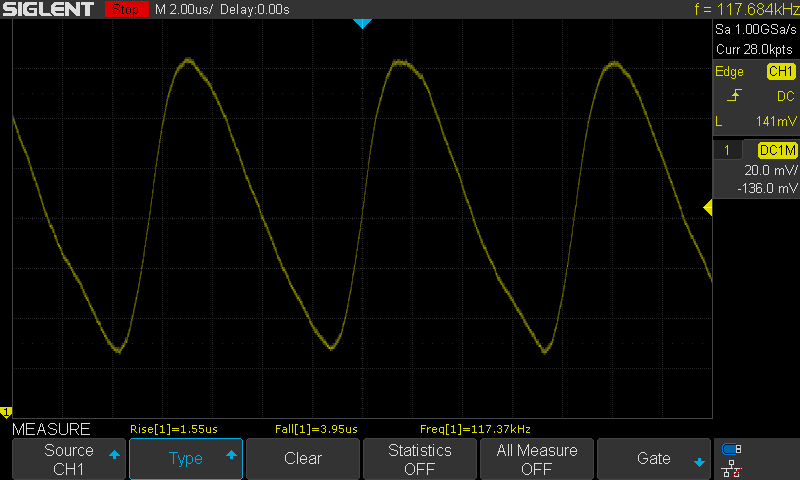 |
| ≤ 200 cd/m² brightness | |||
The display backlight flickers at 117000 Hz (worst case, e.g., utilizing PWM) Flickering detected at a brightness setting of 80 % (200 cd/m²) and below. There should be no flickering or PWM above this brightness setting. The frequency of 117000 Hz is quite high, so most users sensitive to PWM should not notice any flickering. Flickering occurs even at high brightness setting and may have an effect on the user during everyday use. In comparison: 53 % of all tested devices do not use PWM to dim the display. If PWM was detected, an average of 17924 (minimum: 5 - maximum: 3846000) Hz was measured. | |||


| PCMark 8 Home Score Accelerated v2 | 3637 pontos | |
| PCMark 8 Work Score Accelerated v2 | 4426 pontos | |
Ajuda | ||
| 3DMark 11 - 1280x720 Performance | |
| HP Omen 15-ax007ng | |
| Apple MacBook Pro 15 2016 (2.9 GHz, 460) | |
| Apple MacBook Pro 15 2016 (2.6 GHz, 450) | |
| Asus Zenbook UX510UW-CN044T | |
| Asus N552VX-FY103T | |
| Apple MacBook Pro Retina 15 inch 2015-05 | |
| Apple MacBook Pro 13 2016 | |
| 3DMark - 1920x1080 Fire Strike Score | |
| HP Omen 15-ax007ng | |
| Apple MacBook Pro 15 2016 (2.9 GHz, 460) | |
| Dell XPS 15 9550 i7 FHD | |
| Asus Zenbook UX510UW-CN044T | |
| Apple MacBook Pro 15 2016 (2.6 GHz, 450) | |
| Asus N552VX-FY103T | |
| Apple MacBook Pro Retina 15 inch 2015-05 | |
| Apple MacBook Pro 13 2016 | |
| Unigine Valley 1.0 - 1920x1080 Extreme HD Preset OpenGL AA:x8 | |
| Apple MacBook Pro 15 2016 (2.9 GHz, 460) | |
| Apple MacBook Pro 15 2016 (2.9 GHz, 460) | |
| Apple MacBook Pro 15 2016 (2.6 GHz, 450) | |
| Apple MacBook Pro 13 2016 | |
| 3DMark 06 Standard Score | 24189 pontos | |
| 3DMark Vantage P Result | 14245 pontos | |
| 3DMark 11 Performance | 4914 pontos | |
| 3DMark Cloud Gate Standard Score | 14305 pontos | |
| 3DMark Fire Strike Score | 3027 pontos | |
| 3DMark Fire Strike Extreme Score | 1440 pontos | |
| 3DMark Time Spy Score | 1074 pontos | |
Ajuda | ||
| Fallout 4 | |
| 1280x720 Low Preset AA:FX | |
| Apple MacBook Pro 15 2016 (2.6 GHz, 450) | |
| Apple MacBook Pro 13 2016 | |
| Acer Spin 7 SP714-51-M09D | |
| Apple MacBook 12 (Early 2016) 1.1 GHz | |
| 1920x1080 High Preset AA:T AF:16x | |
| Dell XPS 15 9550 i7 FHD | |
| Apple MacBook Pro 15 2016 (2.6 GHz, 450) | |
| XCOM 2 - 1920x1080 Medium Preset AA:FX AF:2x | |
| Apple MacBook Pro 15 2016 (2.6 GHz, 450) | |
| Deus Ex Mankind Divided | |
| 1280x720 Low Preset AF:1x | |
| Apple MacBook Pro 15 2016 (2.6 GHz, 450) | |
| Asus Zenbook UX510UW-CN044T | |
| Acer Aspire E5-575G-549D | |
| Apple MacBook Pro 13 2016 | |
| Apple MacBook Pro 13 2016 | |
| Acer Spin 7 SP714-51-M09D | |
| 1920x1080 High Preset AF:4x | |
| Apple MacBook Pro 15 2016 (2.6 GHz, 450) | |
| Apple MacBook Pro 15 2016 (2.6 GHz, 450) | |
| Asus Zenbook UX510UW-CN044T | |
| Acer Aspire E5-575G-549D | |
| baixo | média | alto | ultra | 4K | |
| The Witcher 3 (2015) | 40.9 | 20.3 | |||
| Dota 2 Reborn (2015) | 67.2 | ||||
| World of Warships (2015) | 44.6 | ||||
| Anno 2205 (2015) | 87 | 18.3 | |||
| Fallout 4 (2015) | 70 | 24.1 | |||
| Rainbow Six Siege (2015) | 39.6 | 34.1 | |||
| Rise of the Tomb Raider (2016) | 66.6 | 20.7 | |||
| XCOM 2 (2016) | 63.7 | 24.2 | 15.5 | 5.6 | |
| Far Cry Primal (2016) | 29 | 26 | 17 | ||
| The Division (2016) | 77 | 21.6 | 15.8 | ||
| Doom (2016) | 53.4 | 20.4 | |||
| Overwatch (2016) | 153 | 57 | 39.5 | ||
| Deus Ex Mankind Divided (2016) | 51.2 | 18.3 | 7.5 | ||
| Mafia 3 (2016) | 28.3 | ||||
| Battlefield 1 (2016) | 101 | 24.2 | 21.7 | ||
| Civilization VI (2016) | 61 | 25.8 | |||
| Farming Simulator 17 (2016) | 63.4 | 24.7 | |||
| Call of Duty Infinite Warfare (2016) | 58.7 | 36 | |||
| Dishonored 2 (2016) | 29.5 | ||||
| Watch Dogs 2 (2016) | 47.4 | 17.6 | |||
| For Honor (2017) | 82.3 | 29.3 | 27.9 | 19.4 | |
| Ghost Recon Wildlands (2017) | 48.2 | 21.3 | 18.5 | 8 | |
| Mass Effect Andromeda (2017) | 68.2 | 26.5 | 16.4 | ||
| Rocket League (2017) | 47.5 | 19.3 | |||
| Playerunknown's Battlegrounds (PUBG) (2017) | 63.3 | ||||
| F1 2017 (2017) | 95 | 41 | 33 | ||
| Ark Survival Evolved (2017) | 38.9 | 12 |
Barulho
| Ocioso |
| 30.6 / 30.6 / 30.6 dB |
| Carga |
| 34.7 / 46.3 dB |
 | ||
30 dB silencioso 40 dB(A) audível 50 dB(A) ruidosamente alto |
||
min: | ||
(±) The maximum temperature on the upper side is 43 °C / 109 F, compared to the average of 36.9 °C / 98 F, ranging from 21.1 to 71 °C for the class Multimedia.
(±) The bottom heats up to a maximum of 40 °C / 104 F, compared to the average of 39.1 °C / 102 F
(+) In idle usage, the average temperature for the upper side is 24.8 °C / 77 F, compared to the device average of 31.2 °C / 88 F.
(+) The palmrests and touchpad are cooler than skin temperature with a maximum of 28 °C / 82.4 F and are therefore cool to the touch.
(±) The average temperature of the palmrest area of similar devices was 28.8 °C / 83.8 F (+0.8 °C / 1.4 F).
Apple MacBook Pro 15 2016 (2.6 GHz, 450) audio analysis
(+) | speakers can play relatively loud (86 dB)
Bass 100 - 315 Hz
(±) | reduced bass - on average 6.9% lower than median
(±) | linearity of bass is average (12.7% delta to prev. frequency)
Mids 400 - 2000 Hz
(±) | higher mids - on average 5% higher than median
(±) | linearity of mids is average (9.5% delta to prev. frequency)
Highs 2 - 16 kHz
(+) | balanced highs - only 2% away from median
(+) | highs are linear (4.3% delta to prev. frequency)
Overall 100 - 16.000 Hz
(+) | overall sound is linear (9.7% difference to median)
Compared to same class
» 8% of all tested devices in this class were better, 0% similar, 92% worse
» The best had a delta of 5%, average was 18%, worst was 45%
Compared to all devices tested
» 3% of all tested devices were better, 1% similar, 97% worse
» The best had a delta of 4%, average was 25%, worst was 134%
Apple MacBook 12 (Early 2016) 1.1 GHz audio analysis
(+) | speakers can play relatively loud (83.6 dB)
Bass 100 - 315 Hz
(±) | reduced bass - on average 11.3% lower than median
(±) | linearity of bass is average (14.2% delta to prev. frequency)
Mids 400 - 2000 Hz
(+) | balanced mids - only 2.4% away from median
(+) | mids are linear (5.5% delta to prev. frequency)
Highs 2 - 16 kHz
(+) | balanced highs - only 2% away from median
(+) | highs are linear (4.5% delta to prev. frequency)
Overall 100 - 16.000 Hz
(+) | overall sound is linear (10.2% difference to median)
Compared to same class
» 5% of all tested devices in this class were better, 2% similar, 93% worse
» The best had a delta of 5%, average was 19%, worst was 53%
Compared to all devices tested
» 3% of all tested devices were better, 1% similar, 96% worse
» The best had a delta of 4%, average was 25%, worst was 134%
Apple MacBook Pro 13 2016 audio analysis
(+) | speakers can play relatively loud (83.2 dB)
Bass 100 - 315 Hz
(±) | reduced bass - on average 8.4% lower than median
(-) | bass is not linear (16.7% delta to prev. frequency)
Mids 400 - 2000 Hz
(+) | balanced mids - only 4.7% away from median
(+) | mids are linear (6.3% delta to prev. frequency)
Highs 2 - 16 kHz
(+) | balanced highs - only 1.1% away from median
(+) | highs are linear (2.6% delta to prev. frequency)
Overall 100 - 16.000 Hz
(+) | overall sound is linear (9.8% difference to median)
Compared to same class
» 4% of all tested devices in this class were better, 2% similar, 94% worse
» The best had a delta of 5%, average was 19%, worst was 53%
Compared to all devices tested
» 3% of all tested devices were better, 1% similar, 96% worse
» The best had a delta of 4%, average was 25%, worst was 134%
| desligado | |
| Ocioso | |
| Carga |
|
| Apple MacBook Pro 15 2016 (2.6 GHz, 450) 6700HQ, Radeon Pro 450, Apple SSD SM0256L, IPS, 2880x1800, 15.40 | Apple MacBook Pro 13 2016 6360U, Iris Graphics 540, Apple SSD AP0256, , 2560x1600, 13.30 | Apple MacBook Pro 13 2016 (2.9 GHz) 6267U, Iris Graphics 550, Apple SSD AP0256, , 2560x1600, 13.30 | Apple MacBook Pro Retina 15 inch 2015-05 4870HQ, Radeon R9 M370X, Apple SSD SM0512G, IPS-Panel, 2880x1800, 15.40 | Apple MacBook Pro Retina 13 inch 2015-03 5257U, Iris Graphics 6100, Apple SSD SM0128G, IPS-Panel, 2560x1600, 13.30 | Dell XPS 15-9550 i7 6700HQ, GeForce GTX 960M, Samsung PM951 NVMe 512 GB, IGZO WLED 330 cd/m² 1000:1 Hard Coating 3H, 3840x2160, 15.60 | |
|---|---|---|---|---|---|---|
| Power Consumption | 21% | 23% | -40% | 18% | -127% | |
| Idle Minimum * | 2.9 | 3 -3% | 2.1 28% | 6 -107% | 2.8 3% | 12.5 -331% |
| Idle Average * | 9.7 | 8.9 8% | 7.6 22% | 12.8 -32% | 7.8 20% | 19.6 -102% |
| Idle Maximum * | 10.1 | 8.9 12% | 8.2 19% | 13.3 -32% | 8.1 20% | 22.8 -126% |
| Load Average * | 65 | 43.4 33% | 56.4 13% | 82.4 -27% | 52.4 19% | 102 -57% |
| Load Maximum * | 89.5 | 42.1 53% | 59.8 33% | 91.8 -3% | 62.8 30% | 107 -20% |
* ... smaller is better
| Apple MacBook Pro 15 2016 (2.6 GHz, 450) 6700HQ, Radeon Pro 450, 76 Wh | Apple MacBook Pro 13 2016 6360U, Iris Graphics 540, 54 Wh | Apple MacBook Pro Retina 15 inch 2015-05 4870HQ, Radeon R9 M370X, 100 Wh | Dell XPS 15 9550 i7 FHD 6700HQ, GeForce GTX 960M, 84 Wh | Asus Zenbook UX510UW-CN044T 6500U, GeForce GTX 960M, 48 Wh | |
|---|---|---|---|---|---|
| Battery Runtime | 39% | 14% | 42% | 9% | |
| H.264 | 516 | 620 20% | 413 -20% | 428 -17% | |
| WiFi v1.3 | 602 | 686 14% | 432 -28% | 544 -10% | 430 -29% |
| Load | 55 | 101 84% | 105 91% | 106 93% | 95 73% |
| Reader / Idle | 2557 | 1039 | 979 | 816 |
Pro
Contra
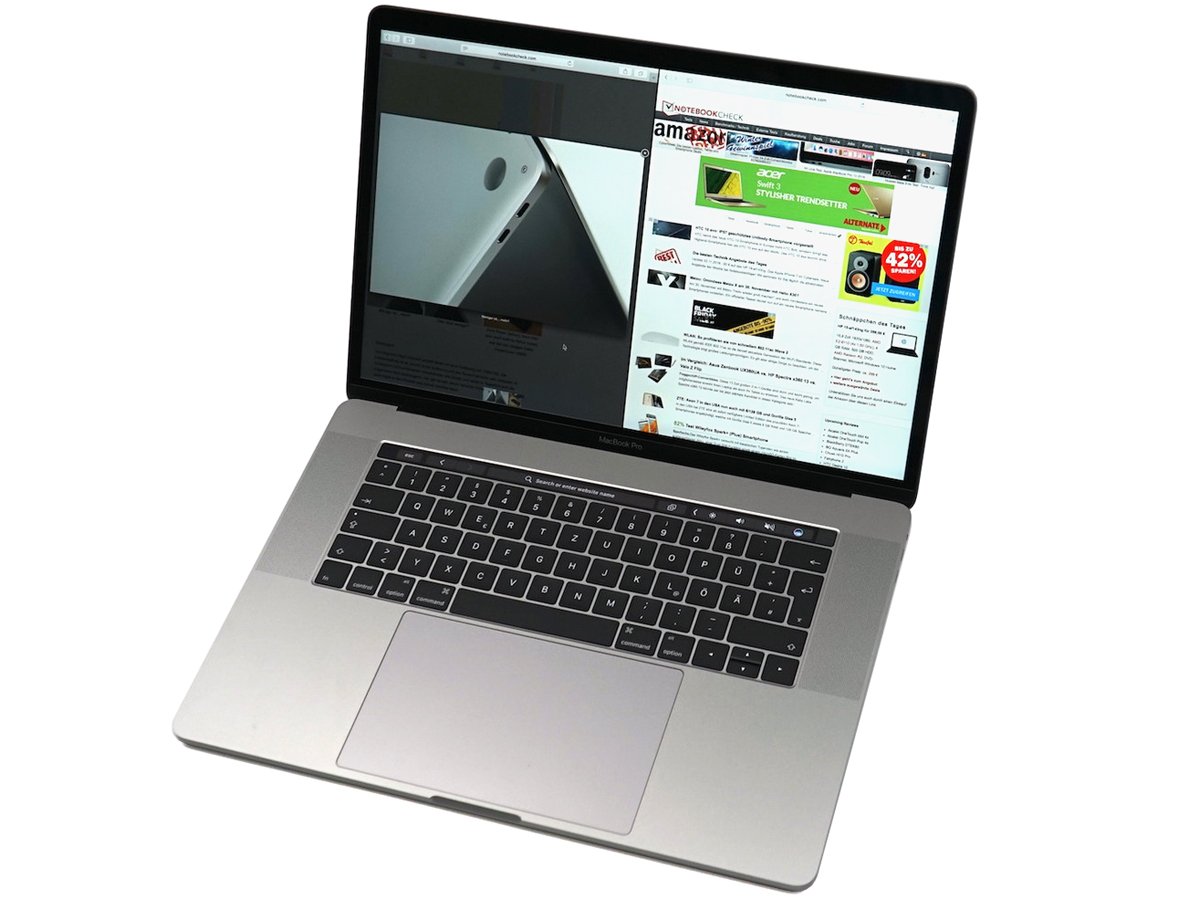
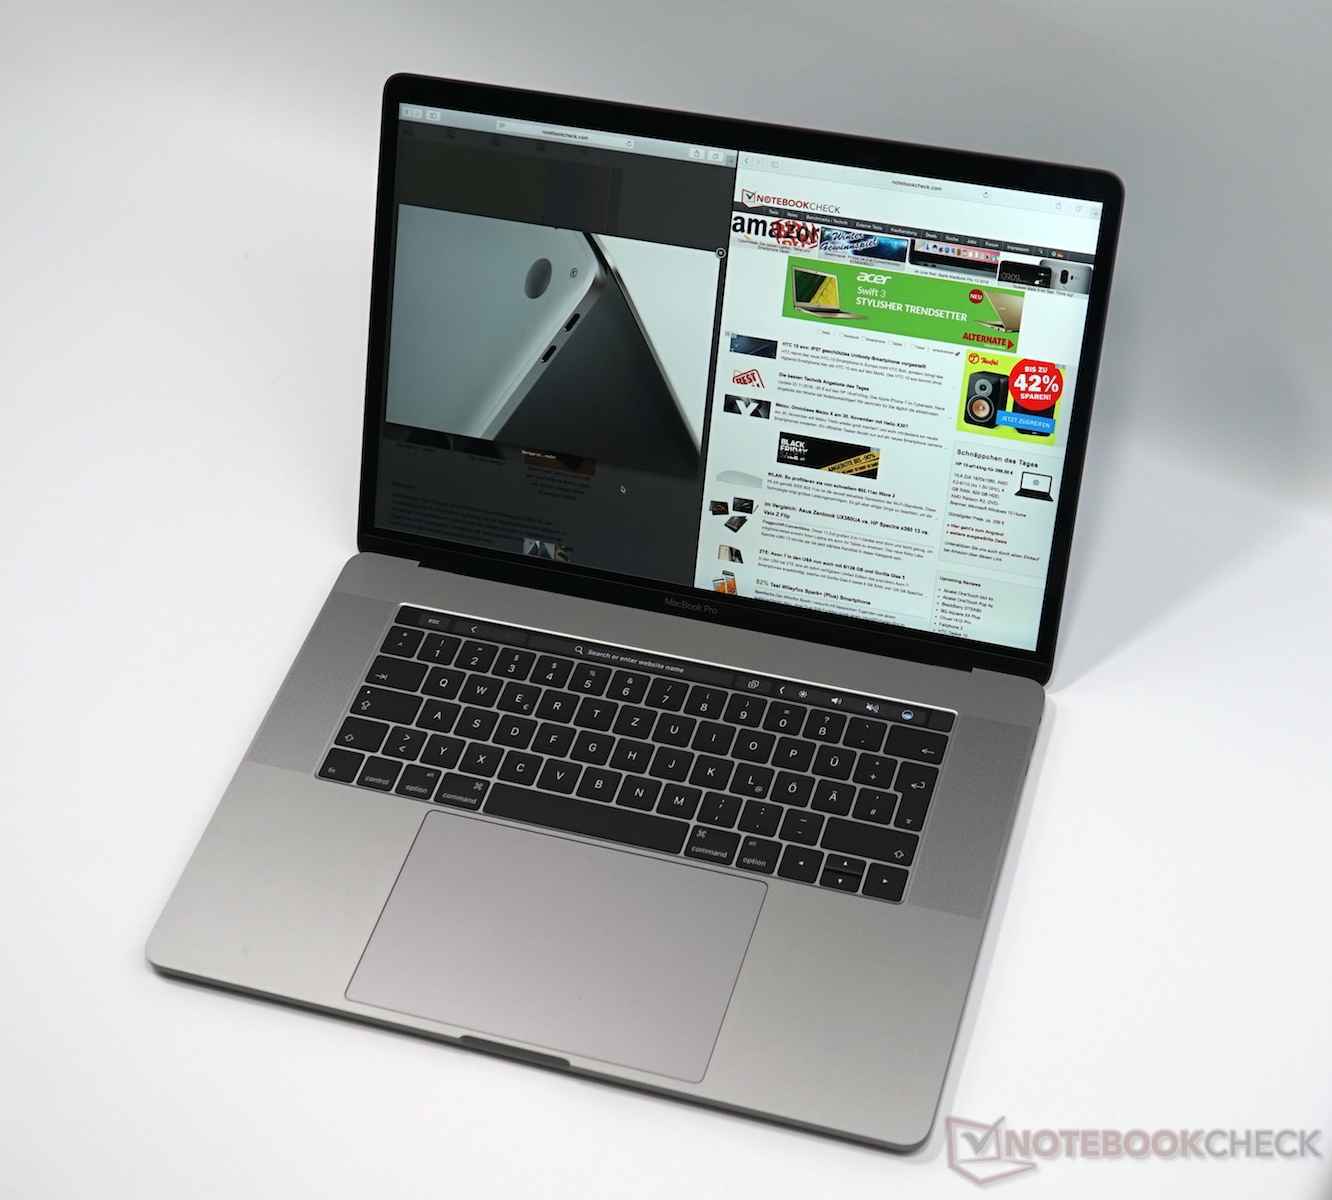
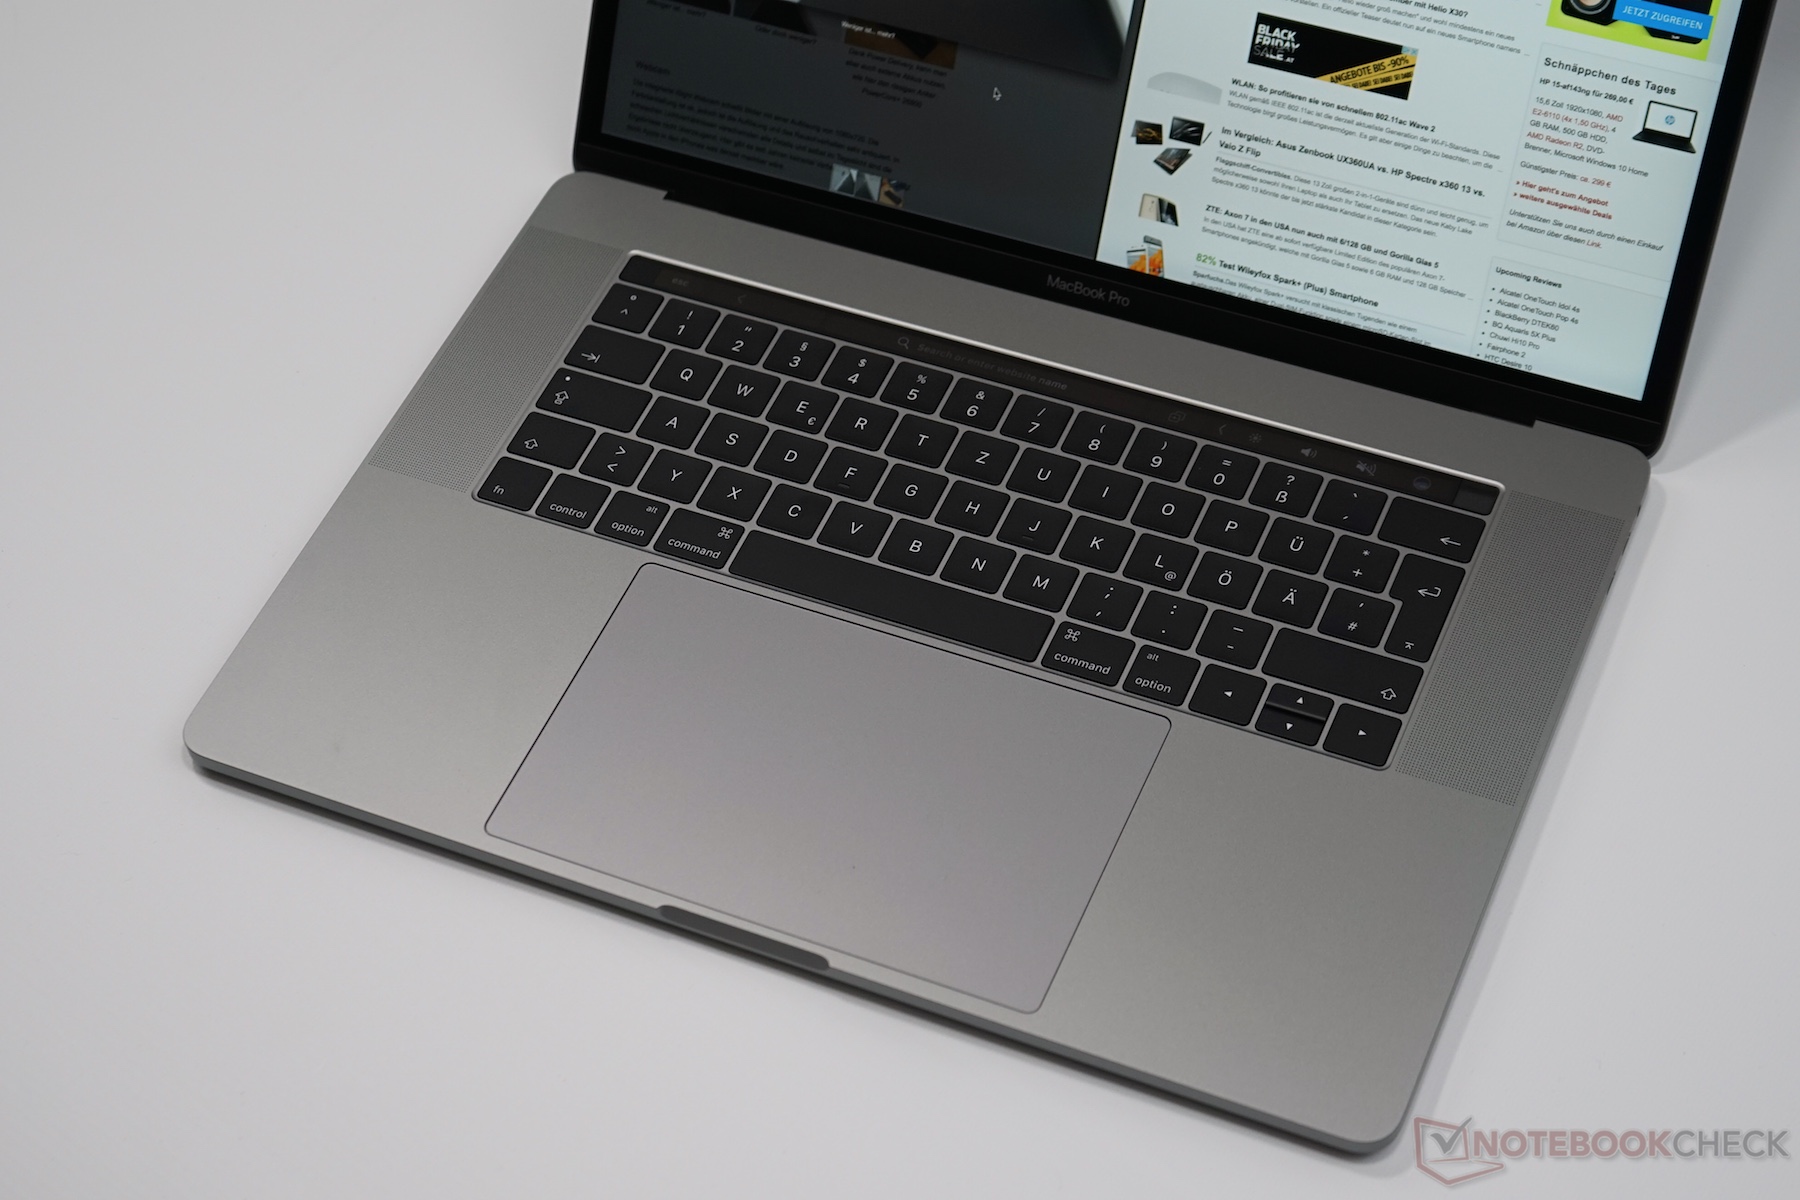
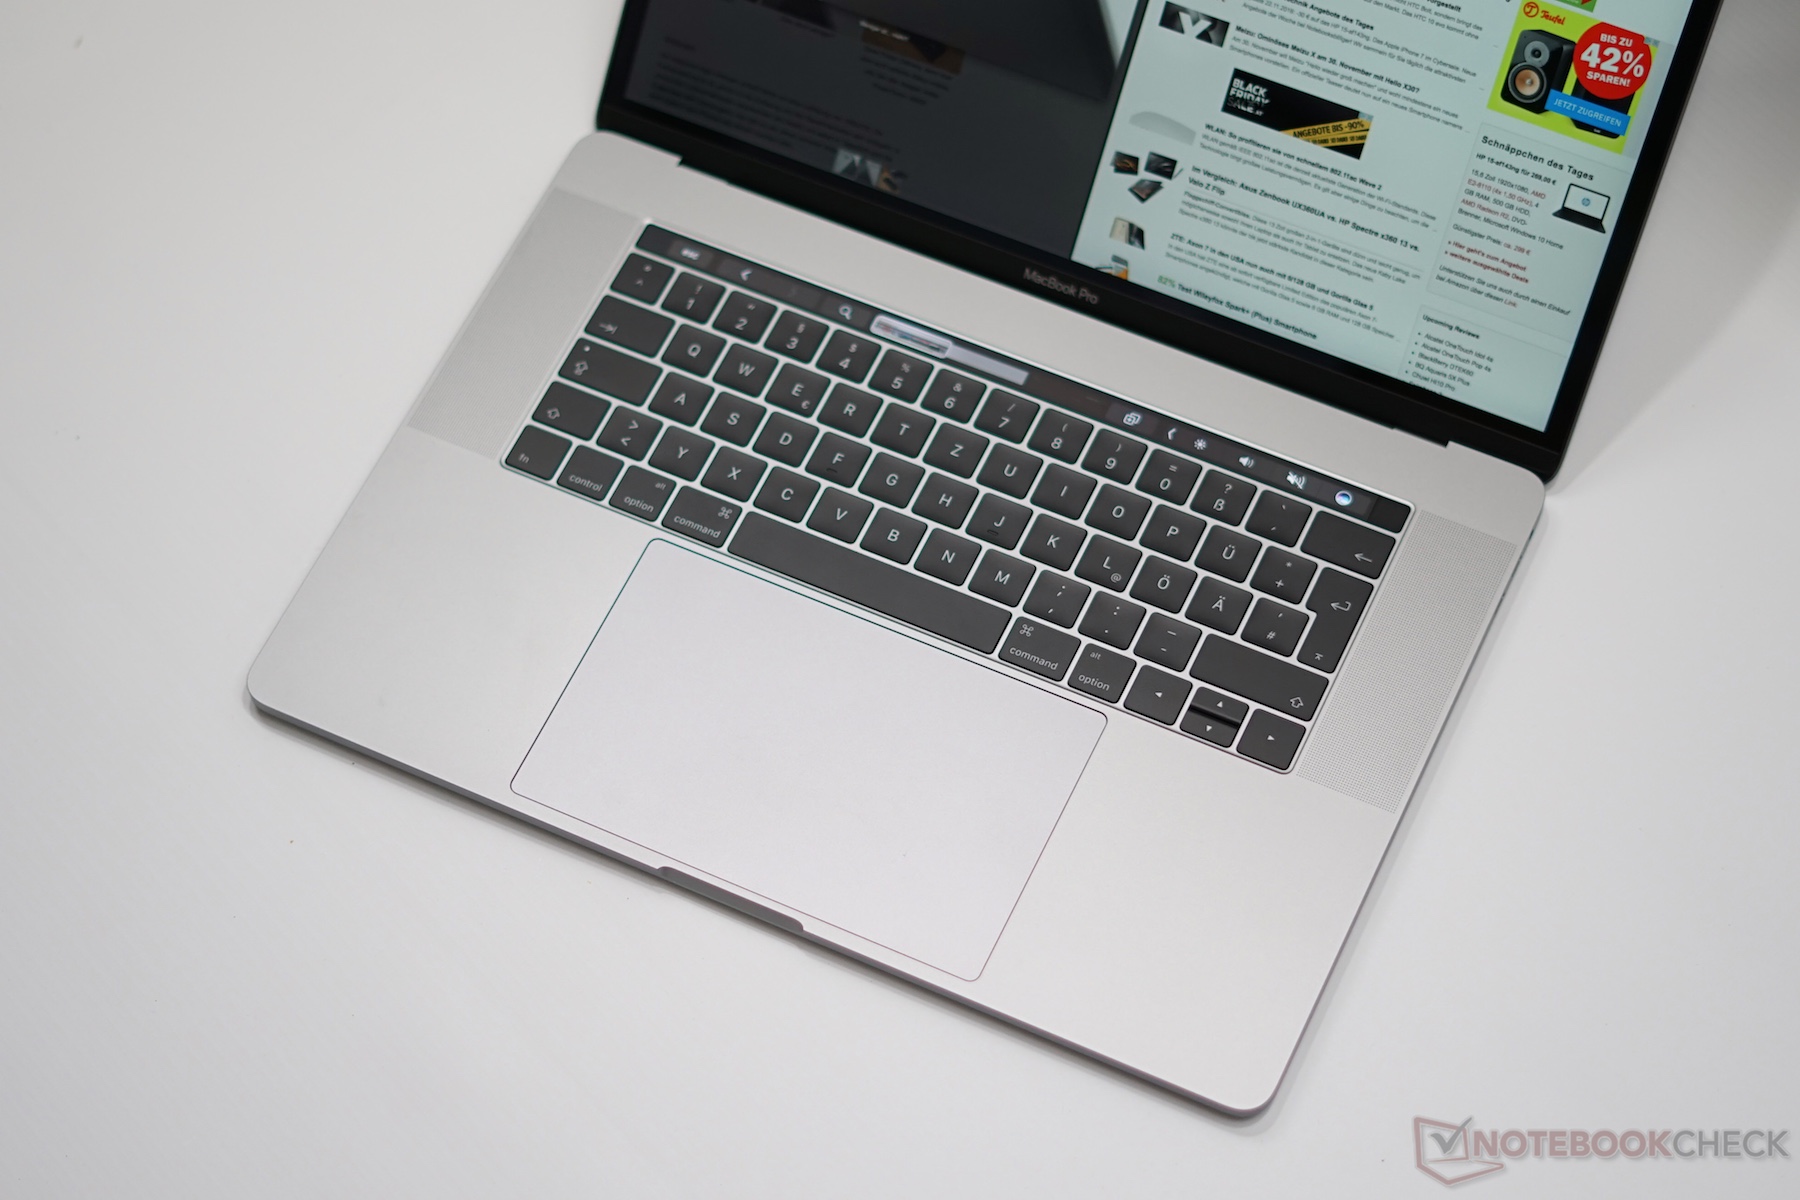
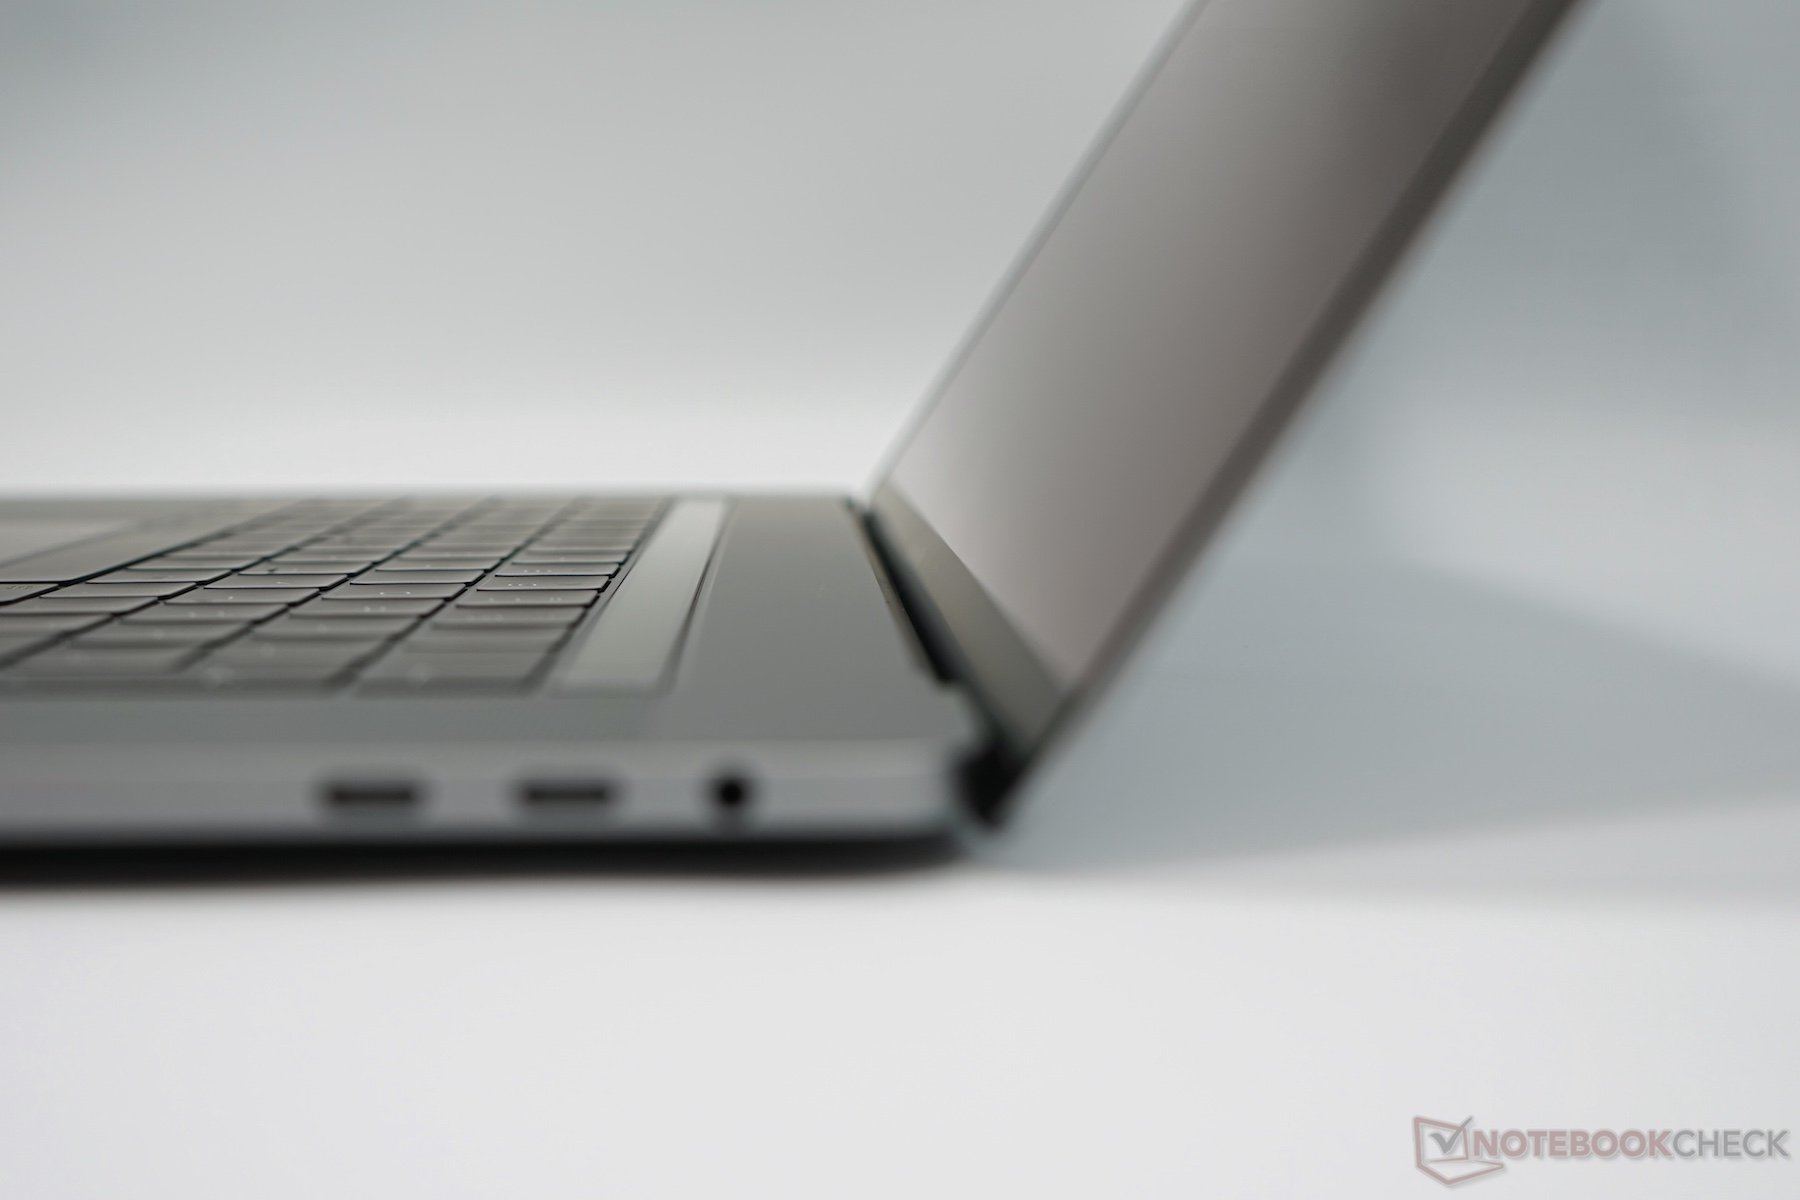
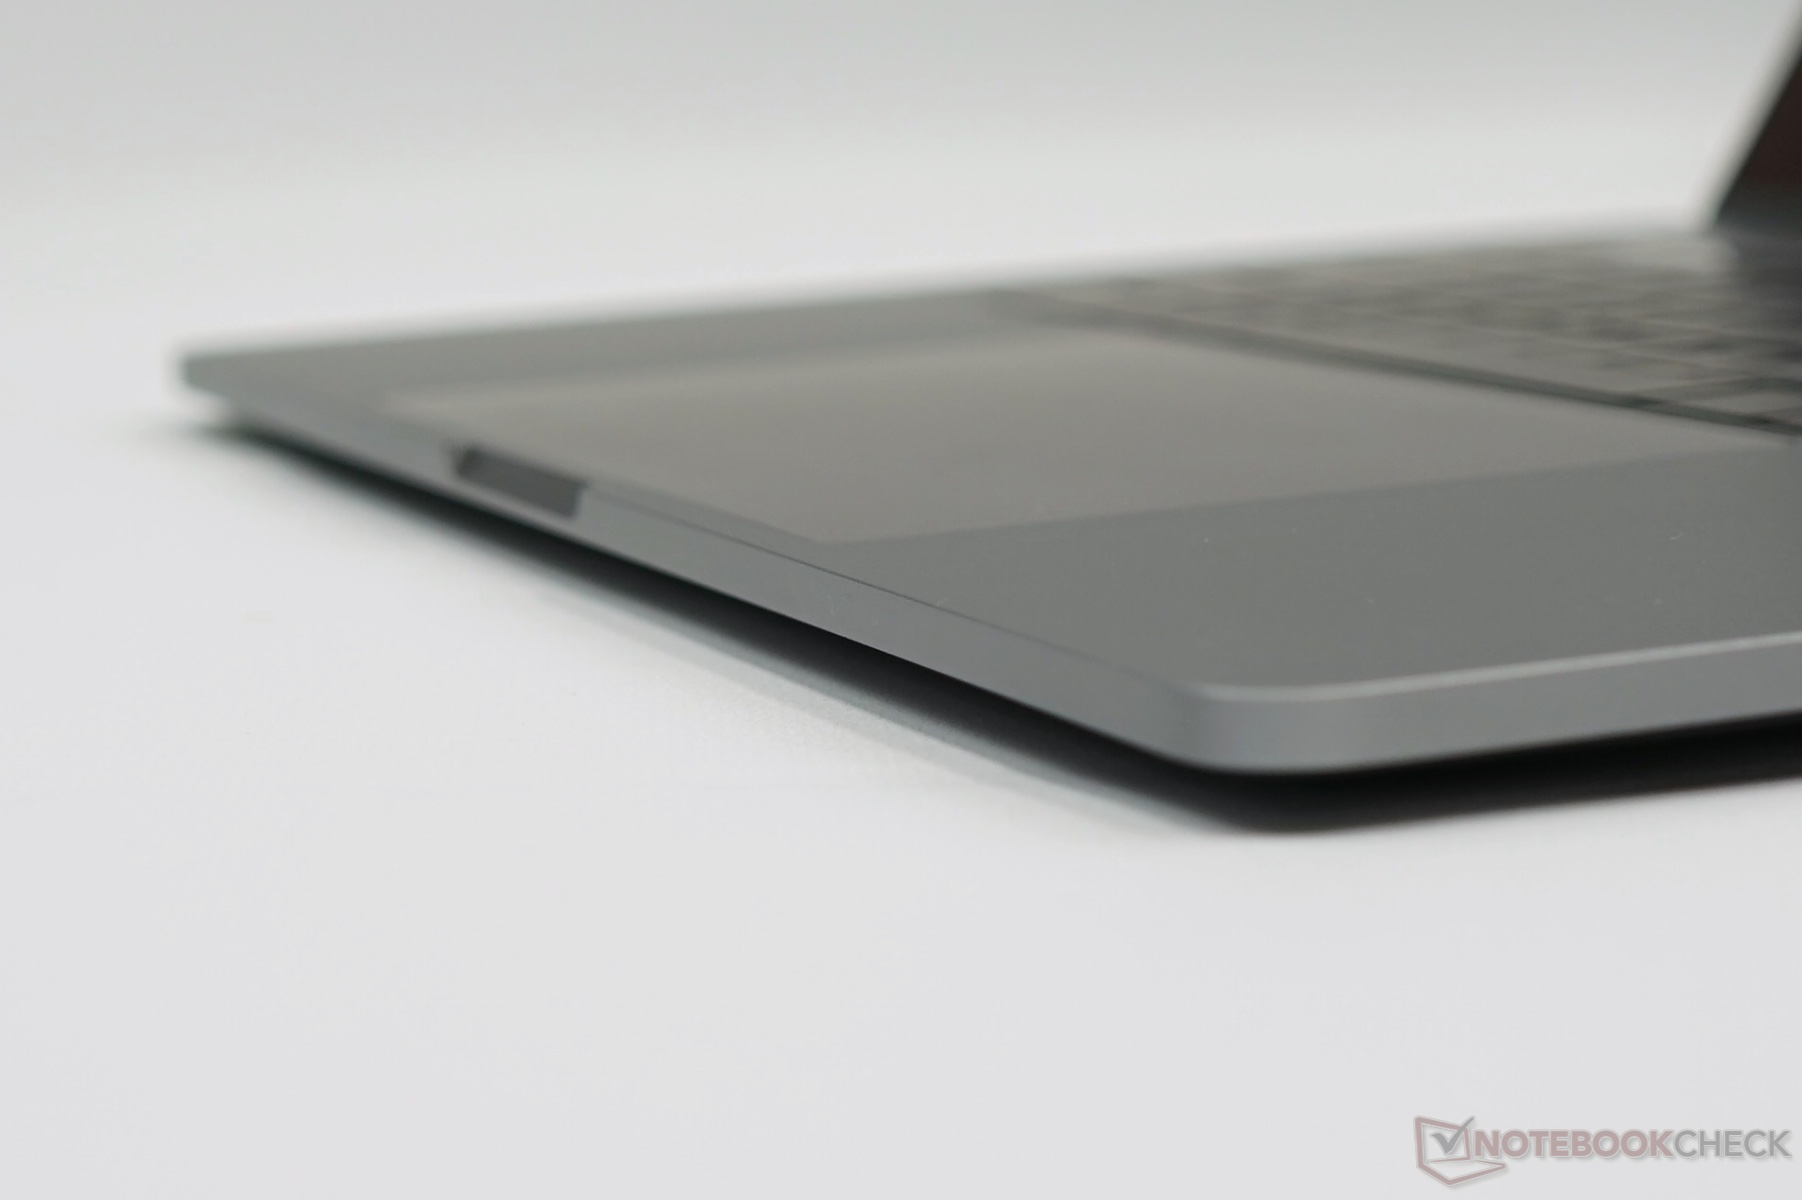
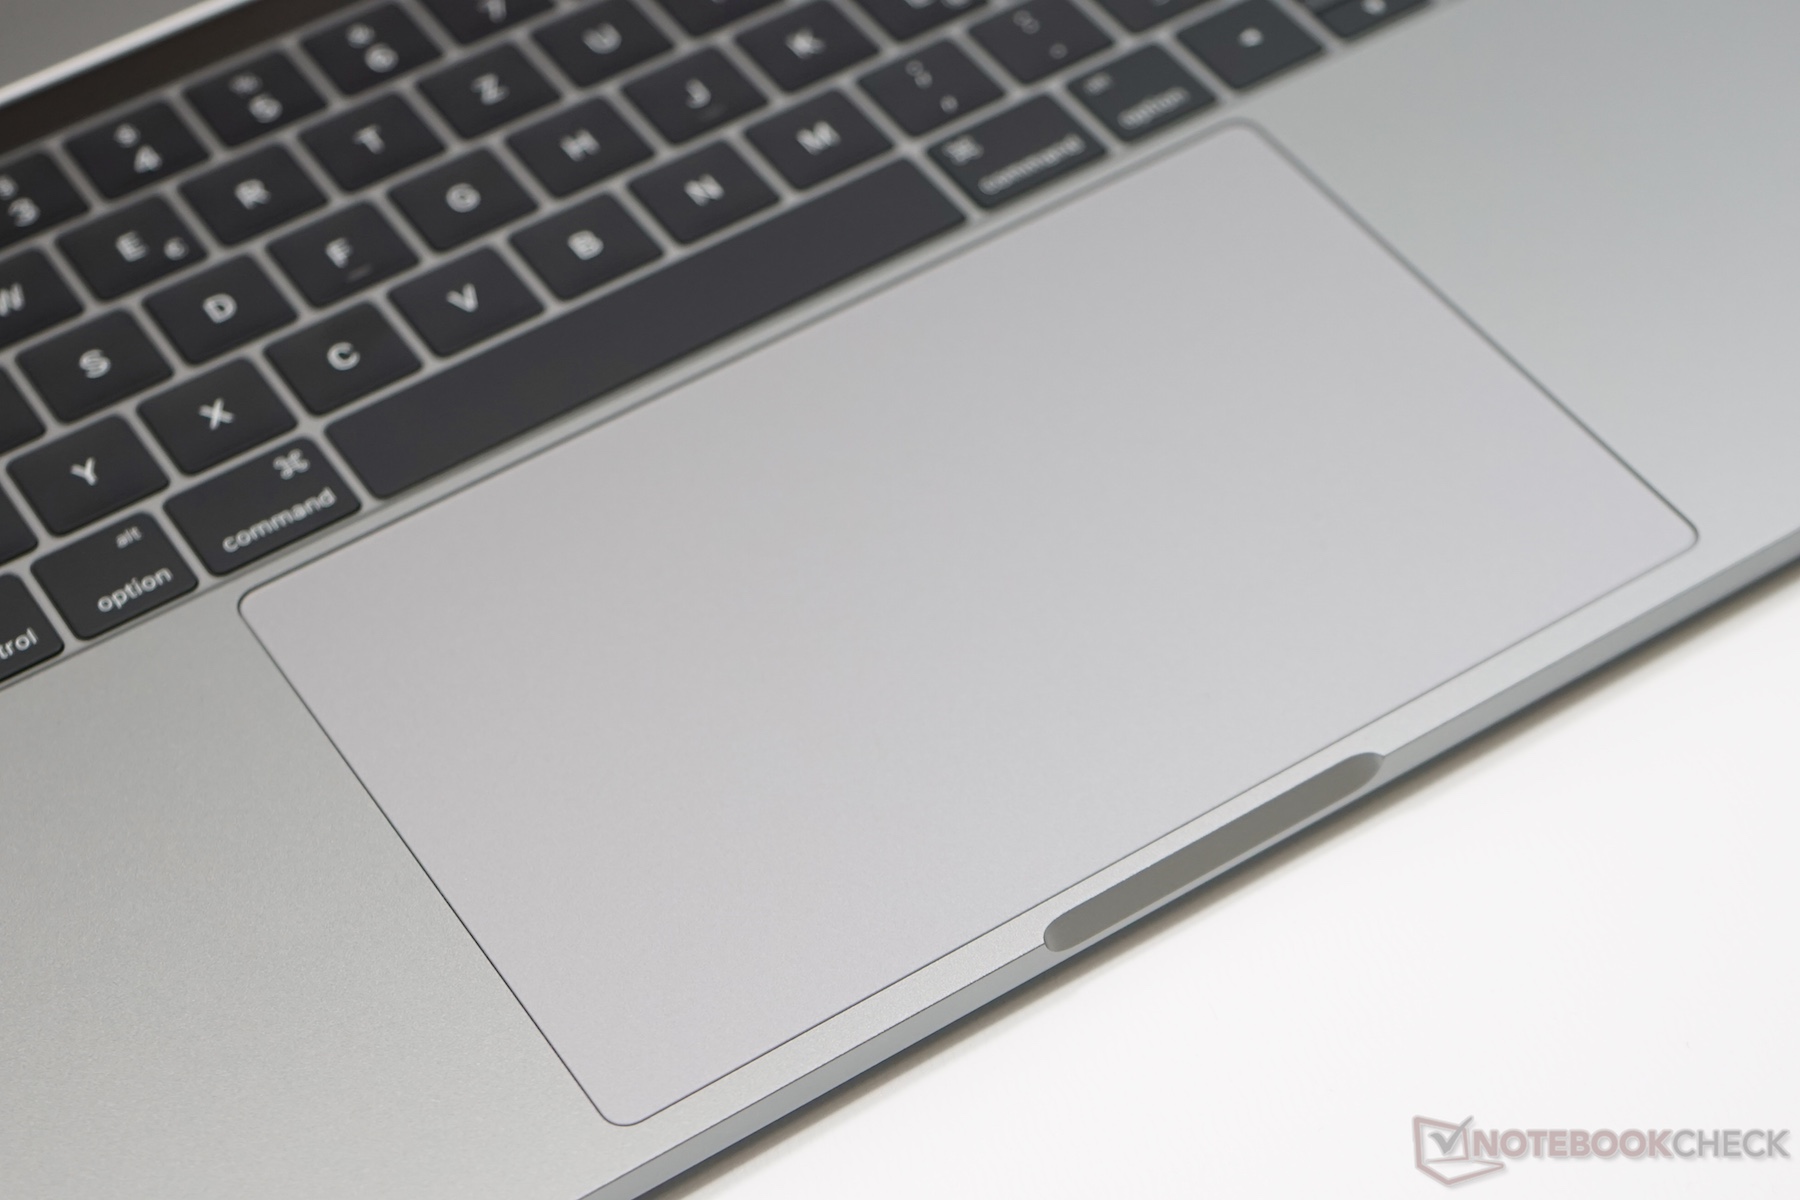
O novo Apple MacBook Pro 15 aumenta ainda mais as vantagens do predecessor e é um dos melhores aparelhos que você pode comprar no momento, em alguns aspectos. Isto definitivamente inclui o excelente chassi, onde a dieta não afetou a qualidade ou a estabilidade. A Apple também foi capaz de melhorar a tela ainda mais e ultrapassar o modelo anterior em todas as áreas. O trackpad agora é muito maior que antes e ainda muito melhor que todos os rivais Windows.
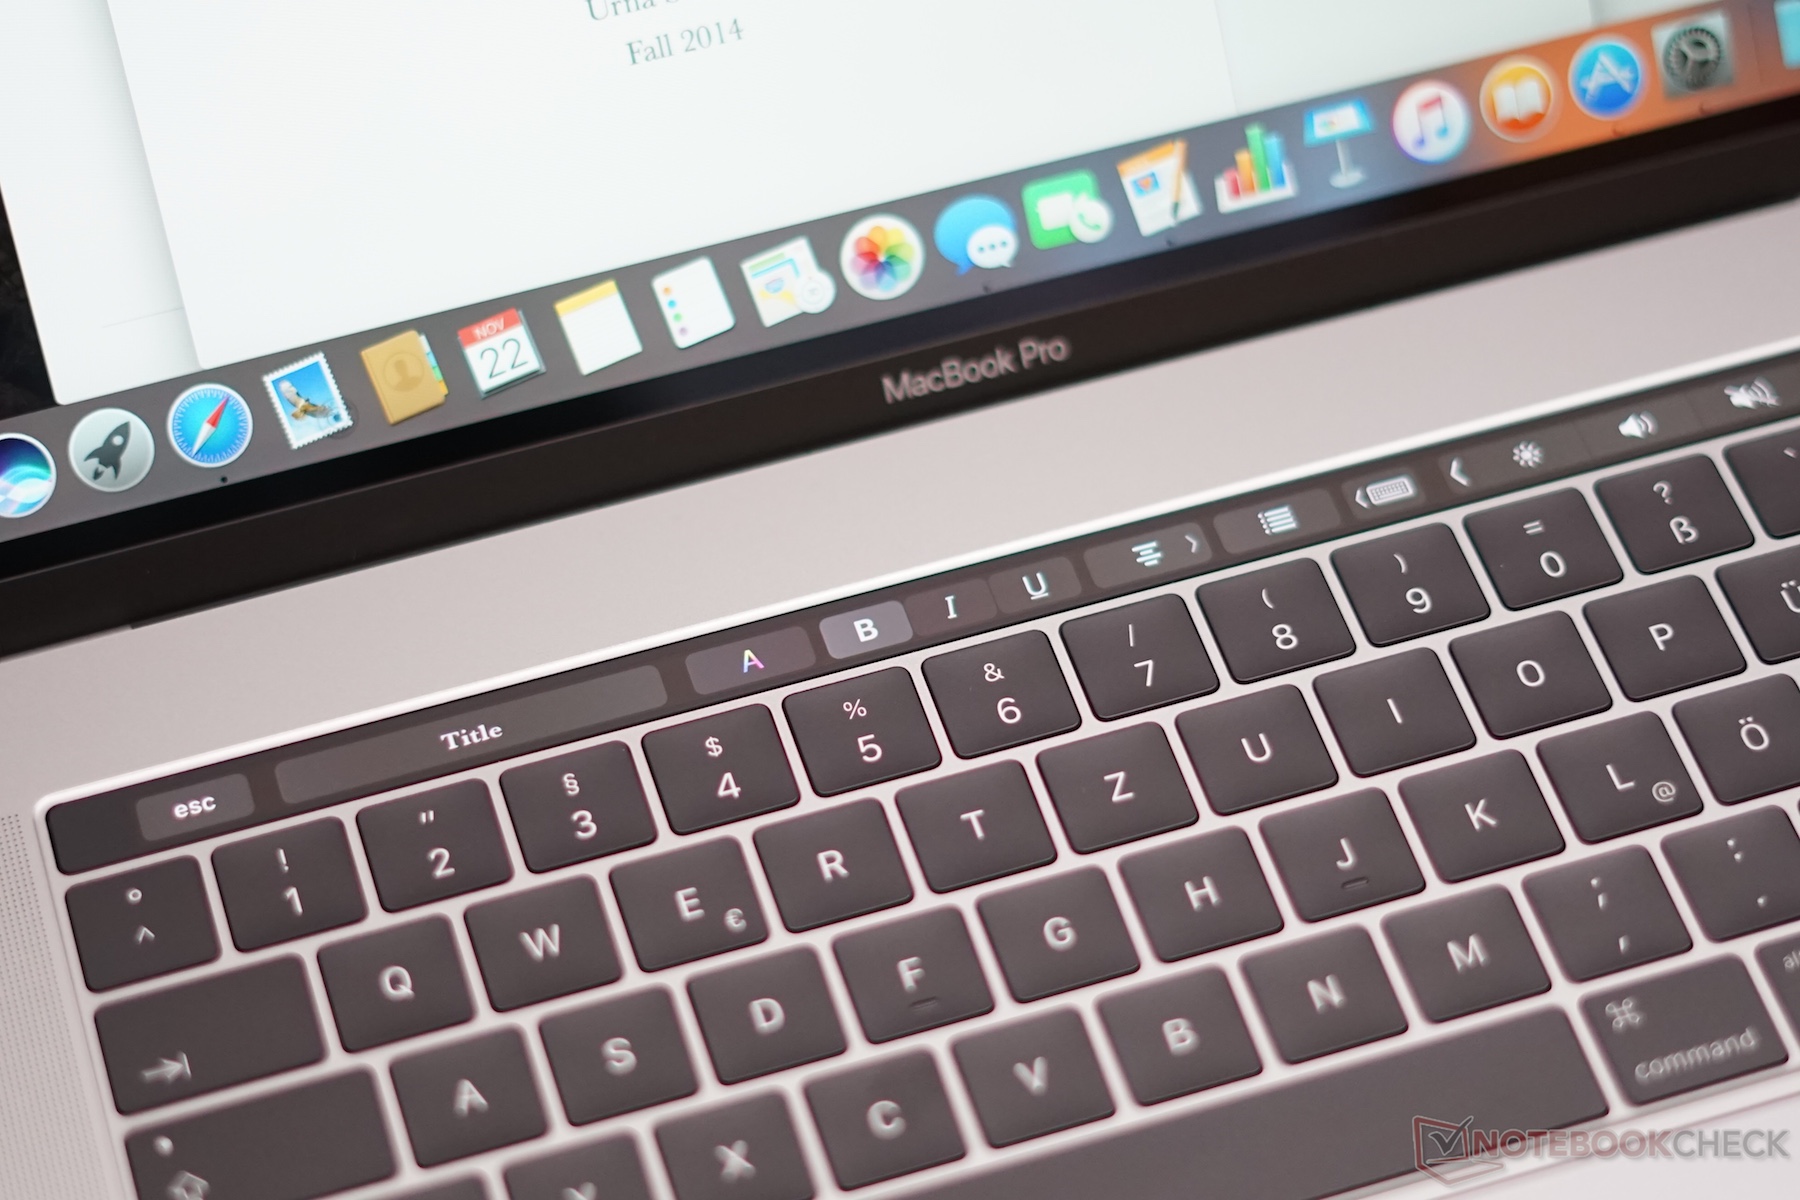
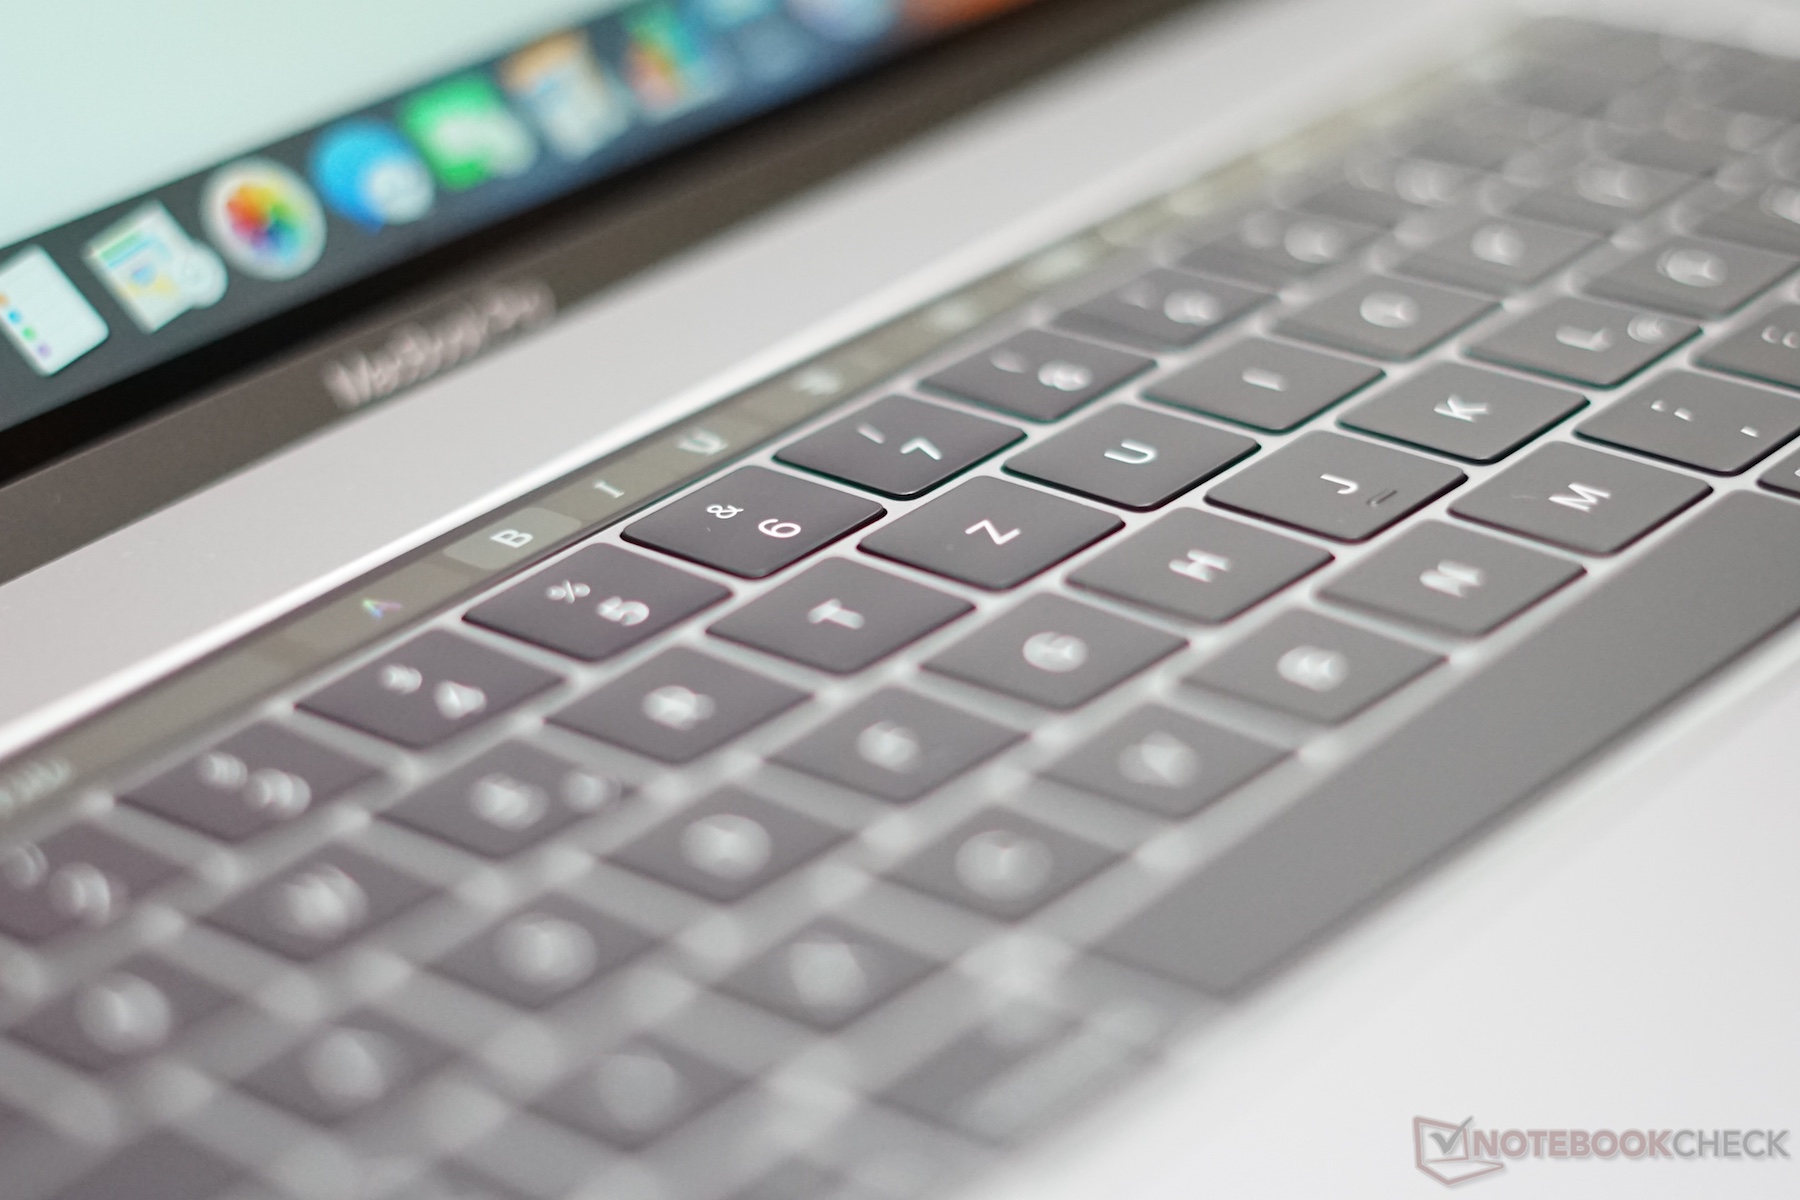
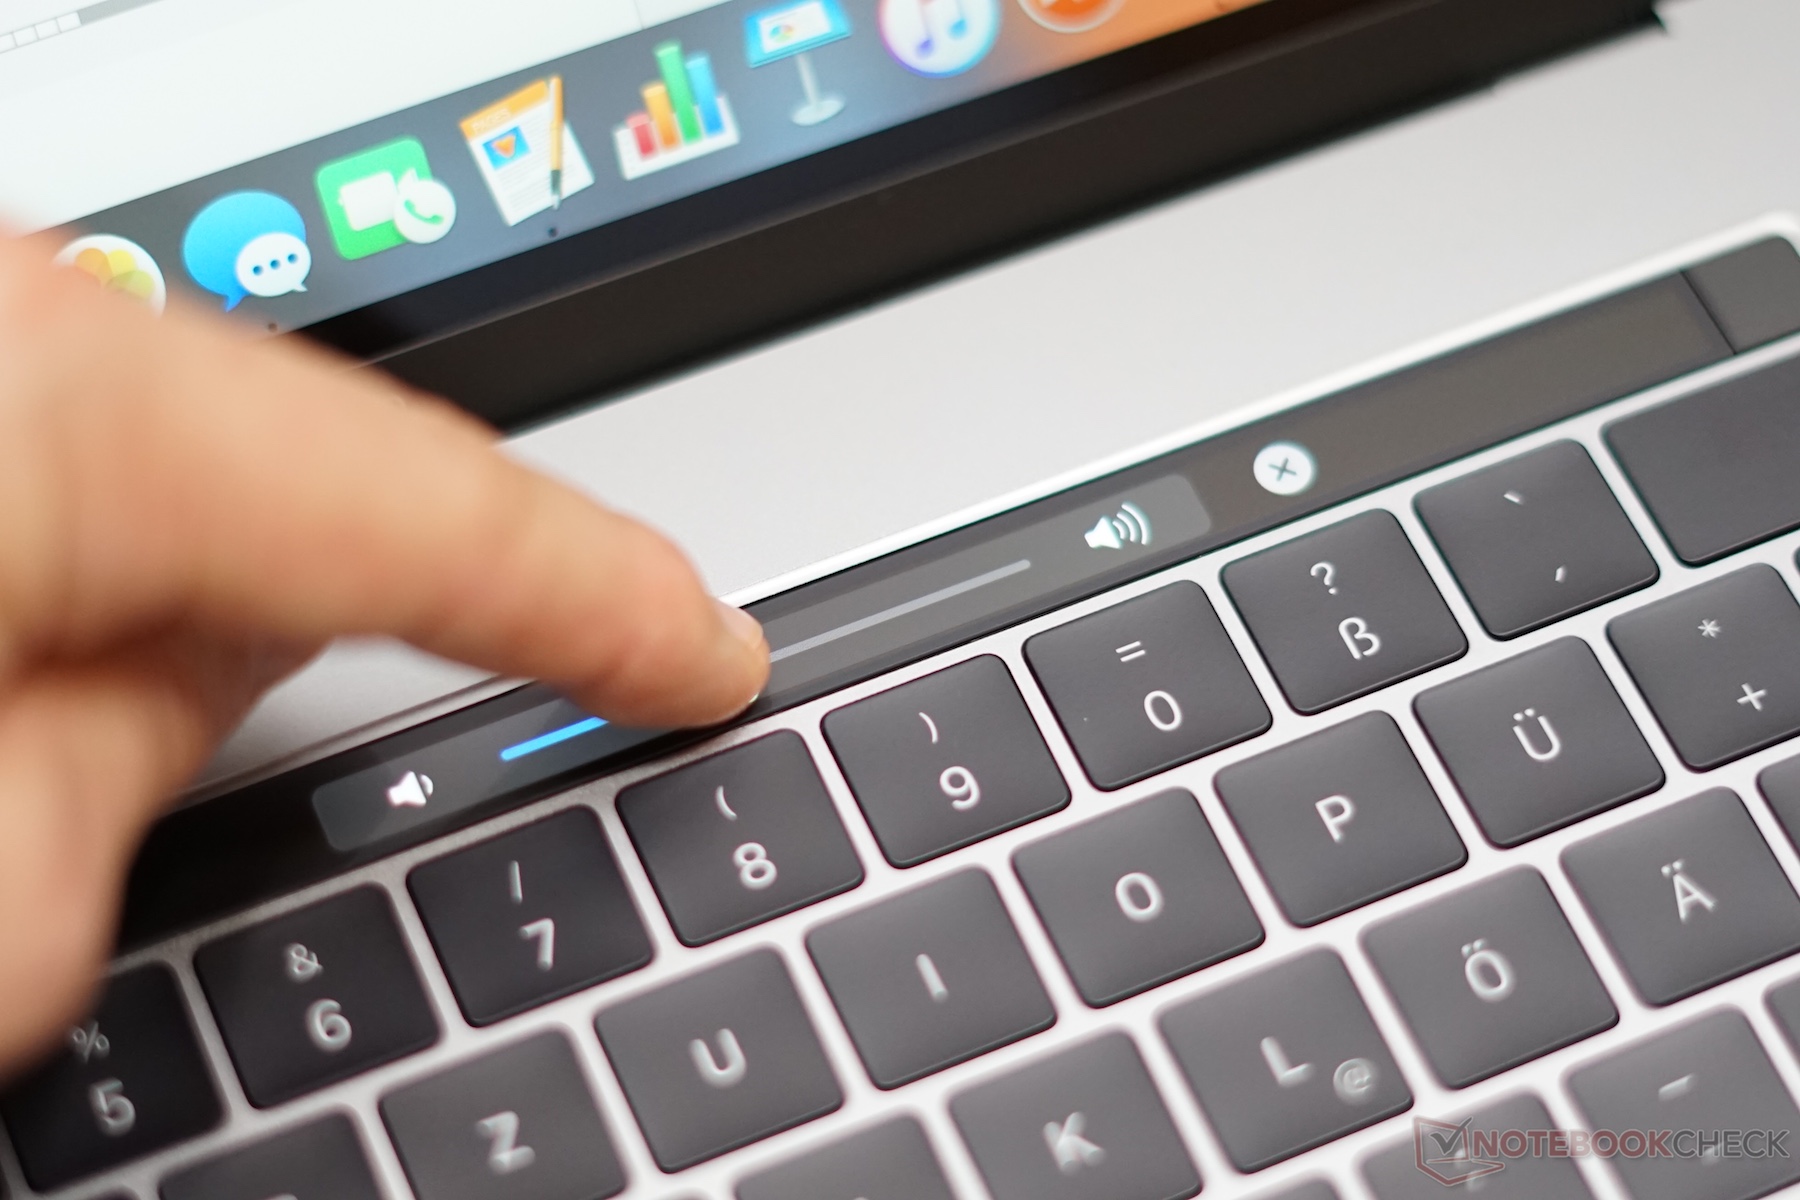
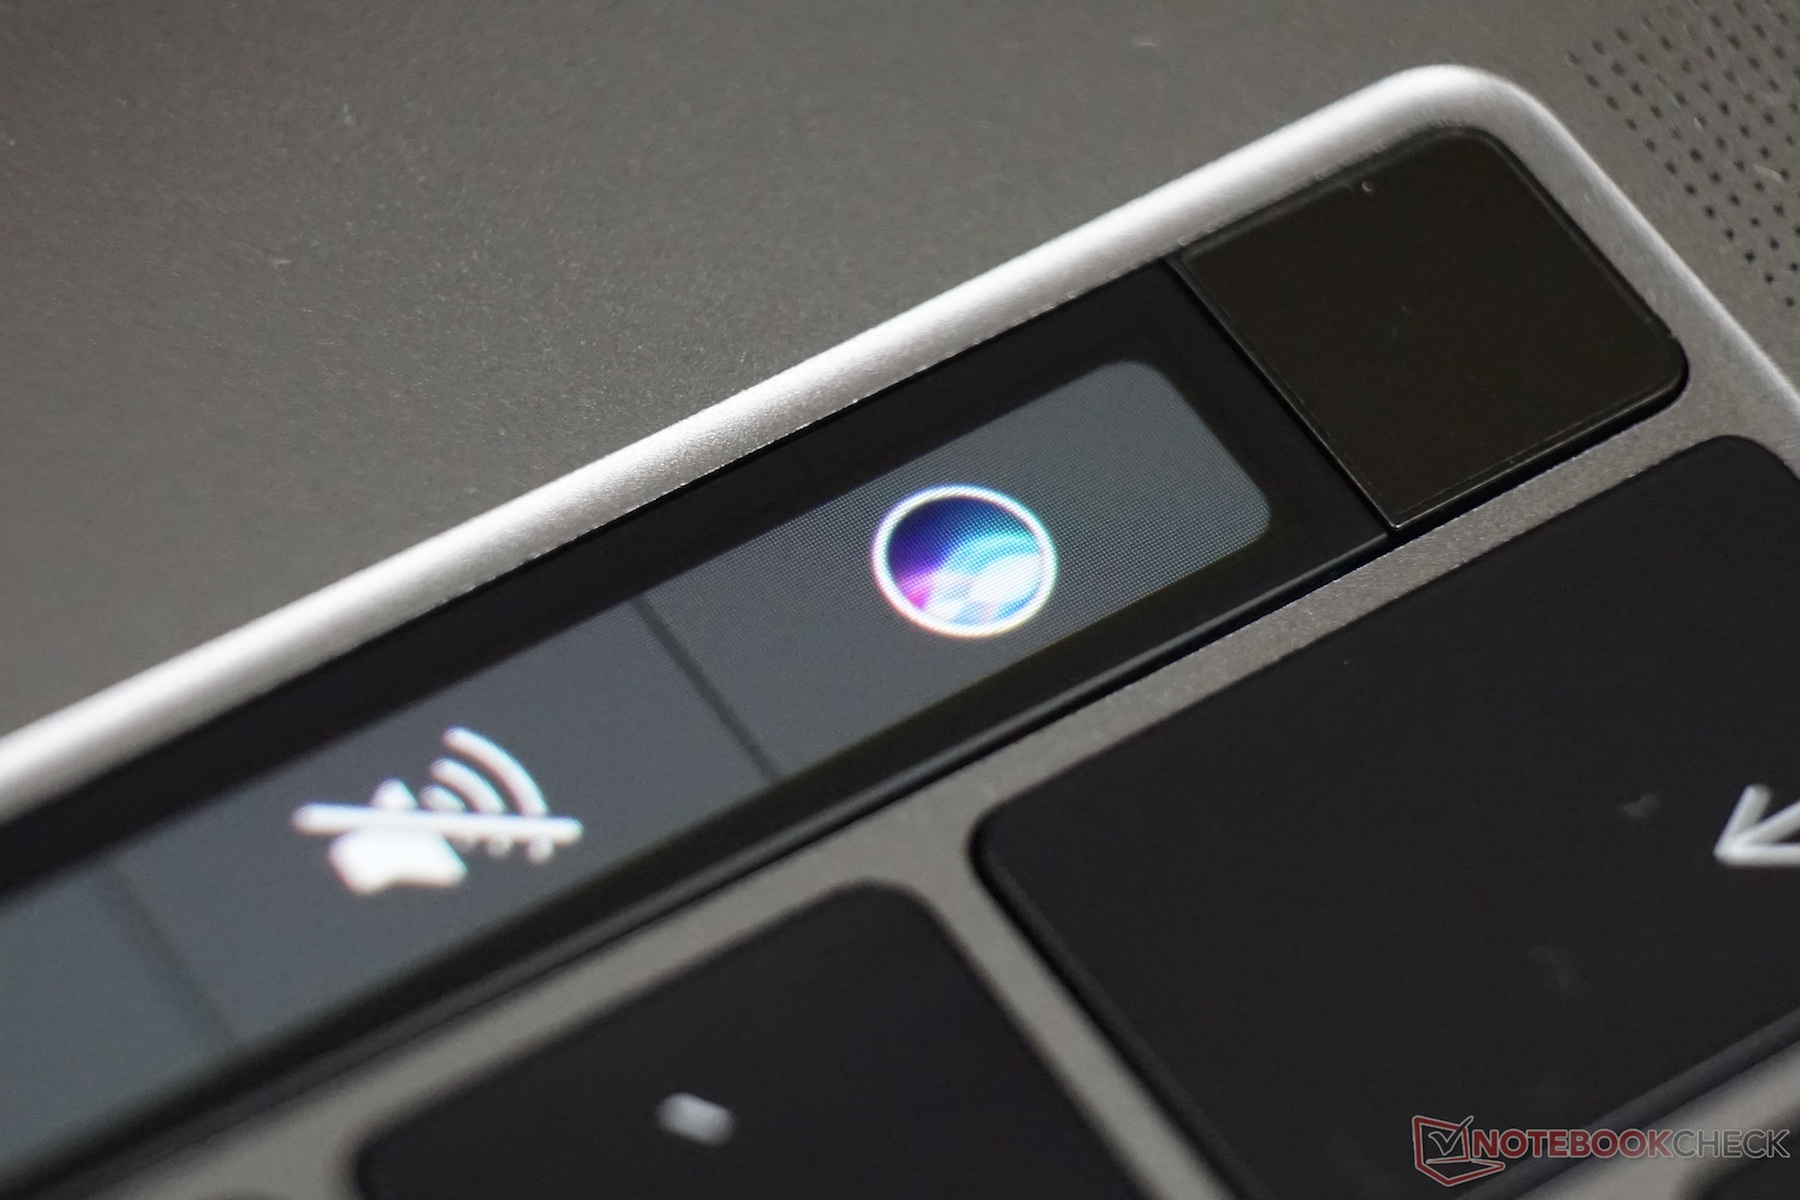
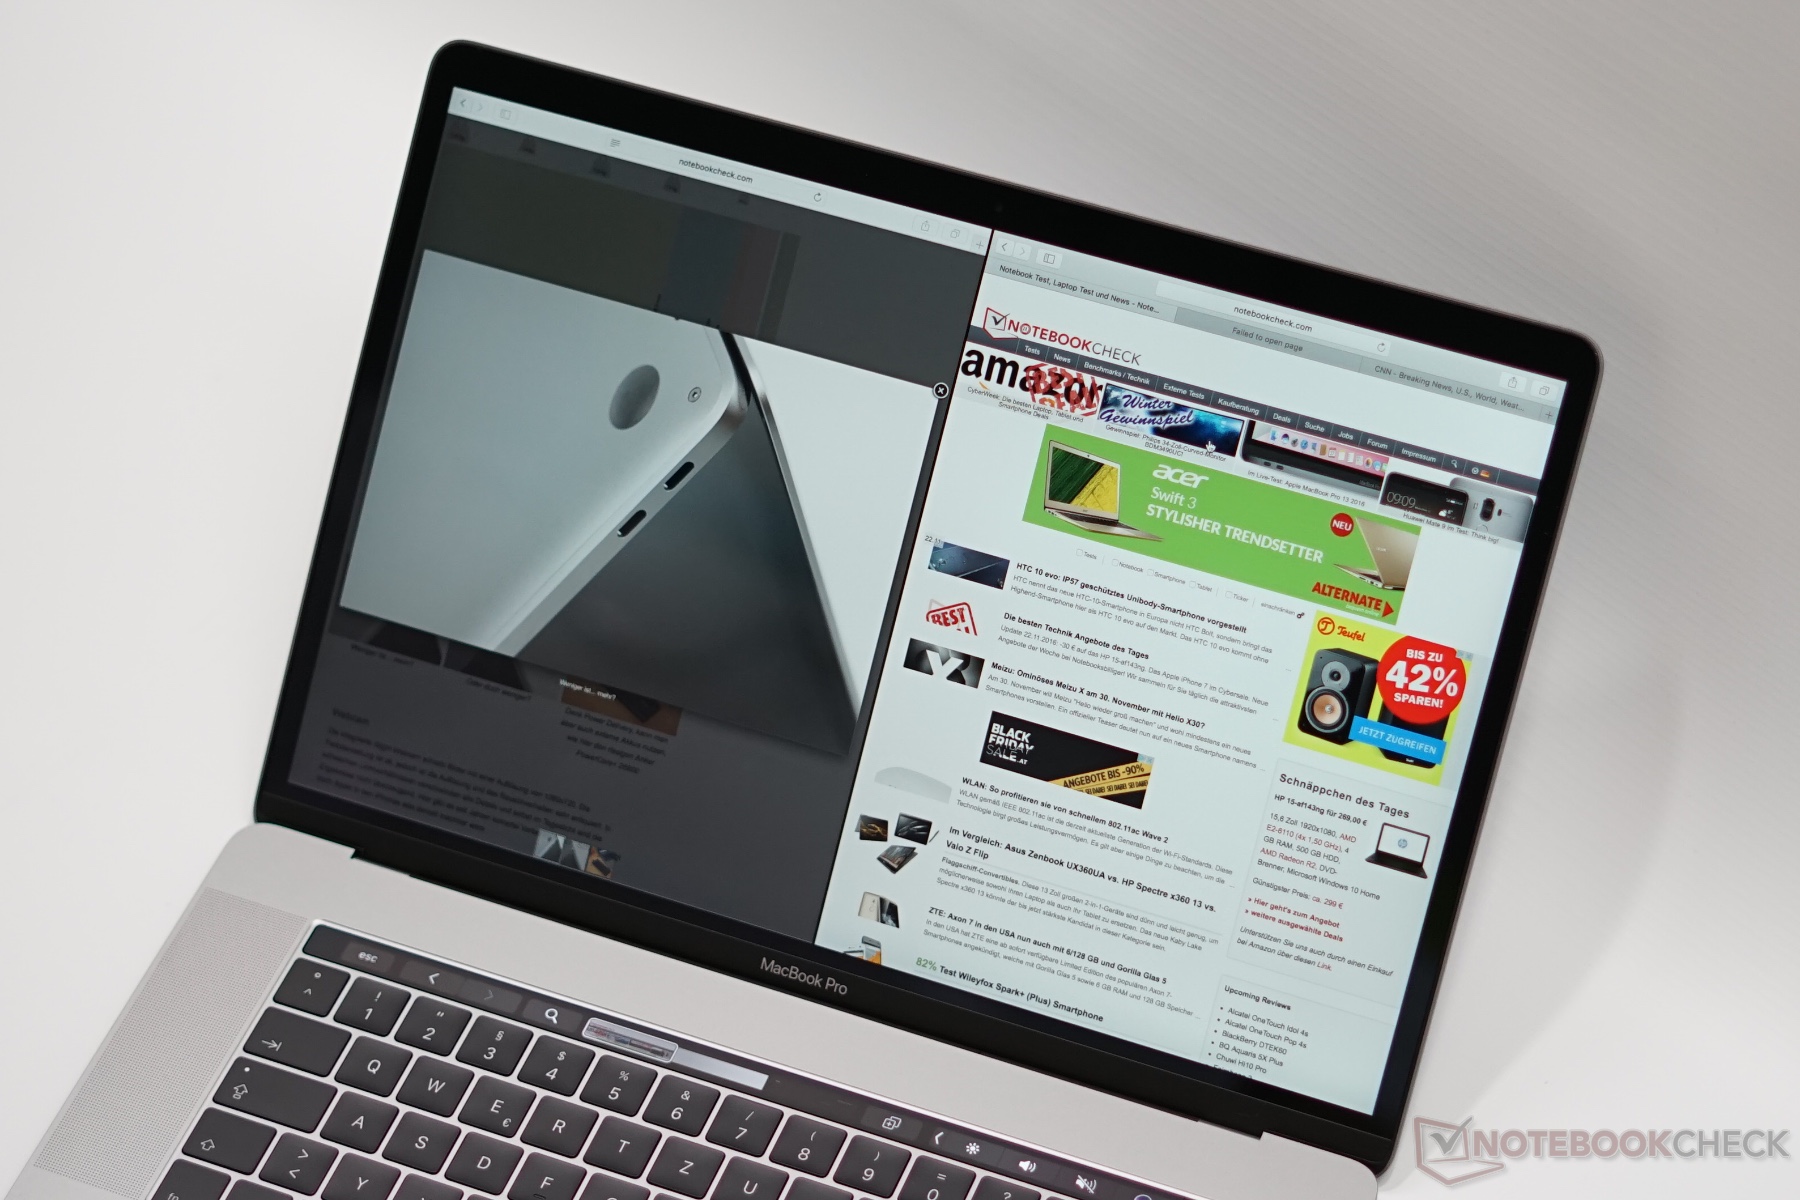
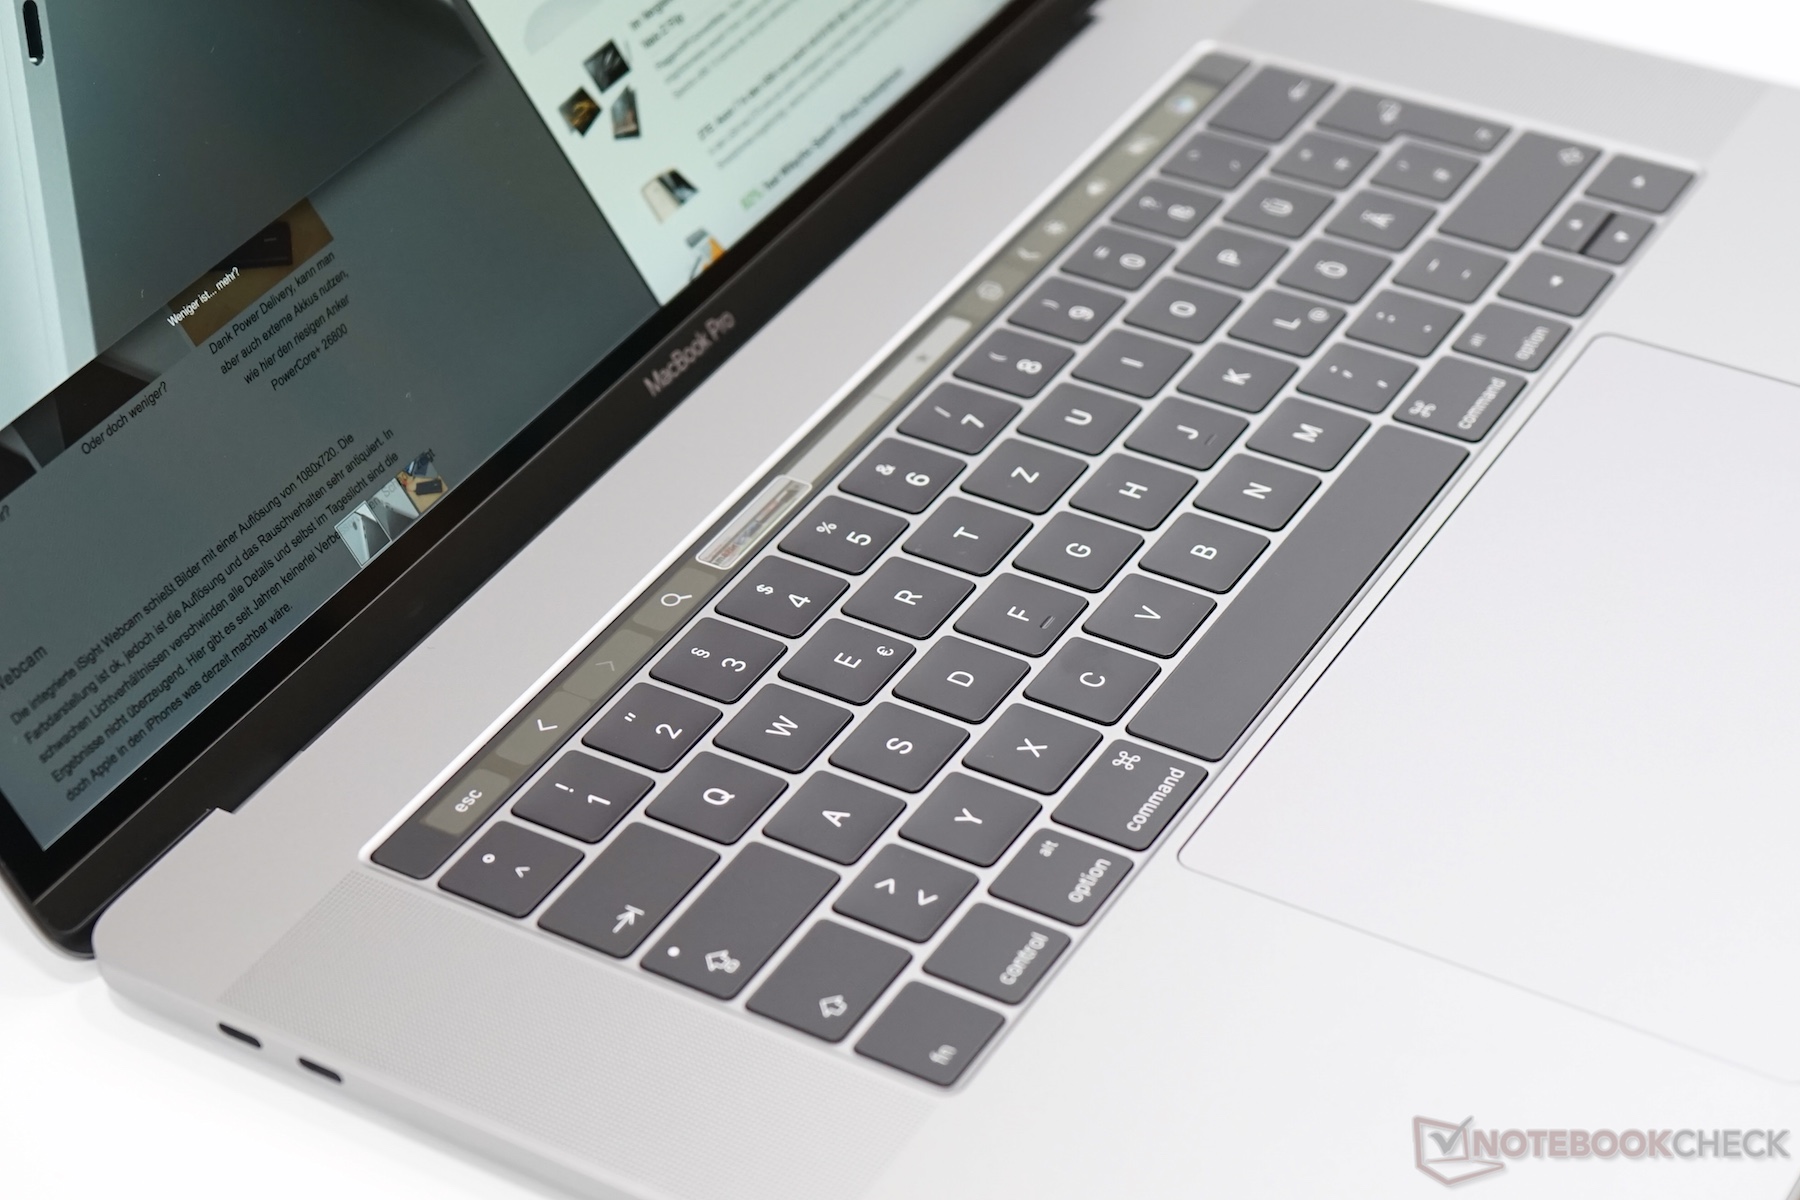
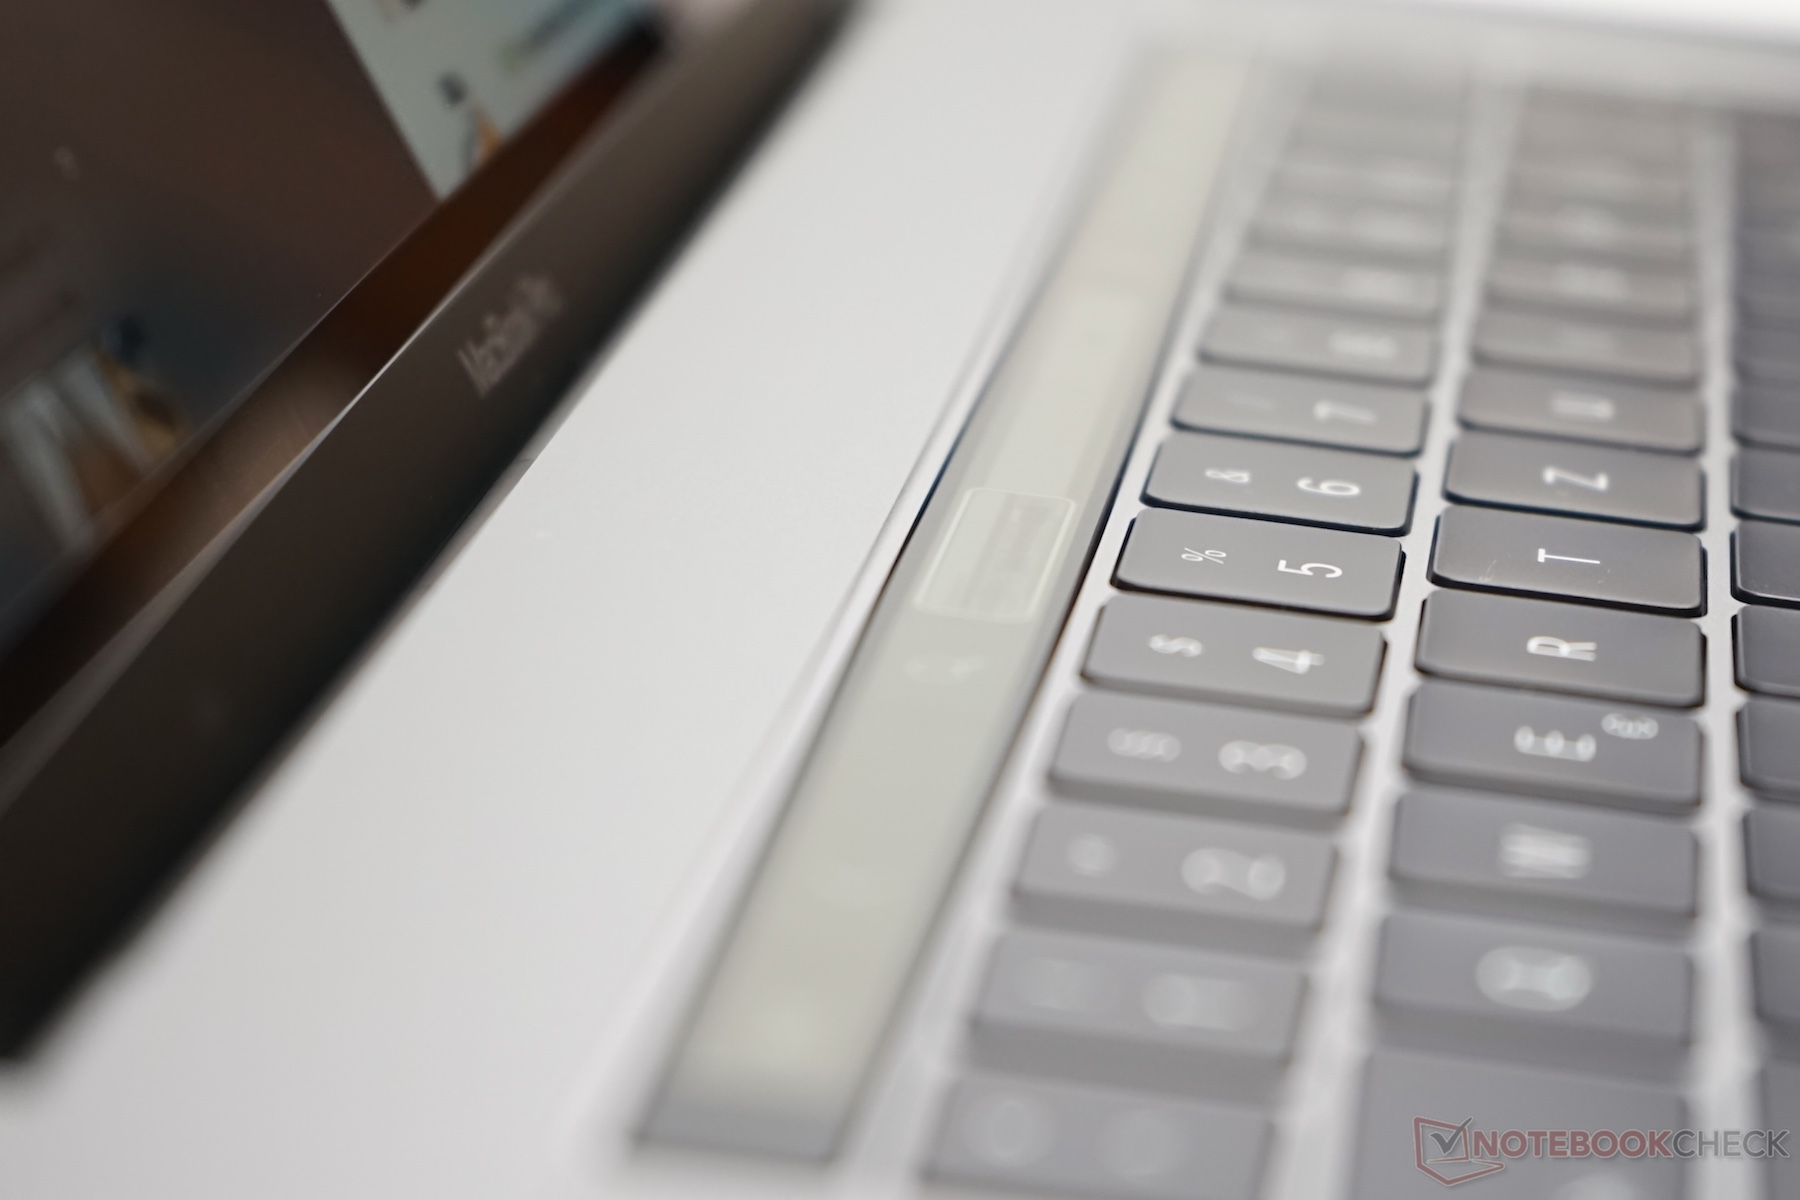
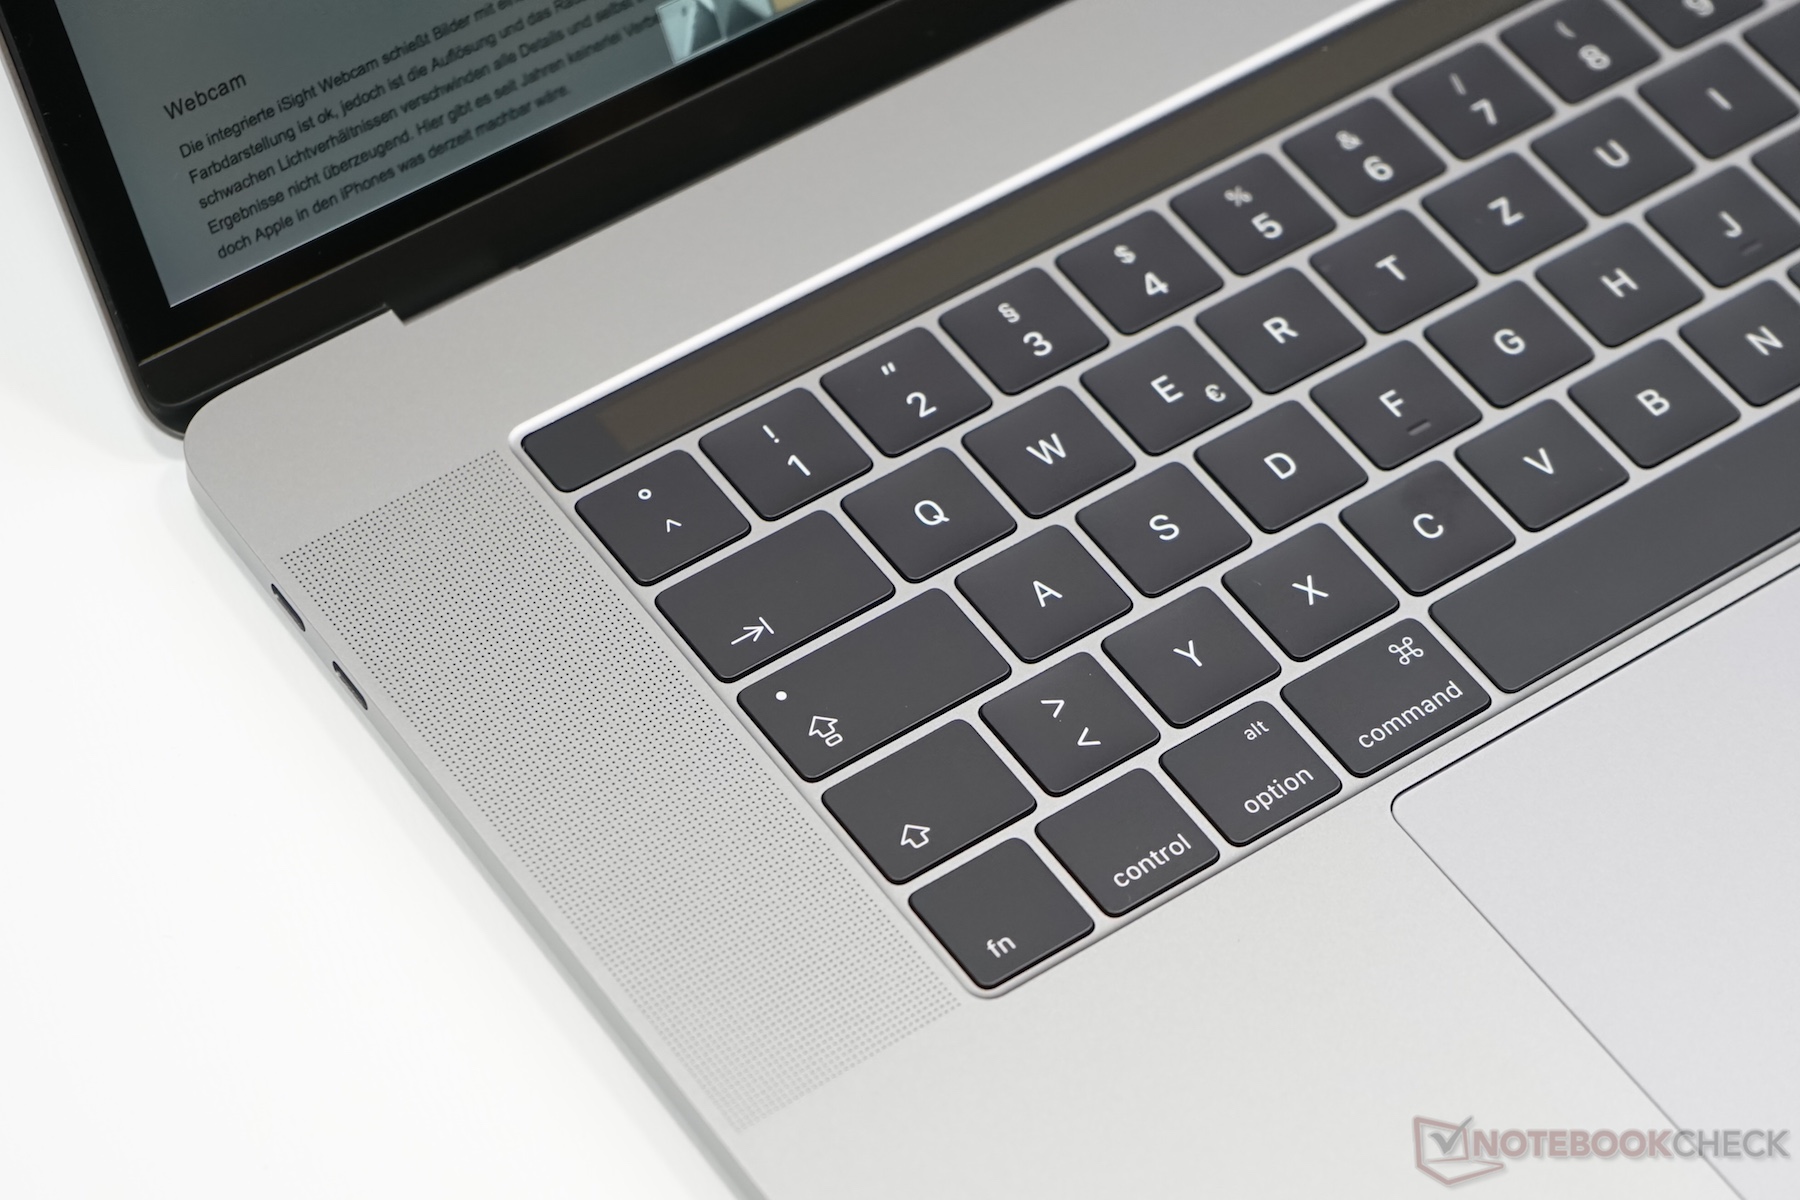
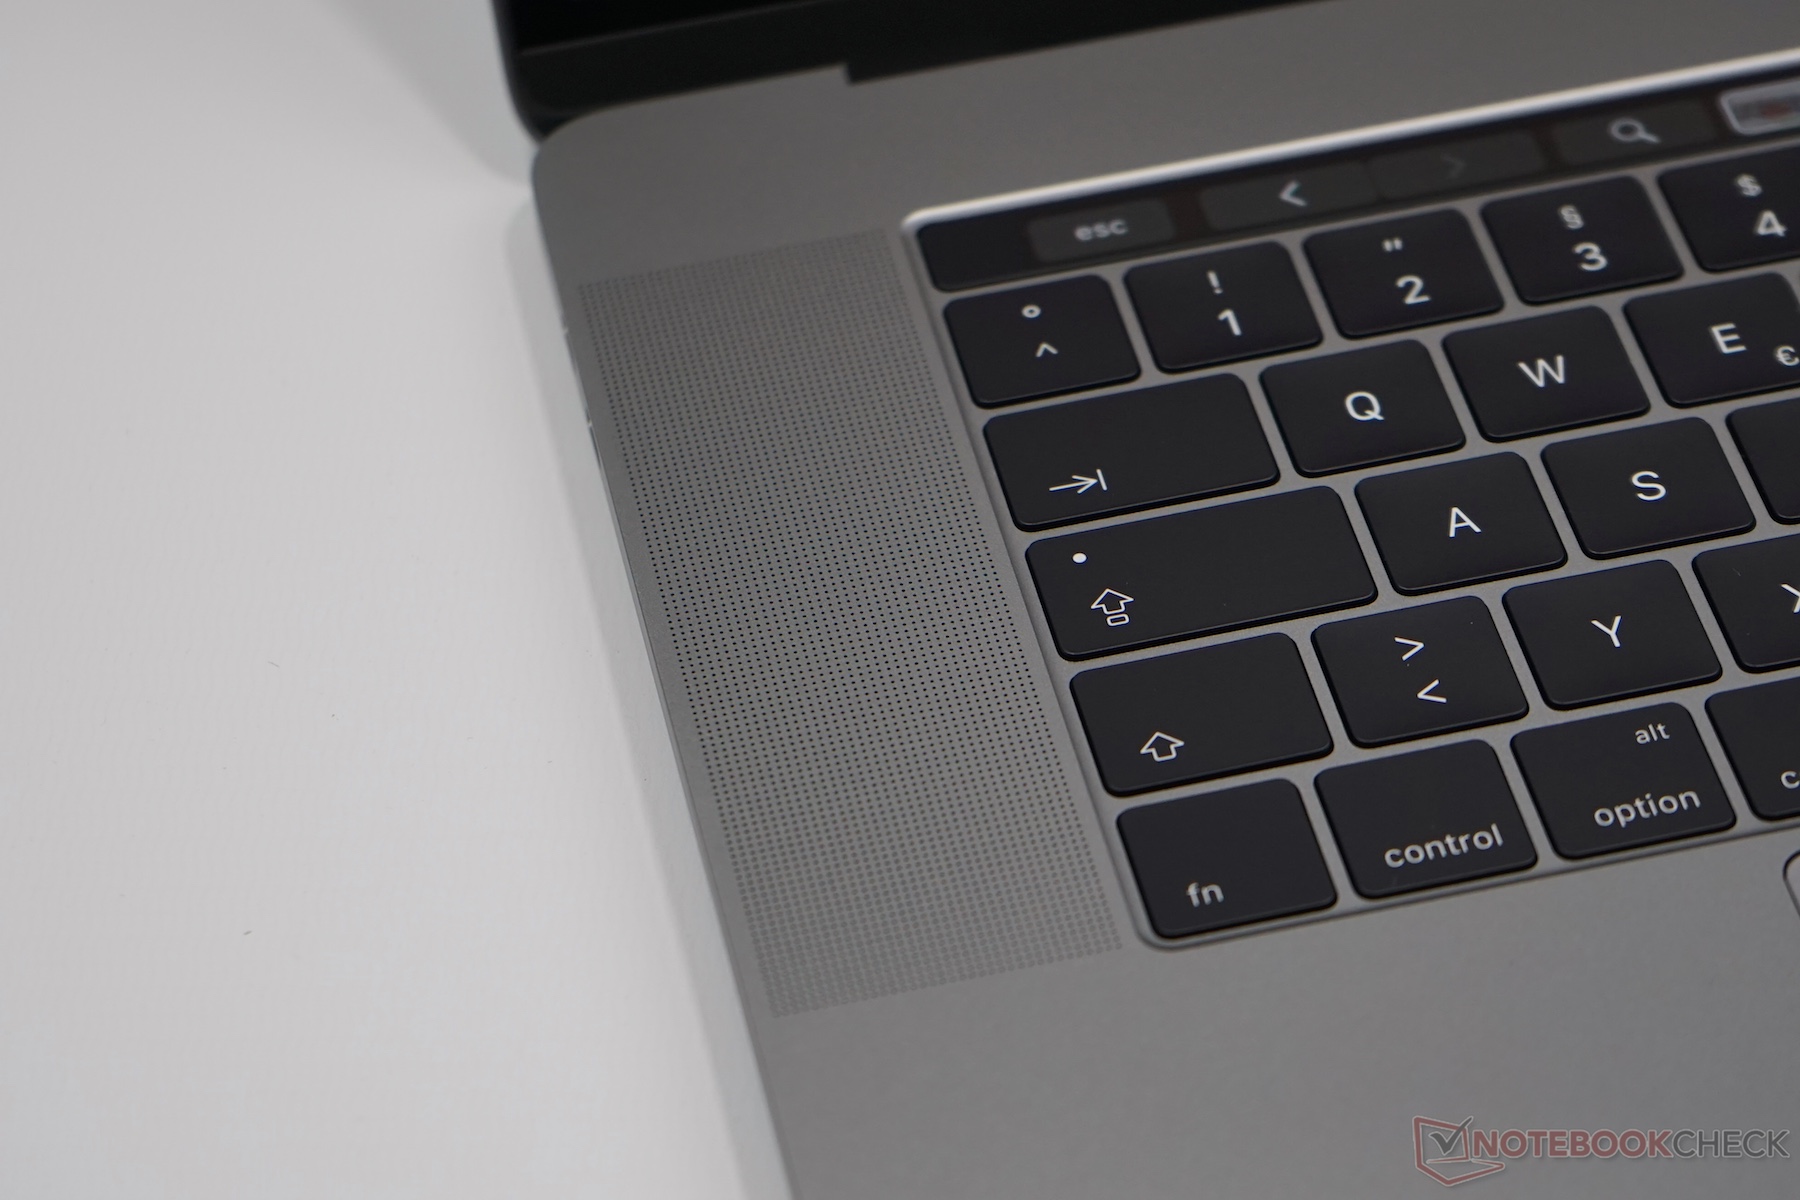
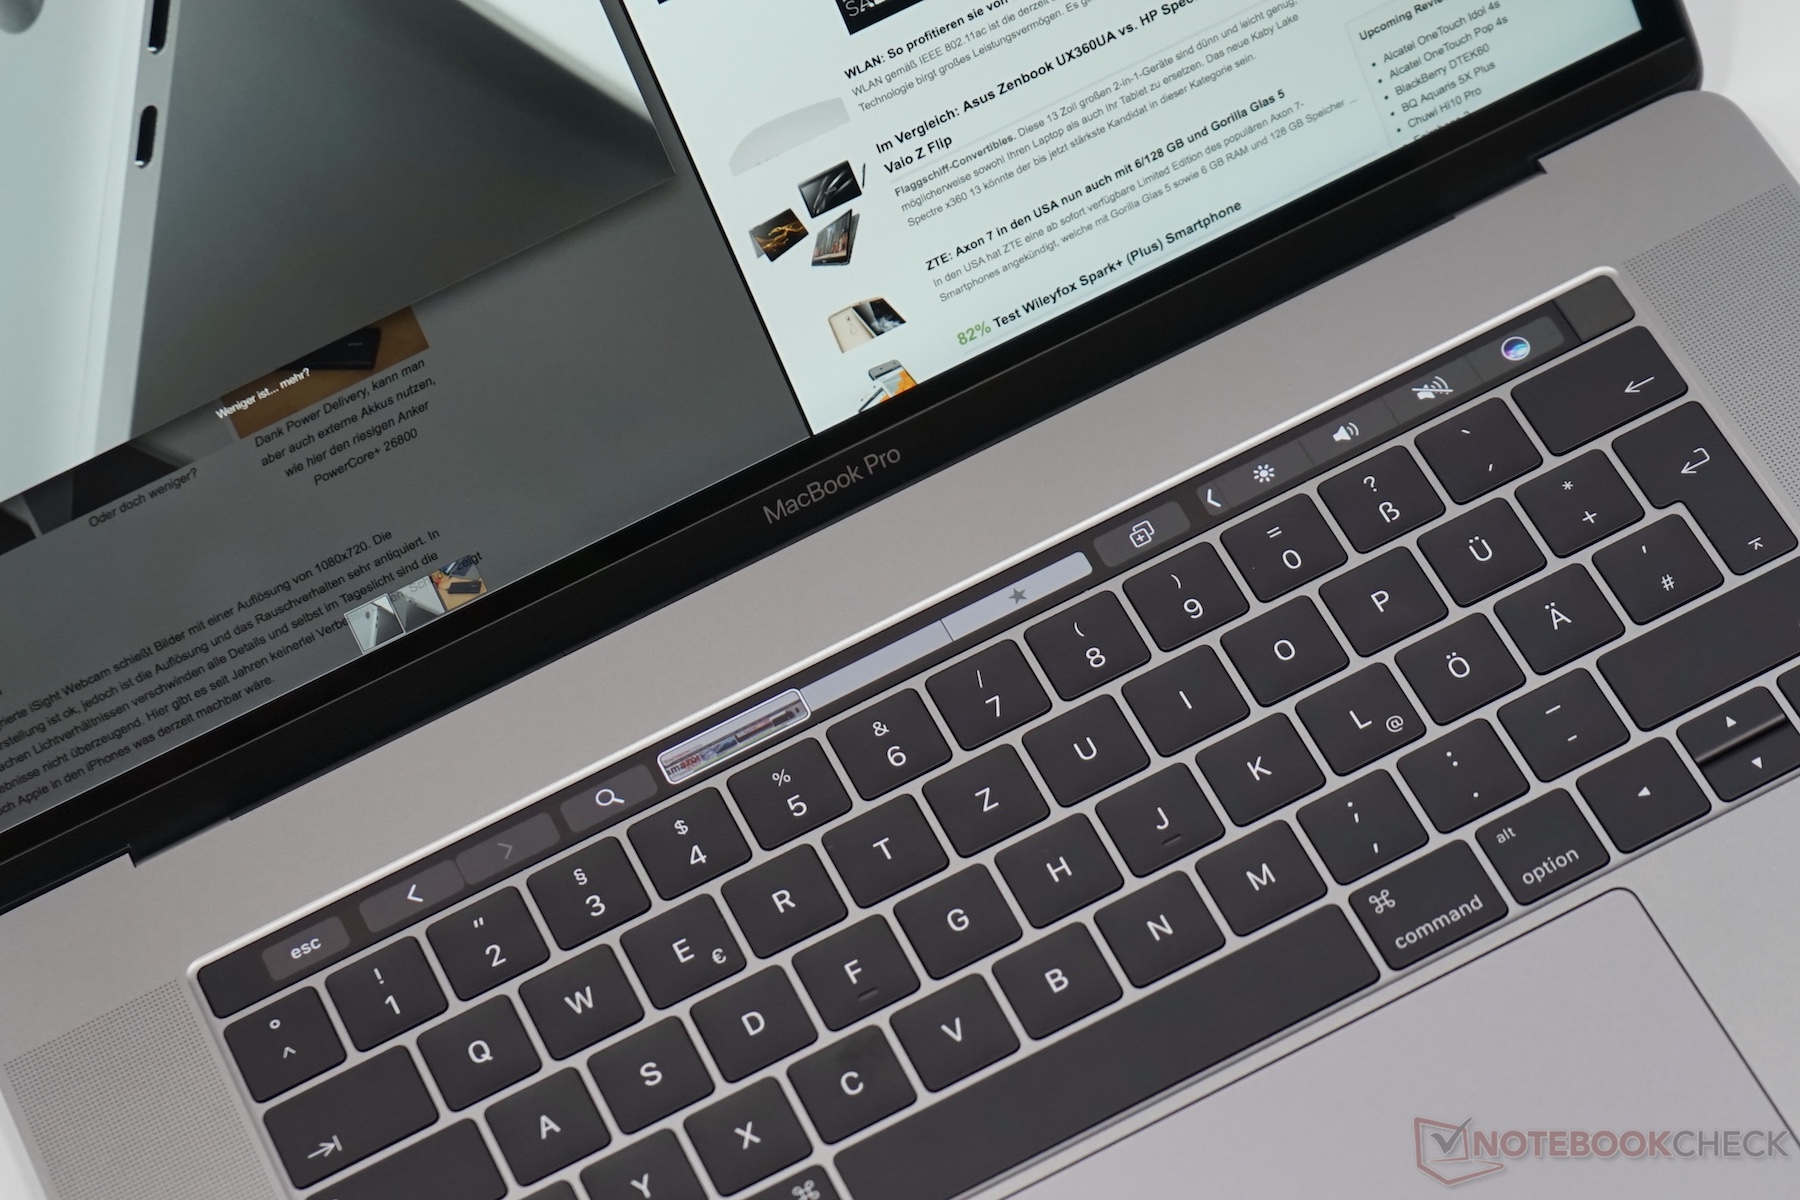
É mais complicado obter um veredicto sobre o teclado, assim como do touchpad. Similar aos dois modelo menores de 13-polegadas, a Apple utiliza suas própria segunda geração de switches Butterfly. O resultado é um deslocamento muito preciso das teclas, mas leva um tempo para se acostumar, em combinação com o deslocamento extremamente curto. Nós realmente gostamos do sensor de digitais dentro do botão de energia. O Touch Bar, bastante anunciado, foi bem implementado pela Apple, mas a usabilidade depende principalmente do suporte para software. Na prática, ele inclusive consegue fazer ações comuns (como controle de brilho ou volume, por exemplo) mais complicadas graças a um toque adicional. Em seu estado atual, achamos que é apenas um "gimmick".
Uma olhada no desempenho mostra que a Apple utiliza o melhor hardware em termos de processador móvel quad-core e GPUs mainstream que está disponível agora. No entanto, com os correspondentes chips Kaby Lake e GPUs mainstream da geração Pascal bem na volta da esquina, o MacBook Pro 15 pode ficar desatualizado muito em breve. Isto obviamente não é uma ótima perspectiva, especialmente para um aparelho que custará pelo menos $2399. Estamos um pouco surpresas de que a menor capacidade da bateria tenha sido compensada tão bem. A duração é afetada quando você realmente estressa o sistema, mas a Apple, de fato, conseguiu melhorar as durações nos testes práticos.
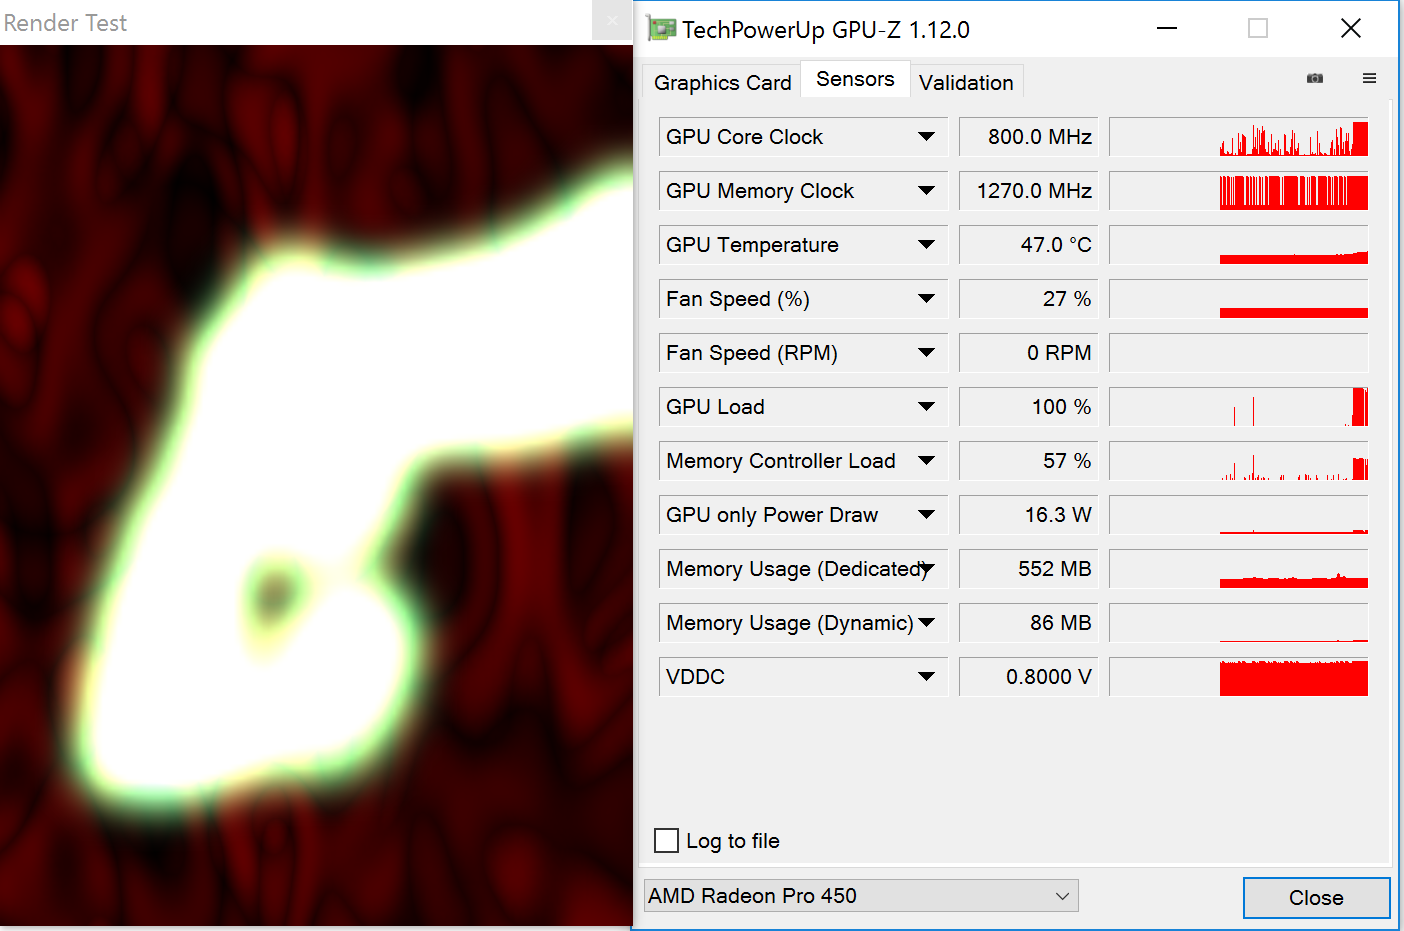
Em nossa opinião, os maiores problemas além do preço são os bugs e a situação das portas. Atualmente existem problemas com as conexões WLAN em redes de 2,4 GHz quando um aparelho com USB-C é conectado. Similar ao irmão menor, isto resulta na dedução de um ponto da avaliação final (- 2%). Também pode haver problemas com os alto falantes quando você instala Windows via BoootCamp (nosso modelo de teste foi afetado) e a placa de vídeo pode provocar erros. Ambos os problemas devem ser resolvidos com atualizações futuras ou que já foram liberadas, segundo a Apple.
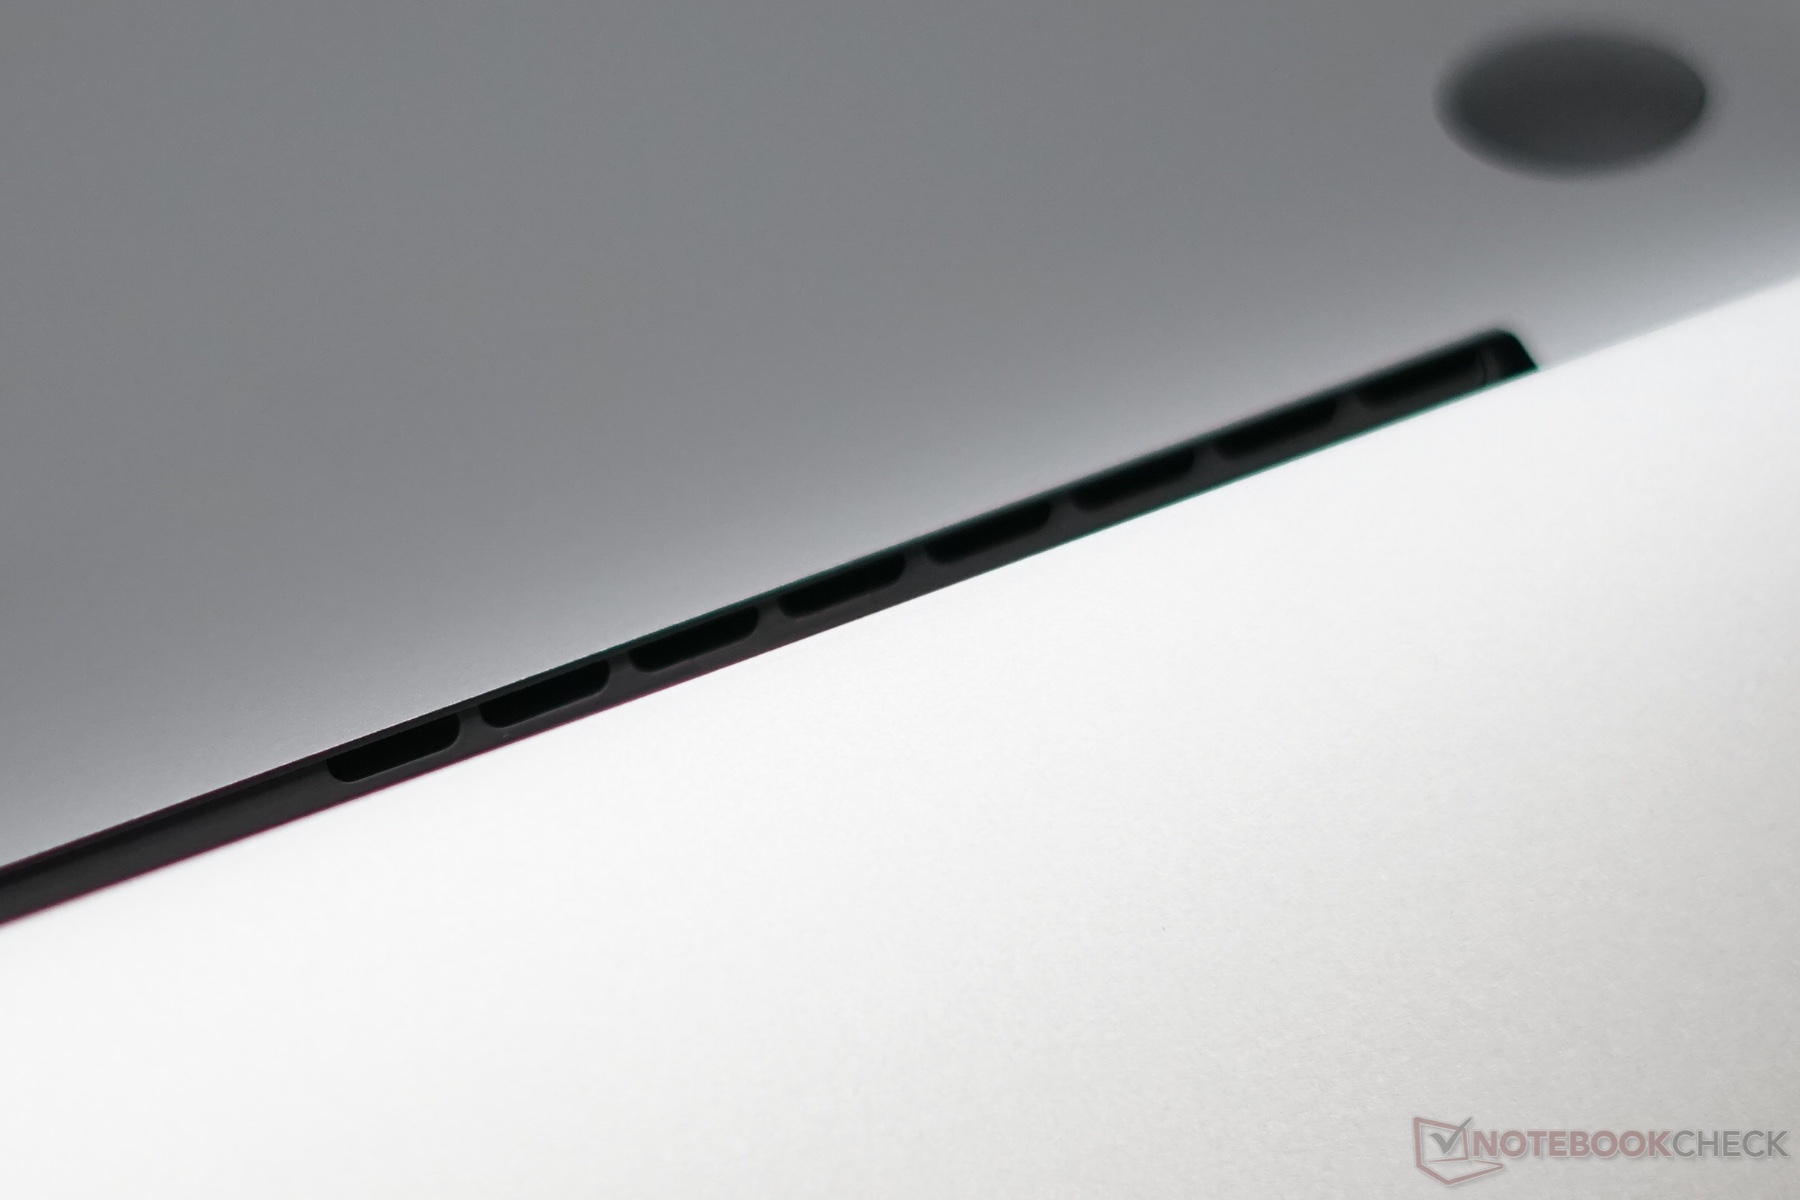
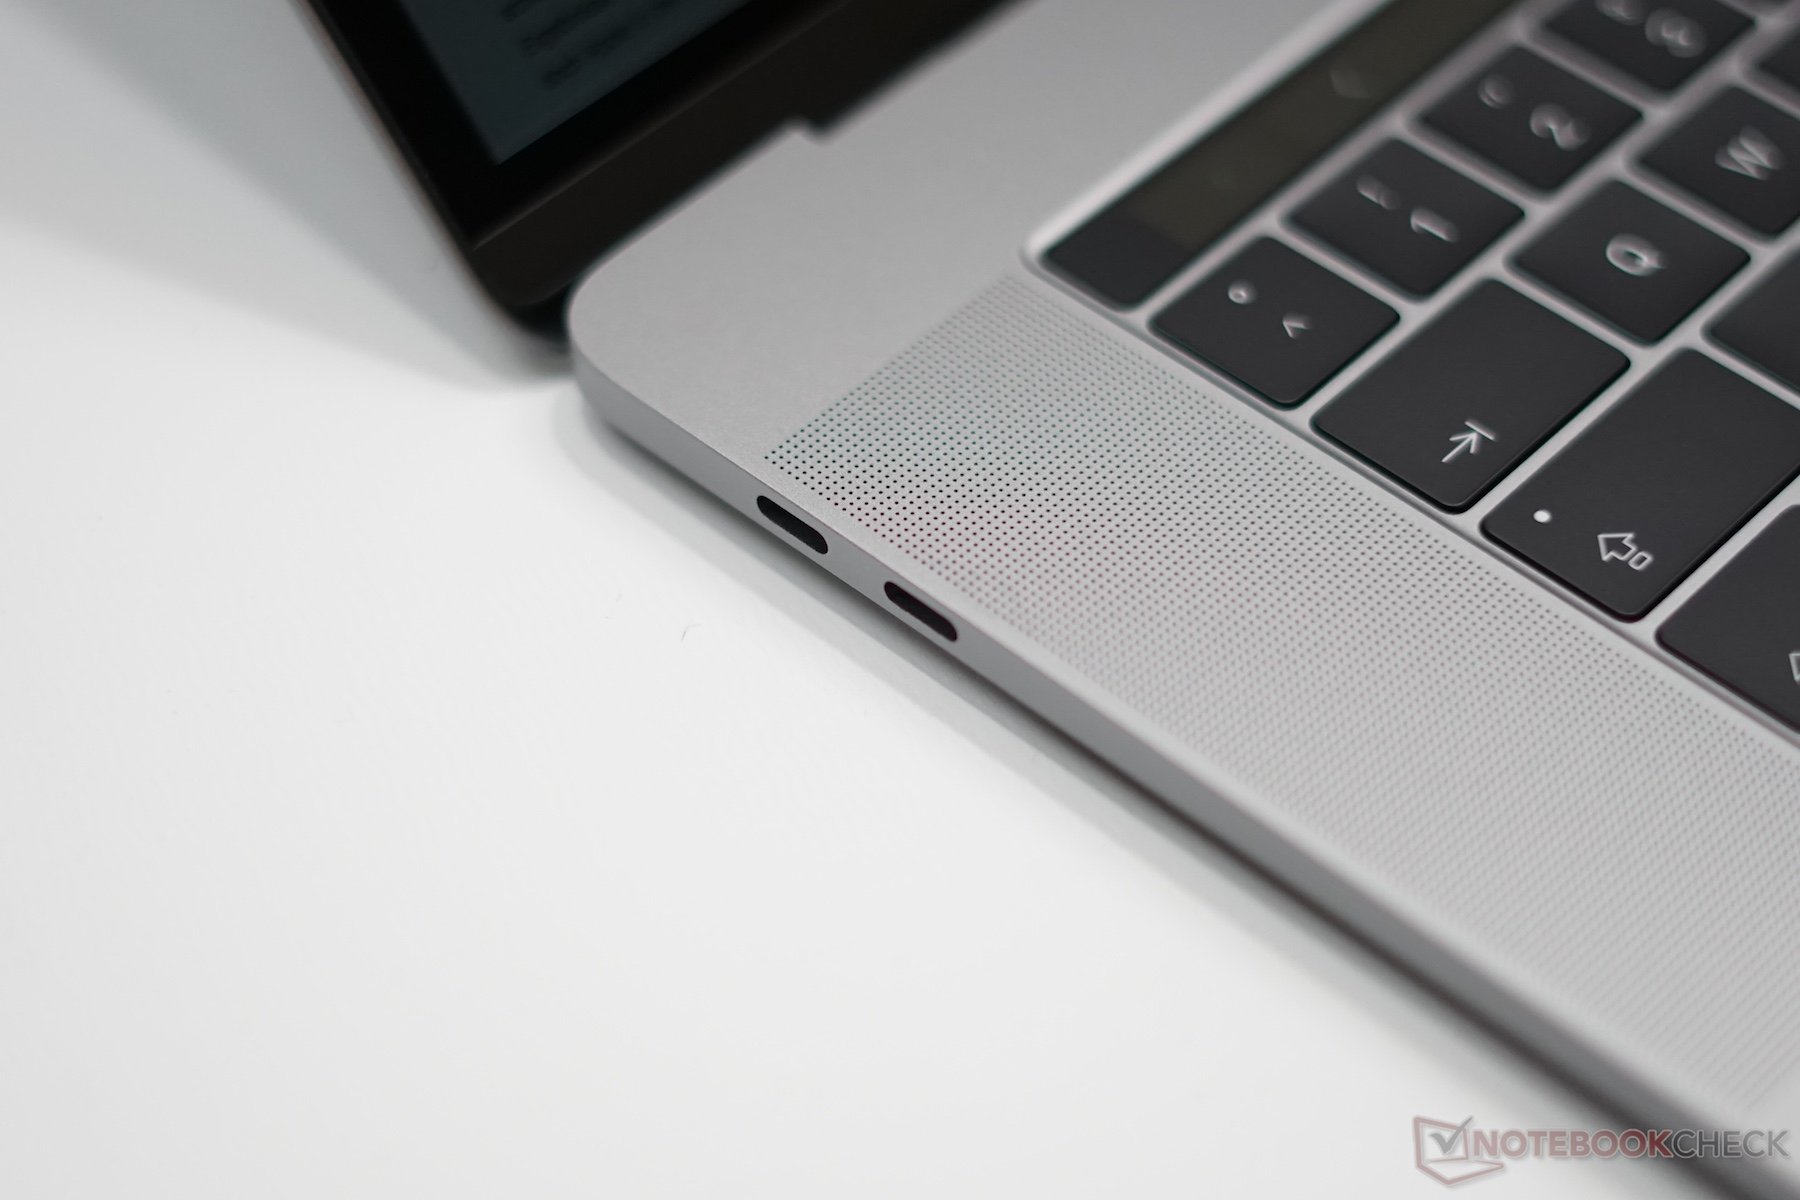
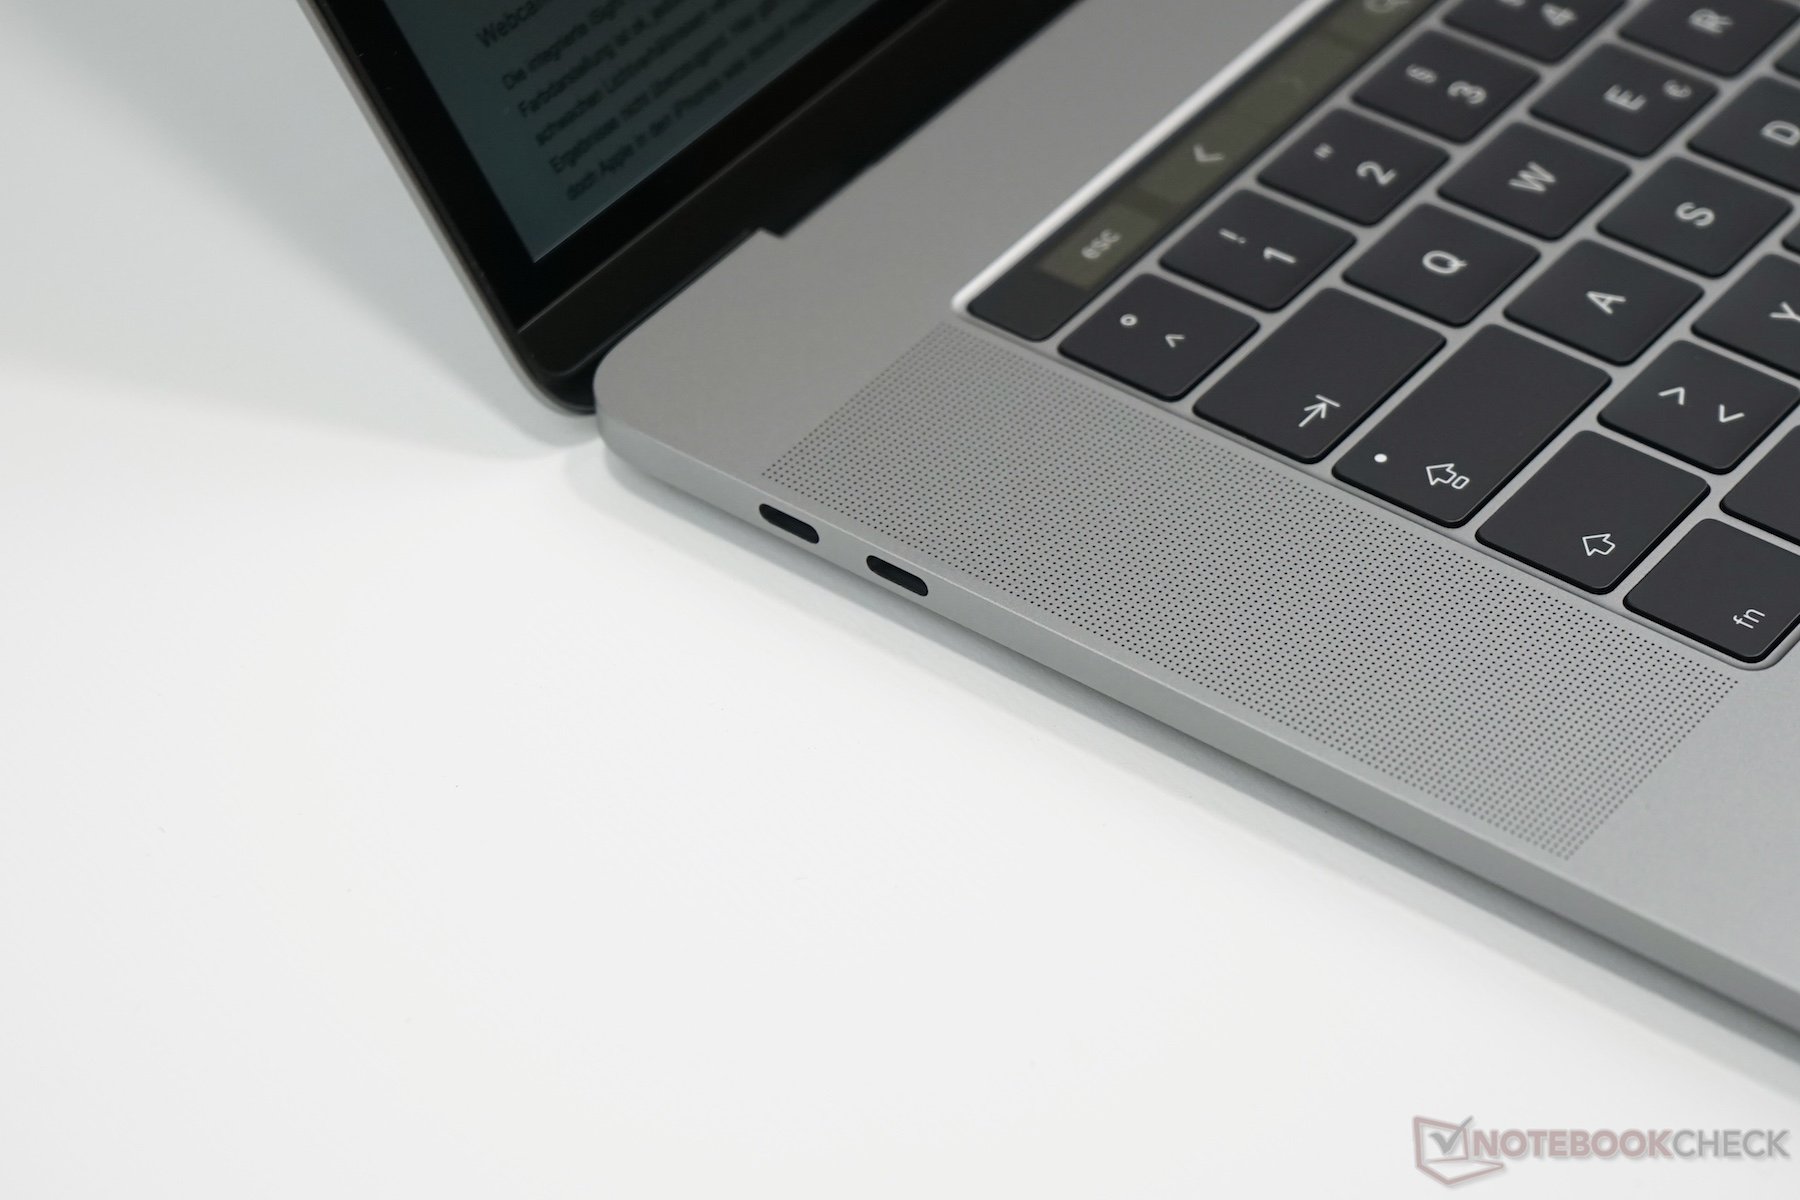
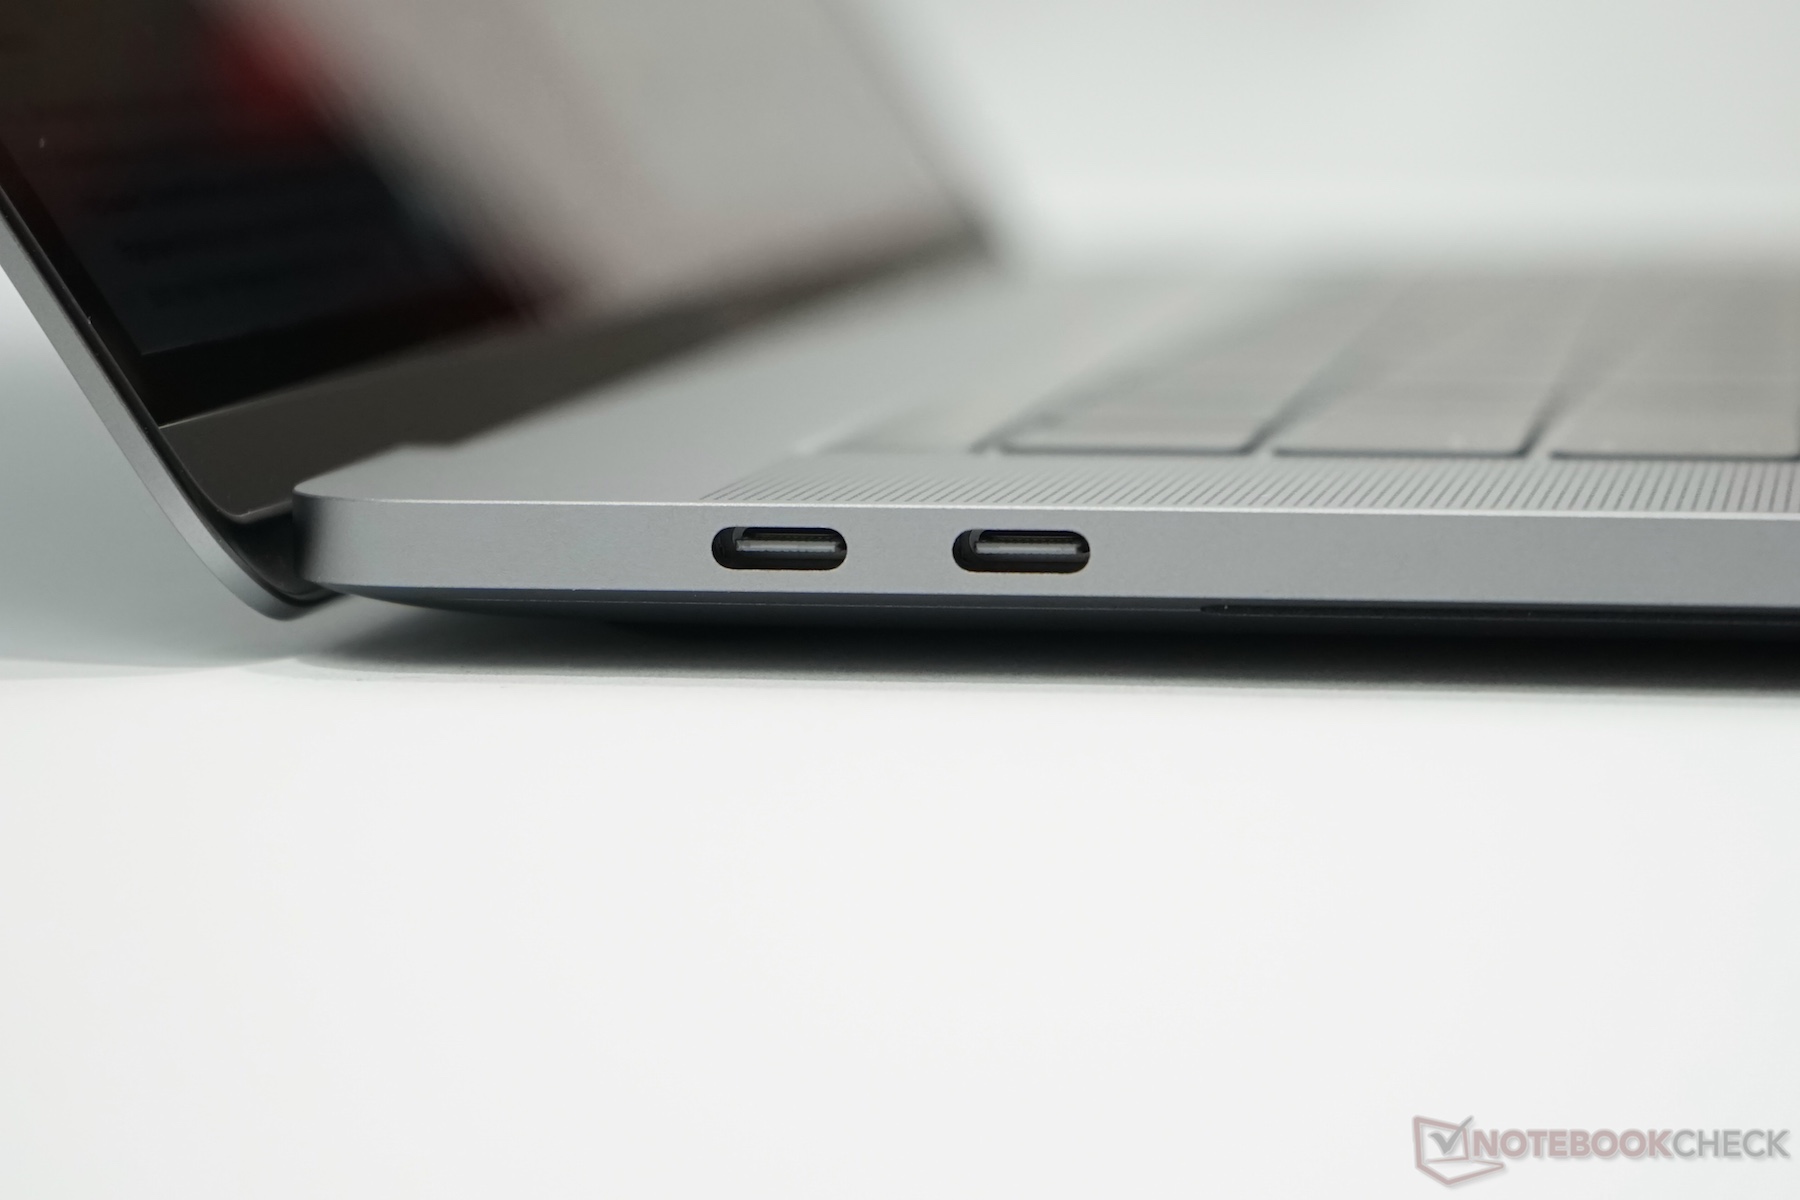
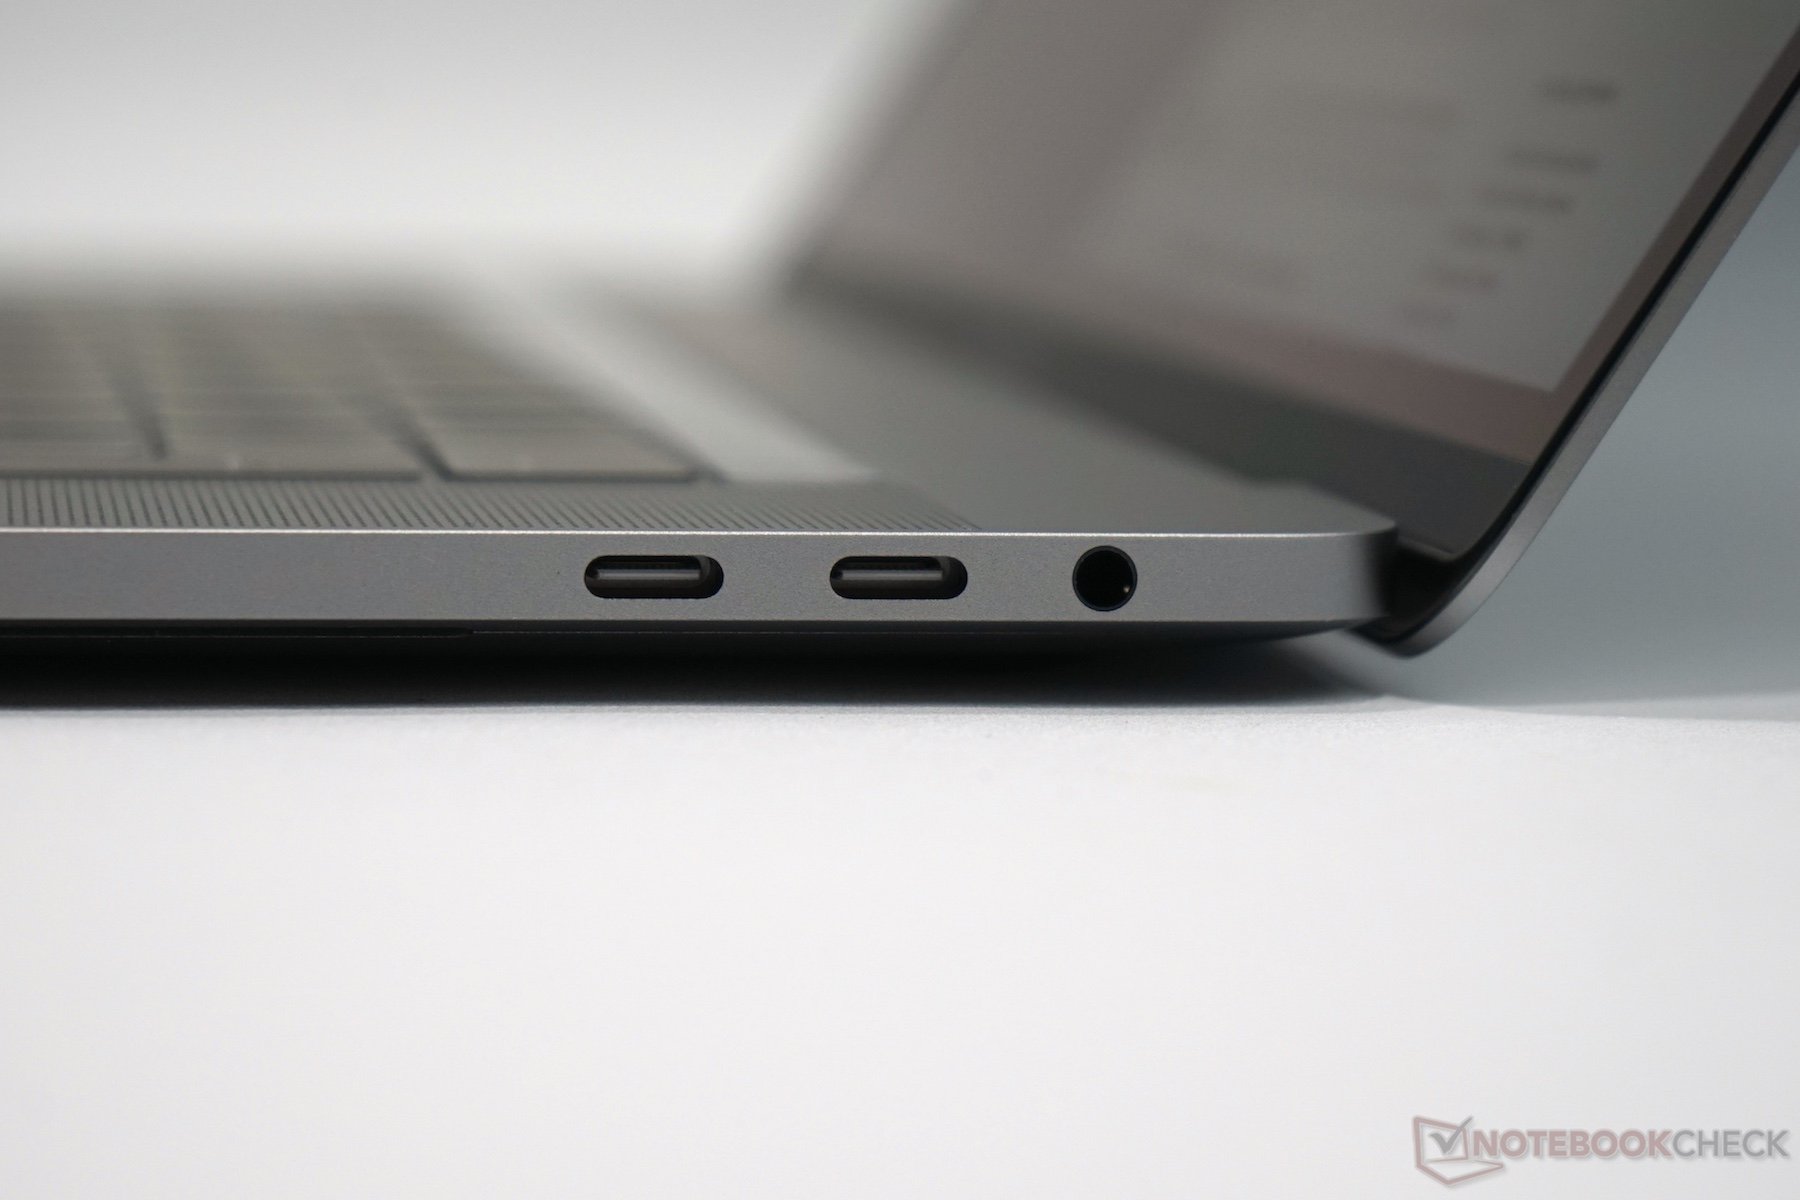
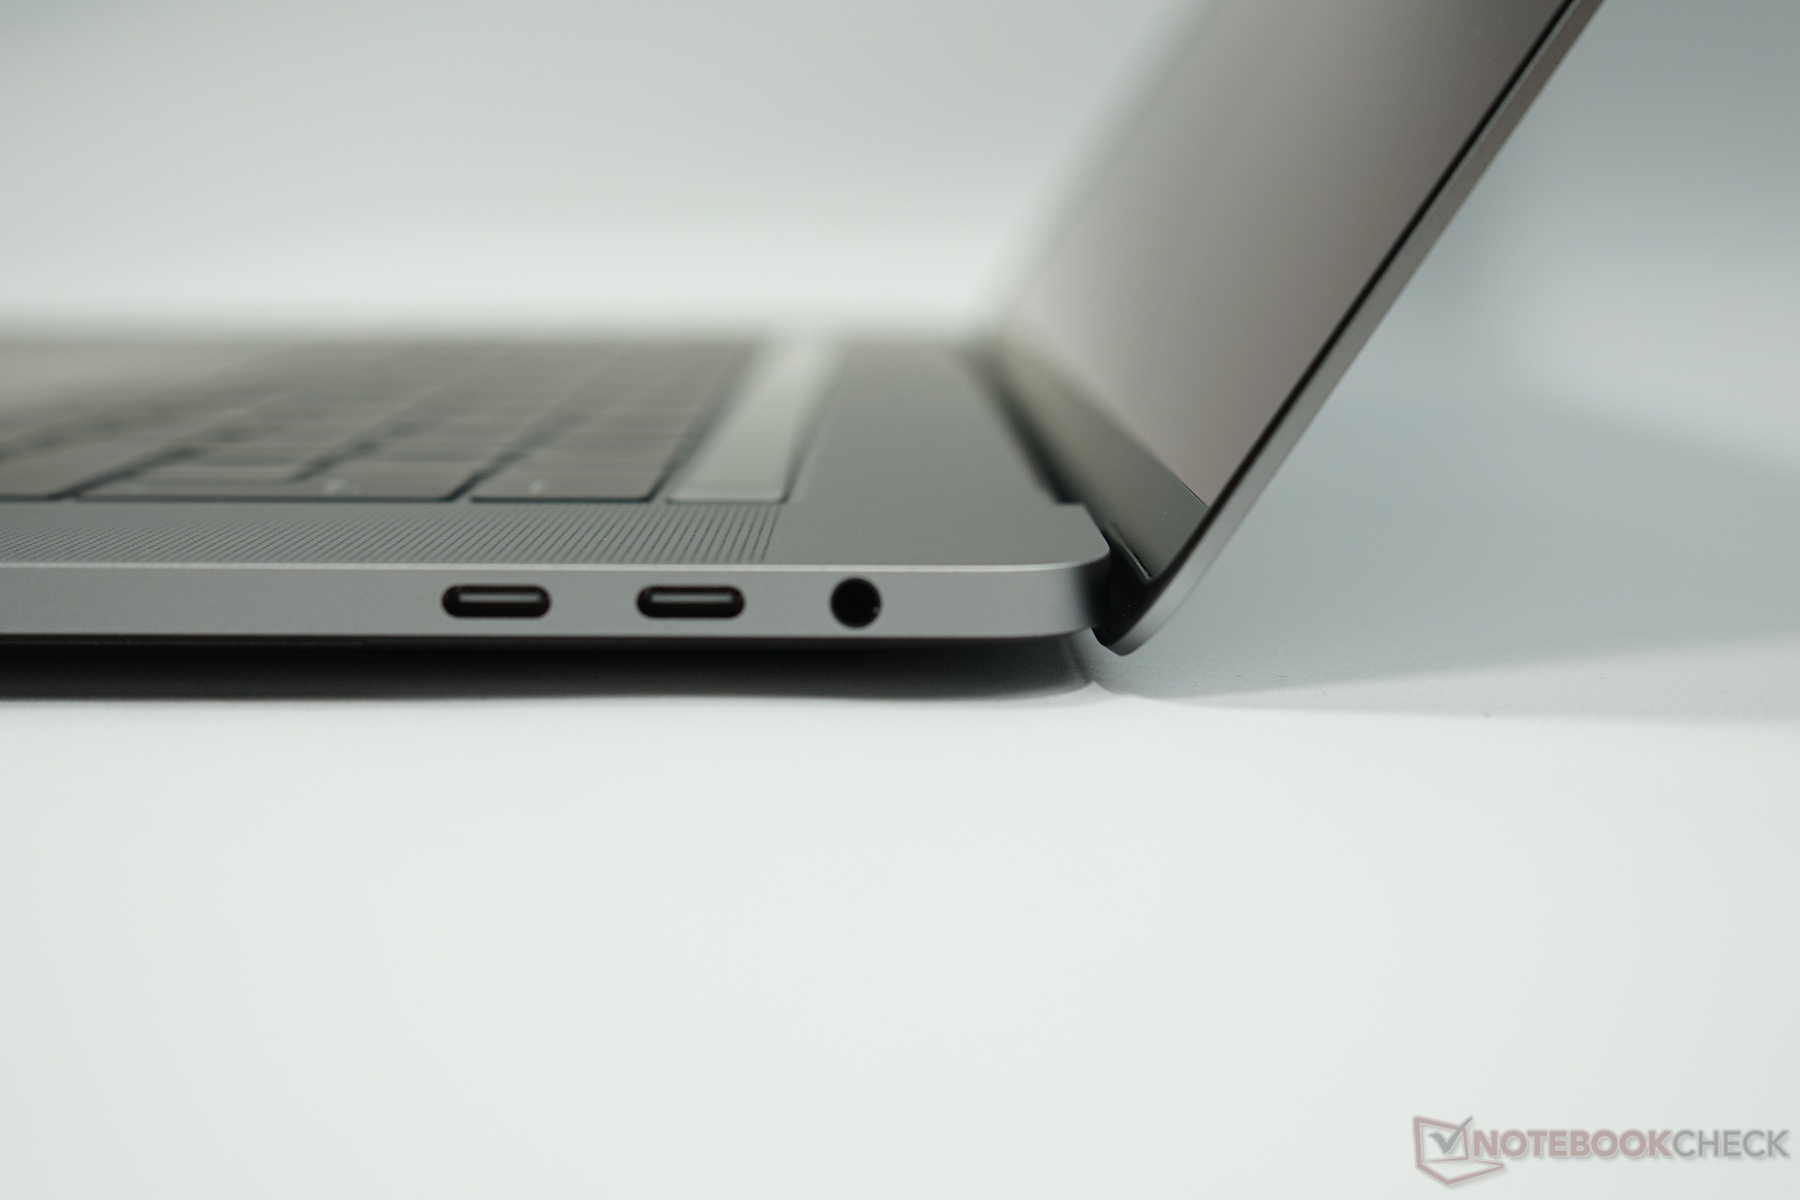
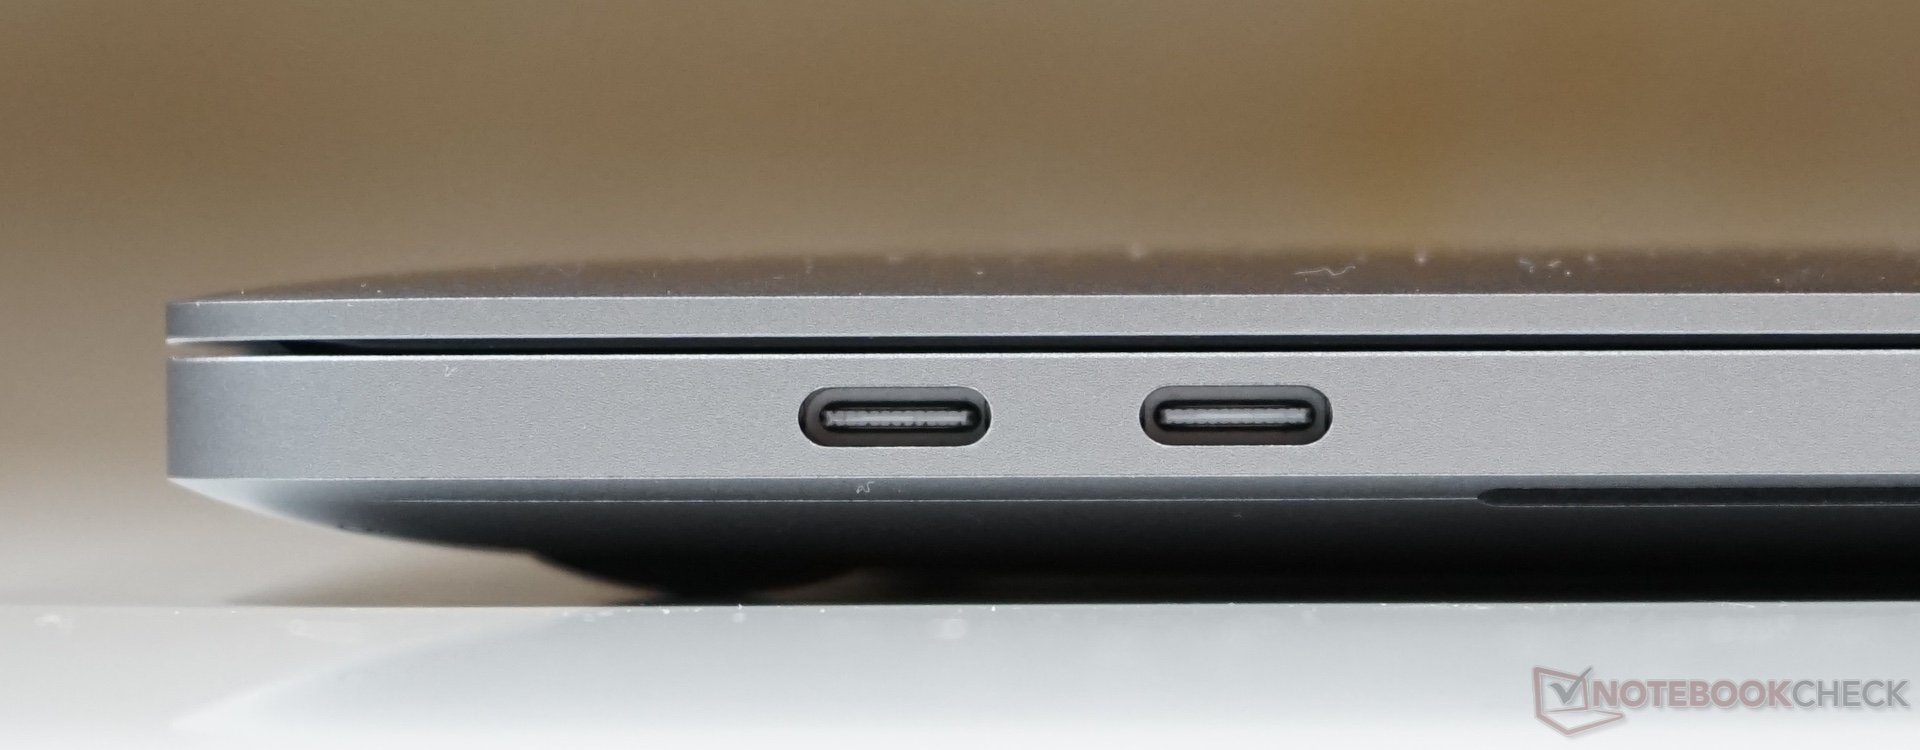
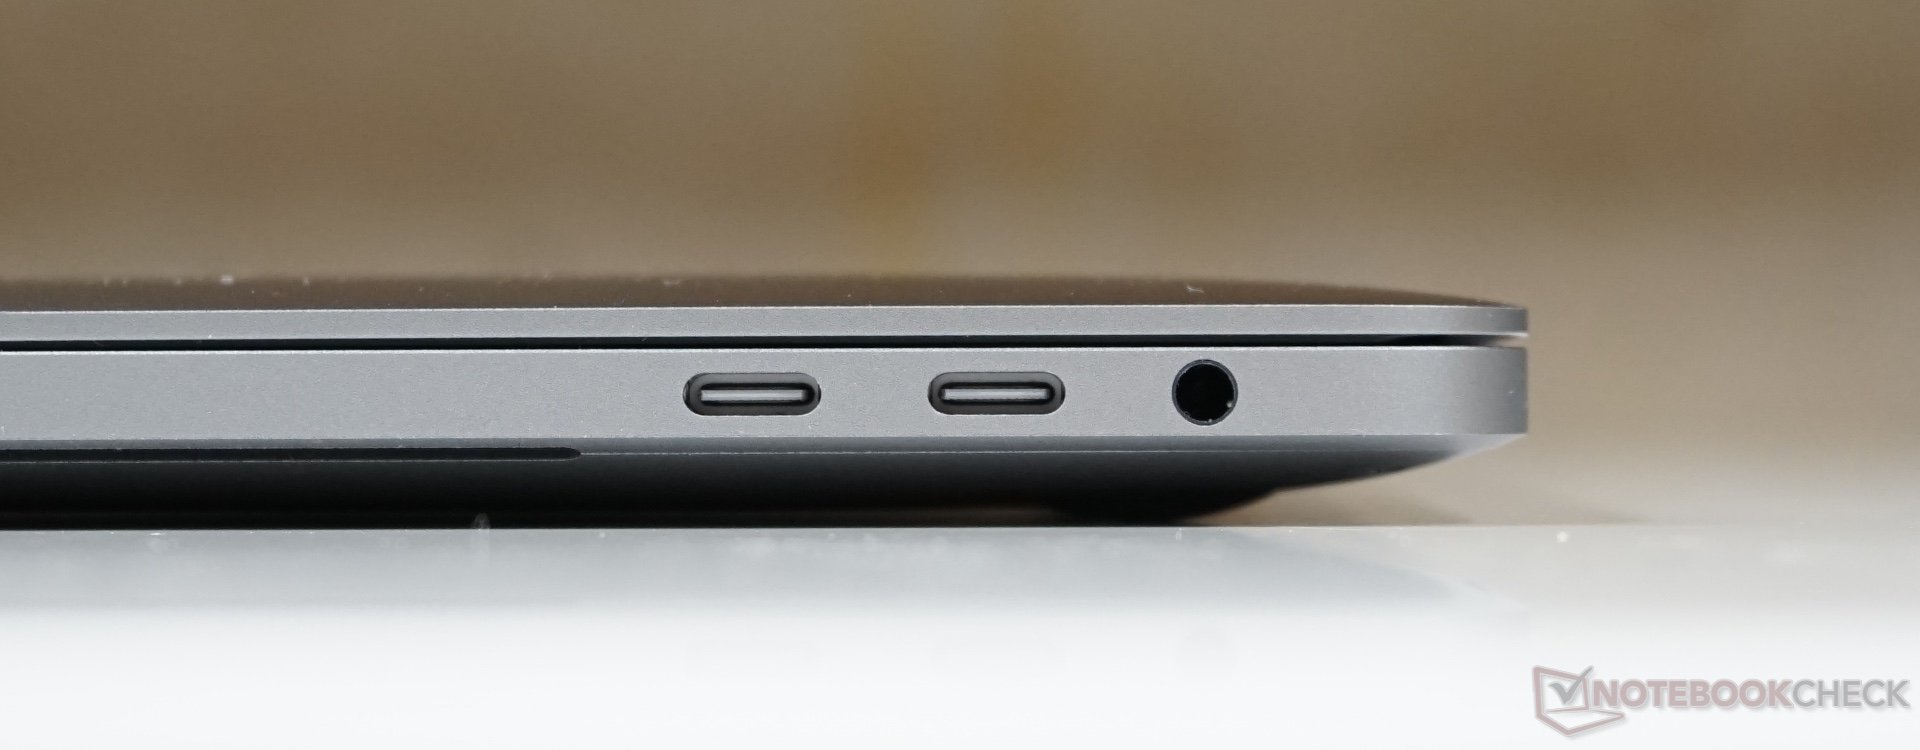
Um ponto que não pode ser resolvido por uma atualização, é a situação da portas. Quatro portas Thunderbolt 3 – todas as quais podem utilizar toda a largura da banda, à diferença de seu irmão menor – são muito versáteis e também preparadas para o futuro, mas esta abordagem radical é simplesmente inconveniente na prática, no futuro próximo, porque precisará dos adaptadores correspondentes. Achamos que a Apple poderia ter encontrado uma solução mais elegante e melhor para os clientes.
Em resumo, o novo MacBook Pro 15 se sente como uma solução interina. Agora, recebemos um novo design com algumas modificações, antes do seguinte modelo (provavelmente) fornecerá mais desempenho e resolverá todos os problemas (o qual nos faz lembrar os iPhones). O MacBook ainda é um portátil multimídia muito bom e muitos clientes certamente estarão contentes com ele, mas você bem poderia pular este modelo e esperar pela atualização do próximo ano se não precisar realmente de um novo sistema neste momento.
Apple MacBook Pro 15 2016 (2.6 GHz, 450)
-
12/09/2016 v6(old)
J. Simon Leitner, Klaus A. Hinum, Andreas Osthoff
Pricecompare
