 Deutsch
 English
 Español
 Français
 Italiano
 Nederlands
 Polski
 Português
 Русский
 Türkçe
 Svenska
 Chinese
 Magyar
Breve Análise do Portátil Asus ROG Strix GL502VS

| SD Card Reader | |
| average JPG Copy Test (av. of 3 runs) | |
| MSI GT62VR-6RE16H21 | |
| Acer Predator 15 G9-592-7925 | |
| SCHENKER XMG P506 PRO | |
| Asus Strix GL502VS-FY032T | |
| maximum AS SSD Seq Read Test (1GB) | |
| MSI GT62VR-6RE16H21 | |
| Acer Predator 15 G9-592-7925 | |
| SCHENKER XMG P506 PRO | |
| Asus Strix GL502VS-FY032T | |
| Networking | |
| iperf Server (receive) TCP 1 m | |
| Asus Strix GL502VS-FY032T | |
| MSI GT62VR-6RE16H21 | |
| iperf Client (transmit) TCP 1 m | |
| MSI GT62VR-6RE16H21 | |
| Asus Strix GL502VS-FY032T | |
| |||||||||||||||||||||||||
iluminação: 85 %
iluminação com acumulador: 315 cd/m²
Contraste: 984:1 (Preto: 0.32 cd/m²)
ΔE Color 4.88 | 0.5-29.43 Ø5
ΔE Greyscale 4.17 | 0.57-98 Ø5.3
83% sRGB (Argyll 1.6.3 3D)
55% AdobeRGB 1998 (Argyll 1.6.3 3D)
60.8% AdobeRGB 1998 (Argyll 2.2.0 3D)
83.1% sRGB (Argyll 2.2.0 3D)
64.5% Display P3 (Argyll 2.2.0 3D)
Gamma: 2.53
| Asus Strix GL502VS-FY032T LG Philips LP156WF6-SPB6 (LGD046F), , 1920x1080, 15.60 | MSI GT62VR-6RE16H21 LG Philips LP156WF6 (LGD046F), , 1920x1080, 15.60 | Acer Predator 15 G9-592-7925 LG Philips LP156WF6-SPP1 (LGD04D5), , 1920x1080, 15.60 | SCHENKER XMG P506 PRO LG Philips LP156WF6 (LGD046F), , 1920x1080, 15.60 | Asus Strix GL502VT-DS74 1920x1080, 15.60 | Asus Strix GL502VY-DS71 1920x1080, 15.60 | |
|---|---|---|---|---|---|---|
| Display | 1% | -1% | 1% | 11% | 0% | |
| Display P3 Coverage | 64.5 | 64.6 0% | 63 -2% | 65.1 1% | 66.7 3% | 63 -2% |
| sRGB Coverage | 83.1 | 84.6 2% | 82.2 -1% | 83.7 1% | 97.7 18% | 84.3 1% |
| AdobeRGB 1998 Coverage | 60.8 | 61.8 2% | 60.1 -1% | 61.2 1% | 68.4 13% | 61.6 1% |
| Response Times | 8% | -9% | -3% | -65% | 3% | |
| Response Time Grey 50% / Grey 80% * | 38 ? | 34 ? 11% | 43 ? -13% | 37 ? 3% | 56.4 ? -48% | 32 ? 16% |
| Response Time Black / White * | 23 ? | 22 ? 4% | 24 ? -4% | 25 ? -9% | 41.6 ? -81% | 25.6 ? -11% |
| PWM Frequency | 201.6 ? | |||||
| Screen | 7% | -5% | 4% | -9% | 3% | |
| Brightness middle | 315 | 273 -13% | 302 -4% | 312 -1% | 296.8 -6% | 347.2 10% |
| Brightness | 290 | 278 -4% | 287 -1% | 293 1% | 282 -3% | 327 13% |
| Brightness Distribution | 85 | 88 4% | 91 7% | 87 2% | 86 1% | 88 4% |
| Black Level * | 0.32 | 0.27 16% | 0.36 -13% | 0.32 -0% | 0.347 -8% | 0.348 -9% |
| Contrast | 984 | 1011 3% | 839 -15% | 975 -1% | 855 -13% | 998 1% |
| Colorchecker dE 2000 * | 4.88 | 3.67 25% | 4.93 -1% | 4.45 9% | 5.24 -7% | 4.53 7% |
| Colorchecker dE 2000 max. * | 8.88 | 8.33 6% | 12.34 -39% | 8.5 4% | 11.36 -28% | 11.01 -24% |
| Greyscale dE 2000 * | 4.17 | 2.73 35% | 3.47 17% | 3.05 27% | 6.76 -62% | 2.84 32% |
| Gamma | 2.53 87% | 2.49 88% | 2.16 102% | 2.58 85% | 2.24 98% | 2.05 107% |
| CCT | 6683 97% | 7029 92% | 6622 98% | 6495 100% | 8467 77% | 6664 98% |
| Color Space (Percent of AdobeRGB 1998) | 55 | 55 0% | 54 -2% | 55 0% | 62.8 14% | 54.7 -1% |
| Color Space (Percent of sRGB) | 83 | 84 1% | 82 -1% | 84 1% | 98.1 18% | 84.1 1% |
| Total Average (Program / Settings) | 5% /
6% | -5% /
-5% | 1% /
3% | -21% /
-13% | 2% /
3% |
* ... smaller is better
Display Response Times
| ↔ Response Time Black to White | ||
|---|---|---|
| 23 ms ... rise ↗ and fall ↘ combined | ↗ 5 ms rise | 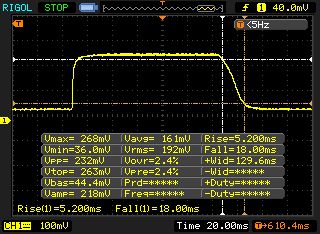 |
| ↘ 18 ms fall | ||
| The screen shows good response rates in our tests, but may be too slow for competitive gamers. In comparison, all tested devices range from 0.1 (minimum) to 240 (maximum) ms. » 45 % of all devices are better. This means that the measured response time is similar to the average of all tested devices (21.5 ms). | ||
| ↔ Response Time 50% Grey to 80% Grey | ||
| 38 ms ... rise ↗ and fall ↘ combined | ↗ 16 ms rise | 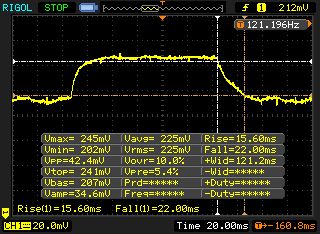 |
| ↘ 22 ms fall | ||
| The screen shows slow response rates in our tests and will be unsatisfactory for gamers. In comparison, all tested devices range from 0.2 (minimum) to 636 (maximum) ms. » 49 % of all devices are better. This means that the measured response time is worse than the average of all tested devices (33.7 ms). | ||
Screen Flickering / PWM (Pulse-Width Modulation)
| Screen flickering / PWM not detected | ||
In comparison: 53 % of all tested devices do not use PWM to dim the display. If PWM was detected, an average of 17900 (minimum: 5 - maximum: 3846000) Hz was measured. | ||
| Cinebench R15 | |
| CPU Single 64Bit | |
| SCHENKER XMG P506 PRO | |
| Asus Strix GL502VS-FY032T | |
| Asus Strix GL502VT-DS74 | |
| Asus Strix GL502VY-DS71 | |
| MSI GT62VR-6RE16H21 | |
| Acer Predator 15 G9-592-7925 | |
| CPU Multi 64Bit | |
| SCHENKER XMG P506 PRO | |
| Asus Strix GL502VY-DS71 | |
| Acer Predator 15 G9-592-7925 | |
| Asus Strix GL502VS-FY032T | |
| MSI GT62VR-6RE16H21 | |
| Asus Strix GL502VT-DS74 | |
| PCMark 8 | |
| Home Score Accelerated v2 | |
| Asus Strix GL502VS-FY032T | |
| MSI GT62VR-6RE16H21 | |
| Asus Strix GL502VY-DS71 | |
| Asus Strix GL502VT-DS74 | |
| Work Score Accelerated v2 | |
| Asus Strix GL502VS-FY032T | |
| MSI GT62VR-6RE16H21 | |
| Asus Strix GL502VY-DS71 | |
| Asus Strix GL502VT-DS74 | |
| PCMark 8 Home Score Accelerated v2 | 4651 pontos | |
| PCMark 8 Work Score Accelerated v2 | 5011 pontos | |
Ajuda | ||
| Asus Strix GL502VS-FY032T SanDisk SD8SNAT256G1002 | MSI GT62VR-6RE16H21 Toshiba HG6 THNSNJ256G8NY | Acer Predator 15 G9-592-7925 Samsung SSD PM871 MZNLN512HCJH | SCHENKER XMG P506 PRO Samsung SSD 950 Pro 512GB m.2 NVMe | Asus Strix GL502VT-DS74 Lite-On CV1-8B128 | Asus Strix GL502VY-DS71 SanDisk SD8SN8U1T001122 | |
|---|---|---|---|---|---|---|
| CrystalDiskMark 3.0 | 39% | 48% | 223% | 7% | 26% | |
| Read Seq | 485.4 | 523 8% | 510 5% | 2249 363% | 494.5 2% | 496.8 2% |
| Write Seq | 312.4 | 485.5 55% | 455.3 46% | 1331 326% | 184.1 -41% | 454.8 46% |
| Read 512 | 294.8 | 444.7 51% | 415.9 41% | 972 230% | 318.6 8% | 281.1 -5% |
| Write 512 | 287.8 | 471.2 64% | 422.3 47% | 732 154% | 182.6 -37% | 400 39% |
| Read 4k | 21.44 | 21.86 2% | 32.46 51% | 54.6 155% | 30.04 40% | 26.43 23% |
| Write 4k | 75.7 | 98.8 31% | 92.5 22% | 173 129% | 77.2 2% | 50.2 -34% |
| Read 4k QD32 | 149.4 | 350.3 134% | 358.6 140% | 687 360% | 312.6 109% | 347.8 133% |
| Write 4k QD32 | 256.3 | 162.2 -37% | 329.1 28% | 418.5 63% | 182.1 -29% | 263.1 3% |

| 3DMark 11 - 1280x720 Performance GPU | |
| MSI GT62VR-6RE16H21 | |
| Asus Strix GL502VS-FY032T | |
| SCHENKER XMG P506 PRO | |
| Asus Strix GL502VY-DS71 | |
| Acer Predator 15 G9-592-7925 | |
| Asus Strix GL502VT-DS74 | |
| 3DMark - 1920x1080 Fire Strike Graphics | |
| MSI GT62VR-6RE16H21 | |
| Asus Strix GL502VS-FY032T | |
| SCHENKER XMG P506 PRO | |
| Asus Strix GL502VY-DS71 | |
| Acer Predator 15 G9-592-7925 | |
| Asus Strix GL502VT-DS74 | |
| 3DMark 11 Performance | 15822 pontos | |
| 3DMark Cloud Gate Standard Score | 22943 pontos | |
| 3DMark Fire Strike Score | 12909 pontos | |
Ajuda | ||
| Rise of the Tomb Raider | |
| 1920x1080 Very High Preset AA:FX AF:16x | |
| Asus Strix GL502VS-FY032T | |
| MSI GT62VR-6RE16H21 | |
| Asus Strix GL502VY-DS71 | |
| Asus Strix GL502VT-DS74 | |
| 1920x1080 High Preset AA:FX AF:4x | |
| Asus Strix GL502VS-FY032T | |
| MSI GT62VR-6RE16H21 | |
| Asus Strix GL502VY-DS71 | |
| Asus Strix GL502VT-DS74 | |
| Battlefield 4 - 1920x1080 Ultra Preset AA:4x MS | |
| MSI GT62VR-6RE16H21 | |
| Asus Strix GL502VS-FY032T | |
| The Witcher 3 | |
| 1920x1080 Ultra Graphics & Postprocessing (HBAO+) | |
| MSI GT62VR-6RE16H21 | |
| Asus Strix GL502VS-FY032T | |
| 1920x1080 High Graphics & Postprocessing (Nvidia HairWorks Off) | |
| MSI GT62VR-6RE16H21 | |
| Asus Strix GL502VS-FY032T | |
| Doom | |
| 1920x1080 Ultra Preset AA:SM | |
| Asus Strix GL502VS-FY032T | |
| MSI GT62VR-6RE16H21 | |
| Asus Strix GL502VY-DS71 | |
| 1920x1080 High Preset AA:FX | |
| Asus Strix GL502VS-FY032T | |
| MSI GT62VR-6RE16H21 | |
| Asus Strix GL502VY-DS71 | |
| Mirror's Edge Catalyst | |
| 1920x1080 Ultra Preset AF:16x | |
| MSI GT62VR-6RE16H21 | |
| Asus Strix GL502VS-FY032T | |
| 1920x1080 High Preset AF:16x | |
| MSI GT62VR-6RE16H21 | |
| Asus Strix GL502VS-FY032T | |
| baixo | média | alto | ultra | |
| Battlefield 4 (2013) | 192.2 | 132.7 | ||
| The Witcher 3 (2015) | 165.9 | 102.4 | 55.2 | |
| Rise of the Tomb Raider (2016) | 104 | 88.7 | ||
| Doom (2016) | 130.1 | 125.1 | ||
| Mirror's Edge Catalyst (2016) | 99.6 | 92 |
Barulho
| Ocioso |
| 32 / 33 / 34 dB |
| Carga |
| 39 / 51 dB |
 | ||
30 dB silencioso 40 dB(A) audível 50 dB(A) ruidosamente alto |
||
min: | ||
(-) The maximum temperature on the upper side is 48 °C / 118 F, compared to the average of 40.4 °C / 105 F, ranging from 21.2 to 68.8 °C for the class Gaming.
(-) The bottom heats up to a maximum of 46.8 °C / 116 F, compared to the average of 43.2 °C / 110 F
(+) In idle usage, the average temperature for the upper side is 29 °C / 84 F, compared to the device average of 33.8 °C / 93 F.
(+) The palmrests and touchpad are cooler than skin temperature with a maximum of 30.6 °C / 87.1 F and are therefore cool to the touch.
(±) The average temperature of the palmrest area of similar devices was 28.9 °C / 84 F (-1.7 °C / -3.1 F).
Asus Strix GL502VS-FY032T audio analysis
(±) | speaker loudness is average but good (77 dB)
Bass 100 - 315 Hz
(-) | nearly no bass - on average 16.2% lower than median
(±) | linearity of bass is average (11.9% delta to prev. frequency)
Mids 400 - 2000 Hz
(+) | balanced mids - only 0.7% away from median
(+) | mids are linear (3.1% delta to prev. frequency)
Highs 2 - 16 kHz
(+) | balanced highs - only 3.5% away from median
(±) | linearity of highs is average (7.4% delta to prev. frequency)
Overall 100 - 16.000 Hz
(±) | linearity of overall sound is average (16.8% difference to median)
Compared to same class
» 41% of all tested devices in this class were better, 11% similar, 48% worse
» The best had a delta of 6%, average was 18%, worst was 132%
Compared to all devices tested
» 25% of all tested devices were better, 7% similar, 68% worse
» The best had a delta of 4%, average was 25%, worst was 134%
MSI GT62VR-6RE16H21 audio analysis
(±) | speaker loudness is average but good (79 dB)
Bass 100 - 315 Hz
(±) | reduced bass - on average 11.3% lower than median
(±) | linearity of bass is average (11.4% delta to prev. frequency)
Mids 400 - 2000 Hz
(±) | higher mids - on average 8.3% higher than median
(+) | mids are linear (5.7% delta to prev. frequency)
Highs 2 - 16 kHz
(+) | balanced highs - only 4.3% away from median
(±) | linearity of highs is average (11% delta to prev. frequency)
Overall 100 - 16.000 Hz
(±) | linearity of overall sound is average (20.5% difference to median)
Compared to same class
» 70% of all tested devices in this class were better, 5% similar, 25% worse
» The best had a delta of 6%, average was 18%, worst was 132%
Compared to all devices tested
» 49% of all tested devices were better, 8% similar, 43% worse
» The best had a delta of 4%, average was 25%, worst was 134%
| Asus Strix GL502VS-FY032T GeForce GTX 1070 Mobile, 6700HQ | MSI GT62VR-6RE16H21 GeForce GTX 1070 Mobile, 6700HQ | Acer Predator 15 G9-592-7925 GeForce GTX 970M, 6700HQ | SCHENKER XMG P506 PRO GeForce GTX 980M, 6820HK | Asus Strix GL502VT-DS74 GeForce GTX 970M, 6700HQ | Asus Strix GL502VY-DS71 GeForce GTX 980M, 6700HQ | |
|---|---|---|---|---|---|---|
| Power Consumption | -9% | 19% | 4% | 25% | -4% | |
| Idle Minimum * | 20 | 20 -0% | 12 40% | 15 25% | 11.1 44% | 20.6 -3% |
| Idle Average * | 24 | 26 -8% | 16 33% | 20 17% | 14.1 41% | 22.1 8% |
| Idle Maximum * | 29 | 32 -10% | 22 24% | 27 7% | 18.4 37% | 22.5 22% |
| Load Average * | 86 | 100 -16% | 96 -12% | 98 -14% | 96.5 -12% | 130.6 -52% |
| Load Maximum * | 183 | 202 -10% | 166 9% | 210 -15% | 159.5 13% | 177.2 3% |
* ... smaller is better
| desligado | |
| Ocioso | |
| Carga |
|
| Asus Strix GL502VS-FY032T 62 Wh | MSI GT62VR-6RE16H21 75.24 Wh | Acer Predator 15 G9-592-7925 Wh | SCHENKER XMG P506 PRO 60 Wh | Asus Strix GL502VT-DS74 64 Wh | Asus Strix GL502VY-DS71 64 Wh | |
|---|---|---|---|---|---|---|
| Battery Runtime | ||||||
| WiFi v1.3 | 196 | 246 26% | 476 143% | 267 36% | 356 82% | 187 -5% |
Pro
Contra
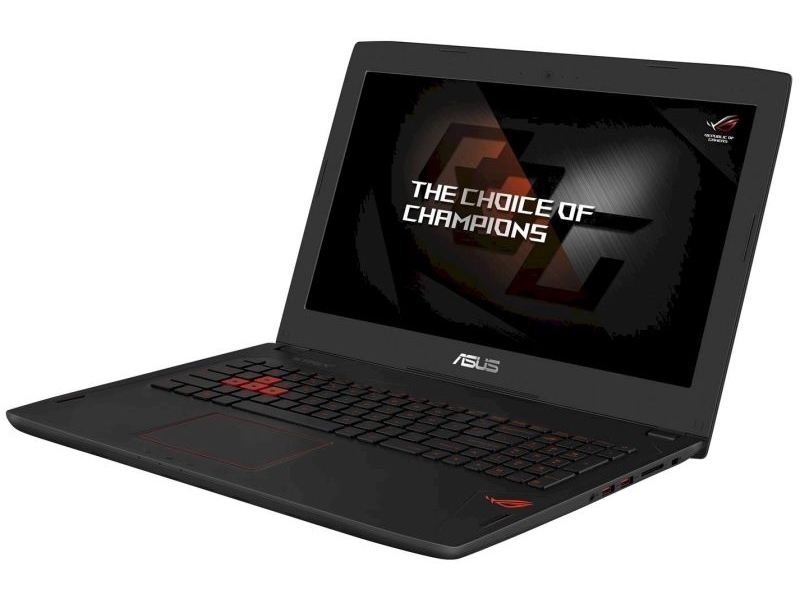
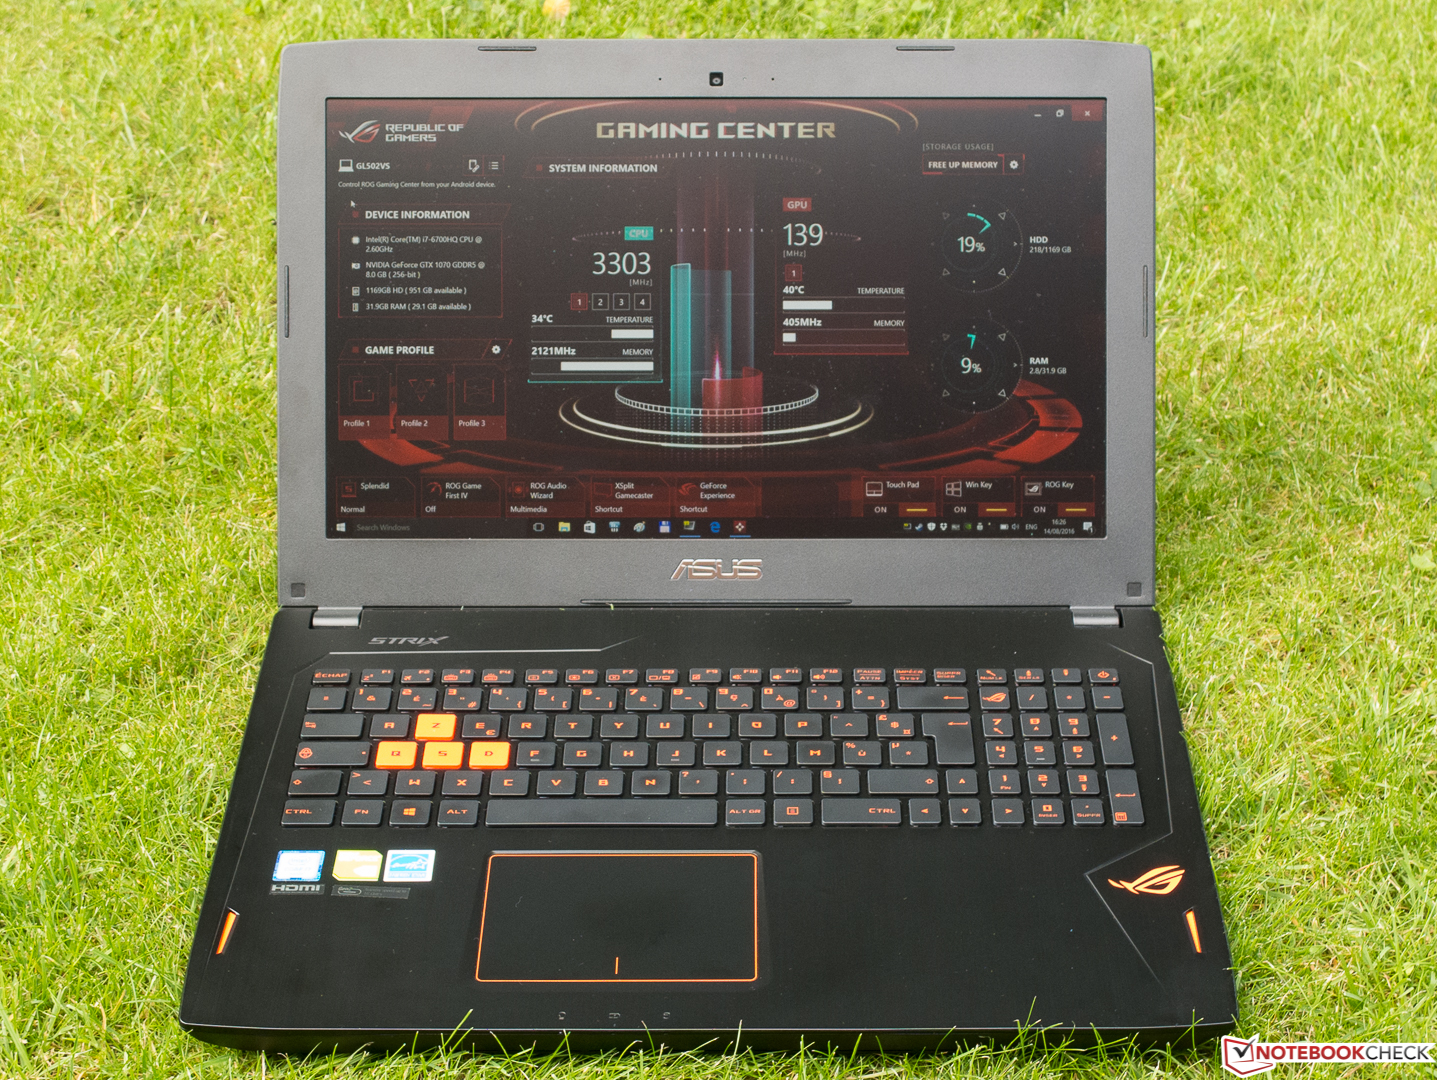
O novo Asus ROG Strix GL502VS deixou uma impressão convincente, em geral. Um dos principais aspectos é o enorme desempenho da Nvidia GeForce GTX 1070. Os gamers que não sejam muito sensíveis ao ruído deverão ficar muito contentes com o aparelho.
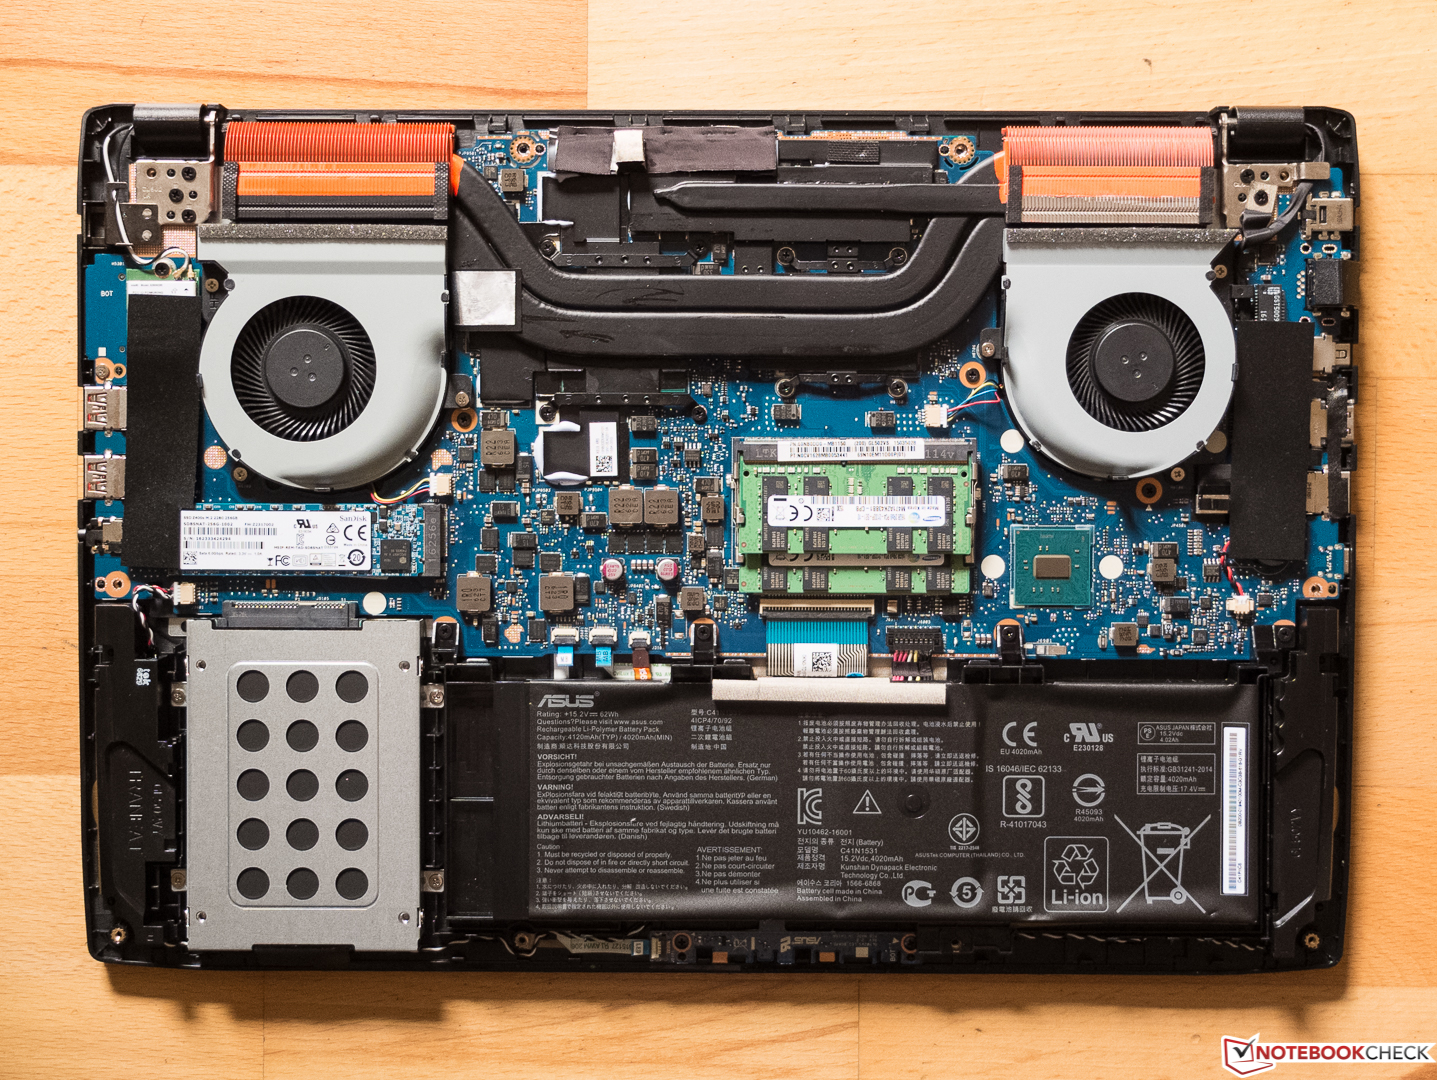
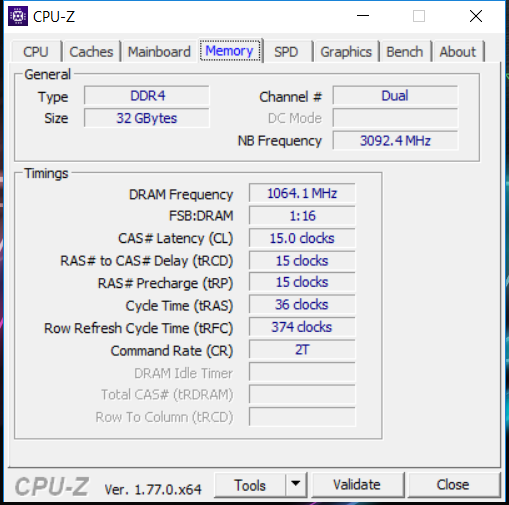
Já mencionamos na introdução que também existem algumas desvantagens. O chassi rangente poderia deixar uma melhor impressão, mas o modelo de teste é uma das primeiras remessas, portanto, os modelos mais recentes poderiam melhor neste aspecto. Não estamos totalmente satisfeitos com as propriedades de deslizamento do touchpad, nem com a gama de cores limitada da tela IPS muito boa. Os tempos de resposta da tela também podem ser lentos para alguns gamers. A perfeita visibilidade das teclas foi sacrificada pelo design. Incomum, porém, não muito importante com 32 GB de RAM DDR4: Há apenas dois slots SODIMM Os aparelhos de 15-polegadas com este tipo de desempenho não podem ser resfriados sem ruídos e os rivais não provavelmente não sejam amis silenciosos – mas com frequência era um pouco mais barulhento em nossa opinião.
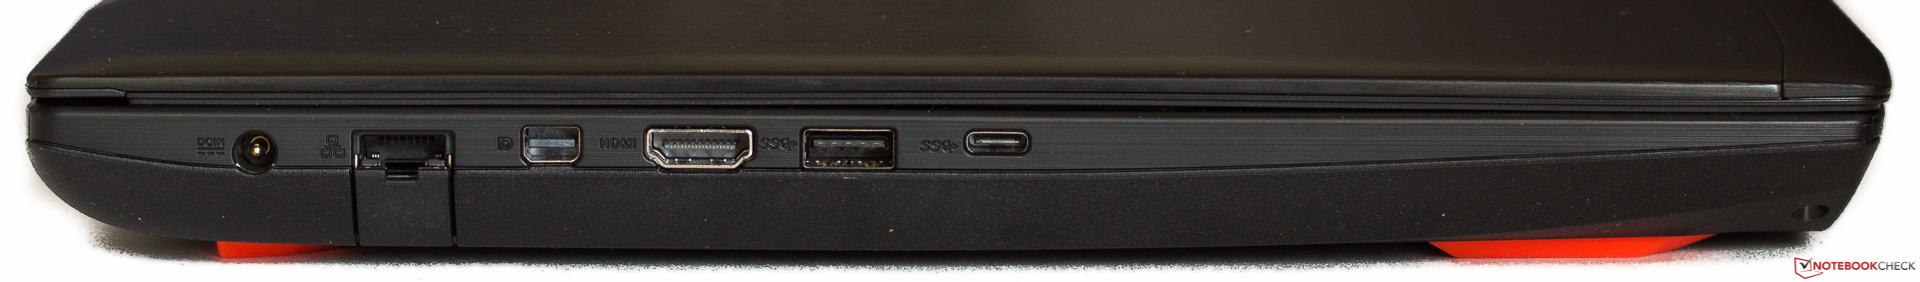
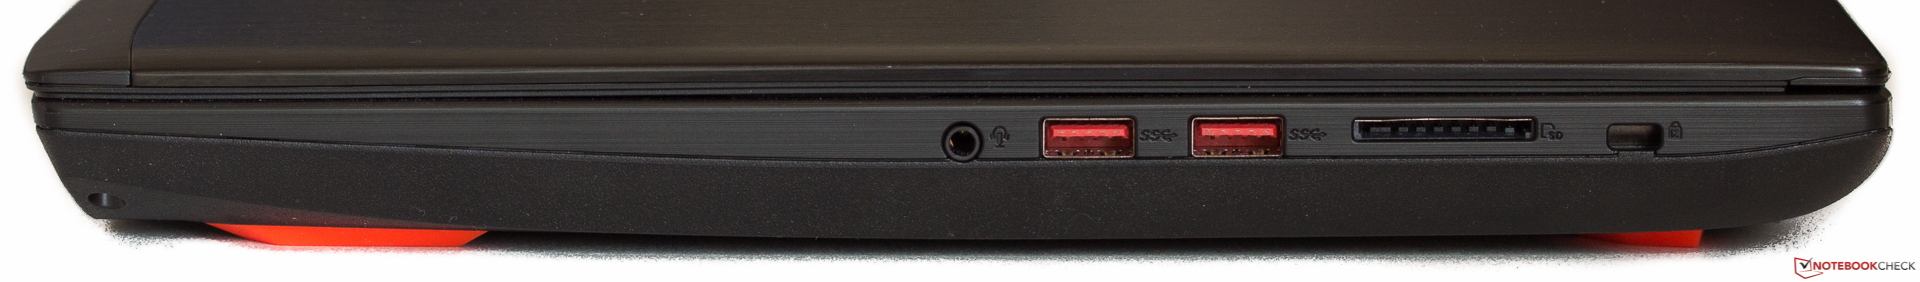
Há muito mais no lado positivo: A carcaça comparativamente leve tem uma bela aparência e e deve atender as expectativas de design dos clientes ROG. A Asus também merece elogios pela seleção de portas moderna e generosa. Ninguém criticará as amplas opções de manutenção. O desempenho também está no nível esperado, portanto, as especificações técnicas estão bem. A boa impressão é completada com um bom teclado e uma tela bastante convincente. Portanto, podemos recomendar o sistema com as limitações mencionadas.
Asus Strix GL502VS-FY032T
-
08/21/2016 v5.1(old)
Sven Kloevekorn
Pricecompare
