 Deutsch
 English
 Español
 Français
 Italiano
 Nederlands
 Polski
 Português
 Русский
 Türkçe
 Svenska
 Chinese
 Magyar
Breve Análise do Portátil Asus ROG Strix GL703GM Scar Edition (8750H, GTX 1060, FHD 120 Hz)
| SD Card Reader | |
| average JPG Copy Test (av. of 3 runs) | |
| Eurocom Q6 (Toshiba Exceria Pro SDXC 64 GB UHS-II) | |
| Asus Strix GL703GM-DS74 (Toshiba Exceria Pro SDXC 64 GB UHS-II) | |
| HP Omen 17-an014ng (Toshiba Exceria Pro SDXC 64 GB UHS-II) | |
| Razer Blade Pro RZ09-0220 (Toshiba Exceria Pro SDXC 64 GB UHS-II) | |
| MSI GE73 8RF-008 Raider RGB (Toshiba Exceria Pro SDXC 64 GB UHS-II) | |
| Acer Aspire V17 Nitro BE VN7-793-738J (Toshiba Exceria Pro SDXC 64 GB UHS-II) | |
| maximum AS SSD Seq Read Test (1GB) | |
| Eurocom Q6 (Toshiba Exceria Pro SDXC 64 GB UHS-II) | |
| Asus Strix GL703GM-DS74 (Toshiba Exceria Pro SDXC 64 GB UHS-II) | |
| HP Omen 17-an014ng (Toshiba Exceria Pro SDXC 64 GB UHS-II) | |
| Razer Blade Pro RZ09-0220 (Toshiba Exceria Pro SDXC 64 GB UHS-II) | |
| MSI GE73 8RF-008 Raider RGB (Toshiba Exceria Pro SDXC 64 GB UHS-II) | |
| Acer Aspire V17 Nitro BE VN7-793-738J (Toshiba Exceria Pro SDXC 64 GB UHS-II) | |
| |||||||||||||||||||||||||
iluminação: 84 %
iluminação com acumulador: 297.8 cd/m²
Contraste: 902:1 (Preto: 0.33 cd/m²)
ΔE Color 3.68 | 0.5-29.43 Ø5, calibrated: 2.71
ΔE Greyscale 5 | 0.57-98 Ø5.3
99.97% sRGB (Argyll 1.6.3 3D)
84.77% AdobeRGB 1998 (Argyll 1.6.3 3D)
84.8% AdobeRGB 1998 (Argyll 2.2.0 3D)
100% sRGB (Argyll 2.2.0 3D)
90% Display P3 (Argyll 2.2.0 3D)
Gamma: 2.06
| Asus Strix GL703GM-DS74 Chi Mei CMN1747 M173JJE-G32, TN LED, 17.30, 1920x1080 | Acer Aspire V17 Nitro BE VN7-793-738J AU Optronics B173ZAN01.0, IPS, 17.30, 3840x2160 | MSI GE73 8RF-008 Raider RGB Chi Mei N173HHE-G32 (CMN1747), TN WLED, 17.30, 1920x1080 | Asus GL703GE-ES73 Chi Mei CMN1747, TN, 17.30, 1920x1080 | HP Omen 17-an014ng AUO149D, IPS, 17.30, 1920x1080 | Asus Strix GL703VM-DB74 AU Optronics B173HAN01.1, IPS, 17.30, 1920x1080 | |
|---|---|---|---|---|---|---|
| Display | 3% | 1% | -1% | -19% | -24% | |
| Display P3 Coverage | 90 | 85.4 -5% | 90.8 1% | 90.1 0% | 64.6 -28% | 61.5 -32% |
| sRGB Coverage | 100 | 100 0% | 99.9 0% | 99.8 0% | 92.9 -7% | 87.2 -13% |
| AdobeRGB 1998 Coverage | 84.8 | 97.8 15% | 85.8 1% | 83.1 -2% | 66.1 -22% | 62.7 -26% |
| Response Times | -248% | -101% | -16% | -363% | -240% | |
| Response Time Grey 50% / Grey 80% * | 8.8 ? | 29 ? -230% | 28 ? -218% | 11.6 ? -32% | 45.2 ? -414% | 30.8 ? -250% |
| Response Time Black / White * | 7.4 ? | 27 ? -265% | 13.6 ? -84% | 8.8 ? -19% | 30.4 ? -311% | 24.4 ? -230% |
| PWM Frequency | 25510 ? | 25000 ? -2% | 26040 ? 2% | |||
| Screen | 4% | 10% | 8% | 5% | -9% | |
| Brightness middle | 297.8 | 380 28% | 273 -8% | 331.1 11% | 314 5% | 319.5 7% |
| Brightness | 285 | 336 18% | 273 -4% | 312 9% | 309 8% | 293 3% |
| Brightness Distribution | 84 | 81 -4% | 90 7% | 86 2% | 88 5% | 67 -20% |
| Black Level * | 0.33 | 0.32 3% | 0.26 21% | 0.31 6% | 0.34 -3% | 0.65 -97% |
| Contrast | 902 | 1188 32% | 1050 16% | 1068 18% | 924 2% | 492 -45% |
| Colorchecker dE 2000 * | 3.68 | 5.32 -45% | 3.52 4% | 2.86 22% | 3.19 13% | 3.17 14% |
| Colorchecker dE 2000 max. * | 7.71 | 7.63 1% | 6.34 18% | 6.35 18% | 6.1 21% | 5.32 31% |
| Colorchecker dE 2000 calibrated * | 2.71 | 2.09 23% | 2.66 2% | |||
| Greyscale dE 2000 * | 5 | 4.9 2% | 3.11 38% | 4.3 14% | 3.49 30% | 1.6 68% |
| Gamma | 2.06 107% | 2.61 84% | 2.43 91% | 2.268 97% | 2.34 94% | 2.22 99% |
| CCT | 6728 97% | 6558 99% | 6999 93% | 7034 92% | 7261 90% | 6668 97% |
| Color Space (Percent of AdobeRGB 1998) | 84.77 | 87.2 3% | 76 -10% | 75 -12% | 60 -29% | 56 -34% |
| Color Space (Percent of sRGB) | 99.97 | 100 0% | 100 0% | 100 0% | 93 -7% | 87 -13% |
| Total Average (Program / Settings) | -80% /
-30% | -30% /
-12% | -3% /
2% | -126% /
-49% | -91% /
-42% |
* ... smaller is better
Display Response Times
| ↔ Response Time Black to White | ||
|---|---|---|
| 7.4 ms ... rise ↗ and fall ↘ combined | ↗ 5.2 ms rise | 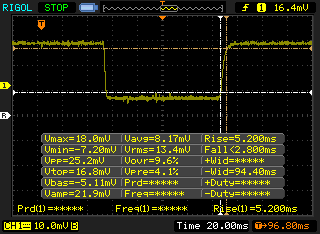 |
| ↘ 2.2 ms fall | ||
| The screen shows very fast response rates in our tests and should be very well suited for fast-paced gaming. In comparison, all tested devices range from 0.1 (minimum) to 240 (maximum) ms. » 16 % of all devices are better. This means that the measured response time is better than the average of all tested devices (21.5 ms). | ||
| ↔ Response Time 50% Grey to 80% Grey | ||
| 8.8 ms ... rise ↗ and fall ↘ combined | ↗ 4.4 ms rise | 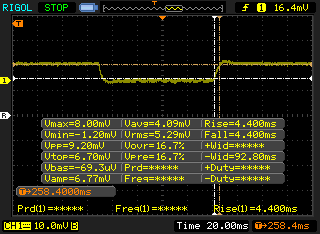 |
| ↘ 4.4 ms fall | ||
| The screen shows fast response rates in our tests and should be suited for gaming. In comparison, all tested devices range from 0.2 (minimum) to 636 (maximum) ms. » 17 % of all devices are better. This means that the measured response time is better than the average of all tested devices (33.7 ms). | ||
Screen Flickering / PWM (Pulse-Width Modulation)
| Screen flickering / PWM detected | 25510 Hz | ≤ 15 % brightness setting | 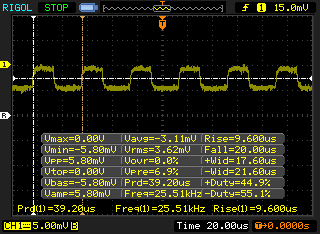 |
The display backlight flickers at 25510 Hz (worst case, e.g., utilizing PWM) Flickering detected at a brightness setting of 15 % and below. There should be no flickering or PWM above this brightness setting. The frequency of 25510 Hz is quite high, so most users sensitive to PWM should not notice any flickering. In comparison: 53 % of all tested devices do not use PWM to dim the display. If PWM was detected, an average of 17900 (minimum: 5 - maximum: 3846000) Hz was measured. | |||
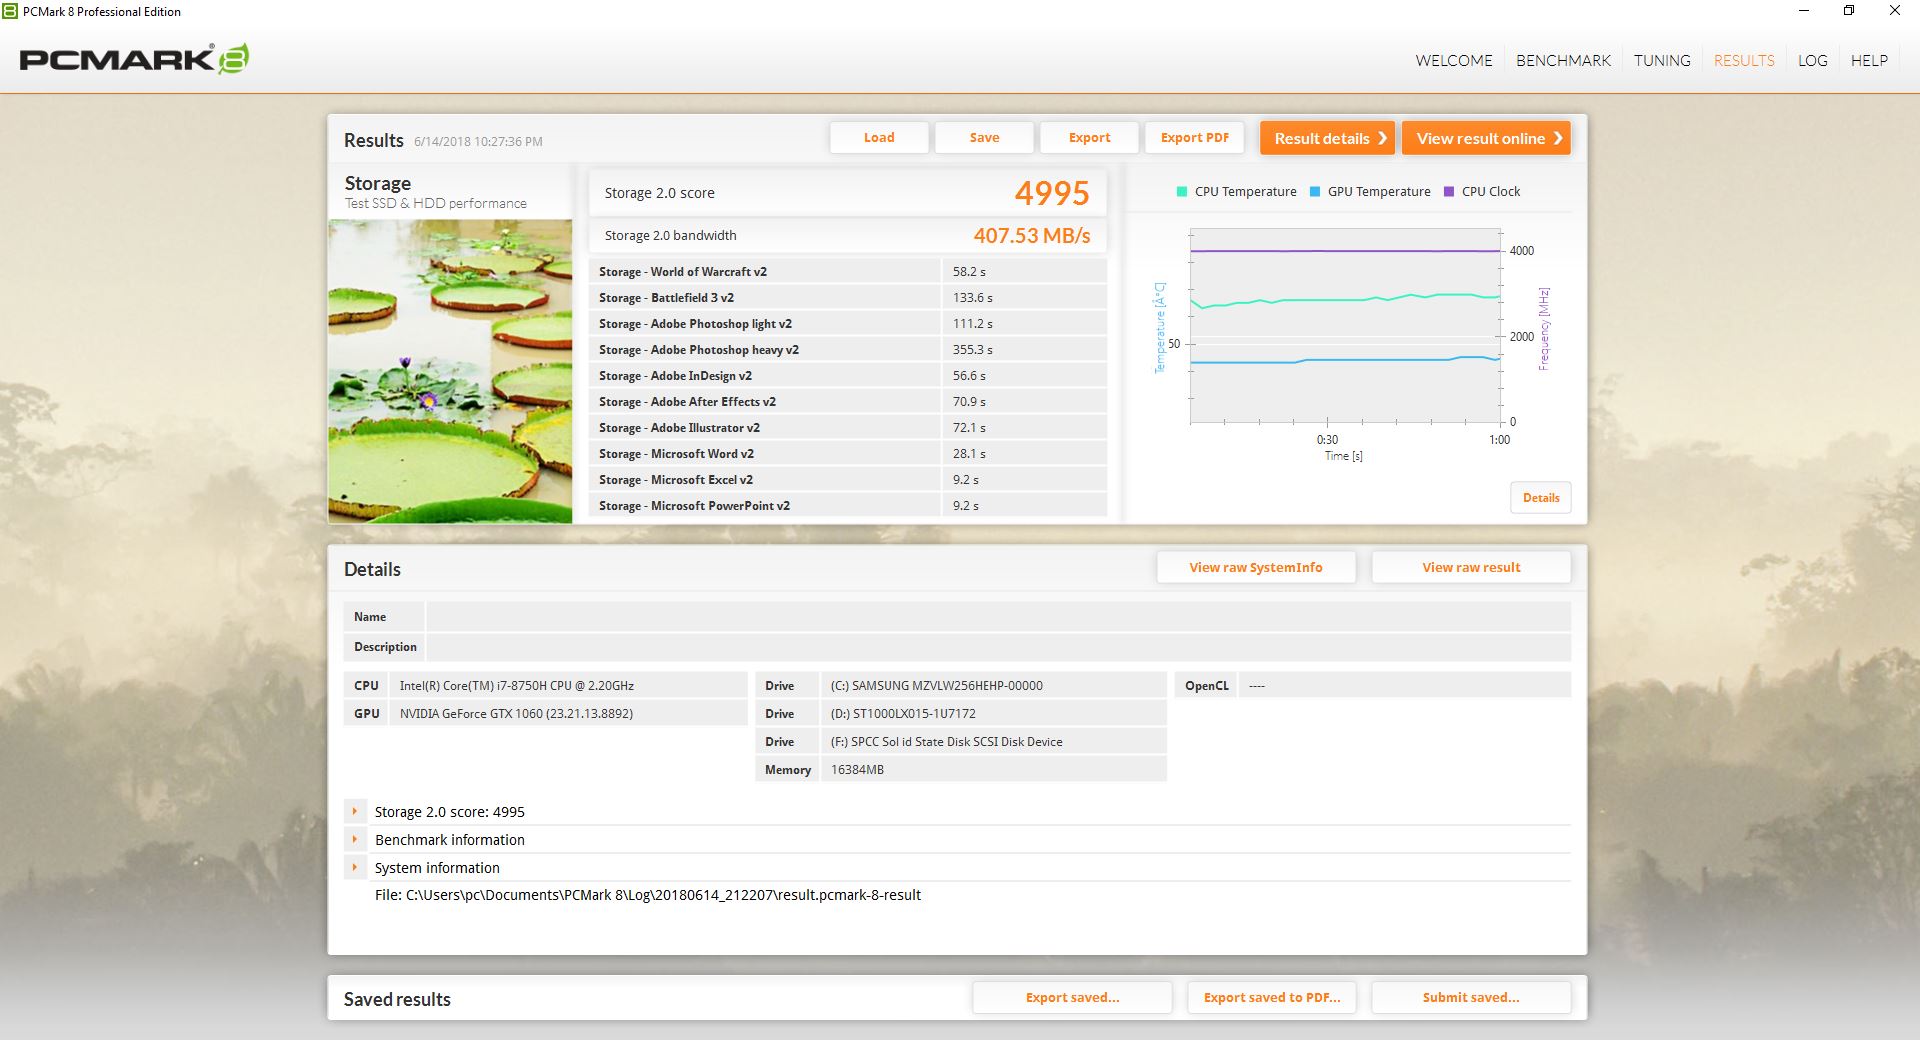
| PCMark 8 Home Score Accelerated v2 | 5371 pontos | |
| PCMark 8 Creative Score Accelerated v2 | 7765 pontos | |
| PCMark 8 Work Score Accelerated v2 | 5528 pontos | |
| PCMark 10 Score | 5525 pontos | |
Ajuda | ||
| Asus Strix GL703GM-DS74 Samsung PM961 MZVLW256HEHP | Acer Aspire V17 Nitro BE VN7-793-738J Intel SSD 600p SSDPEKKW512G7 | MSI GE73 8RF-008 Raider RGB Toshiba HG6 THNSNJ256G8NY | HP Omen 17-an014ng Samsung PM961 MZVLW256HEHP | Eurocom Q6 Samsung SSD 960 Pro 512 GB m.2 | |
|---|---|---|---|---|---|
| AS SSD | -17% | -84% | -419% | 31% | |
| Copy Game MB/s | 481 | 816 70% | 295.5 -39% | 633 32% | |
| Copy Program MB/s | 780 | 336 -57% | 192.9 -75% | 363.4 -53% | |
| Copy ISO MB/s | 1043 | 1092 5% | 412.5 -60% | 1768 70% | |
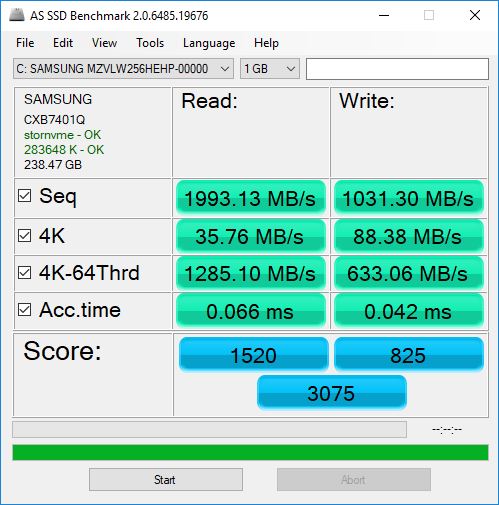
| Score Total | 3075 | 1678 -45% | 881 -71% | 2205 -28% | 3894 27% |
| Score Write | 825 | 677 -18% | 254 -69% | 161 -80% | 1693 105% |
| Score Read | 1520 | 692 -54% | 417 -73% | 1414 -7% | 1477 -3% |
| Access Time Write * | 0.042 | 0.035 17% | 0.097 -131% | 1.85 -4305% | 0.039 7% |
| Access Time Read * | 0.066 | 0.075 -14% | 0.235 -256% | 0.058 12% | 0.049 26% |
| 4K-64 Write | 633 | 516 -18% | 172.7 -73% | 122.9 -81% | 1403 122% |
| 4K-64 Read | 1285 | 503 -61% | 351.4 -73% | 1129 -12% | 1195 -7% |
| 4K Write | 88.4 | 104.8 19% | 38.34 -57% | 1.26 -99% | 96.2 9% |
| 4K Read | 35.76 | 29.75 -17% | 14.07 -61% | 47.62 33% | 29.62 -17% |
| Seq Write | 1031 | 566 -45% | 425.7 -59% | 365.5 -65% | 1943 88% |
| Seq Read | 1993 | 1590 -20% | 511 -74% | 2374 19% | 2523 27% |
* ... smaller is better

| 3DMark 11 Performance | 13021 pontos | |
| 3DMark Cloud Gate Standard Score | 30148 pontos | |
| 3DMark Fire Strike Score | 10198 pontos | |
| 3DMark Fire Strike Extreme Score | 5212 pontos | |
Ajuda | ||
| Rise of the Tomb Raider | |
| 1920x1080 Very High Preset AA:FX AF:16x (sort by value) | |
| Asus Strix GL703GM-DS74 | |
| HP Omen 17-an014ng | |
| Razer Blade Pro RZ09-0220 | |
| Eurocom Q6 | |
| Asus Strix GL703VM-DB74 | |
| MSI GP62 7REX-1045US | |
| Average NVIDIA GeForce GTX 1060 Mobile (51 - 68.8, n=37) | |
| 1920x1080 High Preset AA:FX AF:4x (sort by value) | |
| Asus Strix GL703GM-DS74 | |
| HP Omen 17-an014ng | |
| Razer Blade Pro RZ09-0220 | |
| Eurocom Q6 | |
| MSI GP62 7REX-1045US | |
| Average NVIDIA GeForce GTX 1060 Mobile (65.3 - 82, n=24) | |
| 1366x768 Medium Preset AF:2x (sort by value) | |
| Asus Strix GL703GM-DS74 | |
| HP Omen 17-an014ng | |
| Eurocom Q6 | |
| MSI GP62 7REX-1045US | |
| Average NVIDIA GeForce GTX 1060 Mobile (82.2 - 140, n=14) | |
| The Witcher 3 | |
| 1920x1080 Ultra Graphics & Postprocessing (HBAO+) (sort by value) | |
| Asus Strix GL703GM-DS74 | |
| MSI GE73 8RF-008 Raider RGB | |
| Asus GL703GE-ES73 | |
| HP Omen 17-an014ng | |
| Razer Blade Pro RZ09-0220 | |
| Eurocom Q6 | |
| Asus Strix GL703VM-DB74 | |
| Aorus X5 v8 | |
| Average NVIDIA GeForce GTX 1060 Mobile (24 - 42.3, n=60) | |
| 1920x1080 High Graphics & Postprocessing (Nvidia HairWorks Off) (sort by value) | |
| Asus Strix GL703GM-DS74 | |
| MSI GE73 8RF-008 Raider RGB | |
| HP Omen 17-an014ng | |
| Razer Blade Pro RZ09-0220 | |
| Eurocom Q6 | |
| Aorus X5 v8 | |
| Average NVIDIA GeForce GTX 1060 Mobile (52.6 - 80.6, n=49) | |
| 1366x768 Medium Graphics & Postprocessing (sort by value) | |
| Asus Strix GL703GM-DS74 | |
| MSI GE73 8RF-008 Raider RGB | |
| HP Omen 17-an014ng | |
| Eurocom Q6 | |
| Average NVIDIA GeForce GTX 1060 Mobile (91.7 - 138.7, n=16) | |
| baixo | média | alto | ultra | |
| BioShock Infinite (2013) | 300.4 | 257.8 | 234.2 | 115.2 |
| The Witcher 3 (2015) | 200.7 | 134.3 | 58.8 | 41 |
| Rise of the Tomb Raider (2016) | 183.8 | 140 | 76 | 64 |
Barulho
| Ocioso |
| 29.4 / 29.4 / 33.7 dB |
| Carga |
| 41.2 / 48.3 dB |
 | ||
30 dB silencioso 40 dB(A) audível 50 dB(A) ruidosamente alto |
||
min: | ||
| Asus Strix GL703GM-DS74 GeForce GTX 1060 Mobile, i7-8750H, Samsung PM961 MZVLW256HEHP | Asus Strix GL703VM-DB74 GeForce GTX 1060 Mobile, i7-7700HQ, Seagate Mobile HDD 1TB ST1000LX015-1U7172 | Acer Aspire V17 Nitro BE VN7-793-738J GeForce GTX 1060 Mobile, i7-7700HQ, Intel SSD 600p SSDPEKKW512G7 | MSI GE73 8RF-008 Raider RGB GeForce GTX 1070 Mobile, i7-8750H, Toshiba HG6 THNSNJ256G8NY | HP Omen 17-an014ng GeForce GTX 1070 Mobile, i7-7700HQ, Samsung PM961 MZVLW256HEHP | |
|---|---|---|---|---|---|
| Noise | -1% | -0% | -6% | -10% | |
| off / environment * | 28.6 | 28.4 1% | 30.8 -8% | 30 -5% | 30 -5% |
| Idle Minimum * | 29.4 | 30.2 -3% | 31.4 -7% | 32 -9% | 30 -2% |
| Idle Average * | 29.4 | 30.2 -3% | 31.4 -7% | 33 -12% | 37 -26% |
| Idle Maximum * | 33.7 | 30.2 10% | 31.4 7% | 34 -1% | 39 -16% |
| Load Average * | 41.2 | 38.4 7% | 38.6 6% | 41 -0% | 44 -7% |
| Witcher 3 ultra * | 47.3 | 49.7 -5% | 50 -6% | 47 1% | |
| Load Maximum * | 48.3 | 54.5 -13% | 44.3 8% | 54 -12% | 55 -14% |
* ... smaller is better
(-) The maximum temperature on the upper side is 54.6 °C / 130 F, compared to the average of 40.4 °C / 105 F, ranging from 21.2 to 68.8 °C for the class Gaming.
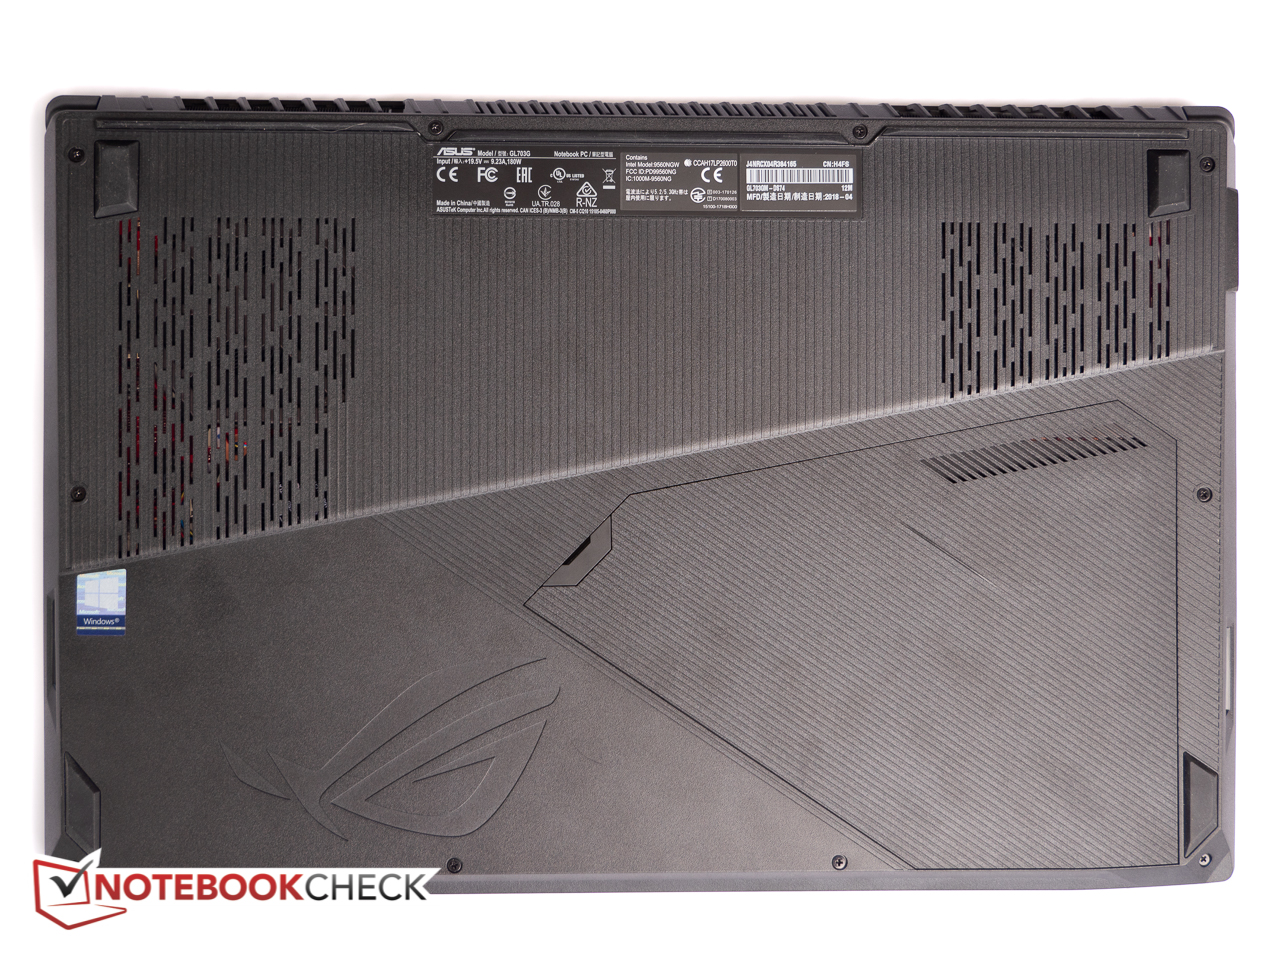
(±) The bottom heats up to a maximum of 41.2 °C / 106 F, compared to the average of 43.2 °C / 110 F
(+) In idle usage, the average temperature for the upper side is 28.1 °C / 83 F, compared to the device average of 33.8 °C / 93 F.
(±) Playing The Witcher 3, the average temperature for the upper side is 35.5 °C / 96 F, compared to the device average of 33.8 °C / 93 F.
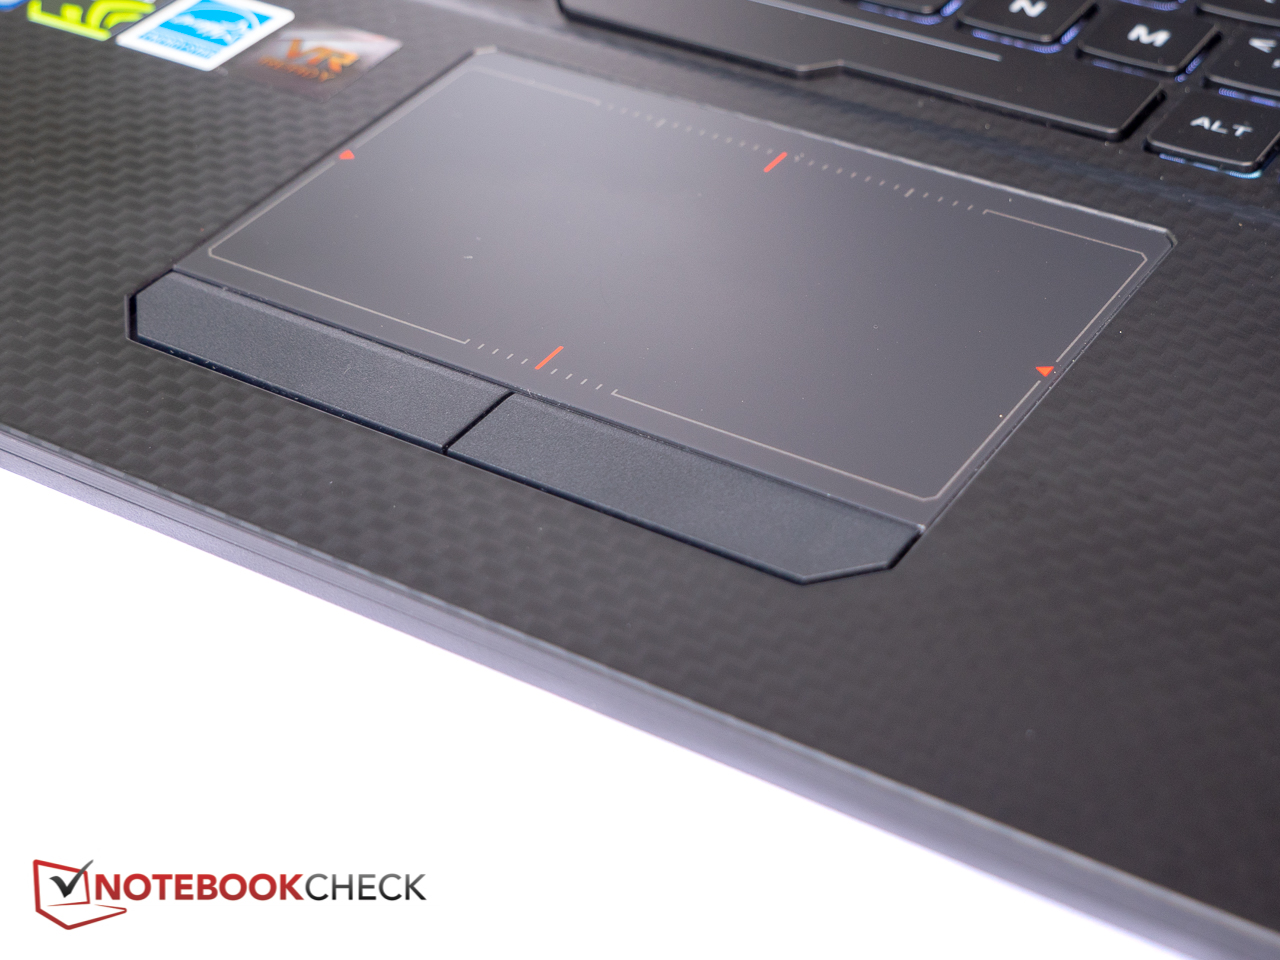
(+) The palmrests and touchpad are cooler than skin temperature with a maximum of 28 °C / 82.4 F and are therefore cool to the touch.
(±) The average temperature of the palmrest area of similar devices was 28.9 °C / 84 F (+0.9 °C / 1.6 F).
Asus Strix GL703GM-DS74 audio analysis
(-) | not very loud speakers (69.7 dB)
Bass 100 - 315 Hz
(±) | reduced bass - on average 7.3% lower than median
(±) | linearity of bass is average (10.8% delta to prev. frequency)
Mids 400 - 2000 Hz
(+) | balanced mids - only 2.2% away from median
(+) | mids are linear (5.6% delta to prev. frequency)
Highs 2 - 16 kHz
(+) | balanced highs - only 4.2% away from median
(±) | linearity of highs is average (13.1% delta to prev. frequency)
Overall 100 - 16.000 Hz
(±) | linearity of overall sound is average (15.6% difference to median)
Compared to same class
» 33% of all tested devices in this class were better, 6% similar, 61% worse
» The best had a delta of 6%, average was 18%, worst was 132%
Compared to all devices tested
» 19% of all tested devices were better, 4% similar, 77% worse
» The best had a delta of 4%, average was 25%, worst was 134%
Apple MacBook 12 (Early 2016) 1.1 GHz audio analysis
(+) | speakers can play relatively loud (83.6 dB)
Bass 100 - 315 Hz
(±) | reduced bass - on average 11.3% lower than median
(±) | linearity of bass is average (14.2% delta to prev. frequency)
Mids 400 - 2000 Hz
(+) | balanced mids - only 2.4% away from median
(+) | mids are linear (5.5% delta to prev. frequency)
Highs 2 - 16 kHz
(+) | balanced highs - only 2% away from median
(+) | highs are linear (4.5% delta to prev. frequency)
Overall 100 - 16.000 Hz
(+) | overall sound is linear (10.2% difference to median)
Compared to same class
» 5% of all tested devices in this class were better, 2% similar, 93% worse
» The best had a delta of 5%, average was 19%, worst was 53%
Compared to all devices tested
» 3% of all tested devices were better, 1% similar, 96% worse
» The best had a delta of 4%, average was 25%, worst was 134%
| desligado | |
| Ocioso | |
| Carga |
|
| Asus Strix GL703GM-DS74 i7-8750H, GeForce GTX 1060 Mobile, Samsung PM961 MZVLW256HEHP, TN LED, 1920x1080, 17.30 | Asus Strix GL703VM-DB74 i7-7700HQ, GeForce GTX 1060 Mobile, Seagate Mobile HDD 1TB ST1000LX015-1U7172, IPS, 1920x1080, 17.30 | MSI GP62 7REX-1045US i7-7700HQ, GeForce GTX 1050 Ti Mobile, Toshiba NVMe THNSN5128GP, TN LED, 1920x1080, 15.60 | MSI GE73 8RF-008 Raider RGB i7-8750H, GeForce GTX 1070 Mobile, Toshiba HG6 THNSNJ256G8NY, TN WLED, 1920x1080, 17.30 | HP Omen 17-an014ng i7-7700HQ, GeForce GTX 1070 Mobile, Samsung PM961 MZVLW256HEHP, IPS, 1920x1080, 17.30 | |
|---|---|---|---|---|---|
| Power Consumption | 15% | 27% | -2% | -11% | |
| Idle Minimum * | 18.88 | 17.3 8% | 14.6 23% | 15 21% | 22 -17% |
| Idle Average * | 24.36 | 21.8 11% | 17.2 29% | 20 18% | 28 -15% |
| Idle Maximum * | 32.27 | 23 29% | 17.3 46% | 26 19% | 35 -8% |
| Load Average * | 107.74 | 79.2 26% | 82.7 23% | 97 10% | 93 14% |
| Witcher 3 ultra * | 142 | 107 25% | 186 -31% | 157 -11% | |
| Load Maximum * | 160.28 | 158.2 1% | 136.7 15% | 239 -49% | 208 -30% |
* ... smaller is better
| Asus Strix GL703GM-DS74 i7-8750H, GeForce GTX 1060 Mobile, 74 Wh | Acer Aspire V17 Nitro BE VN7-793-738J i7-7700HQ, GeForce GTX 1060 Mobile, 69 Wh | MSI GE73 8RF-008 Raider RGB i7-8750H, GeForce GTX 1070 Mobile, 51 Wh | Asus GL703GE-ES73 i7-8750H, GeForce GTX 1050 Ti Mobile, 64 Wh | HP Omen 17-an014ng i7-7700HQ, GeForce GTX 1070 Mobile, 86 Wh | Razer Blade Pro RZ09-0220 i7-7700HQ, GeForce GTX 1060 Mobile, 70 Wh | Asus Strix GL703VM-DB74 i7-7700HQ, GeForce GTX 1060 Mobile, 64 Wh | MSI GP62 7REX-1045US i7-7700HQ, GeForce GTX 1050 Ti Mobile, 41 Wh | |
|---|---|---|---|---|---|---|---|---|
| Battery Runtime | 30% | -21% | 3% | 18% | 75% | -20% | -26% | |
| Reader / Idle | 320 | 303 -5% | 347 8% | 349 9% | 721 125% | 241 -25% | 259 -19% | |
| WiFi v1.3 | 213 | 277 30% | 186 -13% | 286 34% | 267 25% | 419 97% | 189 -11% | 174 -18% |
| Load | 70 | 38 -46% | 47 -33% | 84 20% | 72 3% | 53 -24% | 41 -41% |
Pro
Contra

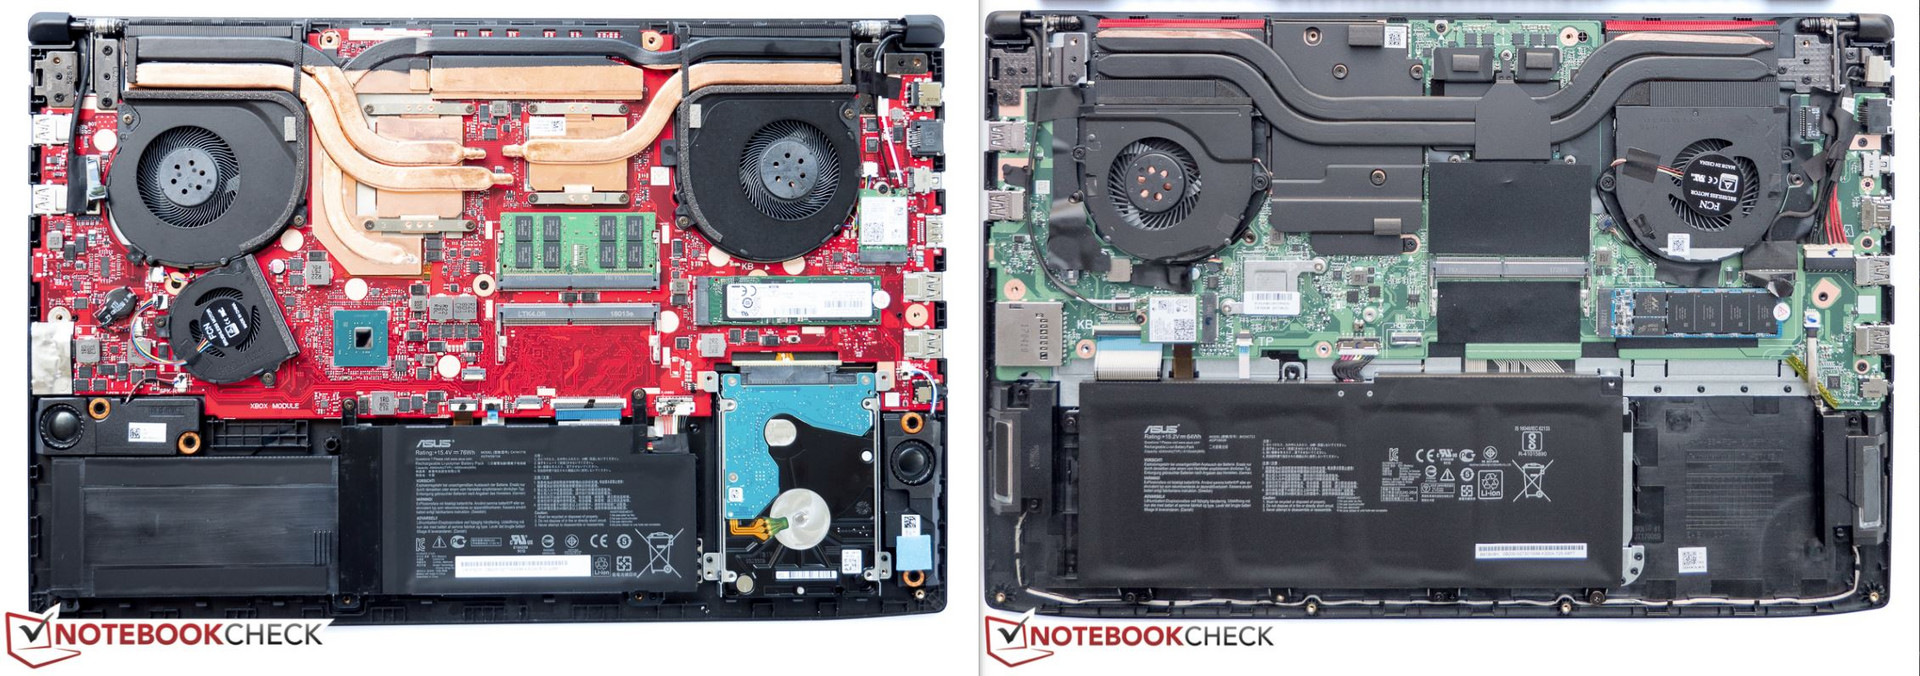
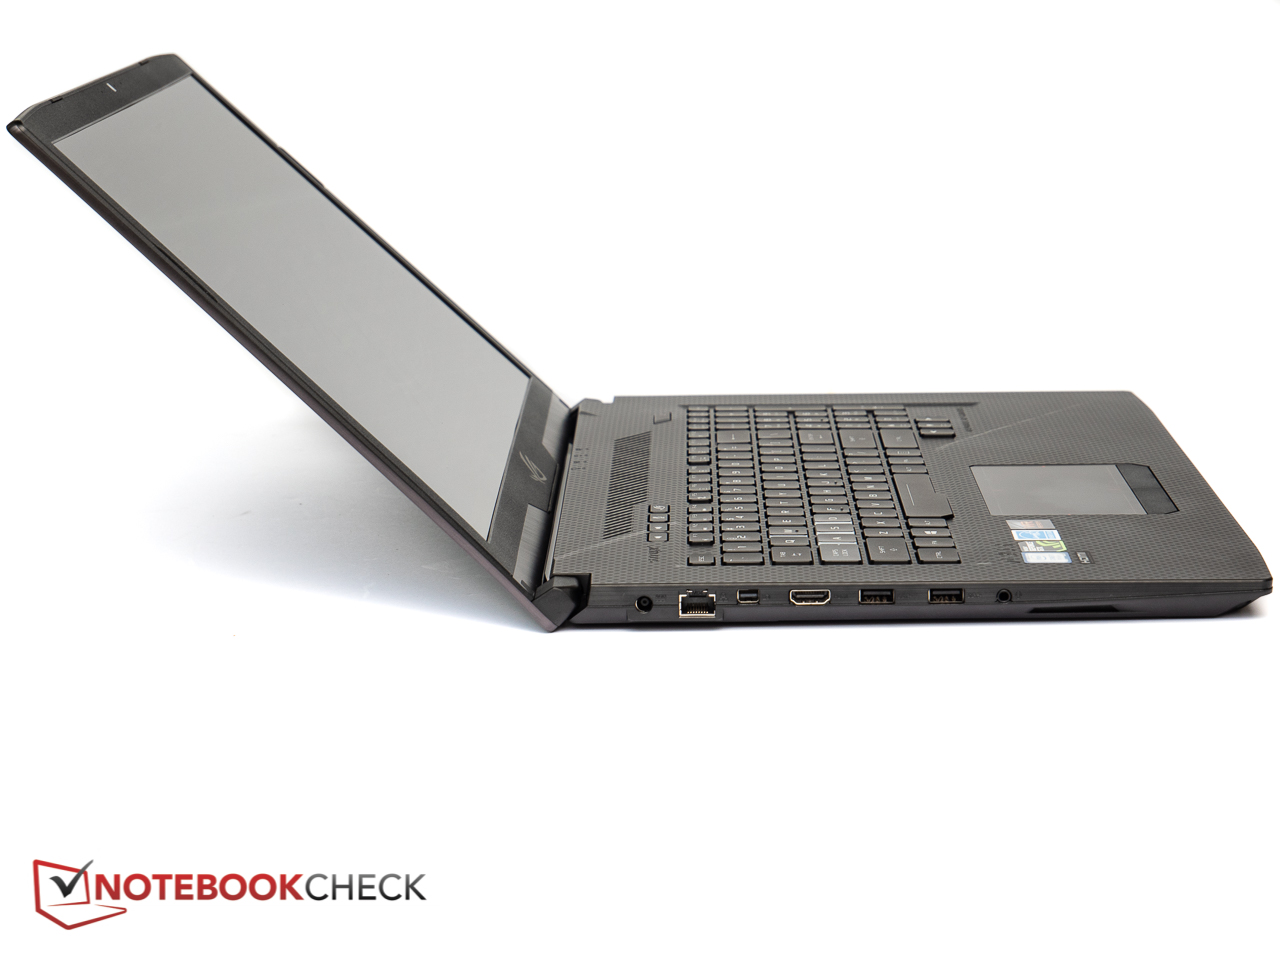
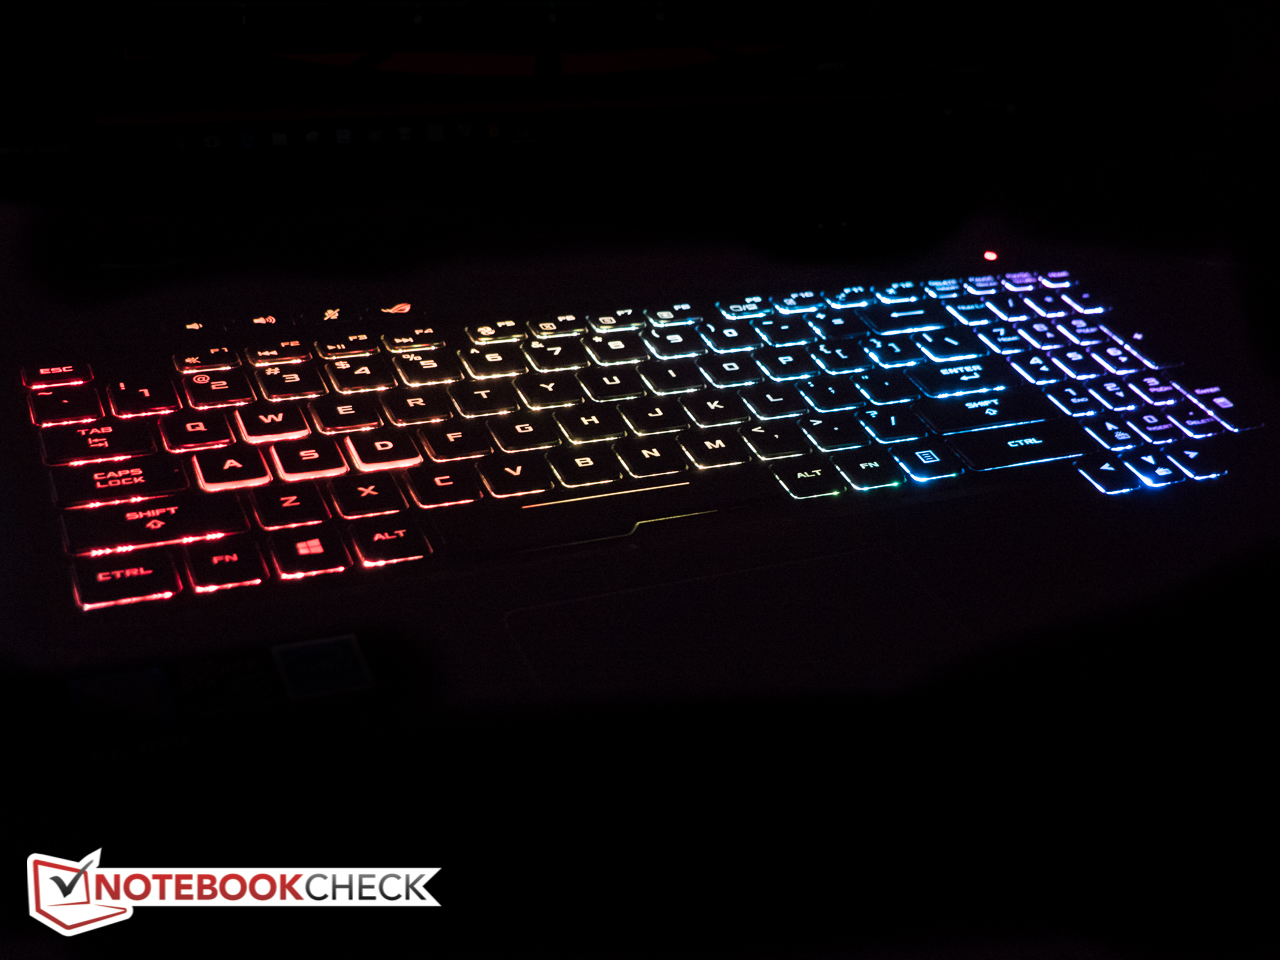
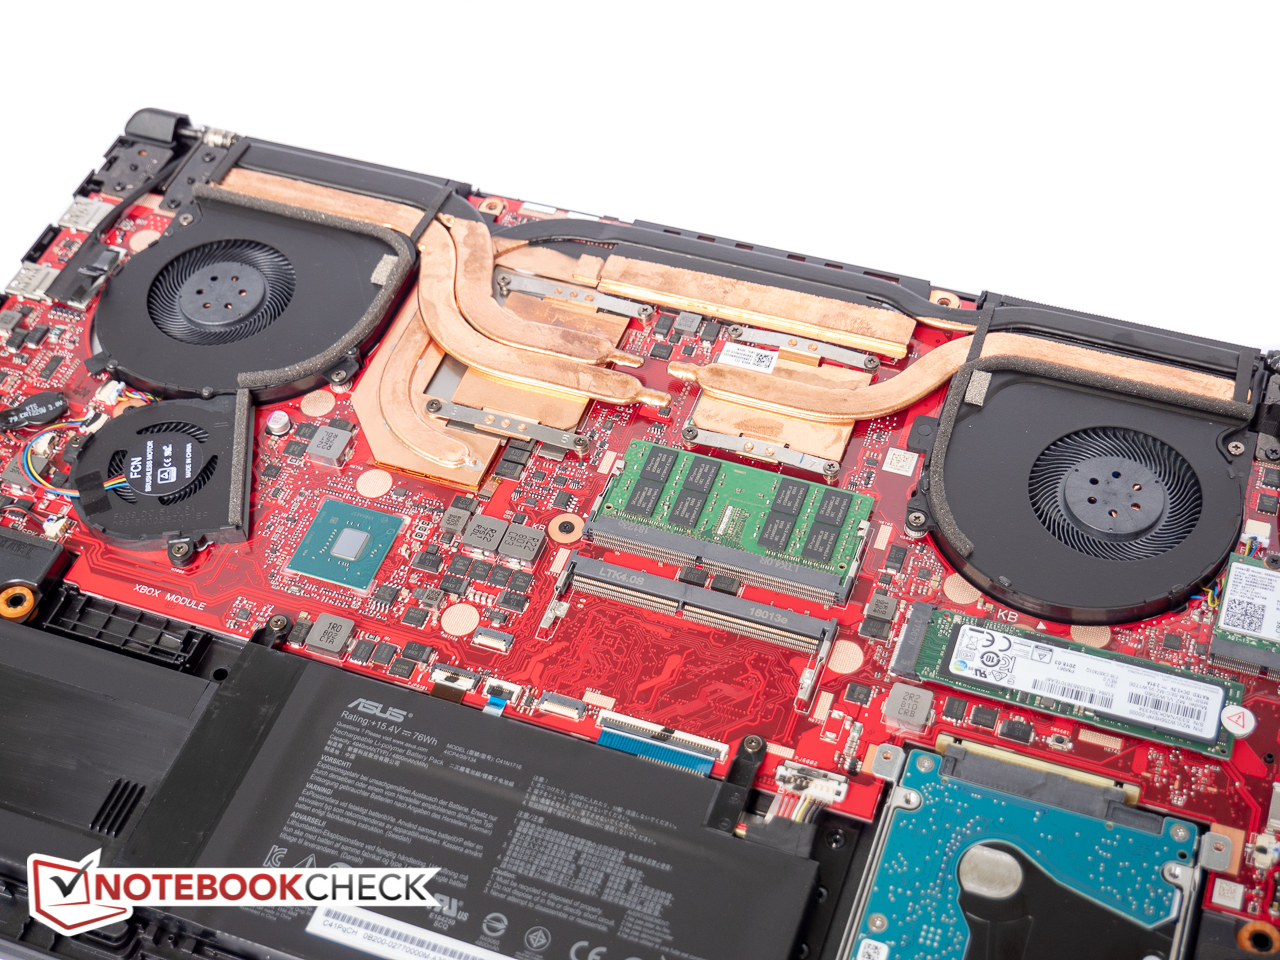
Muito melhor gerenciamento térmico graças a um sistema de tubulação de calor e ventilador redesenhados, um pouco menos ruído e um aumento no desempenho entre 15 e 25%: o GL703GM é uma melhoria definitiva sobre o GL703VD com o processador i7 da geração anterior. A troca de tela de um painel IPS de 120 Hz para um baseado na tecnologia TN é uma faca de dois gumes, dado que os tempos de resposta foram, é claro, muito melhorados com o custo reduzido dos ângulos de visão. Ainda assim, a maioria dos gamers provavelmente aceitará a mudança. A qualidade de construção é decente, os dispositivos de entrada são sólidos e a experiência de jogo não deixa nada a desejar.
A duração da bateria, infelizmente, continua a não impressionar, as ventoinhas do sistema continuam a ficar barulhentas e desagradáveis sob carga, e a omissão continuada de uma porta Thunderbolt 3 pode ser frustrante para alguns.
O GL703GM não gera tanto calor quanto os predecessores e é muito mais fácil de se viver com ele diariamente, mas alguns concorrentes oferecem um conjunto de recursos similar por menos dinheiro.
Os modelos ROG Strix da Asus geralmente não são oferecidos a preços de barganha e com um preço de mercado de $1.600, o GL703GM não é realmente uma exceção. O HP Omen 17 com CPU de 8ª geração, tela G-Sync de 144 Hz e um combo SSD de 128 GB/ HD de 1 TB é vendido por cerca de $200 a menos; usuários dispostos a dar um passo para trás para o processador quad-core i7 mais antigo podem obter um sistema como o Acer Predator Helios 300 com GTX 1070 de gama mais alta por cerca de $1.500.
Asus Strix GL703GM-DS74
-
07/01/2018 v6(old)
Bernie Pechlaner
Pricecompare
