 Deutsch
 English
 Español
 Français
 Italiano
 Nederlands
 Polski
 Português
 Русский
 Türkçe
 Svenska
 Chinese
 Magyar
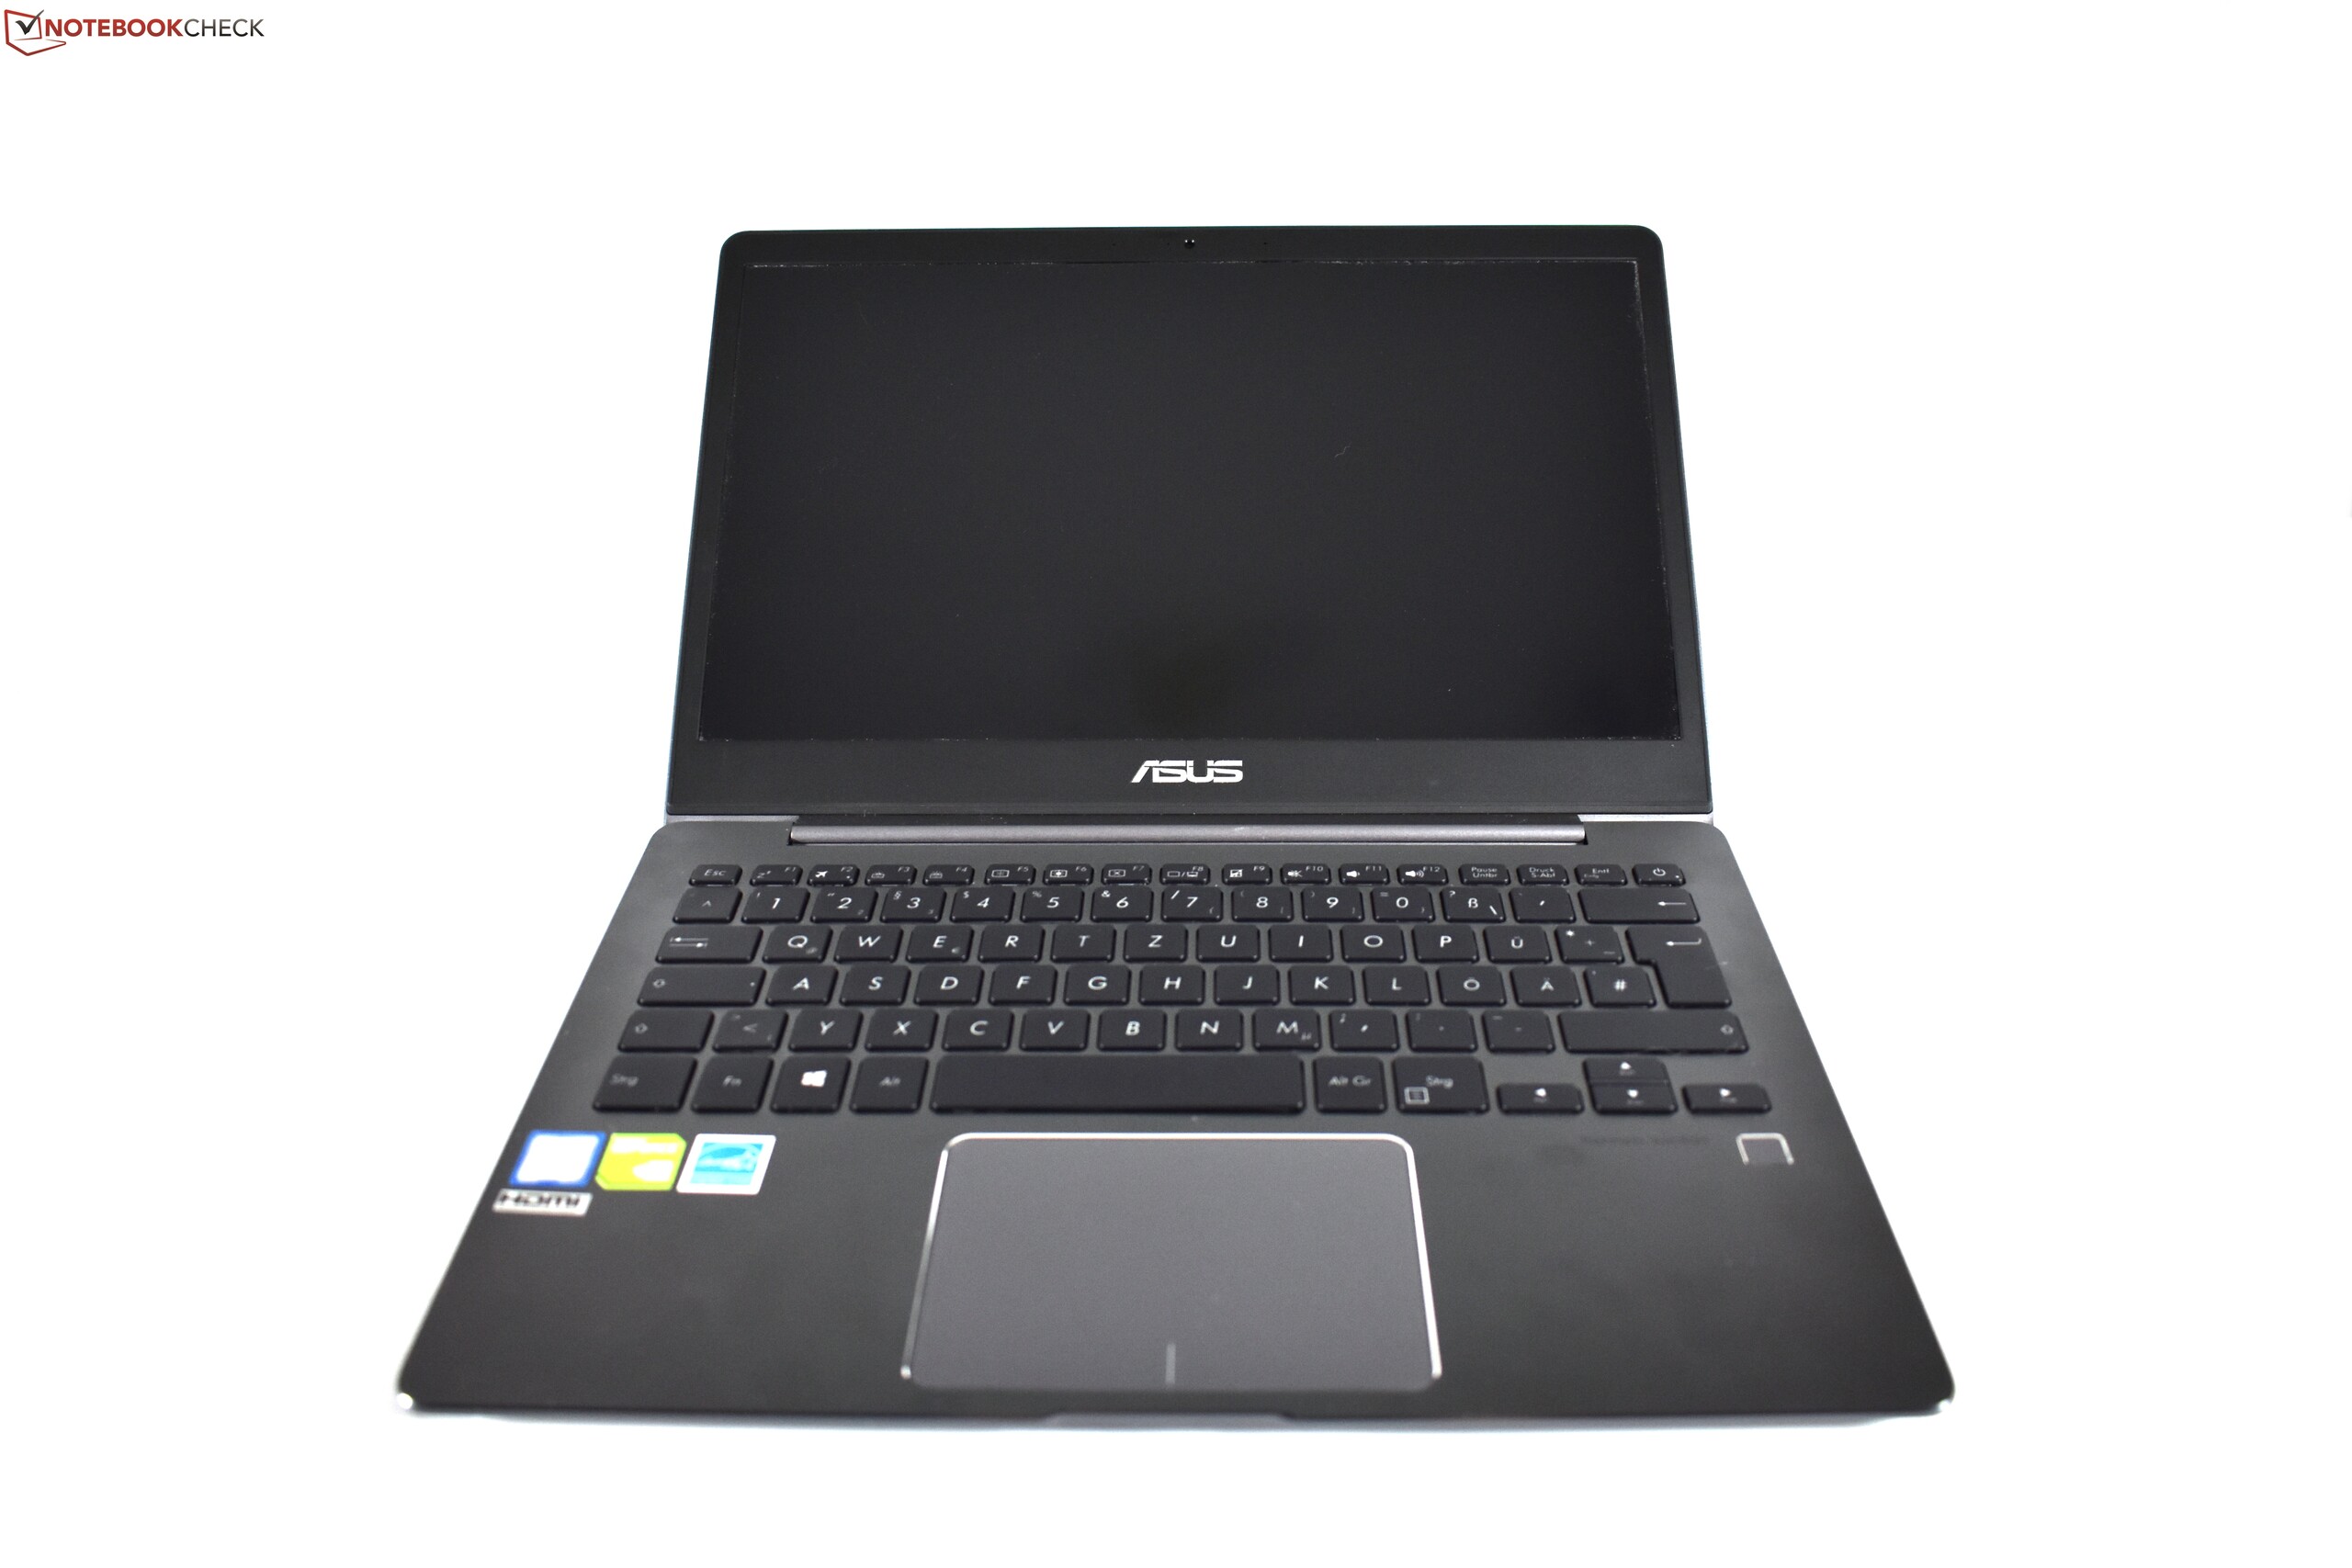
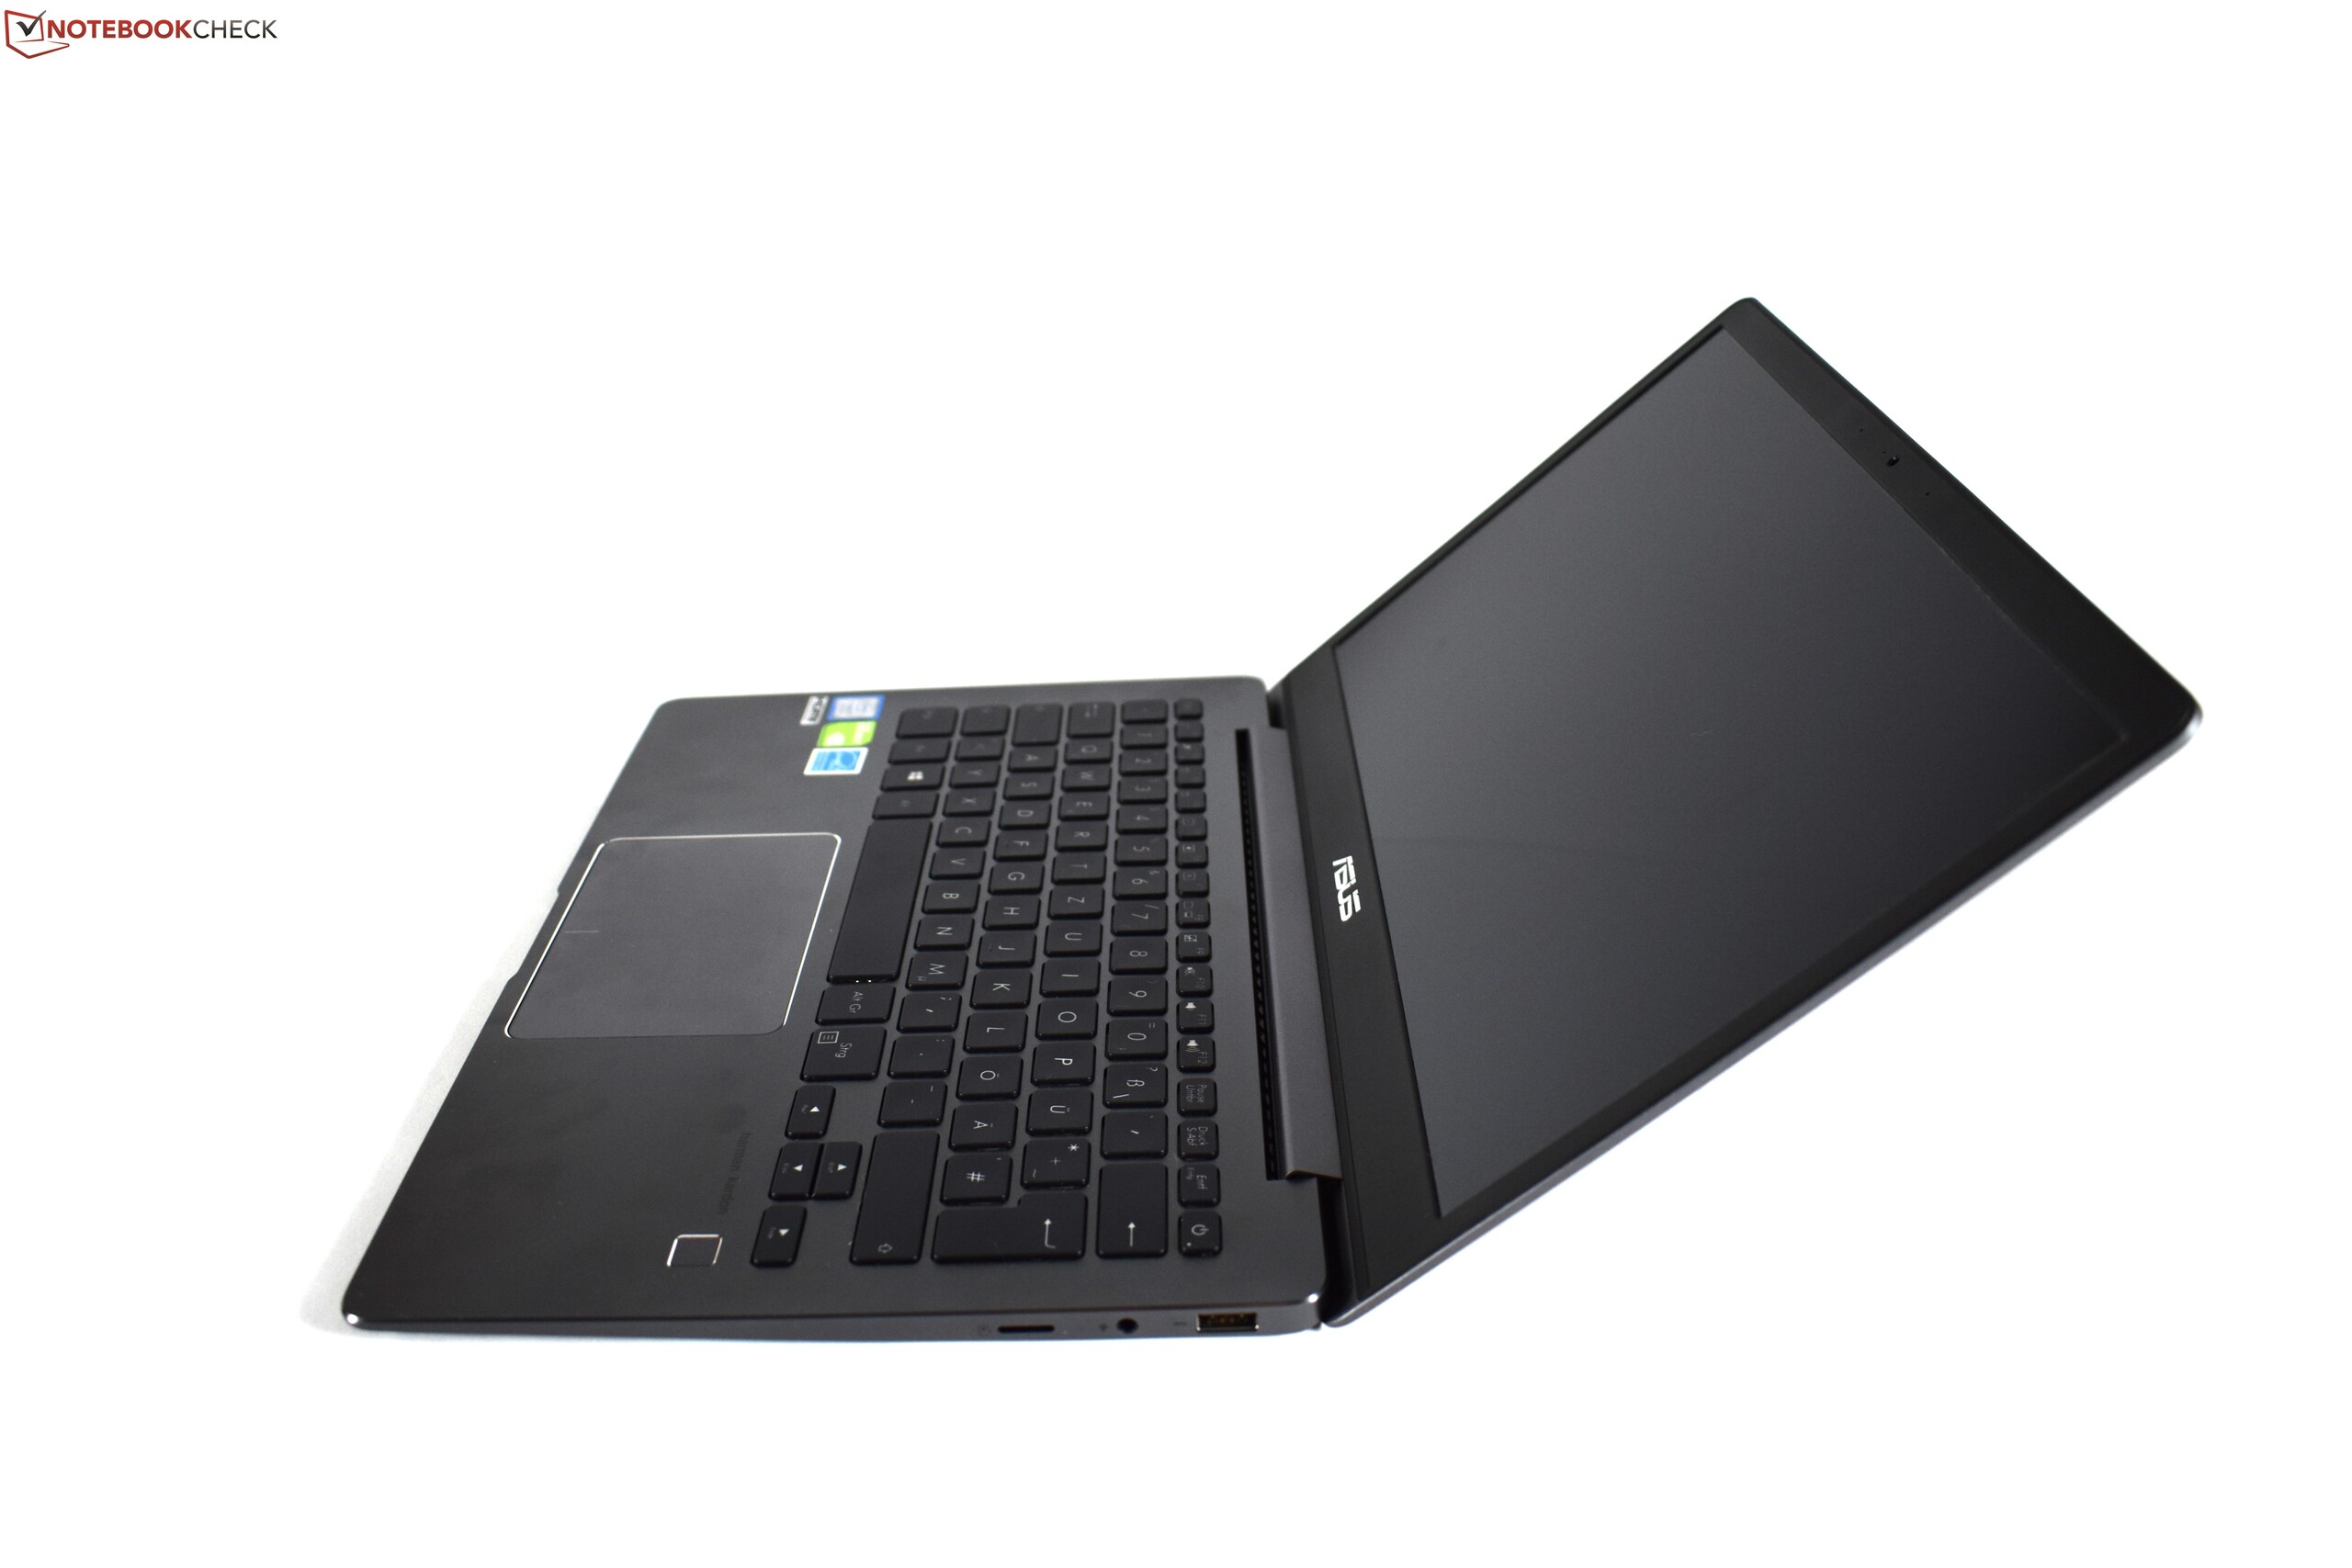
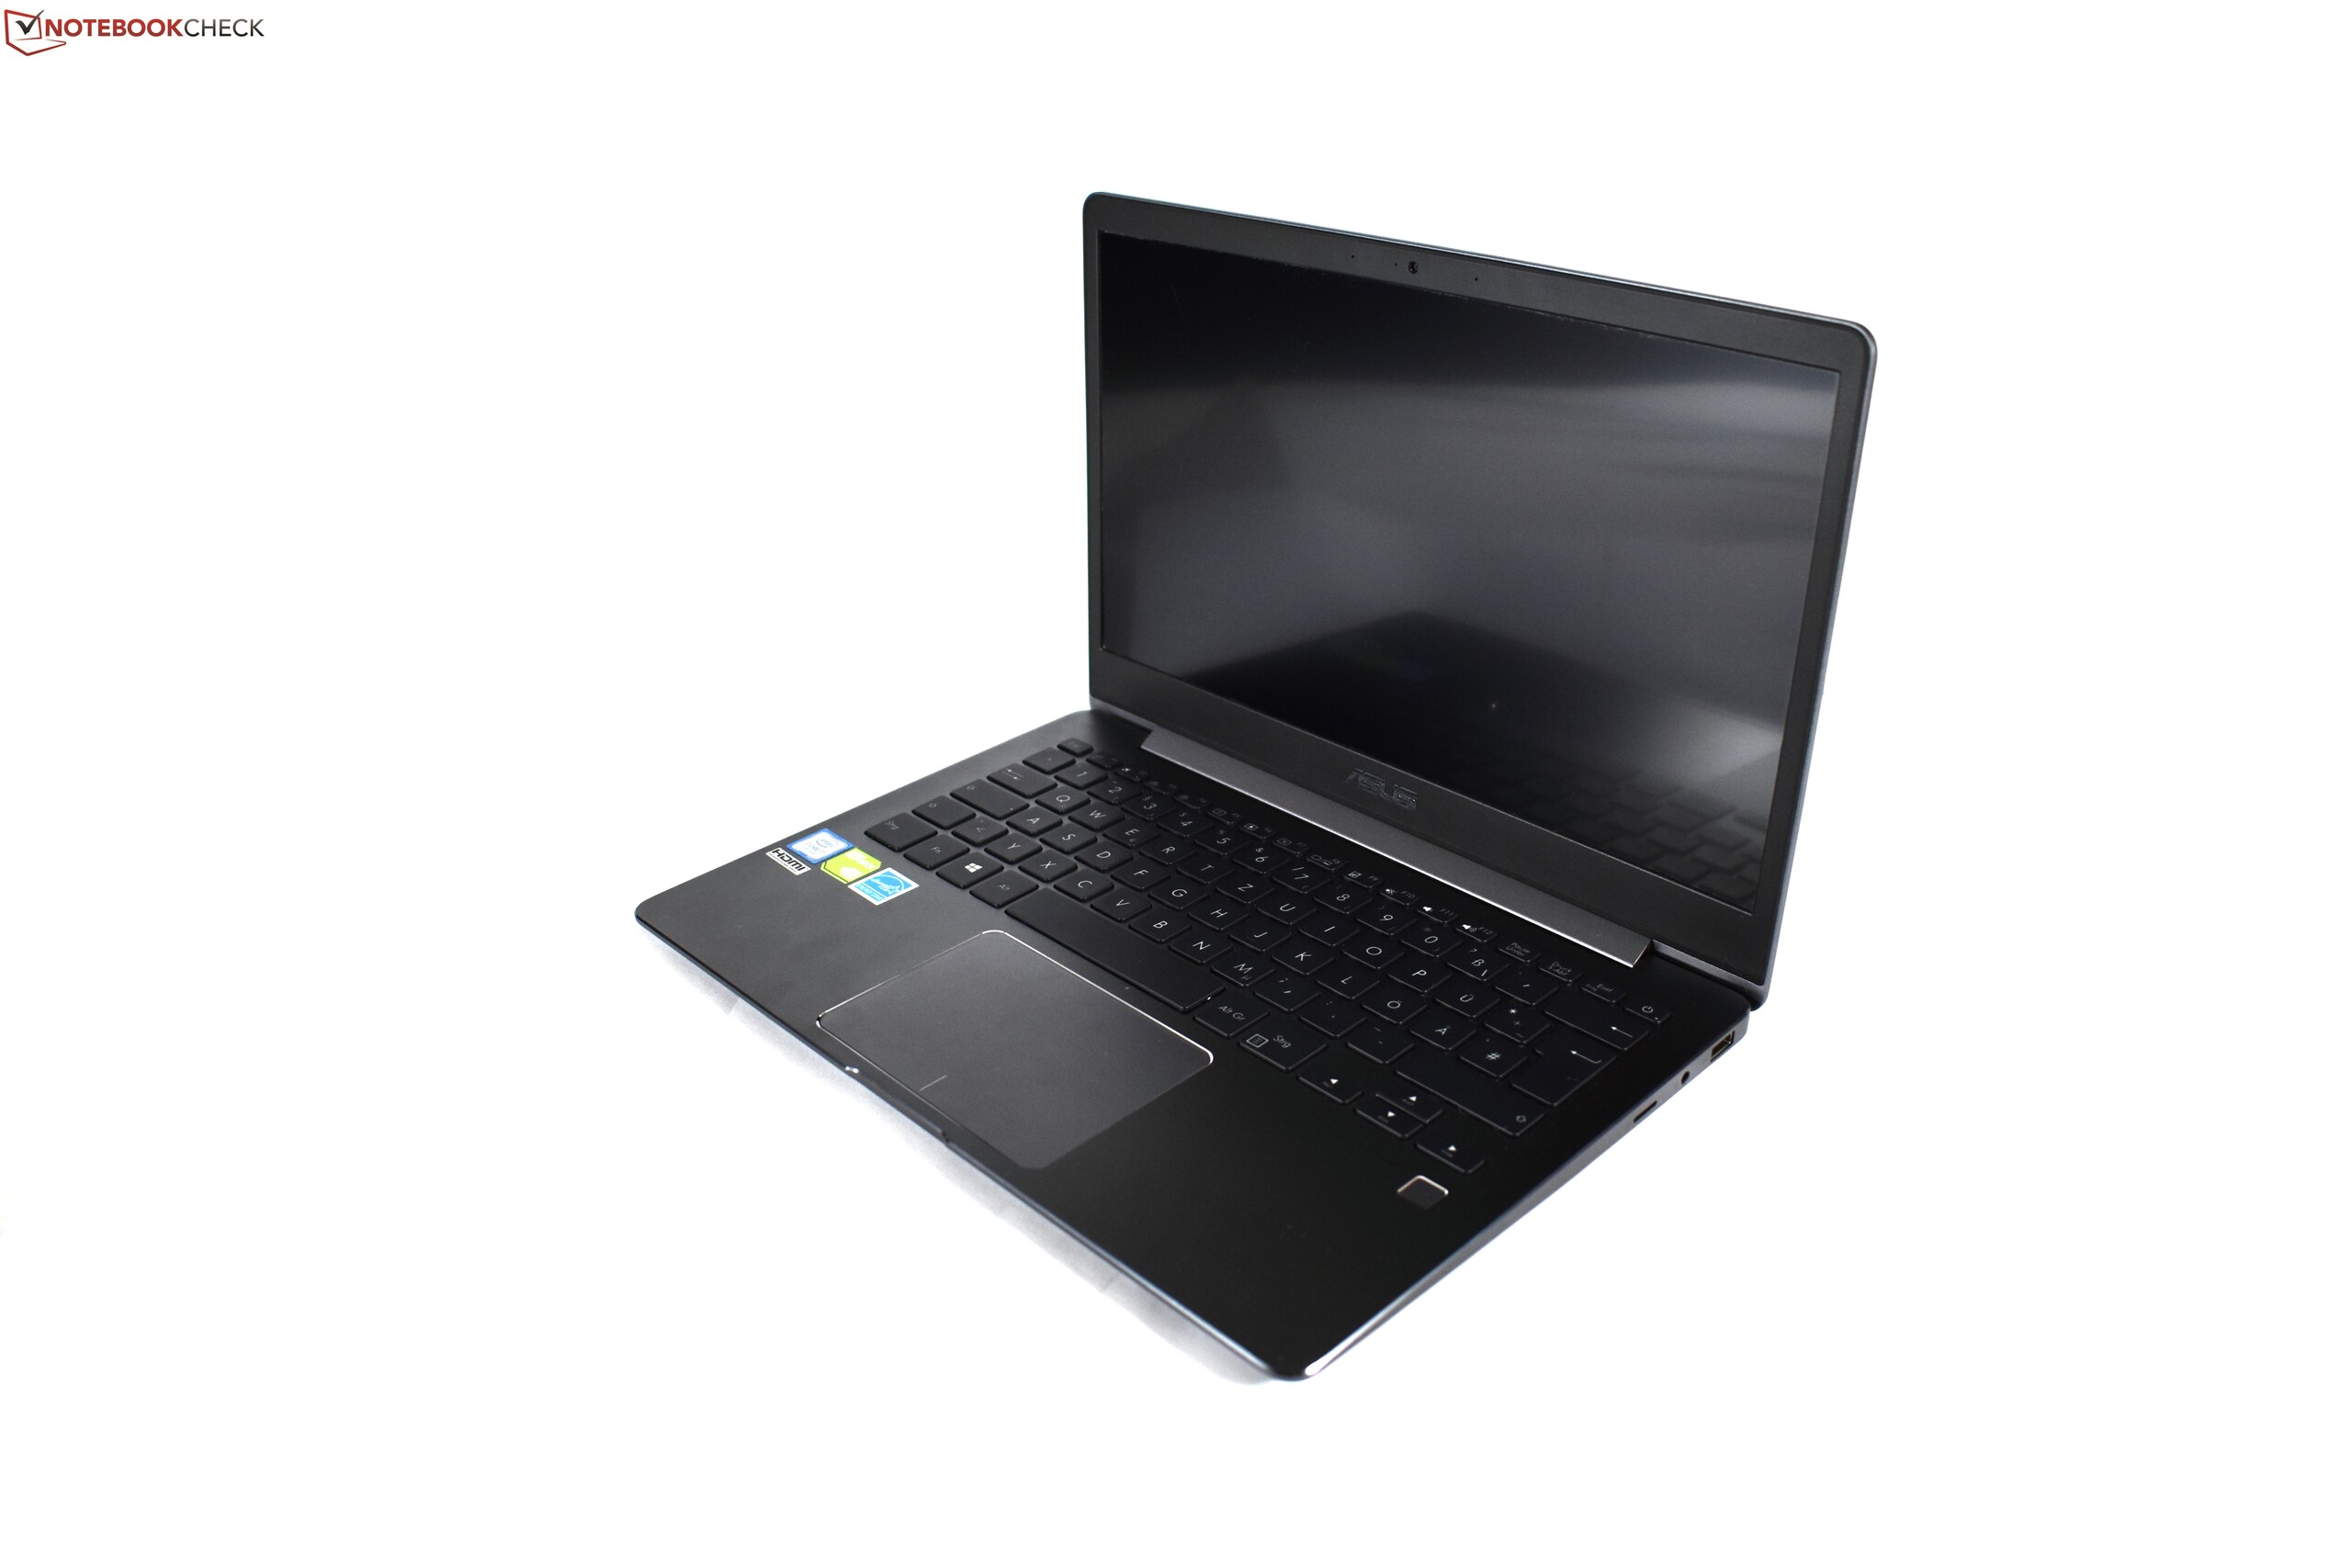
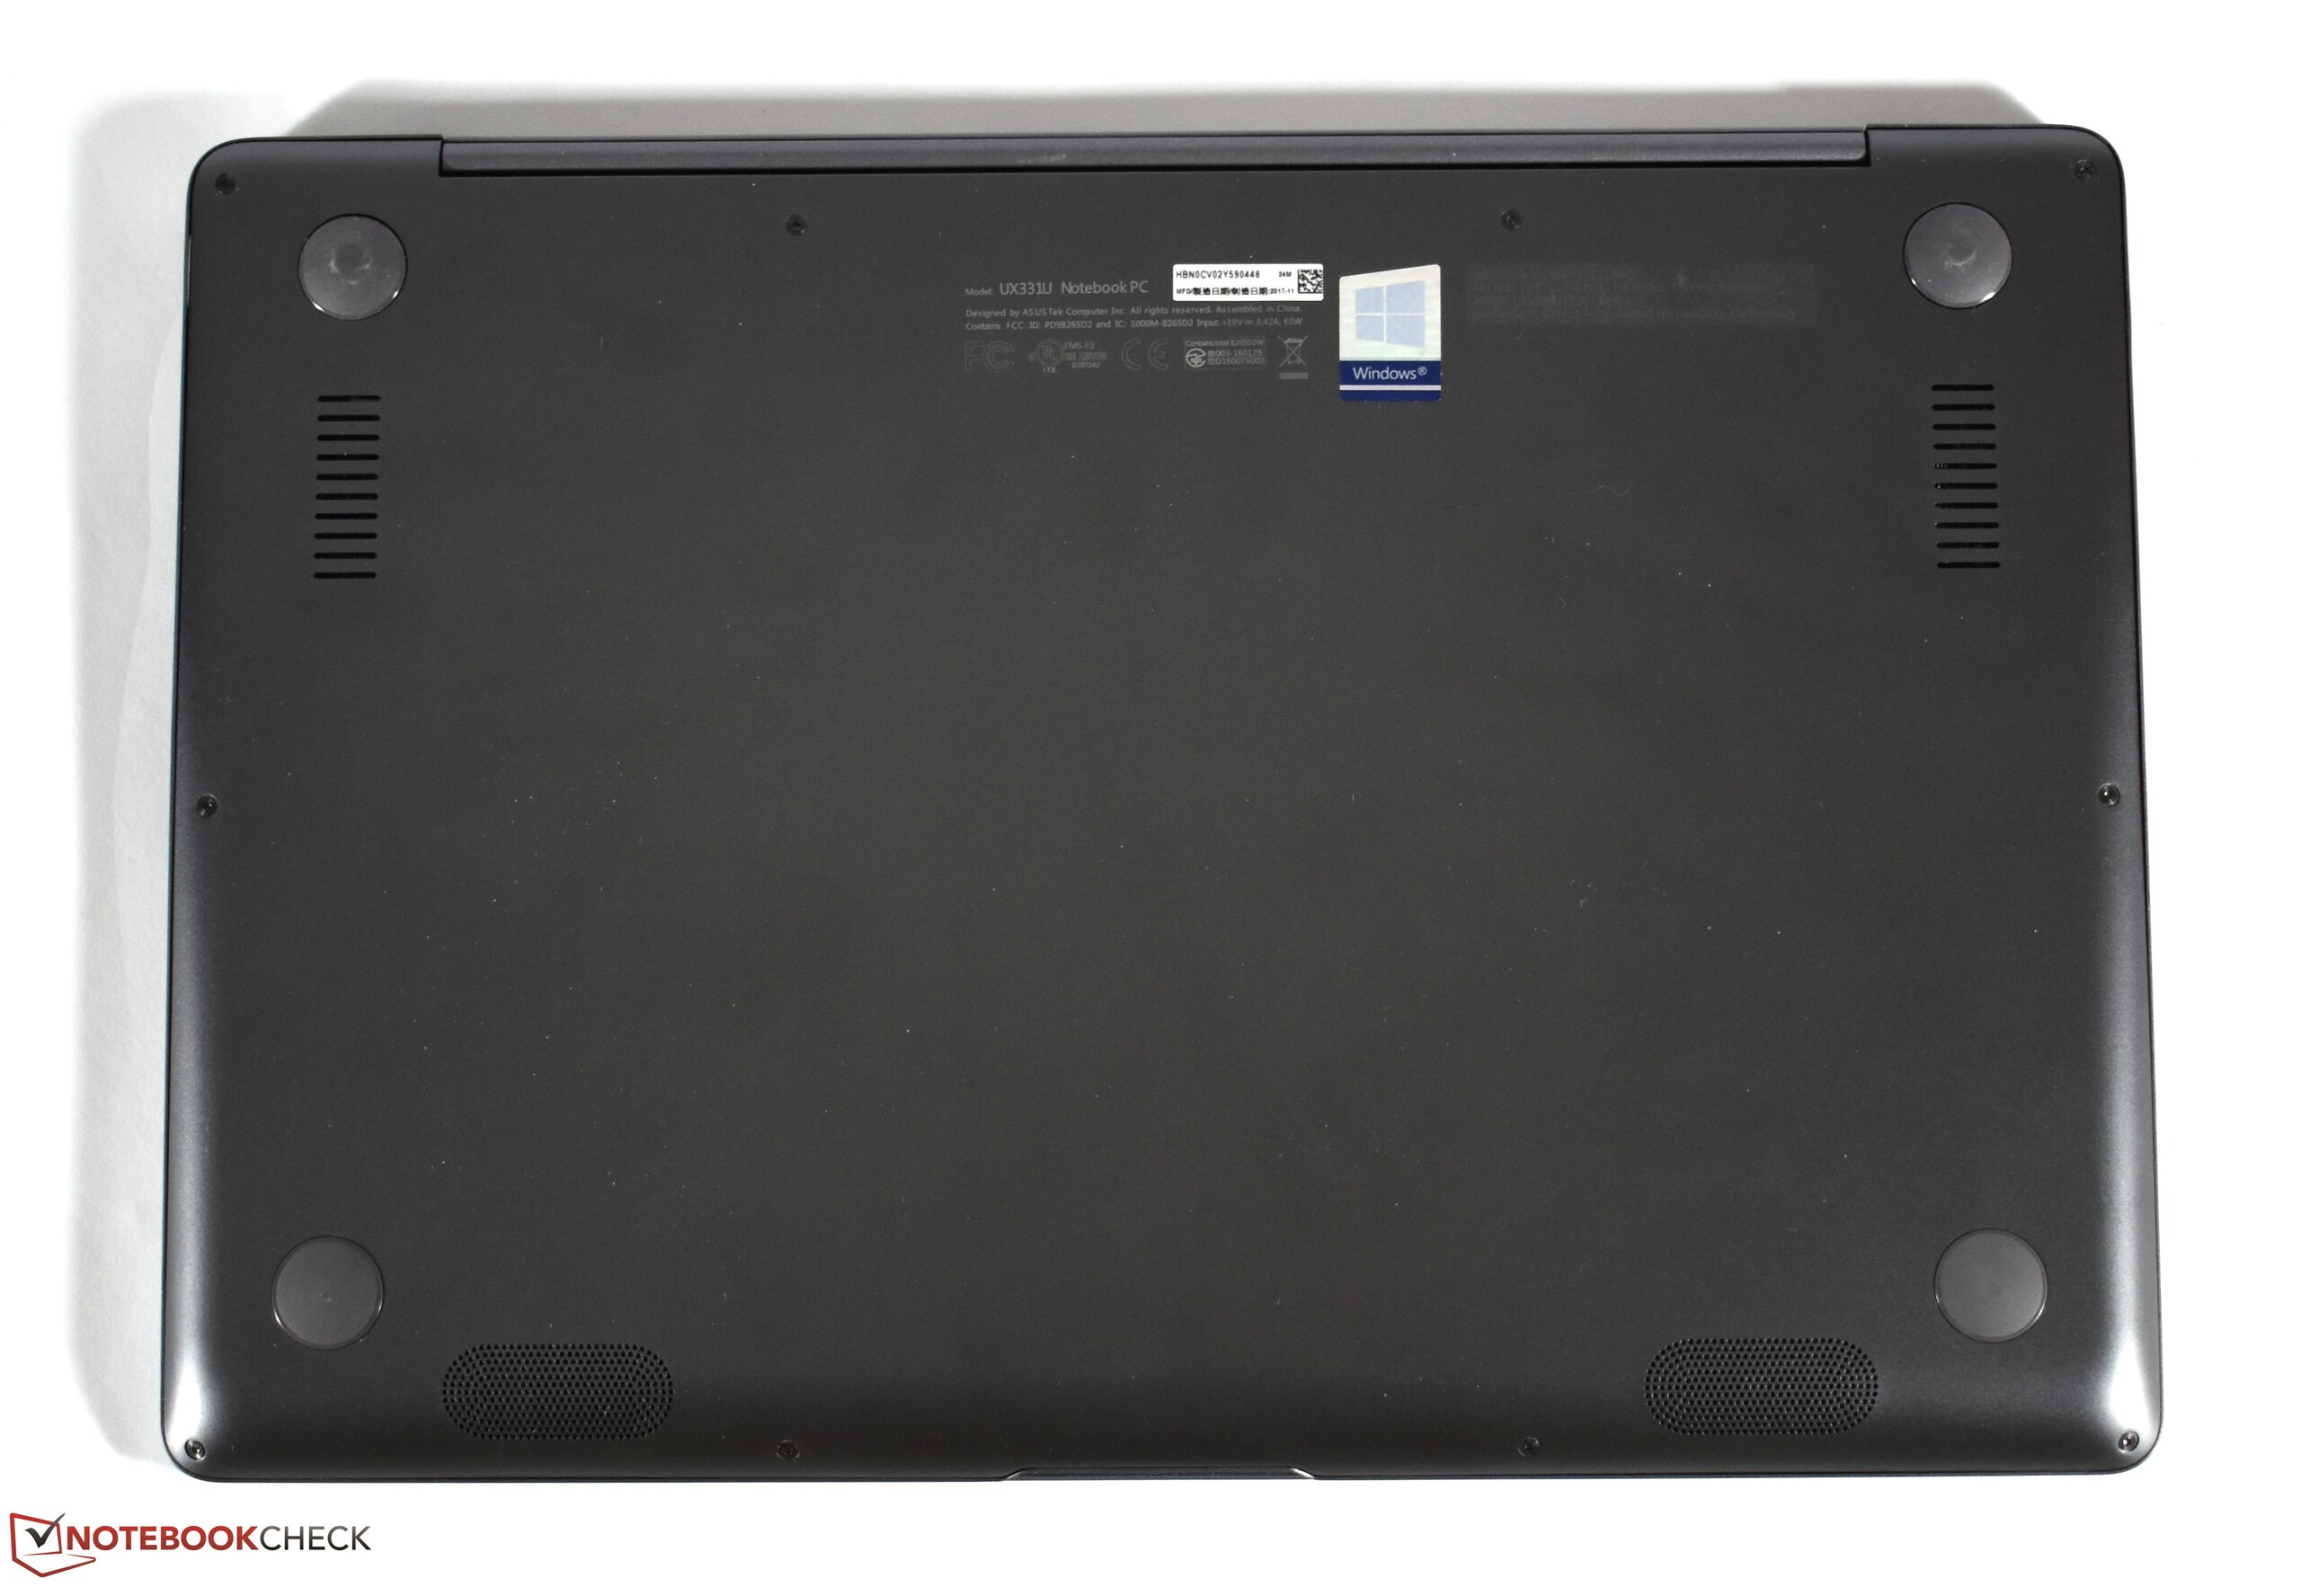
Breve Análise do Portátil Asus ZenBook 13 UX331UN (i7-8550U, MX150)
| SD Card Reader | |
| average JPG Copy Test (av. of 3 runs) | |
| Dell XPS 13 i7-8550U | |
| Lenovo IdeaPad 320S-13IKB (Toshiba Exceria Pro M501) | |
| Asus ZenBook 13 UX331UN (Toshiba Exceria Pro M501) | |
| HP Envy 13-ad006ng (Toshiba Exceria Pro SDXC 64 GB UHS-II) | |
| Acer Swift 3 SF314-52G-89SL (Toshiba Exceria Pro SDXC 64 GB UHS-II) | |
| maximum AS SSD Seq Read Test (1GB) | |
| Dell XPS 13 i7-8550U | |
| Lenovo IdeaPad 320S-13IKB (Toshiba Exceria Pro M501) | |
| Asus ZenBook 13 UX331UN (Toshiba Exceria Pro M501) | |
| HP Envy 13-ad006ng (Toshiba Exceria Pro SDXC 64 GB UHS-II) | |
| Acer Swift 3 SF314-52G-89SL (Toshiba Exceria Pro SDXC 64 GB UHS-II) | |
| |||||||||||||||||||||||||
iluminação: 90 %
iluminação com acumulador: 335 cd/m²
Contraste: 966:1 (Preto: 0.35 cd/m²)
ΔE Color 4.2 | 0.5-29.43 Ø5
ΔE Greyscale 3.9 | 0.57-98 Ø5.3
93.1% sRGB (Argyll 1.6.3 3D)
60.4% AdobeRGB 1998 (Argyll 1.6.3 3D)
66.4% AdobeRGB 1998 (Argyll 2.2.0 3D)
93.1% sRGB (Argyll 2.2.0 3D)
65.4% Display P3 (Argyll 2.2.0 3D)
Gamma: 2.43
| Asus ZenBook 13 UX331UN B133HAN04.9, , 1920x1080, 13.30 | Dell XPS 13 i7-8550U ID: Sharp SHP144A, Name: LQ133Z1, , 3200x1800, 13.30 | HP Envy 13-ad006ng BOE070E, , 1920x1080, 13.30 | Lenovo IdeaPad 320S-13IKB InfoVision M133NWF4R0, , 1920x1080, 13.30 | Acer Swift 3 SF314-52G-89SL AU Optronics B140HAN02.1, , 1920x1080, 14.00 | Dell XPS 13 9360 FHD i7 Iris SHP1449, , 1920x1080, 13.30 | |
|---|---|---|---|---|---|---|
| Display | -2% | -3% | 3% | -44% | -19% | |
| Display P3 Coverage | 65.4 | 63.6 -3% | 66.8 2% | 66.3 1% | 36.09 -45% | 51.6 -21% |
| sRGB Coverage | 93.1 | 93 0% | 86.3 -7% | 97.4 5% | 54.2 -42% | 77.4 -17% |
| AdobeRGB 1998 Coverage | 66.4 | 65.4 -2% | 63.1 -5% | 68.1 3% | 37.28 -44% | 53.3 -20% |
| Response Times | -23% | -59% | -78% | -32% | -40% | |
| Response Time Grey 50% / Grey 80% * | 22.4 ? | 35.6 ? -59% | 48 ? -114% | 56.8 ? -154% | 41 ? -83% | 41.2 ? -84% |
| Response Time Black / White * | 31.2 ? | 27.2 ? 13% | 32 ? -3% | 31.6 ? -1% | 25 ? 20% | 30 ? 4% |
| PWM Frequency | 19690 ? | 1000 ? | 198.4 ? | 19530 ? | ||
| Screen | -2% | -12% | 19% | -28% | 5% | |
| Brightness middle | 338 | 386.1 14% | 281 -17% | 330 -2% | 233 -31% | 461 36% |
| Brightness | 321 | 357 11% | 264 -18% | 304 -5% | 217 -32% | 418 30% |
| Brightness Distribution | 90 | 83 -8% | 83 -8% | 88 -2% | 88 -2% | 85 -6% |
| Black Level * | 0.35 | 0.33 6% | 0.23 34% | 0.25 29% | 0.27 23% | 0.2 43% |
| Contrast | 966 | 1170 21% | 1222 27% | 1320 37% | 863 -11% | 2305 139% |
| Colorchecker dE 2000 * | 4.2 | 4.2 -0% | 4.83 -15% | 1.8 57% | 5.85 -39% | 5.4 -29% |
| Colorchecker dE 2000 max. * | 6.5 | 7.6 -17% | 8.89 -37% | 4.3 34% | 11.51 -77% | 12.2 -88% |
| Greyscale dE 2000 * | 3.9 | 5.7 -46% | 6.63 -70% | 2.5 36% | 4.87 -25% | 5.4 -38% |
| Gamma | 2.43 91% | 2.28 96% | 1.85 119% | 2.11 104% | 2.47 89% | 2.15 102% |
| CCT | 7144 91% | 7336 89% | 6794 96% | 6588 99% | 6908 94% | 7258 90% |
| Color Space (Percent of AdobeRGB 1998) | 60.4 | 59 -2% | 56 -7% | 61.8 2% | 34 -44% | 48.6 -20% |
| Color Space (Percent of sRGB) | 93.1 | 92.2 -1% | 86 -8% | 97.3 5% | 54 -42% | 76.9 -17% |
| Total Average (Program / Settings) | -9% /
-5% | -25% /
-16% | -19% /
3% | -35% /
-32% | -18% /
-6% |
* ... smaller is better
Display Response Times
| ↔ Response Time Black to White | ||
|---|---|---|
| 31.2 ms ... rise ↗ and fall ↘ combined | ↗ 17.2 ms rise | 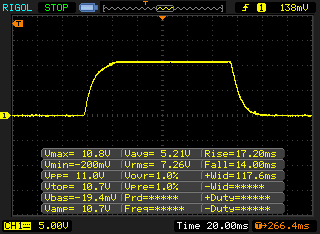 |
| ↘ 14 ms fall | ||
| The screen shows slow response rates in our tests and will be unsatisfactory for gamers. In comparison, all tested devices range from 0.1 (minimum) to 240 (maximum) ms. » 82 % of all devices are better. This means that the measured response time is worse than the average of all tested devices (21.5 ms). | ||
| ↔ Response Time 50% Grey to 80% Grey | ||
| 22.4 ms ... rise ↗ and fall ↘ combined | ↗ 10.8 ms rise | 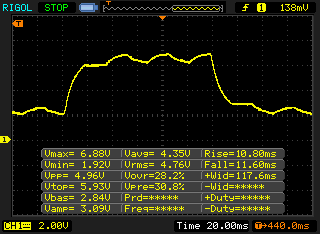 |
| ↘ 11.6 ms fall | ||
| The screen shows good response rates in our tests, but may be too slow for competitive gamers. In comparison, all tested devices range from 0.2 (minimum) to 636 (maximum) ms. » 28 % of all devices are better. This means that the measured response time is better than the average of all tested devices (33.7 ms). | ||
Screen Flickering / PWM (Pulse-Width Modulation)
| Screen flickering / PWM not detected |  | ||
In comparison: 53 % of all tested devices do not use PWM to dim the display. If PWM was detected, an average of 17900 (minimum: 5 - maximum: 3846000) Hz was measured. | |||
| PCMark 8 | |
| Home Score Accelerated v2 | |
| Acer Swift 3 SF314-52G-89SL | |
| Asus ZenBook 13 UX331UN | |
| Lenovo IdeaPad 320S-13IKB | |
| HP Envy 13-ad006ng | |
| Dell XPS 13 i7-8550U | |
| Work Score Accelerated v2 | |
| Asus ZenBook 13 UX331UN | |
| HP Envy 13-ad006ng | |
| Lenovo IdeaPad 320S-13IKB | |
| Dell XPS 13 i7-8550U | |
| PCMark 10 - Score | |
| Acer Swift 3 SF314-52G-89SL | |
| HP Envy 13-ad006ng | |
| Lenovo IdeaPad 320S-13IKB | |
| Asus ZenBook 13 UX331UN | |
| PCMark 8 Home Score Accelerated v2 | 3899 pontos | |
| PCMark 8 Work Score Accelerated v2 | 5037 pontos | |
| PCMark 10 Score | 3071 pontos | |
Ajuda | ||
| Asus ZenBook 13 UX331UN SanDisk SD8SN8U512G1002 | Dell XPS 13 i7-8550U Toshiba XG5 KXG50ZNV256G | HP Envy 13-ad006ng Toshiba NVMe THNSN5256GPUK | Lenovo IdeaPad 320S-13IKB Samsung PM961 NVMe MZVLW512HMJP | Acer Swift 3 SF314-52G-89SL Intel SSD 600p SSDPEKKW512G7 | |
|---|---|---|---|---|---|
| AS SSD | 58% | 38% | 258% | 108% | |
| Seq Read | 448.2 | 1277 185% | 1369 205% | 2310 415% | 1609 259% |
| Seq Write | 283.3 | 249.2 -12% | 247.8 -13% | 1479 422% | 567 100% |
| 4K Read | 25.47 | 28.17 11% | 31.22 23% | 50.3 97% | 29.55 16% |
| 4K Write | 49.58 | 101.7 105% | 89.4 80% | 127.6 157% | 117.5 137% |
| 4K-64 Read | 362.8 | 423.6 17% | 616 70% | 1226 238% | 506 39% |
| 4K-64 Write | 174.9 | 325.1 86% | 66.7 -62% | 1236 607% | 521 198% |
| Access Time Read * | 0.143 | 0.102 29% | 0.233 -63% | 0.063 56% | 0.07 51% |
| Access Time Write * | 0.09 | 0.051 43% | 0.034 62% | 0.029 68% | 0.031 66% |
* ... smaller is better

| 3DMark 11 - 1280x720 Performance GPU | |
| Acer Swift 3 SF314-52G-89SL | |
| Asus ZenBook 13 UX331UN | |
| HP Envy 13-ad006ng | |
| Lenovo IdeaPad 320S-13IKB | |
| Dell XPS 13 i7-8550U | |
| 3DMark | |
| 1280x720 Cloud Gate Standard Graphics | |
| Asus ZenBook 13 UX331UN | |
| HP Envy 13-ad006ng | |
| Lenovo IdeaPad 320S-13IKB | |
| Dell XPS 13 i7-8550U | |
| 1920x1080 Fire Strike Graphics | |
| Asus ZenBook 13 UX331UN | |
| HP Envy 13-ad006ng | |
| Lenovo IdeaPad 320S-13IKB | |
| Dell XPS 13 i7-8550U | |
| 3DMark 11 Performance | 3811 pontos | |
| 3DMark Cloud Gate Standard Score | 9861 pontos | |
| 3DMark Fire Strike Score | 2563 pontos | |
Ajuda | ||
| BioShock Infinite - 1920x1080 Ultra Preset, DX11 (DDOF) | |
| Acer Swift 3 SF314-52G-89SL | |
| Asus ZenBook 13 UX331UN | |
| HP Envy 13-ad006ng | |
| HP Envy x360 15m-bq121dx | |
| Dell XPS 13 i7-8550U | |
| The Witcher 3 - 1366x768 Medium Graphics & Postprocessing | |
| Asus ZenBook 13 UX331UN | |
| HP Envy 13-ad006ng | |
| Lenovo IdeaPad 320S-13IKB | |
| baixo | média | alto | ultra | |
| BioShock Infinite (2013) | 101 | 77.9 | 68.5 | 29.91 |
| The Witcher 3 (2015) | 55.1 | 32.44 | 14.1 | 8.9 |
| Doom (2016) | 58.8 | 49.43 | 21.89 |
Barulho
| Ocioso |
| 29.6 / 29.6 / 29.6 dB |
| Carga |
| 41.7 / 43.5 dB |
 | ||
30 dB silencioso 40 dB(A) audível 50 dB(A) ruidosamente alto |
||
min: | ||
(±) The maximum temperature on the upper side is 40.9 °C / 106 F, compared to the average of 35.9 °C / 97 F, ranging from 21.4 to 59 °C for the class Subnotebook.
(+) The bottom heats up to a maximum of 38.1 °C / 101 F, compared to the average of 39.4 °C / 103 F
(+) In idle usage, the average temperature for the upper side is 23.1 °C / 74 F, compared to the device average of 30.7 °C / 87 F.
(±) Playing The Witcher 3, the average temperature for the upper side is 34.8 °C / 95 F, compared to the device average of 30.7 °C / 87 F.
(+) The palmrests and touchpad are cooler than skin temperature with a maximum of 28.6 °C / 83.5 F and are therefore cool to the touch.
(±) The average temperature of the palmrest area of similar devices was 28.3 °C / 82.9 F (-0.3 °C / -0.6 F).
Asus ZenBook 13 UX331UN audio analysis
(+) | speakers can play relatively loud (82.8 dB)
Bass 100 - 315 Hz
(-) | nearly no bass - on average 16.9% lower than median
(±) | linearity of bass is average (9% delta to prev. frequency)
Mids 400 - 2000 Hz
(+) | balanced mids - only 4.3% away from median
(+) | mids are linear (4.2% delta to prev. frequency)
Highs 2 - 16 kHz
(+) | balanced highs - only 1.8% away from median
(+) | highs are linear (3.4% delta to prev. frequency)
Overall 100 - 16.000 Hz
(+) | overall sound is linear (14.4% difference to median)
Compared to same class
» 23% of all tested devices in this class were better, 5% similar, 71% worse
» The best had a delta of 5%, average was 19%, worst was 53%
Compared to all devices tested
» 15% of all tested devices were better, 4% similar, 82% worse
» The best had a delta of 4%, average was 25%, worst was 134%
Dell XPS 13 i7-8550U audio analysis
(-) | not very loud speakers (66.8 dB)
Bass 100 - 315 Hz
(+) | good bass - only 4.5% away from median
(±) | linearity of bass is average (8.2% delta to prev. frequency)
Mids 400 - 2000 Hz
(±) | higher mids - on average 5% higher than median
(+) | mids are linear (5.8% delta to prev. frequency)
Highs 2 - 16 kHz
(+) | balanced highs - only 3% away from median
(±) | linearity of highs is average (14.5% delta to prev. frequency)
Overall 100 - 16.000 Hz
(±) | linearity of overall sound is average (17.2% difference to median)
Compared to same class
» 38% of all tested devices in this class were better, 10% similar, 52% worse
» The best had a delta of 5%, average was 19%, worst was 53%
Compared to all devices tested
» 26% of all tested devices were better, 8% similar, 66% worse
» The best had a delta of 4%, average was 25%, worst was 134%
| desligado | |
| Ocioso | |
| Carga |
|
| Asus ZenBook 13 UX331UN i5-8550U, GeForce MX150, SanDisk SD8SN8U512G1002, IPS LED, 1920x1080, 13.30 | Dell XPS 13 i7-8550U i5-8550U, UHD Graphics 620, Toshiba XG5 KXG50ZNV256G, IGZO IPS, 3200x1800, 13.30 | HP Envy 13-ad006ng i7-7500U, GeForce MX150, Toshiba NVMe THNSN5256GPUK, IPS LED, 1920x1080, 13.30 | Lenovo IdeaPad 320S-13IKB i5-8250U, GeForce MX150, Samsung PM961 NVMe MZVLW512HMJP, IPS LED, 1920x1080, 13.30 | Acer Swift 3 SF314-52G-89SL i5-8550U, GeForce MX150, Intel SSD 600p SSDPEKKW512G7, IPS, 1920x1080, 14.00 | |
|---|---|---|---|---|---|
| Power Consumption | -8% | -9% | -17% | -36% | |
| Idle Minimum * | 2.7 | 4.1 -52% | 2.8 -4% | 3.4 -26% | 4.4 -63% |
| Idle Average * | 5.3 | 5.8 -9% | 5.8 -9% | 6.1 -15% | 6.6 -25% |
| Idle Maximum * | 6.2 | 6 3% | 7.7 -24% | 7.7 -24% | 9.2 -48% |
| Load Average * | 37.6 | 42.5 -13% | 48 -28% | 44.2 -18% | 61 -62% |
| Load Maximum * | 60.1 | 41.4 31% | 48 20% | 60.3 -0% | 50 17% |
| Witcher 3 ultra * | 35 | 37.6 | 40 |
* ... smaller is better
| Asus ZenBook 13 UX331UN i5-8550U, GeForce MX150, 50 Wh | Dell XPS 13 i7-8550U i5-8550U, UHD Graphics 620, 60 Wh | HP Envy 13-ad006ng i7-7500U, GeForce MX150, 51 Wh | Lenovo IdeaPad 320S-13IKB i5-8250U, GeForce MX150, 36 Wh | Acer Swift 3 SF314-52G-89SL i5-8550U, GeForce MX150, 48 Wh | |
|---|---|---|---|---|---|
| Battery Runtime | 7% | -11% | -39% | -8% | |
| Reader / Idle | 1321 | 1108 -16% | 1198 -9% | 736 -44% | |
| H.264 | 576 | 476 -17% | 346 -40% | ||
| WiFi v1.3 | 504 | 589 17% | 425 -16% | 344 -32% | 465 -8% |
| Load | 120 | 143 19% | 118 -2% | 73 -39% |
Pro
Contra

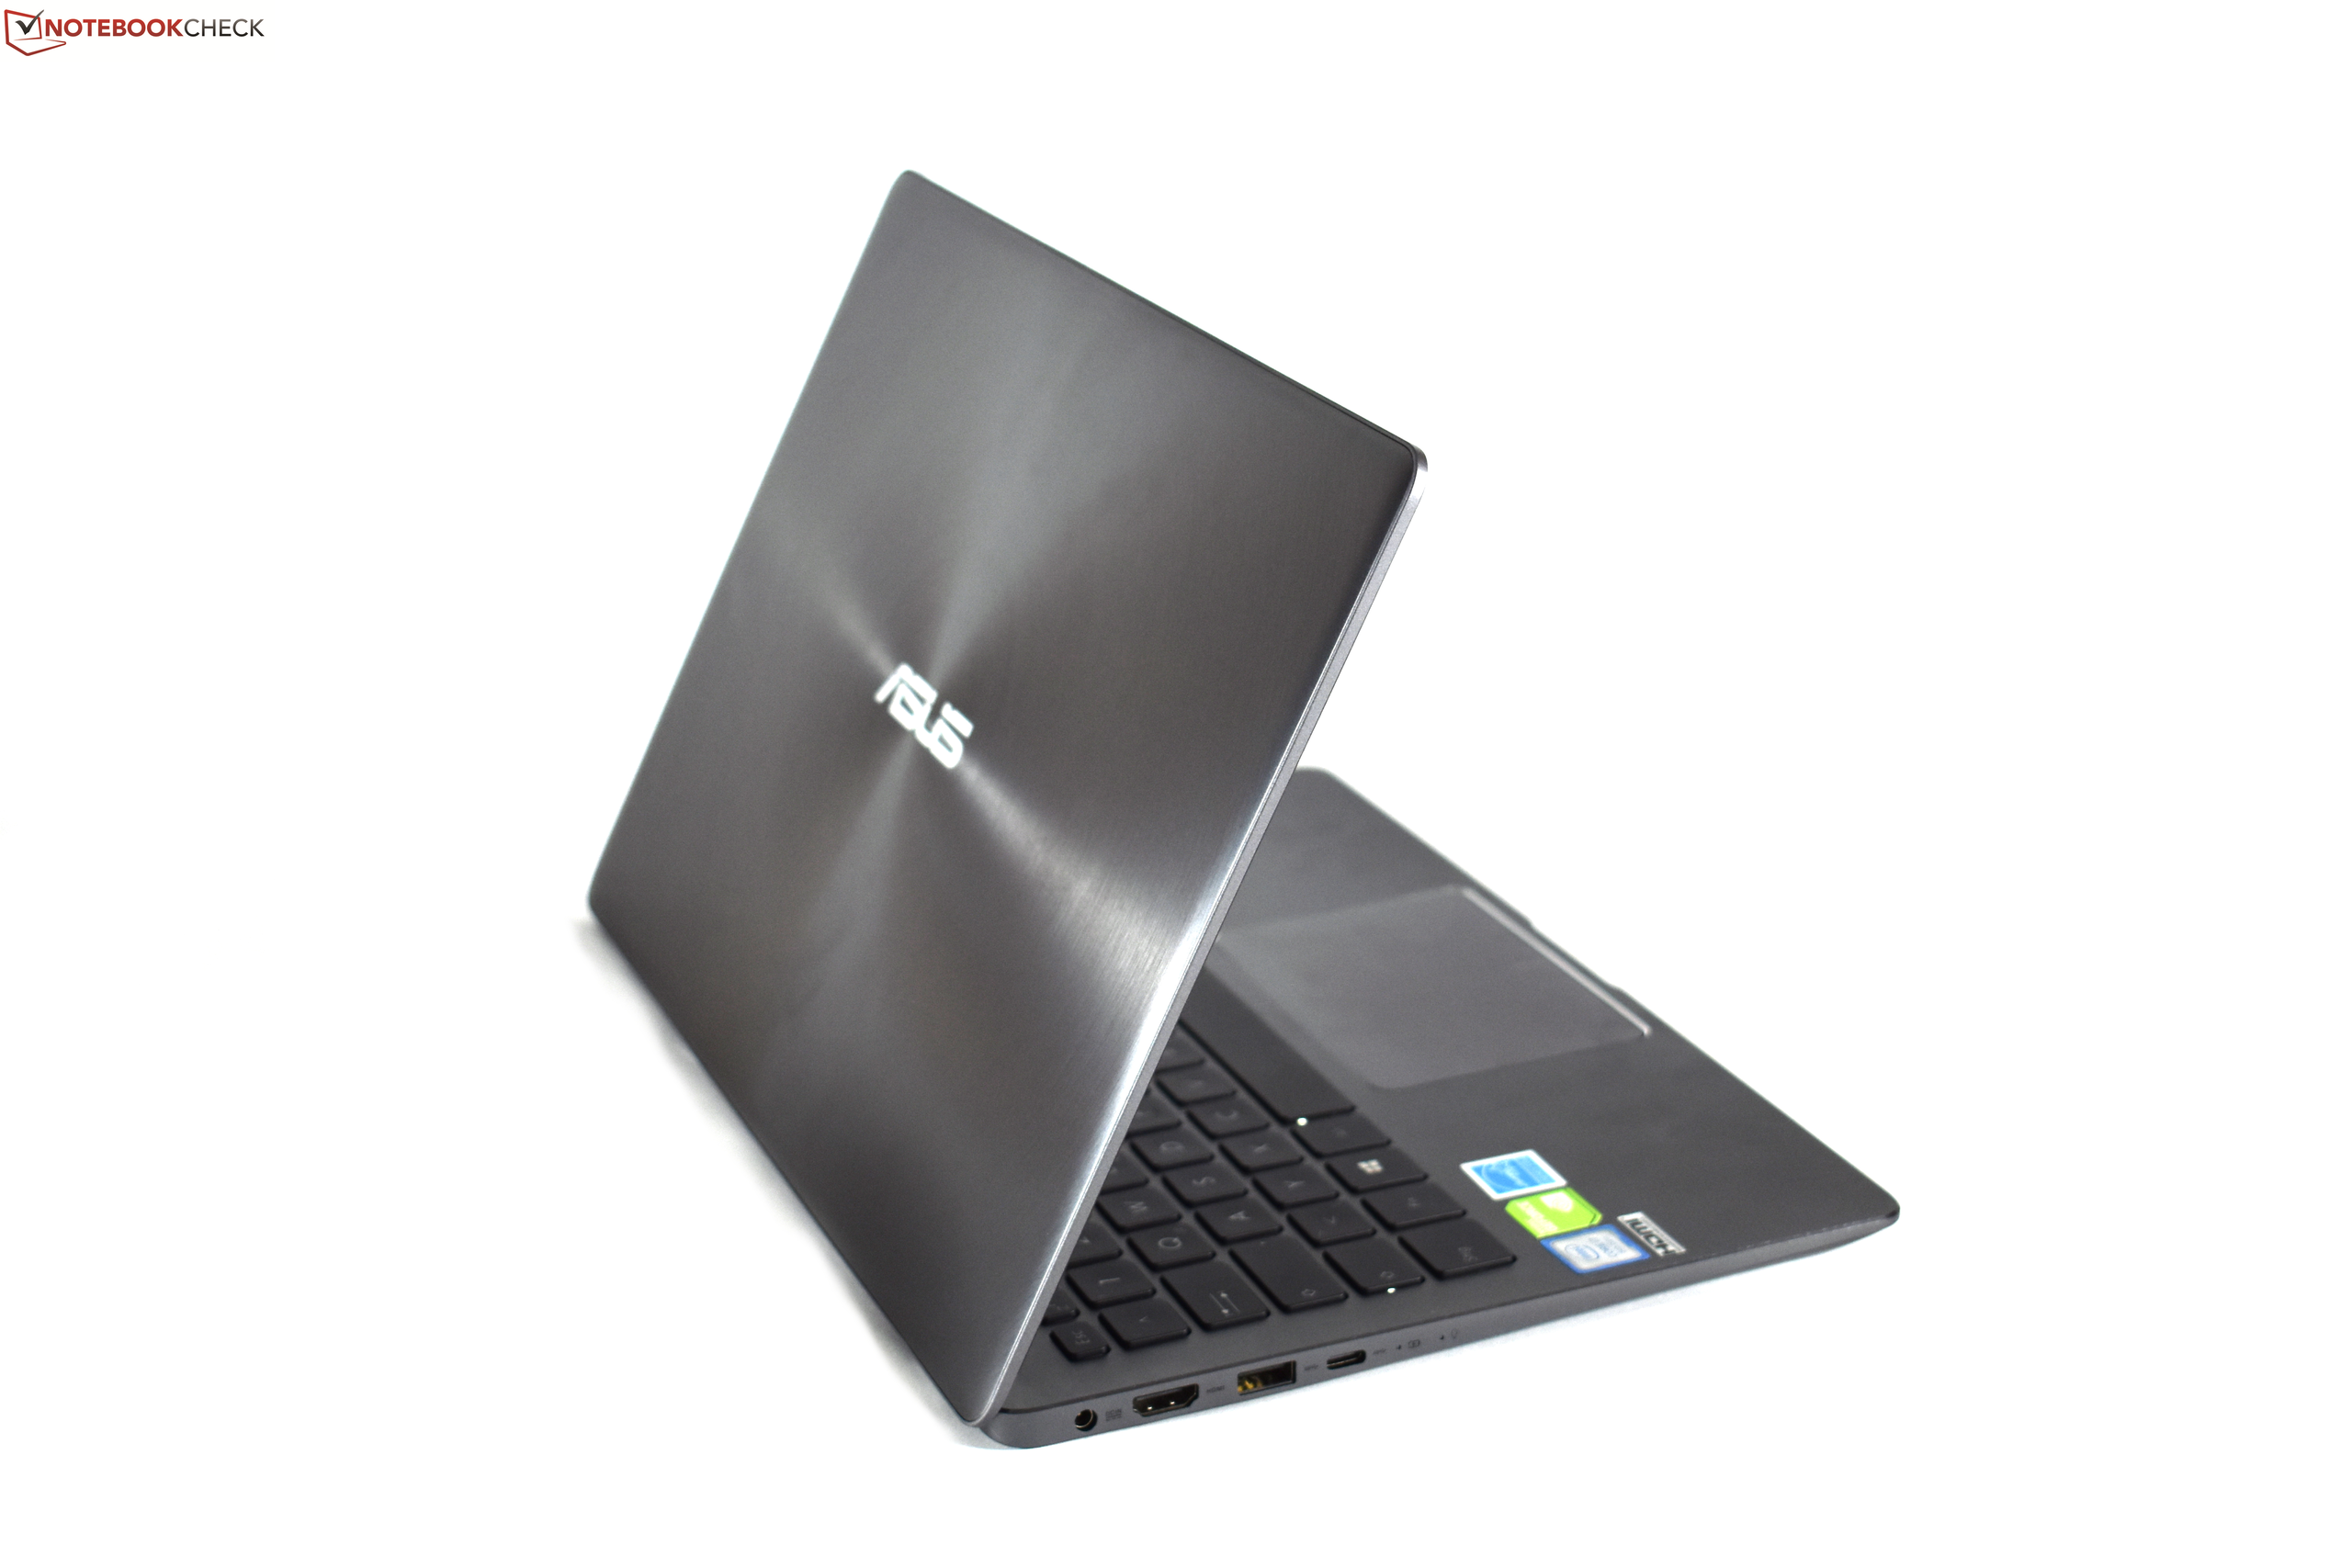
Tudo considerado, ficamos bastante contentes com o ZenBook 13 UX331UN. Ele possui uma tela de alta qualidade e alto-falantes surpreendentemente decentes, que são os principais ingredientes de um portátil multimídia que pode ser usado ao ar livre graças ao seu impressionante brilho máximo na tela. Além disso, a combinação de CPU e GPU é suficientemente poderosa para rodar jogos sem problemas com resoluções e detalhes reduzidos. Como tal, o ZenBook é literalmente um exemplo de um verdadeiro poli funcional. É fino e leve, apresenta uma carcaça de alta qualidade, um touchpad muito bom, e permanece frio a maior parte do tempo. Além disso, a duração da bateria é excelente, apesar da bateria de 50 Wh.
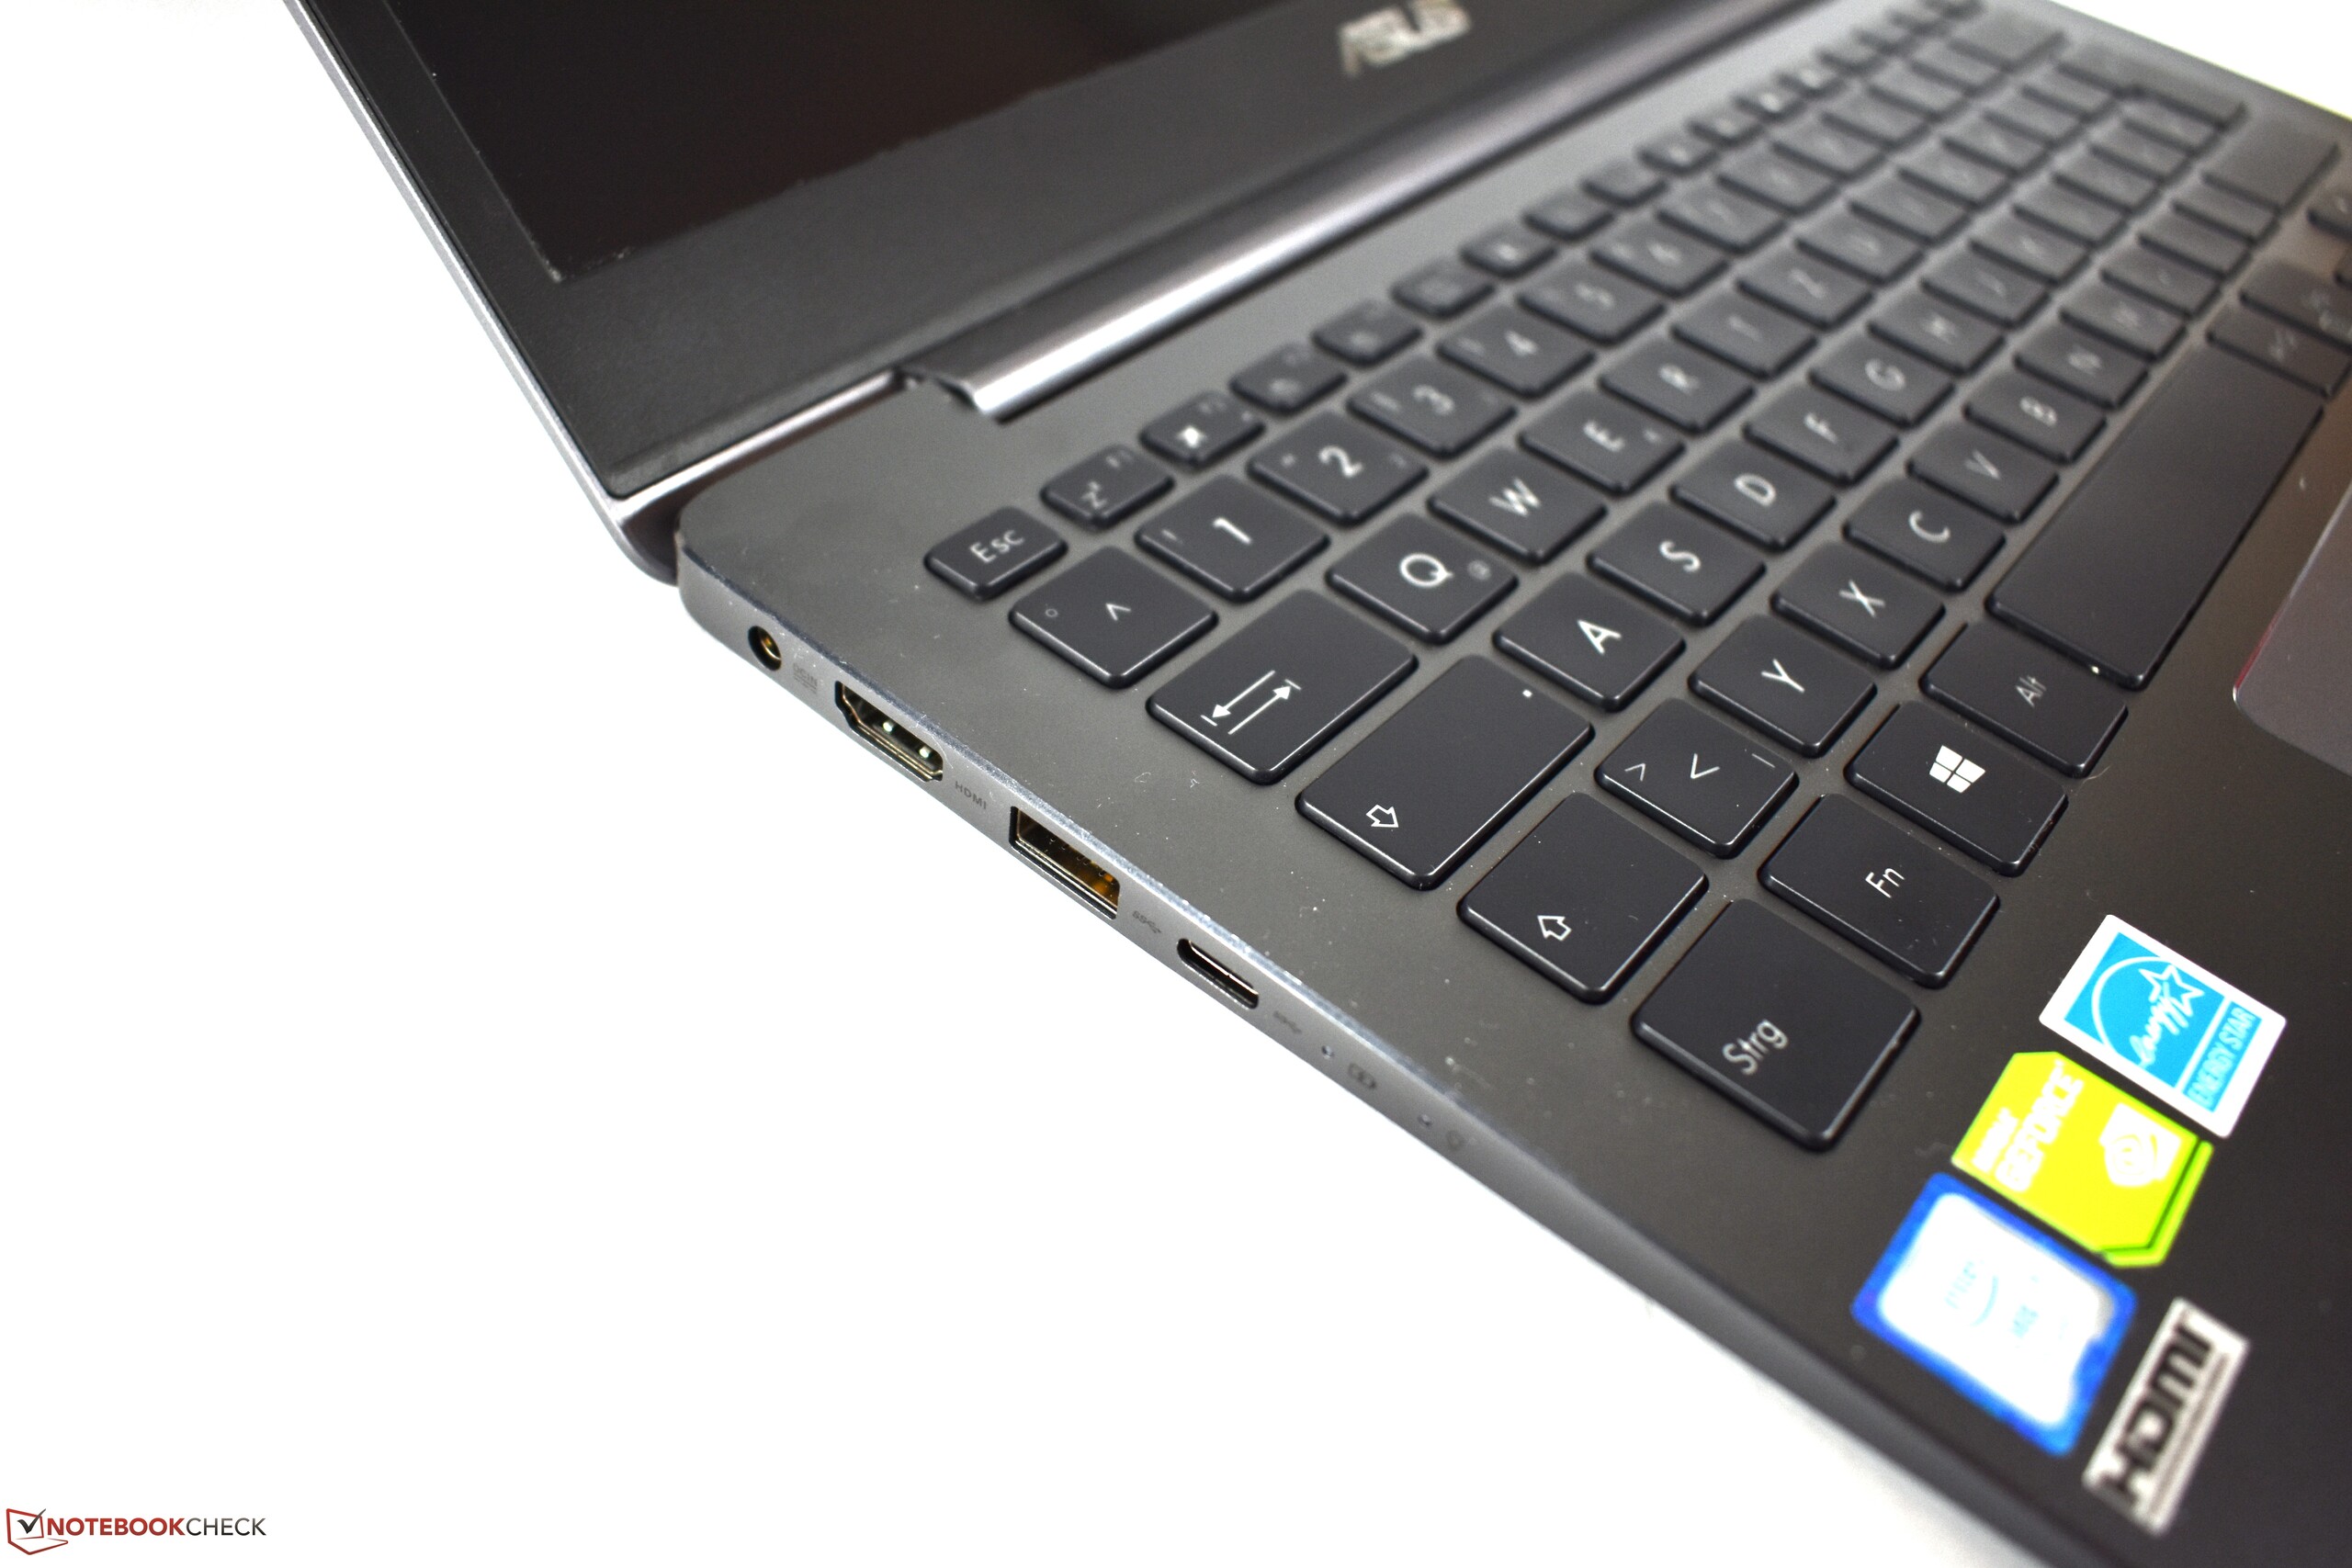
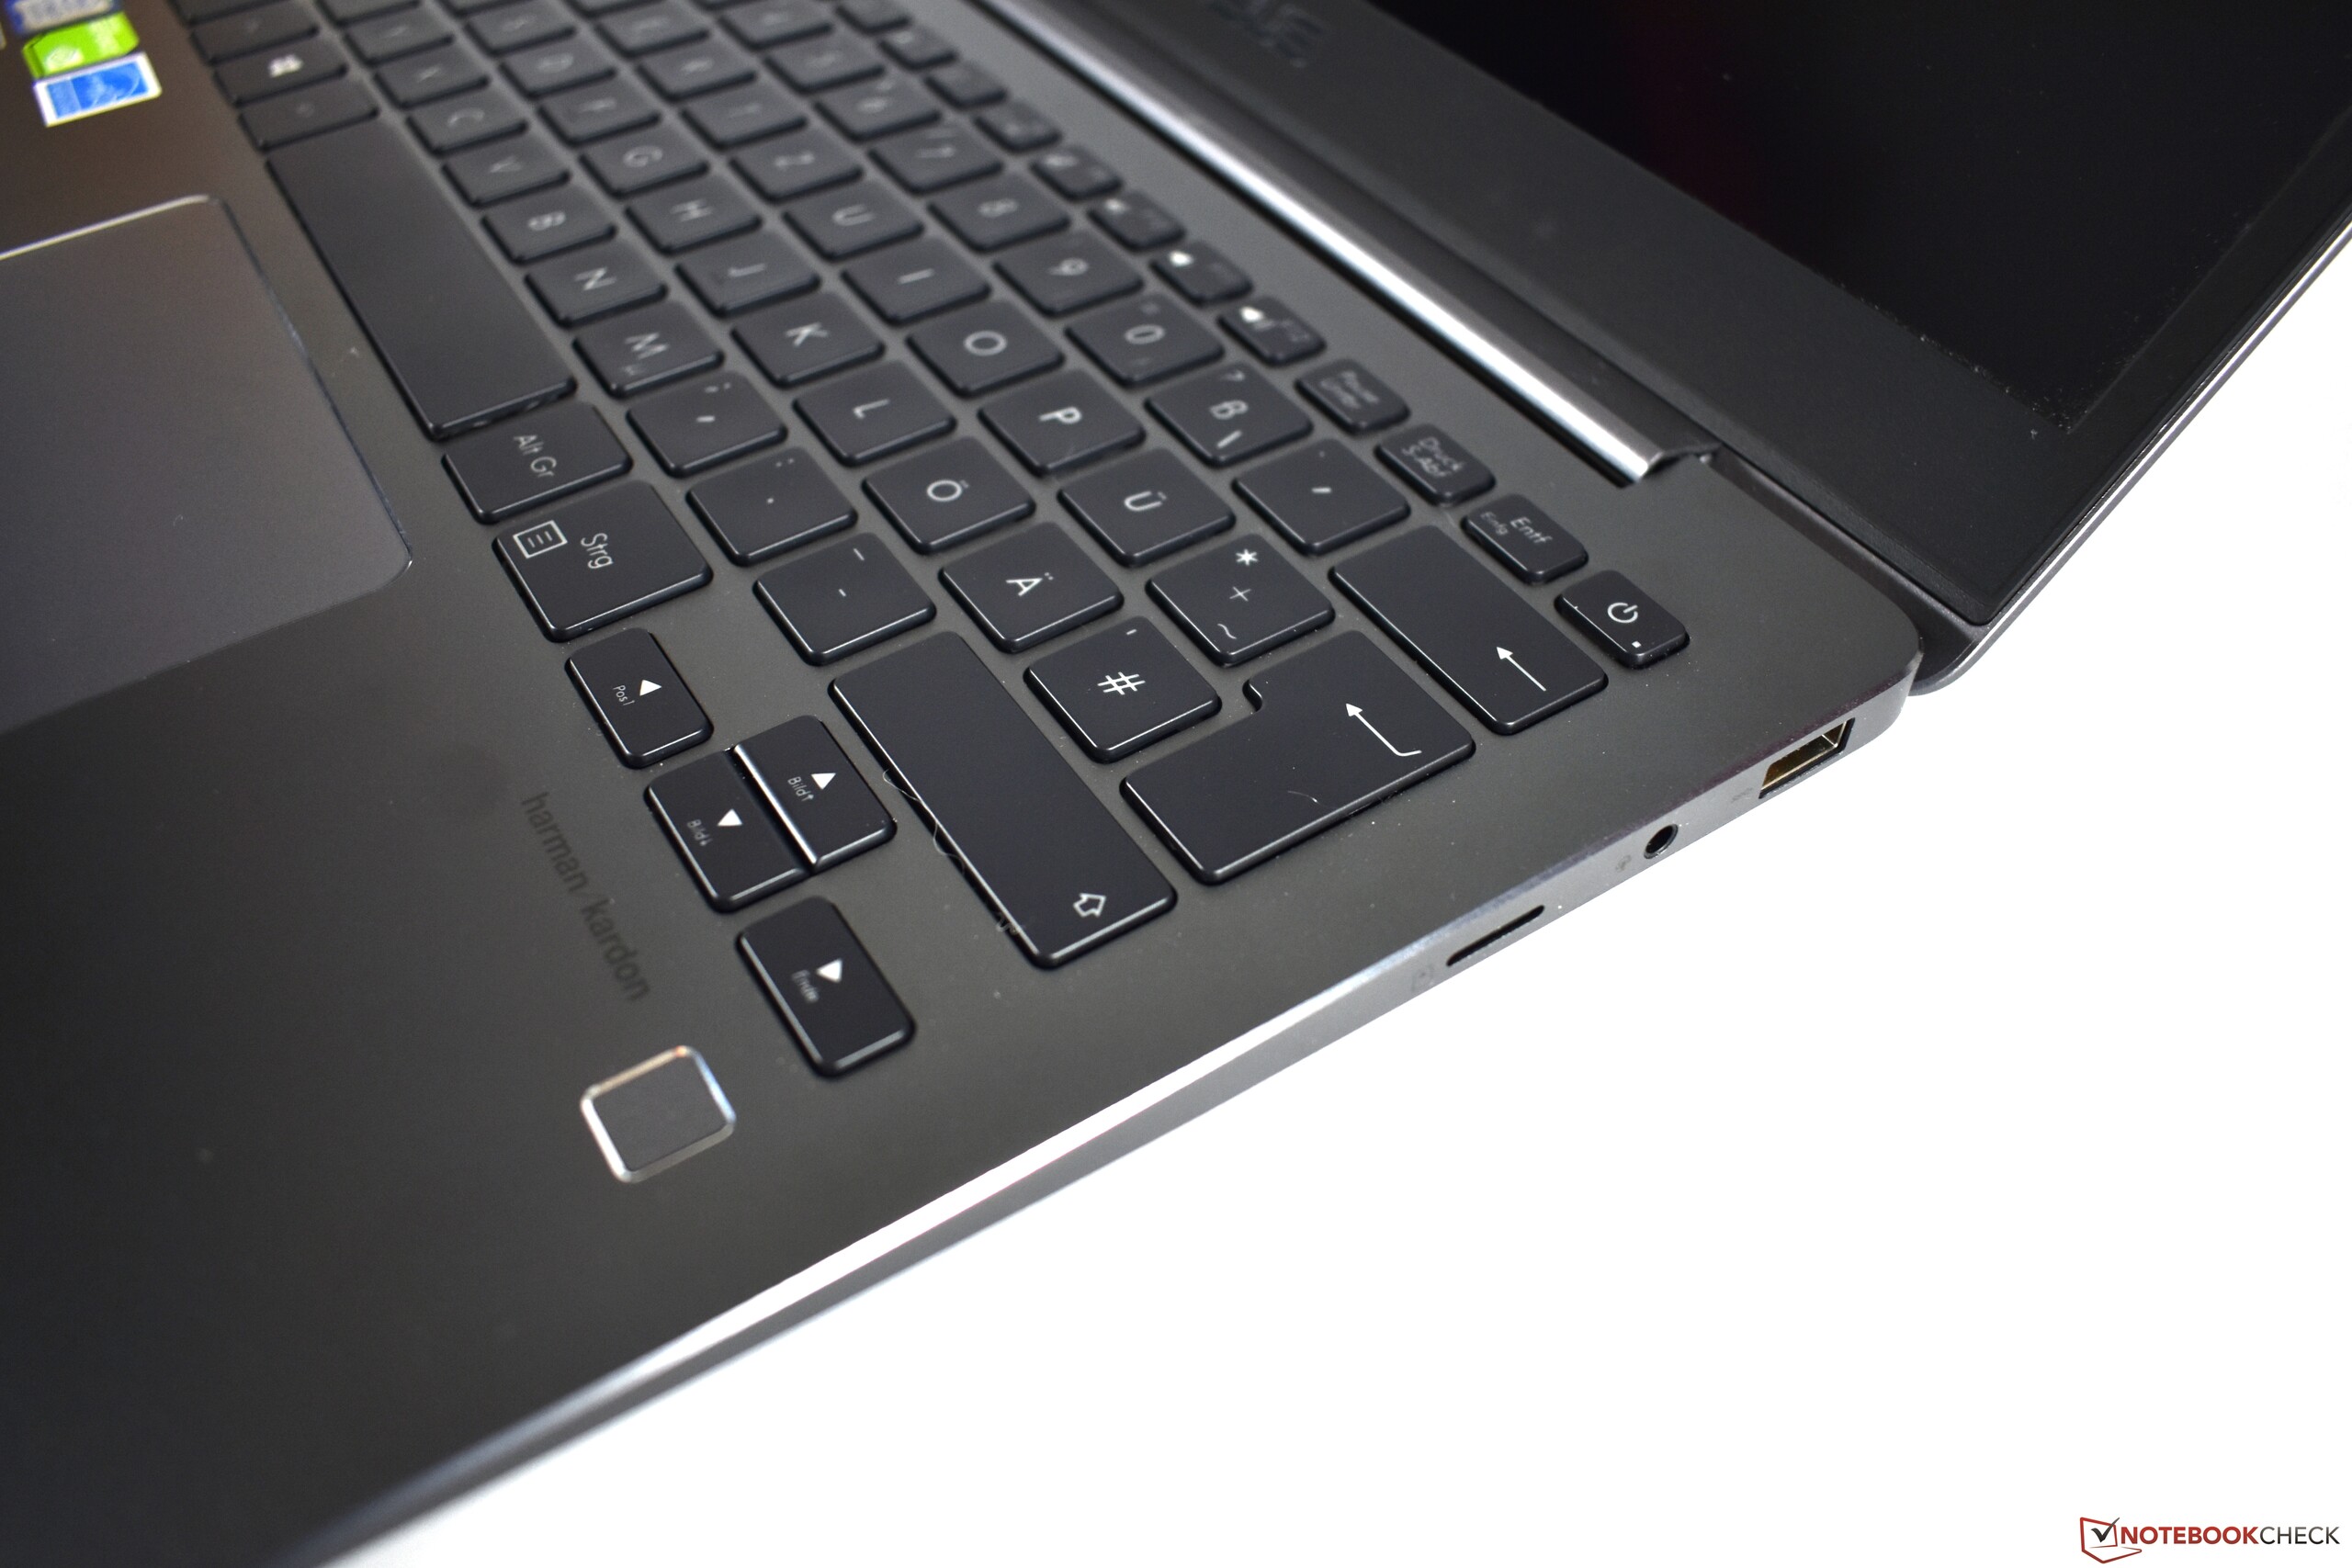
Combinados, esses são alguns pontos positivos impressionantes. Infelizmente, o ZenBook ainda não é perfeito e tem uma série de falhas. O teclado é apenas regular, o sistema de resfriamento não é suficientemente poderoso, o desempenho da CPU é muito inconsistente e o processador tende se afogar muito rápido e muitas vezes (o que conseguimos confirmar no Cinebench R15 e nosso cenário de teste de estresse). Não sé ó isso, a CPU também é significativamente mais lenta quando funciona com a energia da bateria. E não esqueçamos o nível de ruído que o ZenBook emite sob uso intenso e ao rodar jogos. Na verdade, está no limite do irritante para o usuário mais sensível. Por último, mas não menos importante, o SSD SATA III integrado, a falta de Thunderbolt 3 e a porta USB-C extremamente limitada (sem suporte para DisplayPort) também são desvantagens dignas de mencionar.
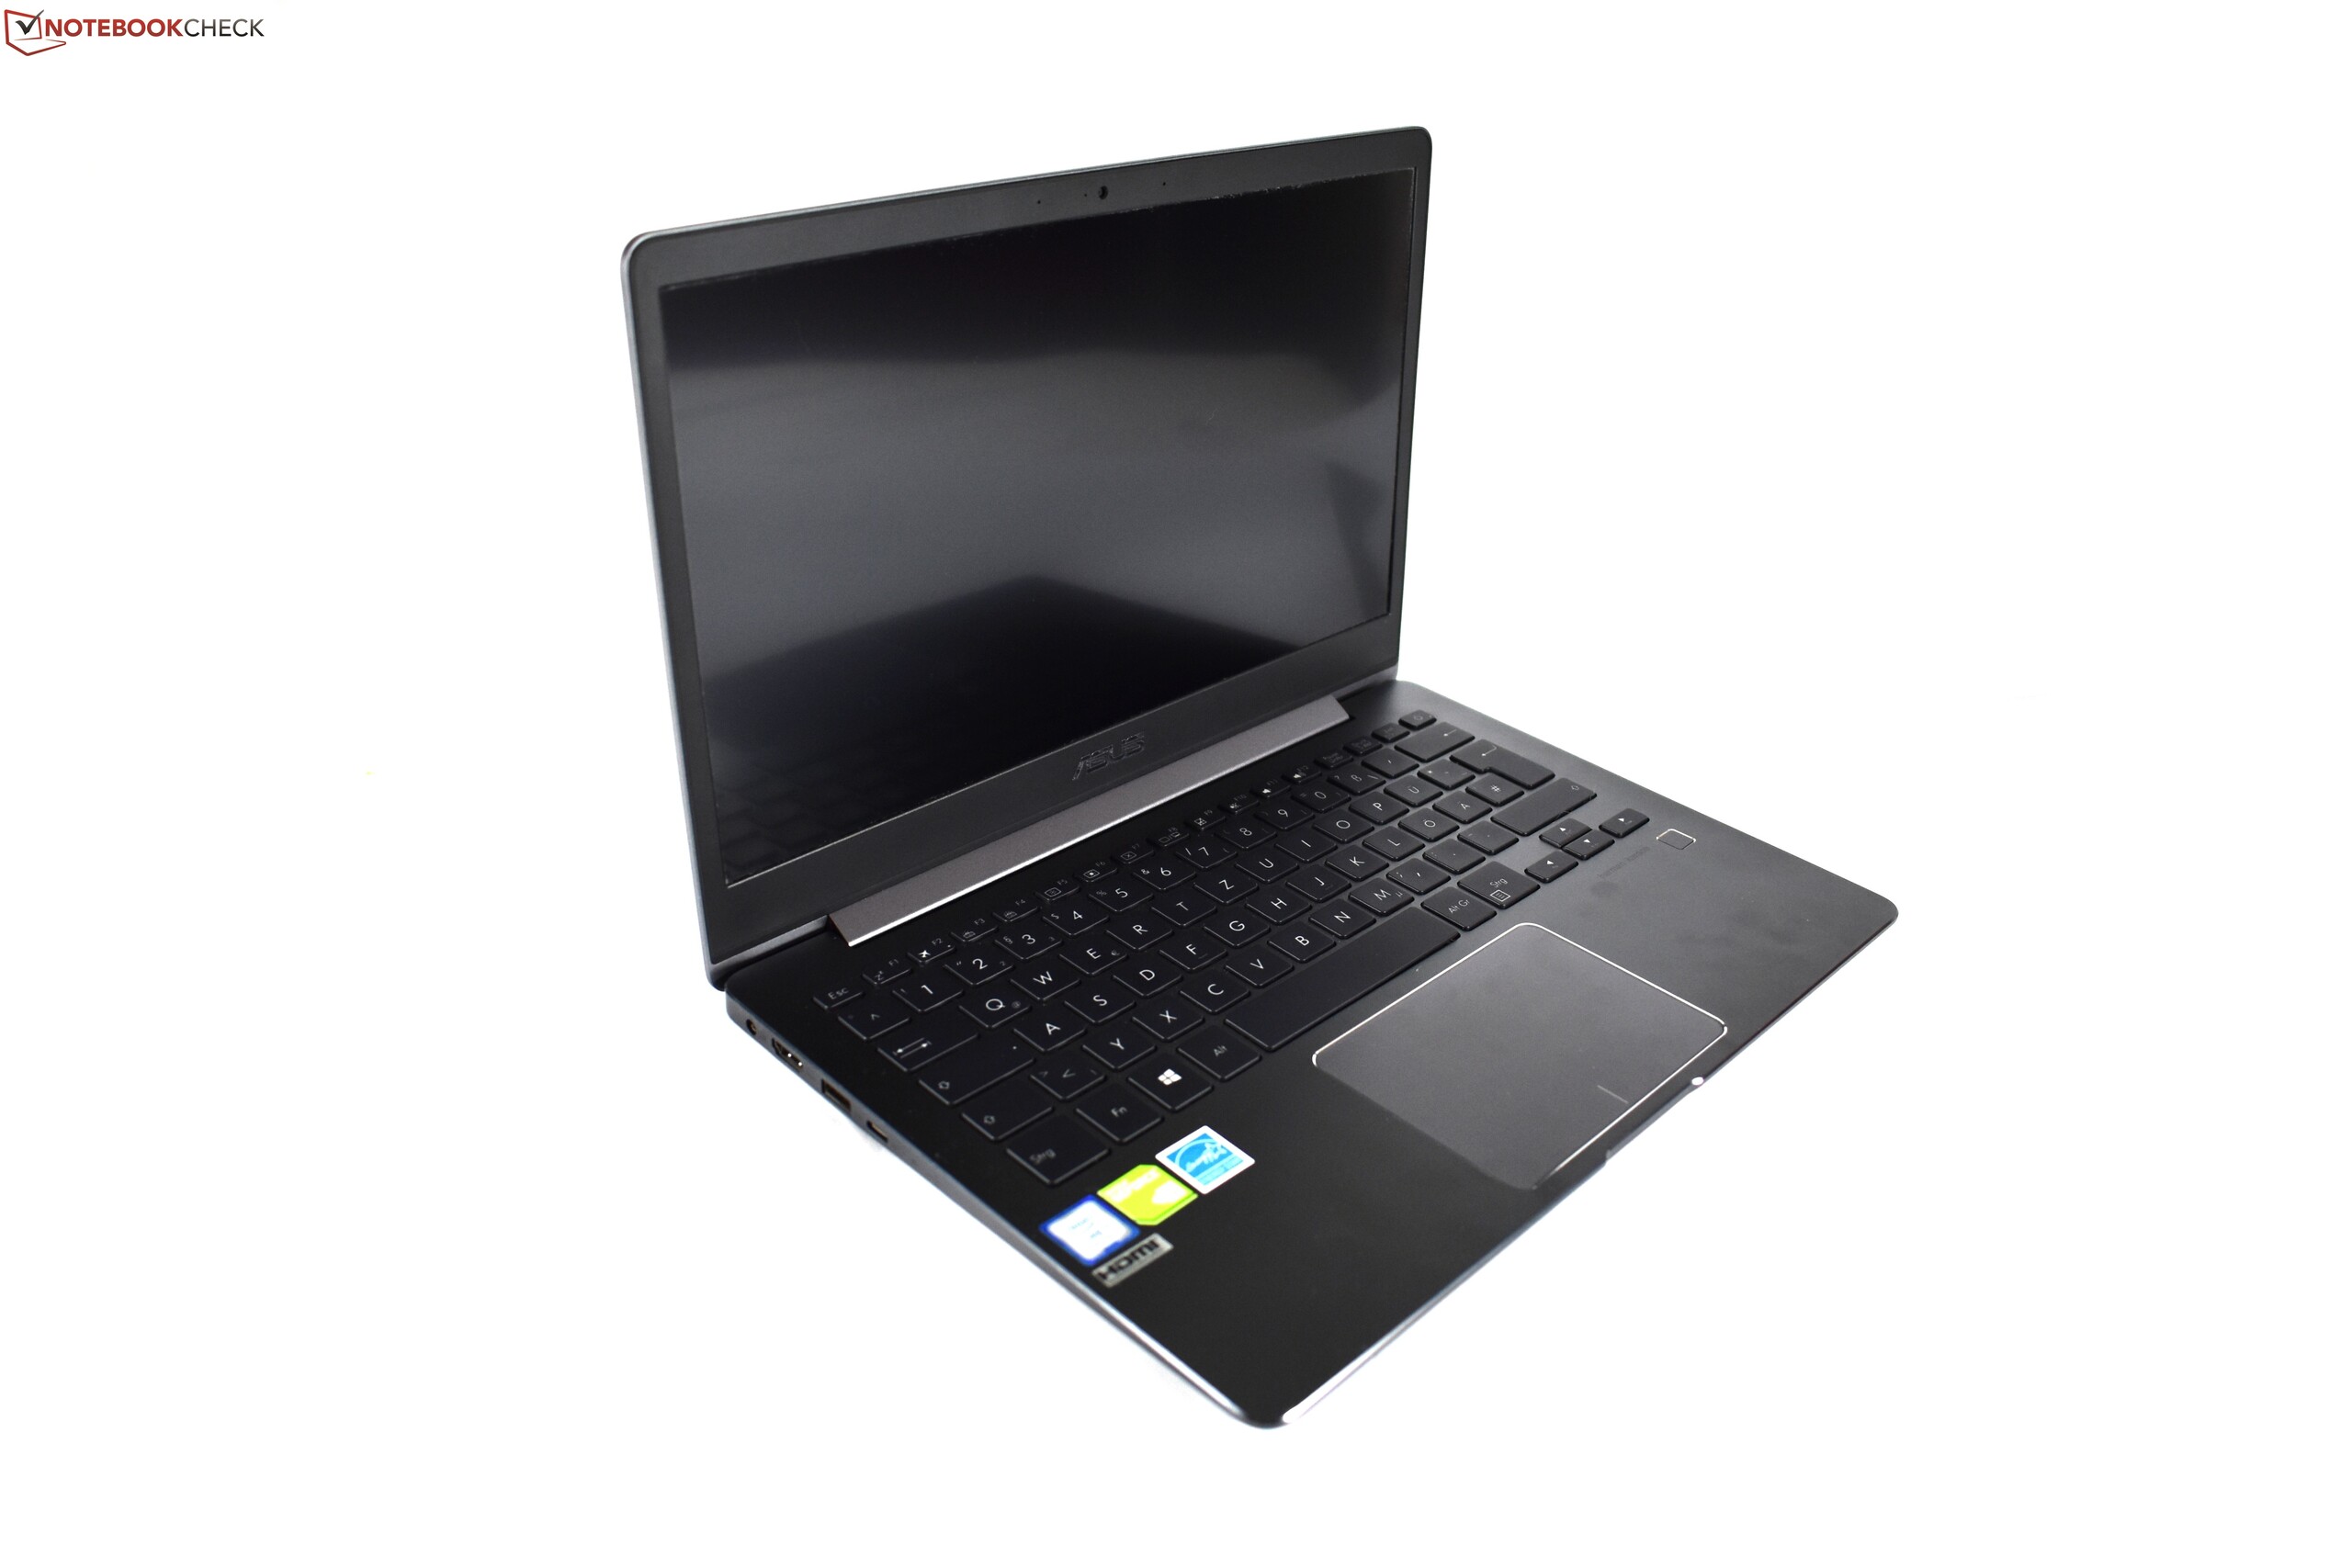
Atraente: Em geral, a Asus conseguiu atingir o jackpot com o ZenBook 13 UX331UN em todos os lugares certos.
Os pros superam inequivocamente os contras, e é por isso que o ZenBook 13 UX331UN merece uma recomendação. Ao procurar um portátil com uma GPU discreta, é certamente uma alternativa maravilhosa para o Dell XPS 13.
Asus ZenBook 13 UX331UN
-
01/05/2018 v6(old)
Benjamin Herzig
Pricecompare
