 Deutsch
 English
 Español
 Français
 Italiano
 Nederlands
 Polski
 Português
 Русский
 Türkçe
 Svenska
 Chinese
 Magyar
Breve Análise do Portátil Asus Zenbook UX303UB-DH74T


| |||||||||||||||||||||||||
iluminação: 84 %
iluminação com acumulador: 291.4 cd/m²
Contraste: 305:1 (Preto: 0.954 cd/m²)
ΔE Color 4.63 | 0.5-29.43 Ø5
ΔE Greyscale 5.65 | 0.57-98 Ø5.3
85.2% sRGB (Argyll 1.6.3 3D)
55.2% AdobeRGB 1998 (Argyll 1.6.3 3D)
62.5% AdobeRGB 1998 (Argyll 2.2.0 3D)
85.4% sRGB (Argyll 2.2.0 3D)
60.9% Display P3 (Argyll 2.2.0 3D)
Gamma: 2.16
| Asus Zenbook UX303UB-DH74T 13.30, 3200x1800 | Asus Zenbook UX303UB-R4100T 13.30, 1920x1080 | Asus Zenbook UX305LA-FC012H 13.30, 1920x1080 | HP Spectre x360 13-4104ng 13.30, 2560x1440 | HP Envy 13-d000ng 13.30, 3200x1800 | Dell XPS 13 2016 i7 256GB QHD 13.30, 3200x1800 | |
|---|---|---|---|---|---|---|
| Display | 9% | 5% | 9% | 4% | 6% | |
| Display P3 Coverage | 60.9 | 66.9 10% | 63.9 5% | 66.8 10% | 64 5% | 63.6 4% |
| sRGB Coverage | 85.4 | 92.3 8% | 91.6 7% | 92.8 9% | 88.8 4% | 93.6 10% |
| AdobeRGB 1998 Coverage | 62.5 | 67.6 8% | 65 4% | 67.3 8% | 65 4% | 65.5 5% |
| Response Times | -46% | 47% | 13% | 93% | ||
| Response Time Grey 50% / Grey 80% * | 44.4 ? | 68 ? -53% | 24 ? 46% | 37.6 ? 15% | 40 ? 10% | |
| Response Time Black / White * | 36 ? | 35 ? 3% | 19 ? 47% | 26 ? 28% | 30 ? 17% | |
| PWM Frequency | 1389 | 178 ? -87% | 1316 ? -5% | 4900 ? 253% | ||
| Screen | 46% | 54% | 40% | 21% | 59% | |
| Brightness middle | 291.4 | 385 32% | 349 20% | 324 11% | 291 0% | 285 -2% |
| Brightness | 270 | 394 46% | 338 25% | 324 20% | 276 2% | 281 4% |
| Brightness Distribution | 84 | 89 6% | 87 4% | 90 7% | 82 -2% | 90 7% |
| Black Level * | 0.954 | 0.41 57% | 0.25 74% | 0.34 64% | 0.63 34% | 0.18 81% |
| Contrast | 305 | 939 208% | 1396 358% | 953 212% | 462 51% | 1583 419% |
| Colorchecker dE 2000 * | 4.63 | 3.84 17% | 5.49 -19% | 4.36 6% | 2.76 40% | 4.89 -6% |
| Greyscale dE 2000 * | 5.65 | 3.79 33% | 5.43 4% | 4.62 18% | 2.61 54% | 5.16 9% |
| Gamma | 2.16 102% | 2.23 99% | 2.17 101% | 2.18 101% | 2.31 95% | 2.15 102% |
| CCT | 6320 103% | 6499 100% | 7055 92% | 6857 95% | 6731 97% | 7106 91% |
| Color Space (Percent of AdobeRGB 1998) | 55.2 | 60 9% | 60 9% | 60 9% | 57.5 4% | 59 7% |
| Color Space (Percent of sRGB) | 85.2 | 92 8% | 92 8% | 93 9% | 88.7 4% | 93 9% |
| Total Average (Program / Settings) | 3% /
20% | 30% /
42% | 32% /
34% | 13% /
16% | 53% /
55% |
* ... smaller is better
Display Response Times
| ↔ Response Time Black to White | ||
|---|---|---|
| 36 ms ... rise ↗ and fall ↘ combined | ↗ 15.6 ms rise | 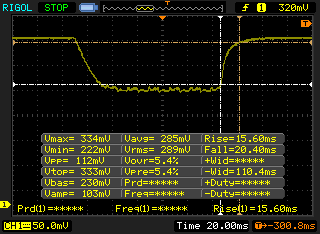 |
| ↘ 20.4 ms fall | ||
| The screen shows slow response rates in our tests and will be unsatisfactory for gamers. In comparison, all tested devices range from 0.1 (minimum) to 240 (maximum) ms. » 93 % of all devices are better. This means that the measured response time is worse than the average of all tested devices (21.5 ms). | ||
| ↔ Response Time 50% Grey to 80% Grey | ||
| 44.4 ms ... rise ↗ and fall ↘ combined | ↗ 19.6 ms rise | 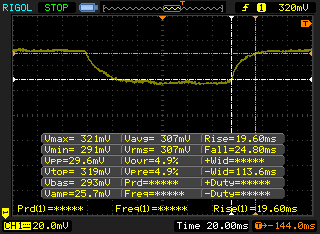 |
| ↘ 24.8 ms fall | ||
| The screen shows slow response rates in our tests and will be unsatisfactory for gamers. In comparison, all tested devices range from 0.2 (minimum) to 636 (maximum) ms. » 72 % of all devices are better. This means that the measured response time is worse than the average of all tested devices (33.8 ms). | ||
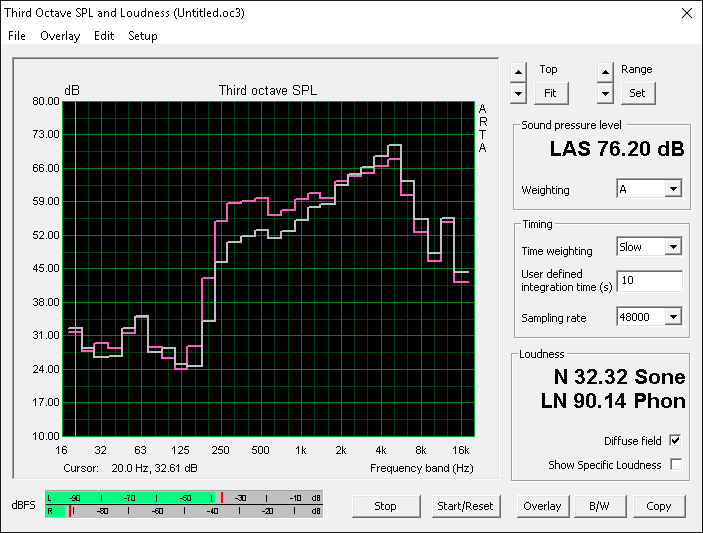
Screen Flickering / PWM (Pulse-Width Modulation)
| Screen flickering / PWM detected | 1389 Hz | 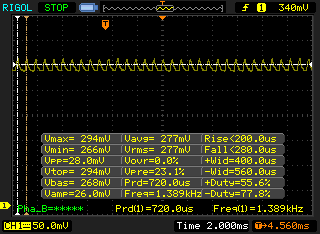 | |
The display backlight flickers at 1389 Hz (worst case, e.g., utilizing PWM) . The frequency of 1389 Hz is quite high, so most users sensitive to PWM should not notice any flickering. In comparison: 53 % of all tested devices do not use PWM to dim the display. If PWM was detected, an average of 17951 (minimum: 5 - maximum: 3846000) Hz was measured. | |||
| Cinebench R15 | |
| CPU Single 64Bit (sort by value) | |
| Asus Zenbook UX303UB-DH74T | |
| Eurocom Shark 4 | |
| HP EliteBook Folio 1040 G2 | |
| Dell Inspiron 17 5759-5118 | |
| Toshiba Tecra Z40 A-147 | |
| CPU Multi 64Bit (sort by value) | |
| Asus Zenbook UX303UB-DH74T | |
| Eurocom Shark 4 | |
| HP EliteBook Folio 1040 G2 | |
| Dell Inspiron 17 5759-5118 | |
| Toshiba Tecra Z40 A-147 | |
| Cinebench R11.5 | |
| CPU Single 64Bit (sort by value) | |
| Asus Zenbook UX303UB-DH74T | |
| Eurocom Shark 4 | |
| HP EliteBook Folio 1040 G2 | |
| Dell Inspiron 17 5759-5118 | |
| Toshiba Tecra Z40 A-147 | |
| CPU Multi 64Bit (sort by value) | |
| Asus Zenbook UX303UB-DH74T | |
| Eurocom Shark 4 | |
| HP EliteBook Folio 1040 G2 | |
| Dell Inspiron 17 5759-5118 | |
| Toshiba Tecra Z40 A-147 | |
| Cinebench R10 | |
| Rendering Multiple CPUs 32Bit (sort by value) | |
| Asus Zenbook UX303UB-DH74T | |
| Eurocom Shark 4 | |
| HP EliteBook Folio 1040 G2 | |
| Dell Inspiron 17 5759-5118 | |
| Rendering Single 32Bit (sort by value) | |
| Asus Zenbook UX303UB-DH74T | |
| Eurocom Shark 4 | |
| HP EliteBook Folio 1040 G2 | |
| Dell Inspiron 17 5759-5118 | |
| PCMark 7 - Score (sort by value) | |
| Asus Zenbook UX303UB-DH74T | |
| Apple MacBook Air 13 inch 2015-03 | |
| HP Spectre 13-4001ng x360 | |
| Dell XPS 13 2016 i7 256GB QHD | |
| Asus Zenbook UX305CA-EHM1 | |
| PCMark 8 | |
| Home Score Accelerated v2 (sort by value) | |
| Asus Zenbook UX303UB-DH74T | |
| Apple MacBook Air 13 inch 2015-03 | |
| HP Spectre 13-4001ng x360 | |
| Dell XPS 13 2016 i7 256GB QHD | |
| Asus Zenbook UX305CA-EHM1 | |
| Work Score Accelerated v2 (sort by value) | |
| Asus Zenbook UX303UB-DH74T | |
| Apple MacBook Air 13 inch 2015-03 | |
| HP Spectre 13-4001ng x360 | |
| Dell XPS 13 2016 i7 256GB QHD | |
| Asus Zenbook UX305CA-EHM1 | |
| Creative Score Accelerated v2 (sort by value) | |
| Asus Zenbook UX303UB-DH74T | |
| Apple MacBook Air 13 inch 2015-03 | |
| HP Spectre 13-4001ng x360 | |
| Asus Zenbook UX305CA-EHM1 | |
| PCMark 7 Score | 5135 pontos | |
| PCMark 8 Home Score Accelerated v2 | 2918 pontos | |
| PCMark 8 Creative Score Accelerated v2 | 3837 pontos | |
| PCMark 8 Work Score Accelerated v2 | 3862 pontos | |
Ajuda | ||

| Asus Zenbook UX303UB-DH74T GeForce 940M, 6500U, CUK Cyclone SSD 1TB | Aorus X3 Plus v5 GeForce GTX 970M, 6700HQ, Samsung SM951 MZVPV512HDGL m.2 PCI-e | Dell XPS 13 2016 i7 256GB QHD HD Graphics 520, 6500U, Samsung PM951 NVMe MZ-VLV256D | Lenovo Yoga 900-13ISK 80MK HD Graphics 520, 6500U, Samsung SSD PM871 MZNLN512HCJH | Lenovo Ideapad Y700-17 80QK7709PB GeForce GTX 960M, 6700HQ, Samsung SSD 850 EVO 500GB | |
|---|---|---|---|---|---|
| AS SSD | 151% | 53% | 18% | 11% | |
| Copy Game MB/s | 392.8 | 927 136% | 298.7 -24% | ||
| Copy Program MB/s | 233.7 | 368.6 58% | 249.6 7% | ||
| Copy ISO MB/s | 382.5 | 1158 203% | 364.5 -5% | ||
| Score Total | 882 | 2652 201% | 1603 82% | 1129 28% | 853 -3% |
| Score Write | 373 | 630 69% | 391 5% | 429 15% | 279 -25% |
| Score Read | 333 | 1345 304% | 809 143% | 458 38% | 372 12% |
| Access Time Write * | 0.051 | 0.032 37% | 0.034 33% | 0.039 24% | 0.035 31% |
| Access Time Read * | 0.14 | 0.041 71% | 0.071 49% | 0.054 61% | 0.053 62% |
| 4K-64 Write | 261.1 | 368.3 41% | 263.7 1% | 303 16% | 138.6 -47% |
| 4K-64 Read | 256.9 | 1113 333% | 698 172% | 374.8 46% | 286 11% |
| 4K Write | 71.3 | 114 60% | 97.6 37% | 80.6 13% | 93.7 31% |
| 4K Read | 25.99 | 46.24 78% | 38.21 47% | 32.29 24% | 34.86 34% |
| Seq Write | 409.8 | 1474 260% | 301.2 -27% | 454.6 11% | 470.2 15% |
| Seq Read | 505 | 1859 268% | 735 46% | 505 0% | 514 2% |
* ... smaller is better
| 3DMark 11 | |
| 1280x720 Performance GPU (sort by value) | |
| Asus Zenbook UX303UB-DH74T | |
| Nexoc M731III W670RBQ | |
| Microsoft Surface Pro 4 Core i7 | |
| Lenovo Flex 2 Pro-15 | |
| HP Envy 13-d000ng | |
| 1280x720 Performance (sort by value) | |
| Asus Zenbook UX303UB-DH74T | |
| Nexoc M731III W670RBQ | |
| Microsoft Surface Pro 4 Core i7 | |
| Lenovo Flex 2 Pro-15 | |
| HP Envy 13-d000ng | |
| 3DMark | |
| 1920x1080 Fire Strike Score (sort by value) | |
| Asus Zenbook UX303UB-DH74T | |
| Nexoc M731III W670RBQ | |
| Microsoft Surface Pro 4 Core i7 | |
| Lenovo Flex 2 Pro-15 | |
| HP Envy 13-d000ng | |
| 1280x720 Cloud Gate Standard Score (sort by value) | |
| Asus Zenbook UX303UB-DH74T | |
| Nexoc M731III W670RBQ | |
| Microsoft Surface Pro 4 Core i7 | |
| Lenovo Flex 2 Pro-15 | |
| HP Envy 13-d000ng | |
| 1280x720 Ice Storm Standard Score (sort by value) | |
| Asus Zenbook UX303UB-DH74T | |
| Nexoc M731III W670RBQ | |
| Microsoft Surface Pro 4 Core i7 | |
| Lenovo Flex 2 Pro-15 | |
| HP Envy 13-d000ng | |
| 3DMark 11 Performance | 2291 pontos | |
| 3DMark Ice Storm Standard Score | 17839 pontos | |
| 3DMark Cloud Gate Standard Score | 5995 pontos | |
| 3DMark Fire Strike Score | 1347 pontos | |
| 3DMark Fire Strike Extreme Score | 680 pontos | |
Ajuda | ||
| baixo | média | alto | ultra | |
| Tomb Raider (2013) | 60.3 | 32.7 | 16.2 | |
| BioShock Infinite (2013) | 43.2 | 38.5 | 13.3 | |
| Metro: Last Light (2013) | 32.9 | 21.8 | 10.8 | |
| Thief (2014) | 23.9 | 19.3 | 8.9 | |
| Batman: Arkham Knight (2015) | 21 | |||
| Fallout 4 (2015) | 20 | 11 | 9 |
| Asus Zenbook UX303UB-DH74T GeForce 940M, 6500U, CUK Cyclone SSD 1TB | Lenovo Yoga 900-13ISK 80MK HD Graphics 520, 6500U, Samsung SSD PM871 MZNLN512HCJH | Dell XPS 13 2016 i7 256GB QHD HD Graphics 520, 6500U, Samsung PM951 NVMe MZ-VLV256D | HP Spectre 13-4001ng x360 HD Graphics 5500, 5500U, ADATA AXNS381E-256GM-B | Acer Aspire V3-372-50LK HD Graphics 520, 6200U, Toshiba HG6 THNSNJ256G8NU | |
|---|---|---|---|---|---|
| Noise | 3% | -2% | -0% | 3% | |
| Idle Minimum * | 29.8 | 29.7 -0% | 31.8 -7% | 29.6 1% | 31.5 -6% |
| Idle Average * | 29.8 | 29.8 -0% | 31.8 -7% | 29.6 1% | 31.5 -6% |
| Idle Maximum * | 29.8 | 30 -1% | 34.8 -17% | 29.6 1% | 31.5 -6% |
| Load Average * | 37.4 | 32 14% | 34.8 7% | 38.6 -3% | 32.4 13% |
| Load Maximum * | 40.3 | 38.5 4% | 34.8 14% | 41 -2% | 32.3 20% |
* ... smaller is better
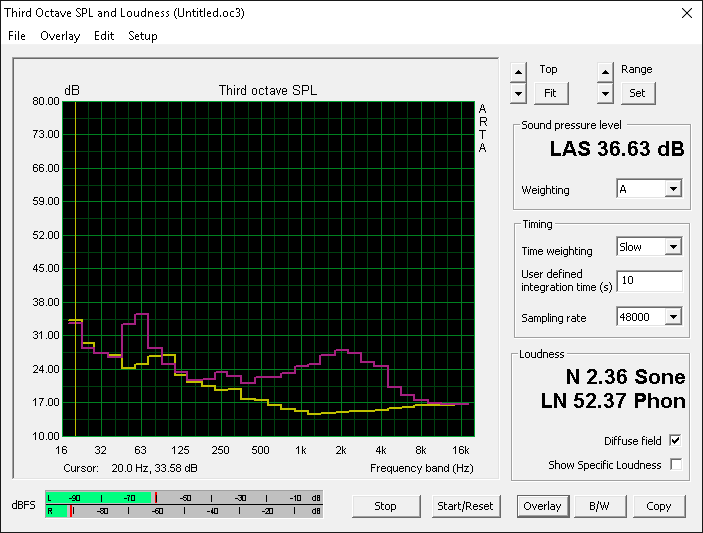
Barulho
| Ocioso |
| 29.8 / 29.8 / 29.8 dB |
| Carga |
| 37.4 / 40.3 dB |
 | ||
30 dB silencioso 40 dB(A) audível 50 dB(A) ruidosamente alto |
||
min: | ||
(±) The maximum temperature on the upper side is 45 °C / 113 F, compared to the average of 35.9 °C / 97 F, ranging from 21.4 to 59 °C for the class Subnotebook.
(±) The bottom heats up to a maximum of 42 °C / 108 F, compared to the average of 39.4 °C / 103 F
(+) In idle usage, the average temperature for the upper side is 24.1 °C / 75 F, compared to the device average of 30.7 °C / 87 F.
(+) The palmrests and touchpad are cooler than skin temperature with a maximum of 31.6 °C / 88.9 F and are therefore cool to the touch.
(-) The average temperature of the palmrest area of similar devices was 28.3 °C / 82.9 F (-3.3 °C / -6 F).
| Asus Zenbook UX303UB-DH74T 50 Wh | Asus Zenbook UX303UB-R4100T 50 Wh | Lenovo Yoga 900-13ISK 80MK 66 Wh | HP Spectre x360 13-4104ng 56 Wh | HP Envy 13-d000ng 45 Wh | Dell XPS 13 2016 i7 256GB QHD 56 Wh | |
|---|---|---|---|---|---|---|
| Battery Runtime | 32% | 26% | 47% | -5% | 18% | |
| Reader / Idle | 617 | 997 62% | 844 37% | 517 -16% | 784 27% | |
| WiFi v1.3 | 341 | 410 20% | 403 18% | 500 47% | 324 -5% | 432 27% |
| Load | 103 | 118 15% | 128 24% | 108 5% | 103 0% |
Pro
Contra
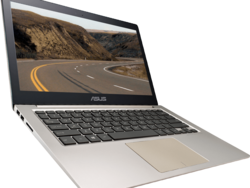

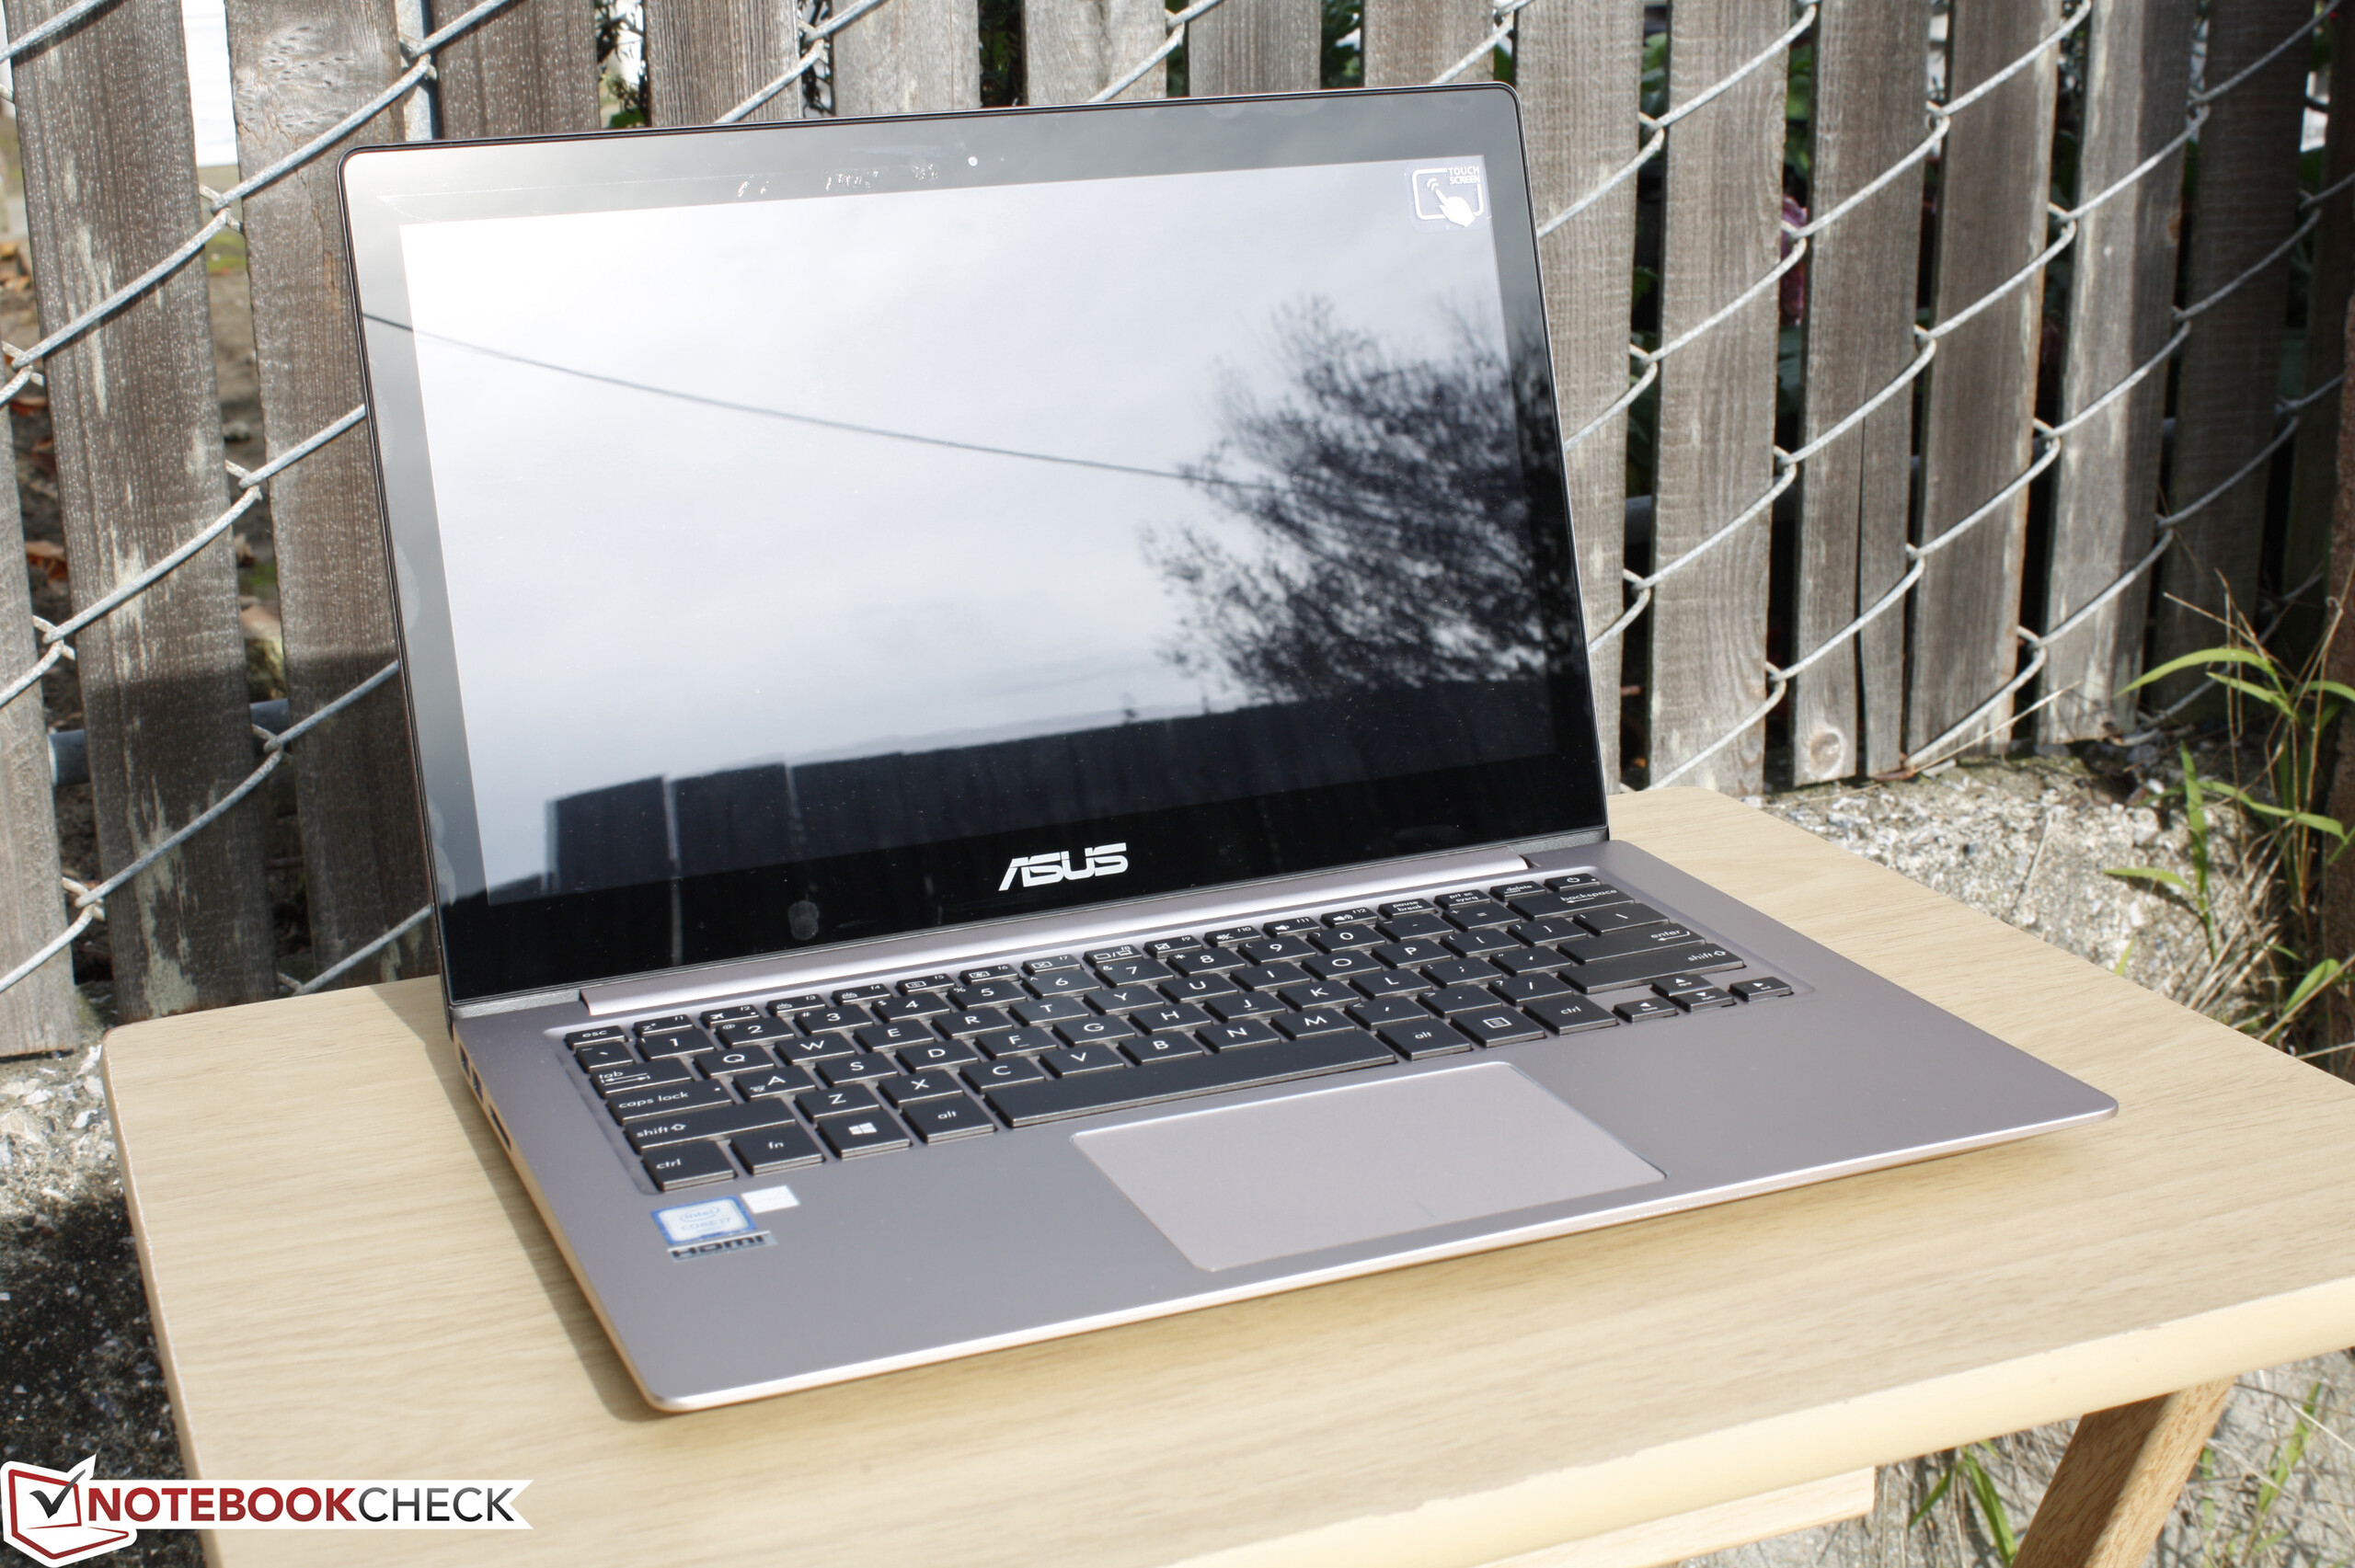
A série Zenbook ainda é um dos melhores Ultrabooks disponível assumindo que os recursos novos, como as dobradiças de 360-graus ou teclados desmontáveis não são do interesse do usuário. Esta configuração QHD, no entanto, é um passo para frente, como para trás. Sim, a atualização da resolução é fantástica e nítida, mas há mais para uma tela que a resolução. Os fatores como o brilho da iluminação, contraste, e precisão das cores são piores que o seu FHD SKU. Os tempos de resposta também estão abaixo da média, porém, a tela felizmente não utiliza modulação por largura de pulso para o controle do brilho. Finalmente, a duração da bateria melhorou, dado que o módulo interno não foi atualizado em capacidade para compensar pela tela mais exigente.
Não temos dúvidas sobre as telas QHD ou UHD. Apesar de tudo, resoluções tão altas não devem vir com o preço de outros fatores importantes. Optar por um FHD Zenbook SKU mais econômico pode ser a melhor opção para a maioria dos usuários.
Esta é uma versão reduzida da análise original. Você pode ler a análise completa em inglês aqui.
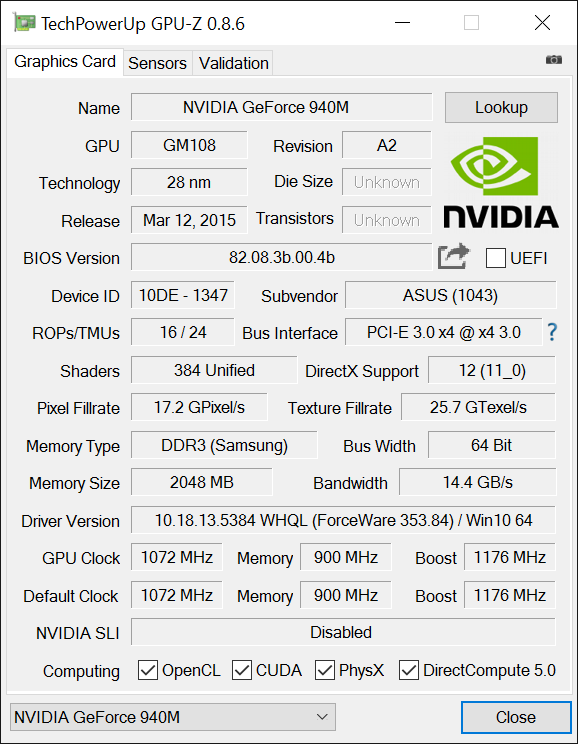
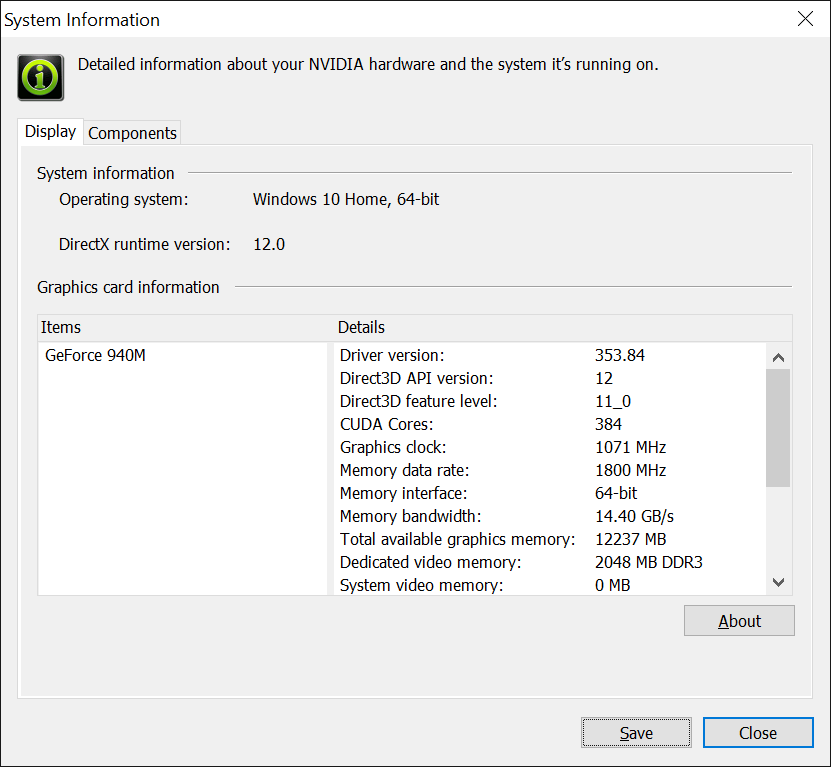
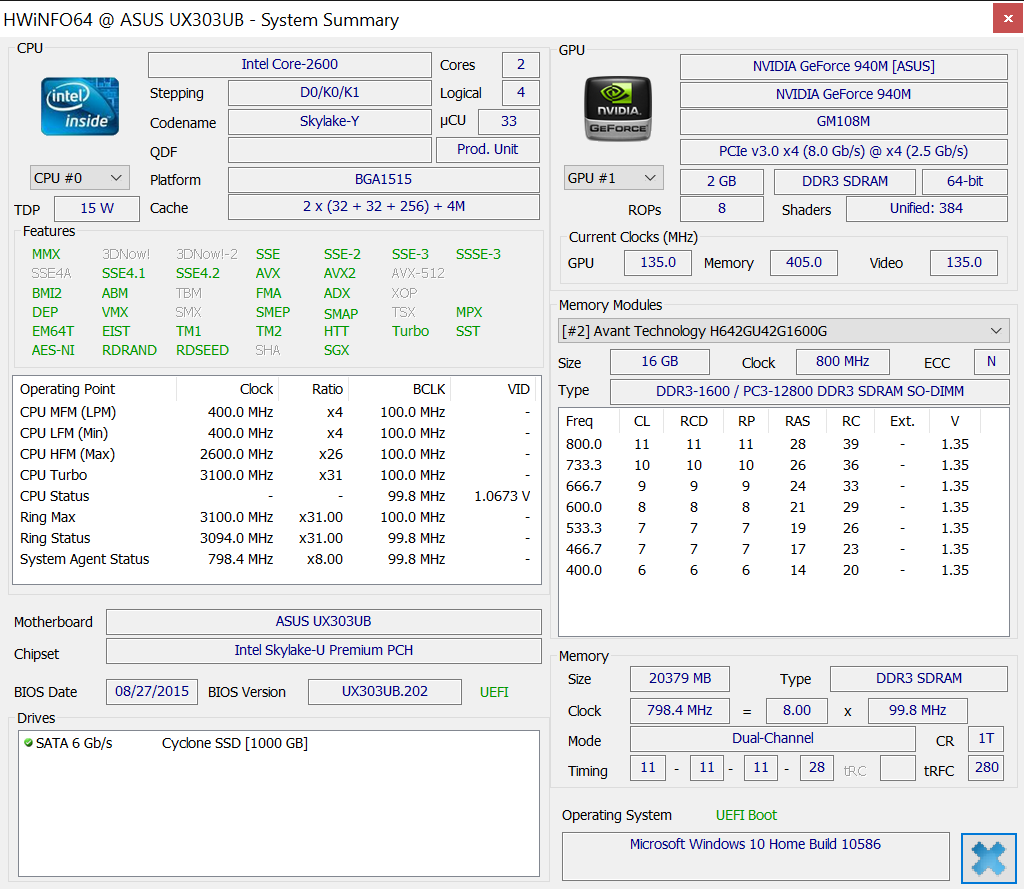
Asus Zenbook UX303UB-DH74T
-
01/12/2016 v4.1(old)
Allen Ngo
Pricecompare
