 Deutsch
 English
 Español
 Français
 Italiano
 Nederlands
 Polski
 Português
 Русский
 Türkçe
 Svenska
 Chinese
 Magyar
Breve Análise do Portátil Chuwi LapBook Air 14.1 (N3450, FHD)
| SD Card Reader | |
| average JPG Copy Test (av. of 3 runs) | |
| Dell XPS 13 i7-8550U | |
| Samsung Notebook 9 NP900X3N-K01US | |
| Chuwi LapBook 14 inch 2017 | |
| maximum AS SSD Seq Read Test (1GB) | |
| Dell XPS 13 i7-8550U | |
| Samsung Notebook 9 NP900X3N-K01US | |
| Chuwi LapBook 14 inch 2017 | |
| Networking | |
| iperf3 transmit AX12 | |
| Dell XPS 13 i7-8550U | |
| Samsung Notebook 9 NP900X3N-K01US | |
| Chuwi LapBook 14 inch 2017 | |
| iperf3 receive AX12 | |
| Samsung Notebook 9 NP900X3N-K01US | |
| Dell XPS 13 i7-8550U | |
| Chuwi LapBook 14 inch 2017 | |
| |||||||||||||||||||||||||
iluminação: 92 %
iluminação com acumulador: 247.7 cd/m²
Contraste: 774:1 (Preto: 0.32 cd/m²)
ΔE Color 6.4 | 0.5-29.43 Ø5
ΔE Greyscale 4.5 | 0.57-98 Ø5.3
62.9% sRGB (Argyll 1.6.3 3D)
39.8% AdobeRGB 1998 (Argyll 1.6.3 3D)
43.93% AdobeRGB 1998 (Argyll 2.2.0 3D)
63.6% sRGB (Argyll 2.2.0 3D)
42.53% Display P3 (Argyll 2.2.0 3D)
Gamma: 2.33
| Chuwi LapBook 14 inch 2017 Name: BOE06A8, IPS, 14.10, 1920x1080 | Lenovo Ideapad 110S-11IBR Chi Mei CMN1132, TN LED, 11.60, 1366x768 | Jumper EZbook 3 MS_9003, TN LED, 14.10, 1920x1080 | HP Pavilion 14-al103ng AU Optronics, IPS, 14.00, 1920x1080 | Apple MacBook Air 13 inch 2015-03 Apple APP9CF0, TN LED, 13.30, 1440x900 | |
|---|---|---|---|---|---|
| Display | 1% | 21% | -14% | -6% | |
| Display P3 Coverage | 42.53 | 42.77 1% | 51.6 21% | 36.58 -14% | 40.1 -6% |
| sRGB Coverage | 63.6 | 64.2 1% | 77.3 22% | 54.9 -14% | 59.8 -6% |
| AdobeRGB 1998 Coverage | 43.93 | 44.2 1% | 53 21% | 37.79 -14% | 41.51 -6% |
| Response Times | 4247% | 7% | -27% | ||
| Response Time Grey 50% / Grey 80% * | 32.8 ? | 46 ? -40% | 46 ? -40% | 53 ? -62% | |
| Response Time Black / White * | 29.2 ? | 30 ? -3% | 11.6 ? 60% | 27 ? 8% | |
| PWM Frequency | 200 ? | 25770 ? 12785% | 200 ? 0% | ||
| Screen | -29% | -54% | 16% | 15% | |
| Brightness middle | 247.7 | 243 -2% | 384 55% | 200 -19% | 329 33% |
| Brightness | 243 | 230 -5% | 341 40% | 191 -21% | 310 28% |
| Brightness Distribution | 92 | 91 -1% | 76 -17% | 90 -2% | 82 -11% |
| Black Level * | 0.32 | 0.4 -25% | 1.28 -300% | 0.14 56% | 0.405 -27% |
| Contrast | 774 | 608 -21% | 300 -61% | 1429 85% | 812 5% |
| Colorchecker dE 2000 * | 6.4 | 11.24 -76% | 8.7 -36% | 5.06 21% | 3.96 38% |
| Colorchecker dE 2000 max. * | 24.3 | 19.82 18% | 16.7 31% | 10.91 55% | 7.51 69% |
| Greyscale dE 2000 * | 4.5 | 12.78 -184% | 11.1 -147% | 3.94 12% | 3.51 22% |
| Gamma | 2.33 94% | 2.33 94% | 2.2 100% | 2.41 91% | 3.83 57% |
| CCT | 7318 89% | 15436 42% | 12445 52% | 6159 106% | 6711 97% |
| Color Space (Percent of AdobeRGB 1998) | 39.8 | 41 3% | 35 -12% | 38.4 -4% | |
| Color Space (Percent of sRGB) | 62.9 | 64 2% | 55 -13% | 59.8 -5% | |
| Total Average (Program / Settings) | 1406% /
778% | -9% /
-25% | -8% /
4% | 5% /
10% |
* ... smaller is better
Display Response Times
| ↔ Response Time Black to White | ||
|---|---|---|
| 29.2 ms ... rise ↗ and fall ↘ combined | ↗ 16 ms rise | 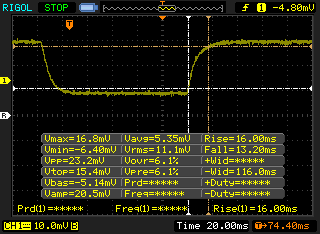 |
| ↘ 13.2 ms fall | ||
| The screen shows relatively slow response rates in our tests and may be too slow for gamers. In comparison, all tested devices range from 0.1 (minimum) to 240 (maximum) ms. » 75 % of all devices are better. This means that the measured response time is worse than the average of all tested devices (21.5 ms). | ||
| ↔ Response Time 50% Grey to 80% Grey | ||
| 32.8 ms ... rise ↗ and fall ↘ combined | ↗ 12.8 ms rise | 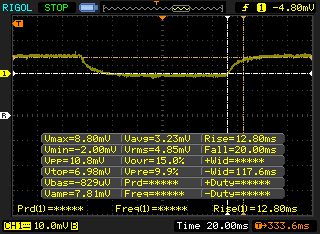 |
| ↘ 20 ms fall | ||
| The screen shows slow response rates in our tests and will be unsatisfactory for gamers. In comparison, all tested devices range from 0.2 (minimum) to 636 (maximum) ms. » 38 % of all devices are better. This means that the measured response time is similar to the average of all tested devices (33.7 ms). | ||
Screen Flickering / PWM (Pulse-Width Modulation)
| Screen flickering / PWM detected | 200 Hz | ≤ 20 % brightness setting | 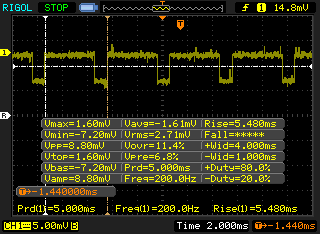 |
The display backlight flickers at 200 Hz (worst case, e.g., utilizing PWM) Flickering detected at a brightness setting of 20 % and below. There should be no flickering or PWM above this brightness setting. The frequency of 200 Hz is relatively low, so sensitive users will likely notice flickering and experience eyestrain at the stated brightness setting and below. In comparison: 53 % of all tested devices do not use PWM to dim the display. If PWM was detected, an average of 17915 (minimum: 5 - maximum: 3846000) Hz was measured. | |||
| Cinebench R10 | |
| Rendering Multiple CPUs 32Bit | |
| Lenovo Thinkpad 13-20J1001BUS | |
| Acer TravelMate P249-M-3895 | |
| Lenovo IdeaPad Z40-59422614 | |
| HP Pavilion 15z-bw000 | |
| HP 15-bw077ax | |
| HP 15z-ba000 | |
| Acer Spin 1 SP111-31-C79E | |
| Chuwi LapBook 14 inch 2017 | |
| Lenovo Ideapad 110S-11IBR | |
| Rendering Single 32Bit | |
| Lenovo Thinkpad 13-20J1001BUS | |
| Lenovo IdeaPad Z40-59422614 | |
| Acer TravelMate P249-M-3895 | |
| HP 15-bw077ax | |
| HP Pavilion 15z-bw000 | |
| HP 15z-ba000 | |
| Acer Spin 1 SP111-31-C79E | |
| Lenovo Ideapad 110S-11IBR | |
| Chuwi LapBook 14 inch 2017 | |
| wPrime 2.10 - 1024m | |
| Chuwi LapBook 14 inch 2017 | |
| Lenovo IdeaPad Z40-59422614 | |
| HP 15-bw077ax | |
| Lenovo Thinkpad 13-20J1001BUS | |
| HP Pavilion 15z-bw000 | |
* ... smaller is better
| PCMark 8 | |
| Home Score Accelerated v2 | |
| Acer Swift 3 SF315-51G-57E5 | |
| Apple MacBook Air 13 inch 2015-03 | |
| Chuwi LapBook 14 inch 2017 | |
| Lenovo Yoga Book 2016 Windows 64GB LTE | |
| Work Score Accelerated v2 | |
| Acer Swift 3 SF315-51G-57E5 | |
| Apple MacBook Air 13 inch 2015-03 | |
| Chuwi LapBook 14 inch 2017 | |
| Lenovo Yoga Book 2016 Windows 64GB LTE | |
| Creative Score Accelerated v2 | |
| Acer Swift 3 SF315-51G-57E5 | |
| Apple MacBook Air 13 inch 2015-03 | |
| Chuwi LapBook 14 inch 2017 | |
| PCMark 8 Home Score Accelerated v2 | 1682 pontos | |
| PCMark 8 Creative Score Accelerated v2 | 1952 pontos | |
| PCMark 8 Work Score Accelerated v2 | 2552 pontos | |
| PCMark 10 Score | 1243 pontos | |
Ajuda | ||
| Chuwi LapBook 14 inch 2017 SanDisk DF4128 | Dell XPS 13 i7-8550U Toshiba XG5 KXG50ZNV256G | Samsung Notebook 9 NP900X3N-K01US Samsung CM871a MZNTY256HDHP | Lenovo Ideapad 110S-11IBR SanDisk DF4032 | Lenovo IdeaPad 320s-14IKB Samsung PM961 NVMe MZVLW128HEGR | |
|---|---|---|---|---|---|
| CrystalDiskMark 5.2 / 6 | 743% | 402% | -8% | 696% | |
| Write 4K | 11.87 | 121.5 924% | 105.4 788% | 13.87 17% | 127.9 978% |
| Read 4K | 11.45 | 24.92 118% | 34.45 201% | 12.23 7% | 42.82 274% |
| Write Seq | 106.1 | 345 225% | 458.4 332% | 101.7 -4% | 795 649% |
| Read Seq | 293.6 | 1313 347% | 489.4 67% | 165.1 -44% | 1056 260% |
| Write 4K Q32T1 | 15.22 | 346.1 2174% | 99.2 552% | 13.63 -10% | 176.8 1062% |
| Read 4K Q32T1 | 33.91 | 389.4 1048% | 273.5 707% | 36.23 7% | 322.4 851% |
| Write Seq Q32T1 | 110.3 | 334.7 203% | 512 364% | 94.8 -14% | 793 619% |
| Read Seq Q32T1 | 183 | 1840 905% | 551 201% | 147.5 -19% | 1782 874% |

| 3DMark | |
| 1280x720 Cloud Gate Standard Graphics | |
| Intel NUC5i3RYK | |
| Acer Spin 5 SP513-51 | |
| Lenovo Thinkpad 13-20J1001BUS | |
| Fujitsu Lifebook U574 | |
| Lenovo Ideapad 320-17AST-80XW0013GE | |
| HP 15-bw075ax | |
| Jumper EZbook 3 | |
| Chuwi Lapbook 12.3 | |
| Chuwi LapBook 14 inch 2017 | |
| Lenovo Yoga Book 2016 Windows 64GB LTE | |
| Lenovo Miix 3 10 | |
| 1280x720 offscreen Ice Storm Unlimited Graphics Score | |
| Lenovo Thinkpad 13-20J1001BUS | |
| Lenovo Ideapad 320-17AST-80XW0013GE | |
| HP 15-bw075ax | |
| Chuwi Lapbook 12.3 | |
| Jumper EZbook 3 | |
| Chuwi LapBook 14 inch 2017 | |
| 3DMark 11 | |
| 1280x720 Performance GPU | |
| Asus VivoBook X751BP-TY048T | |
| Acer Spin 5 SP513-51 | |
| Intel NUC5i3RYK | |
| Fujitsu Lifebook U574 | |
| Lenovo Ideapad 320-17AST-80XW0013GE | |
| Chuwi Lapbook 12.3 | |
| Jumper EZbook 3 | |
| Lenovo Yoga Book 2016 Windows 64GB LTE | |
| Chuwi LapBook 14 inch 2017 | |
| Lenovo Miix 3 10 | |
| 1280x720 Performance Combined | |
| Asus VivoBook X751BP-TY048T | |
| Intel NUC5i3RYK | |
| Acer Spin 5 SP513-51 | |
| Lenovo Ideapad 320-17AST-80XW0013GE | |
| Fujitsu Lifebook U574 | |
| Chuwi Lapbook 12.3 | |
| Lenovo Yoga Book 2016 Windows 64GB LTE | |
| Jumper EZbook 3 | |
| Chuwi LapBook 14 inch 2017 | |
| Lenovo Miix 3 10 | |
| 3DMark 11 Performance | 445 pontos | |
| 3DMark Ice Storm Standard Score | 20937 pontos | |
| 3DMark Cloud Gate Standard Score | 2152 pontos | |
| 3DMark Fire Strike Score | 271 pontos | |
Ajuda | ||
Barulho
| Ocioso |
| / / dB |
| Carga |
| / dB |
 | ||
30 dB silencioso 40 dB(A) audível 50 dB(A) ruidosamente alto |
||
min: | ||
| Chuwi LapBook 14 inch 2017 HD Graphics 500, Celeron N3450, SanDisk DF4128 | Samsung Notebook 9 NP900X3N-K01US HD Graphics 620, i5-7200U, Samsung CM871a MZNTY256HDHP | Lenovo Ideapad 110S-11IBR HD Graphics 400 (Braswell), N3060, SanDisk DF4032 | Lenovo IdeaPad 320s-14IKB HD Graphics 610, Pentium 4415U, Samsung PM961 NVMe MZVLW128HEGR | Acer Swift 3 SF315-51G-57E5 GeForce MX150, i5-8250U, Hynix HFS128G39TND | Apple MacBook Air 13.3" 1.8 GHz (2017) HD Graphics 6000, 5350U, Apple SSD SM0128G | |
|---|---|---|---|---|---|---|
| Noise | ||||||
| off / environment * | 28.4 | 30.5 | ||||
| Idle Minimum * | 28.4 | 31.1 | 30.5 | |||
| Idle Average * | 28.4 | 31.1 | 30.5 | |||
| Idle Maximum * | 28.4 | 31.1 | 30.9 | |||
| Load Average * | 33.2 | 34.8 | 35.7 | |||
| Load Maximum * | 35.2 | 33.7 | 35.6 |
* ... smaller is better
(±) The maximum temperature on the upper side is 42.4 °C / 108 F, compared to the average of 35.9 °C / 97 F, ranging from 21.4 to 59 °C for the class Subnotebook.
(±) The bottom heats up to a maximum of 45 °C / 113 F, compared to the average of 39.4 °C / 103 F
(+) In idle usage, the average temperature for the upper side is 24.8 °C / 77 F, compared to the device average of 30.7 °C / 87 F.
(+) The palmrests and touchpad are reaching skin temperature as a maximum (35.2 °C / 95.4 F) and are therefore not hot.
(-) The average temperature of the palmrest area of similar devices was 28.3 °C / 82.9 F (-6.9 °C / -12.5 F).
Chuwi LapBook 14 inch 2017 audio analysis
(-) | not very loud speakers (59.1 dB)
Bass 100 - 315 Hz
(-) | nearly no bass - on average 15.8% lower than median
(±) | linearity of bass is average (10.1% delta to prev. frequency)
Mids 400 - 2000 Hz
(±) | higher mids - on average 5.9% higher than median
(±) | linearity of mids is average (13.9% delta to prev. frequency)
Highs 2 - 16 kHz
(+) | balanced highs - only 4.9% away from median
(±) | linearity of highs is average (12.8% delta to prev. frequency)
Overall 100 - 16.000 Hz
(-) | overall sound is not linear (37.5% difference to median)
Compared to same class
» 97% of all tested devices in this class were better, 1% similar, 1% worse
» The best had a delta of 5%, average was 19%, worst was 53%
Compared to all devices tested
» 93% of all tested devices were better, 1% similar, 6% worse
» The best had a delta of 4%, average was 25%, worst was 134%
Apple MacBook 12 (Early 2016) 1.1 GHz audio analysis
(+) | speakers can play relatively loud (83.6 dB)
Bass 100 - 315 Hz
(±) | reduced bass - on average 11.3% lower than median
(±) | linearity of bass is average (14.2% delta to prev. frequency)
Mids 400 - 2000 Hz
(+) | balanced mids - only 2.4% away from median
(+) | mids are linear (5.5% delta to prev. frequency)
Highs 2 - 16 kHz
(+) | balanced highs - only 2% away from median
(+) | highs are linear (4.5% delta to prev. frequency)
Overall 100 - 16.000 Hz
(+) | overall sound is linear (10.2% difference to median)
Compared to same class
» 5% of all tested devices in this class were better, 2% similar, 93% worse
» The best had a delta of 5%, average was 19%, worst was 53%
Compared to all devices tested
» 3% of all tested devices were better, 1% similar, 96% worse
» The best had a delta of 4%, average was 25%, worst was 134%
| desligado | |
| Ocioso | |
| Carga |
|
| Chuwi LapBook 14 inch 2017 Celeron N3450, HD Graphics 500, SanDisk DF4128, IPS, 1920x1080, 14.10 | Lenovo Ideapad 110S-11IBR N3060, HD Graphics 400 (Braswell), SanDisk DF4032, TN LED, 1366x768, 11.60 | Lenovo IdeaPad 320s-14IKB Pentium 4415U, HD Graphics 610, Samsung PM961 NVMe MZVLW128HEGR, IPS, 1920x1080, 14.00 | Apple MacBook Air 13.3" 1.8 GHz (2017) 5350U, HD Graphics 6000, Apple SSD SM0128G, TN LED, 1440x900, 13.30 | HP Pavilion 14-al103ng i5-7200U, HD Graphics 620, Western Digital Scorpio Blue WD5000LPCX-24C6HT0, IPS, 1920x1080, 14.00 | Asus VivoBook E200HA-FD0041TS Z8350, HD Graphics 400 (Braswell), Hynix HBG4a2 32 GB eMMC, TN LED, 1366x768, 11.60 | |
|---|---|---|---|---|---|---|
| Power Consumption | -27% | -24% | -68% | -69% | 5% | |
| Idle Minimum * | 3.6 | 7 -94% | 3.4 6% | 3.4 6% | 5.5 -53% | 4.3 -19% |
| Idle Average * | 6.2 | 8.2 -32% | 6.3 -2% | 6.3 -2% | 8.2 -32% | 6 3% |
| Idle Maximum * | 6.5 | 8.5 -31% | 6.7 -3% | 7 -8% | 8.9 -37% | 6.3 3% |
| Load Average * | 13.5 | 12.5 7% | 24.5 -81% | 34.5 -156% | 29.1 -116% | 11.4 16% |
| Load Maximum * | 14.3 | 12.3 14% | 20.2 -41% | 40 -180% | 29.4 -106% | 10.8 24% |
* ... smaller is better
| Chuwi LapBook 14 inch 2017 Celeron N3450, HD Graphics 500, 38 Wh | Samsung Notebook 9 NP900X3N-K01US i5-7200U, HD Graphics 620, 30 Wh | Lenovo Ideapad 110S-11IBR N3060, HD Graphics 400 (Braswell), 39.1 Wh | Lenovo IdeaPad 320s-14IKB Pentium 4415U, HD Graphics 610, 30 Wh | Apple MacBook Air 13.3" 1.8 GHz (2017) 5350U, HD Graphics 6000, 54 Wh | Lenovo Yoga Book 2016 Windows 64GB LTE Z8550, HD Graphics 400 (Braswell), 32 Wh | |
|---|---|---|---|---|---|---|
| Battery Runtime | -32% | 3% | 24% | 72% | 50% | |
| Reader / Idle | 696 | 695 0% | 1153 66% | |||
| WiFi v1.3 | 372 | 279 -25% | 384 3% | 460 24% | 638 72% | 498 34% |
| Load | 199 | 60 -70% |
Pro
Contra
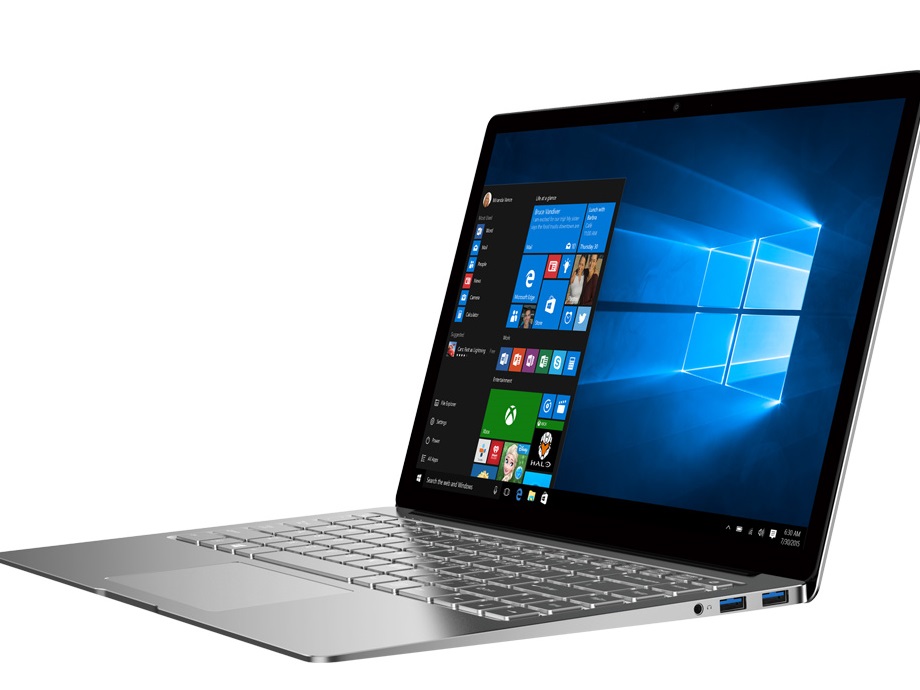
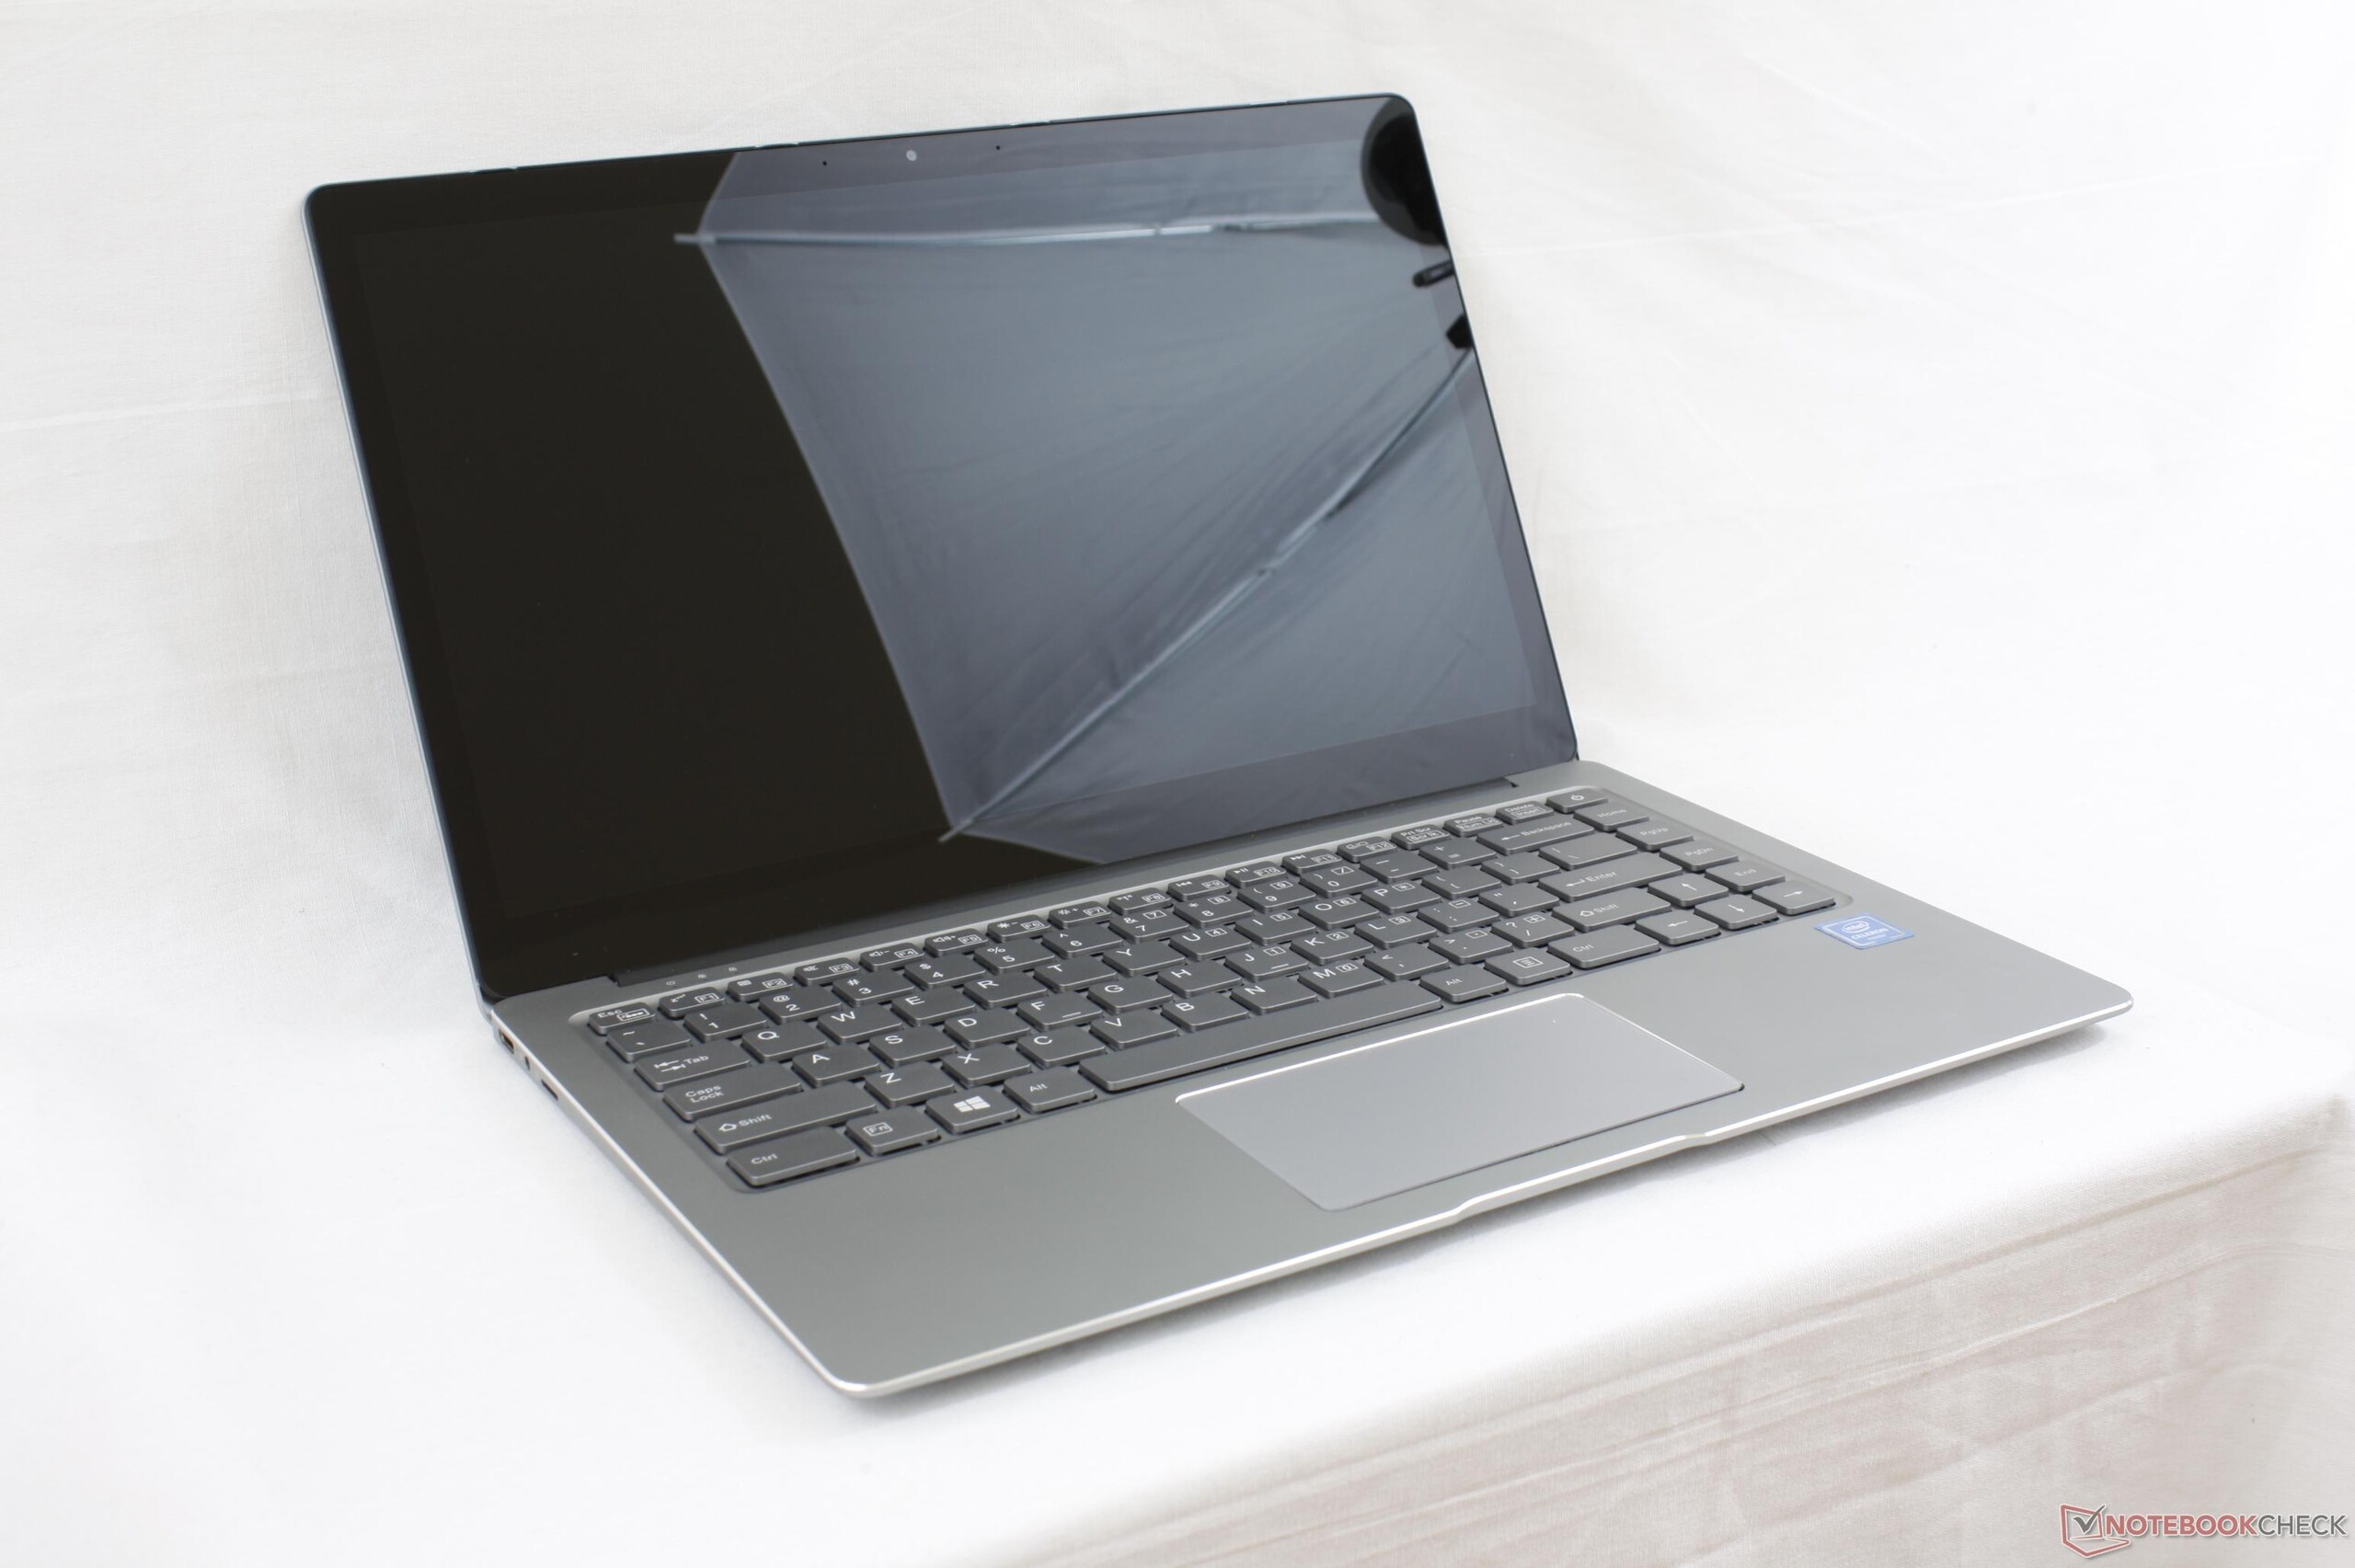
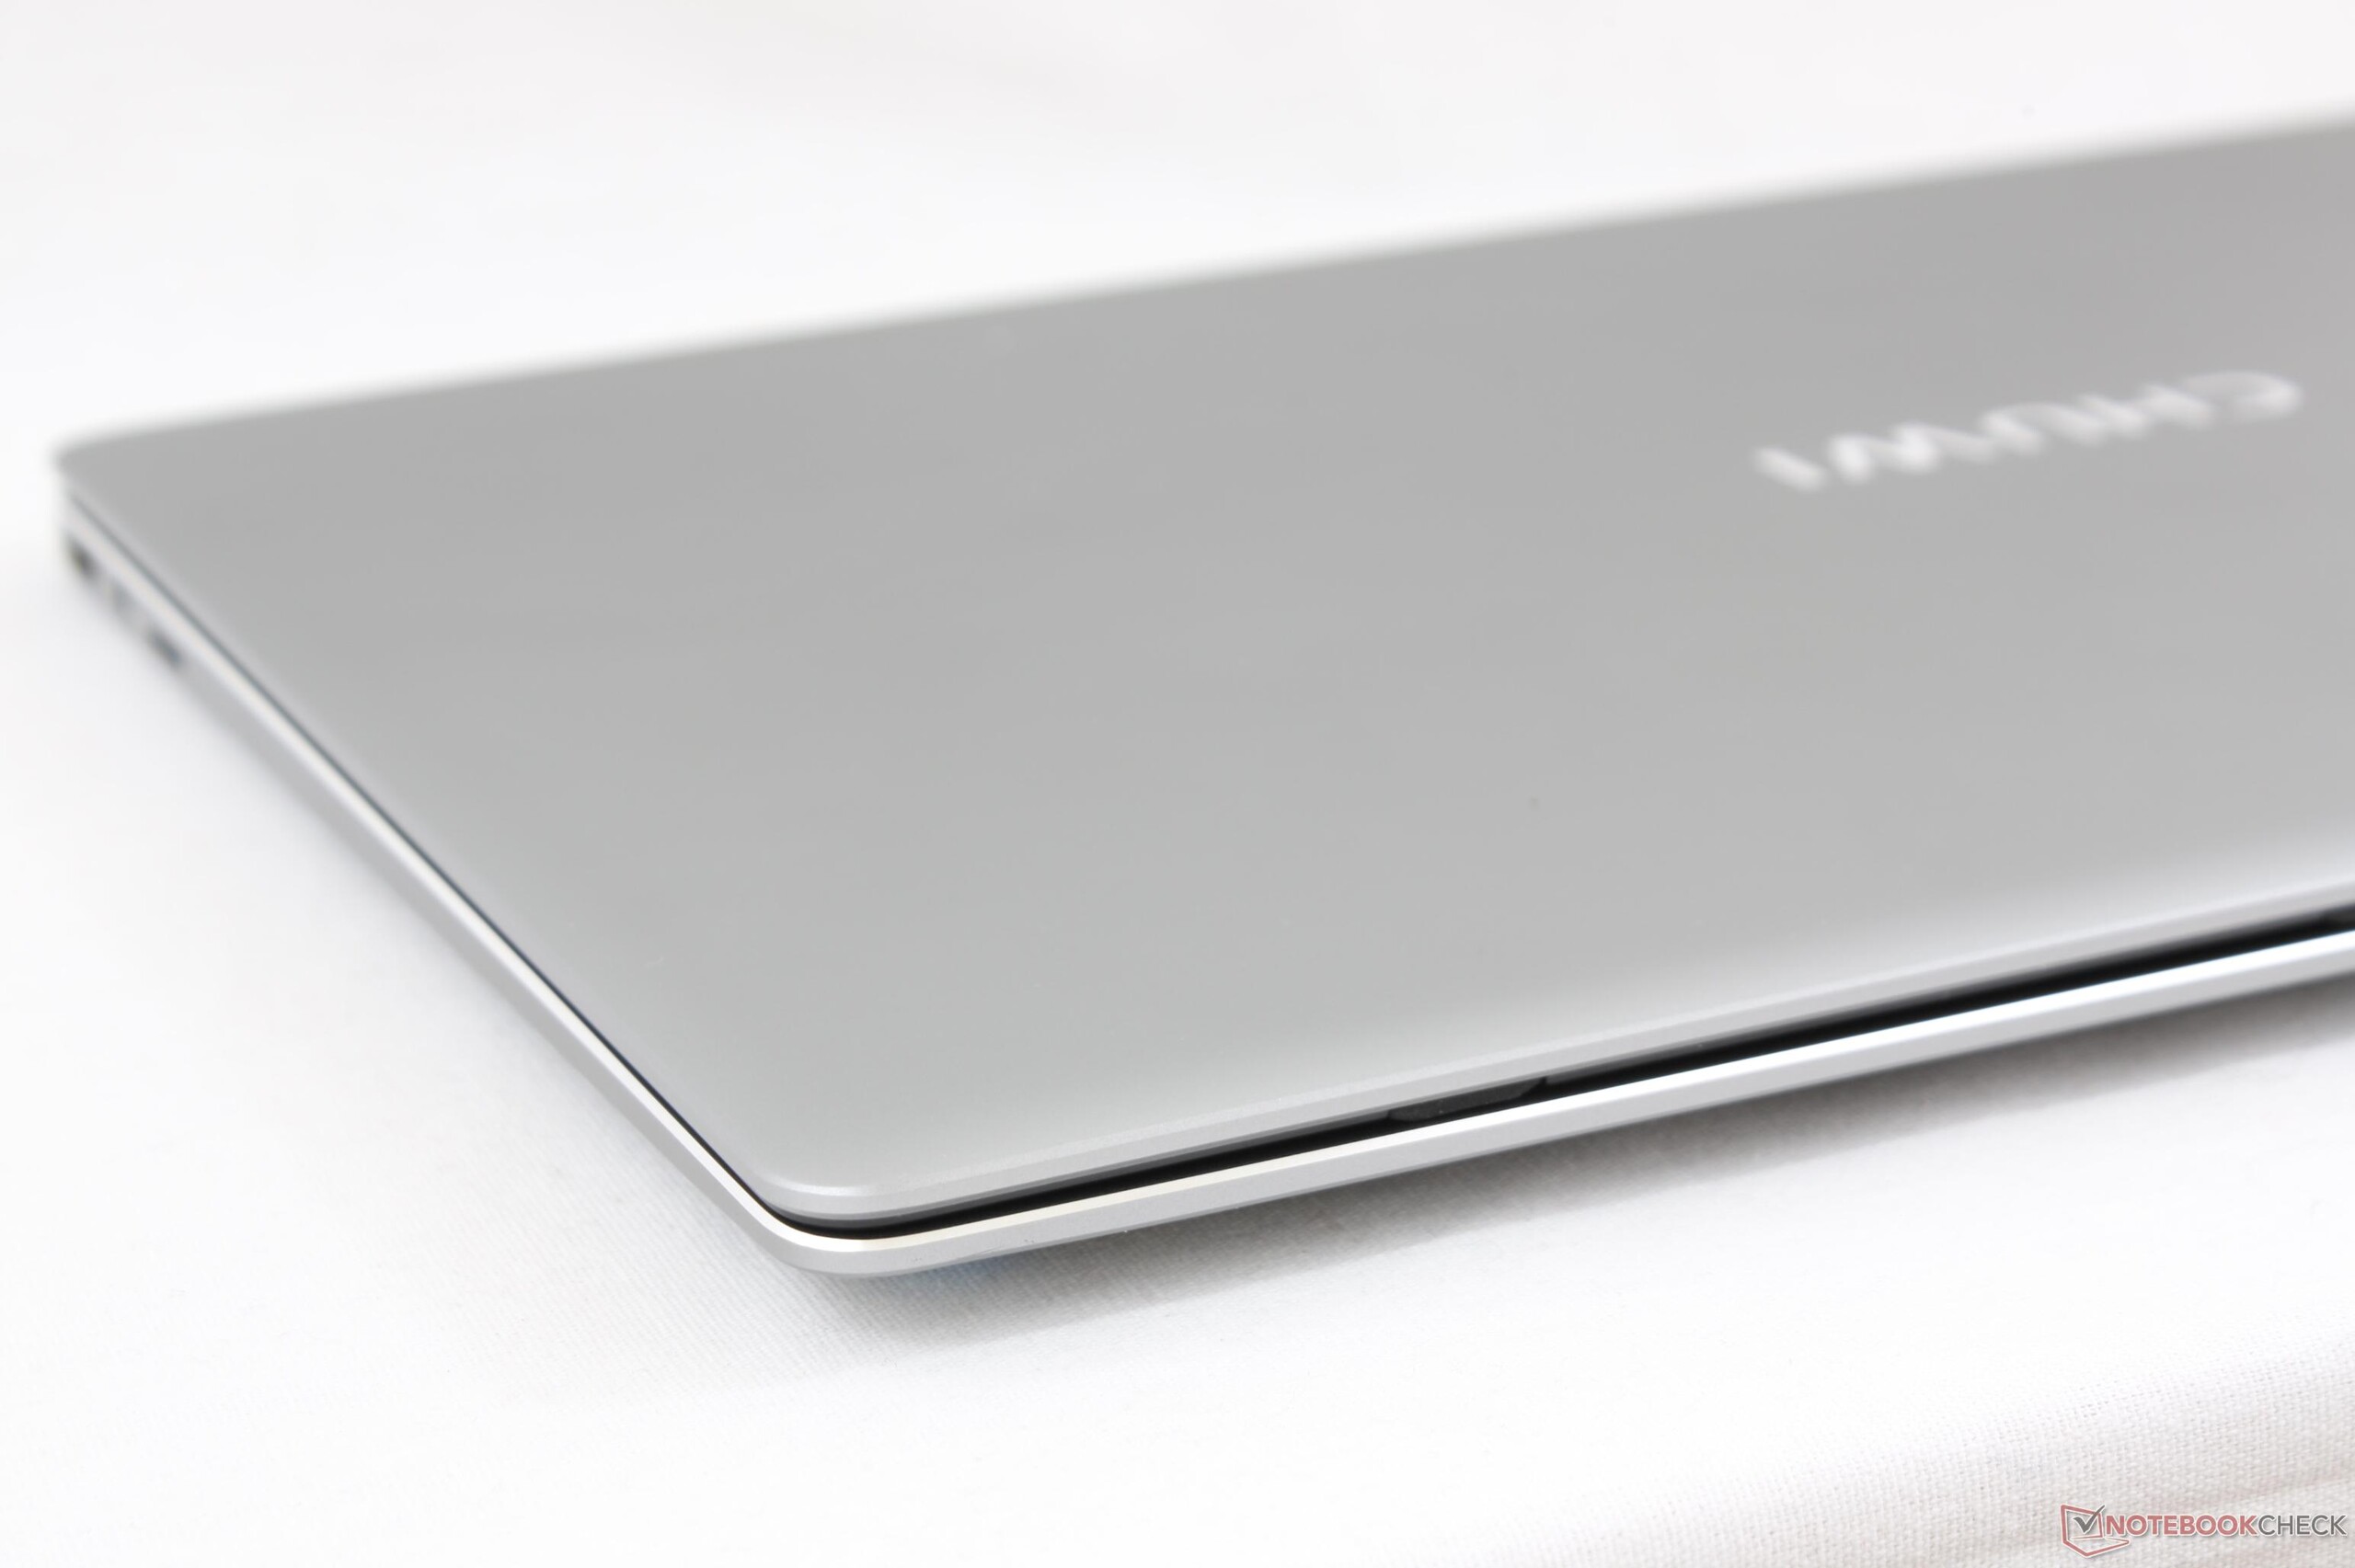
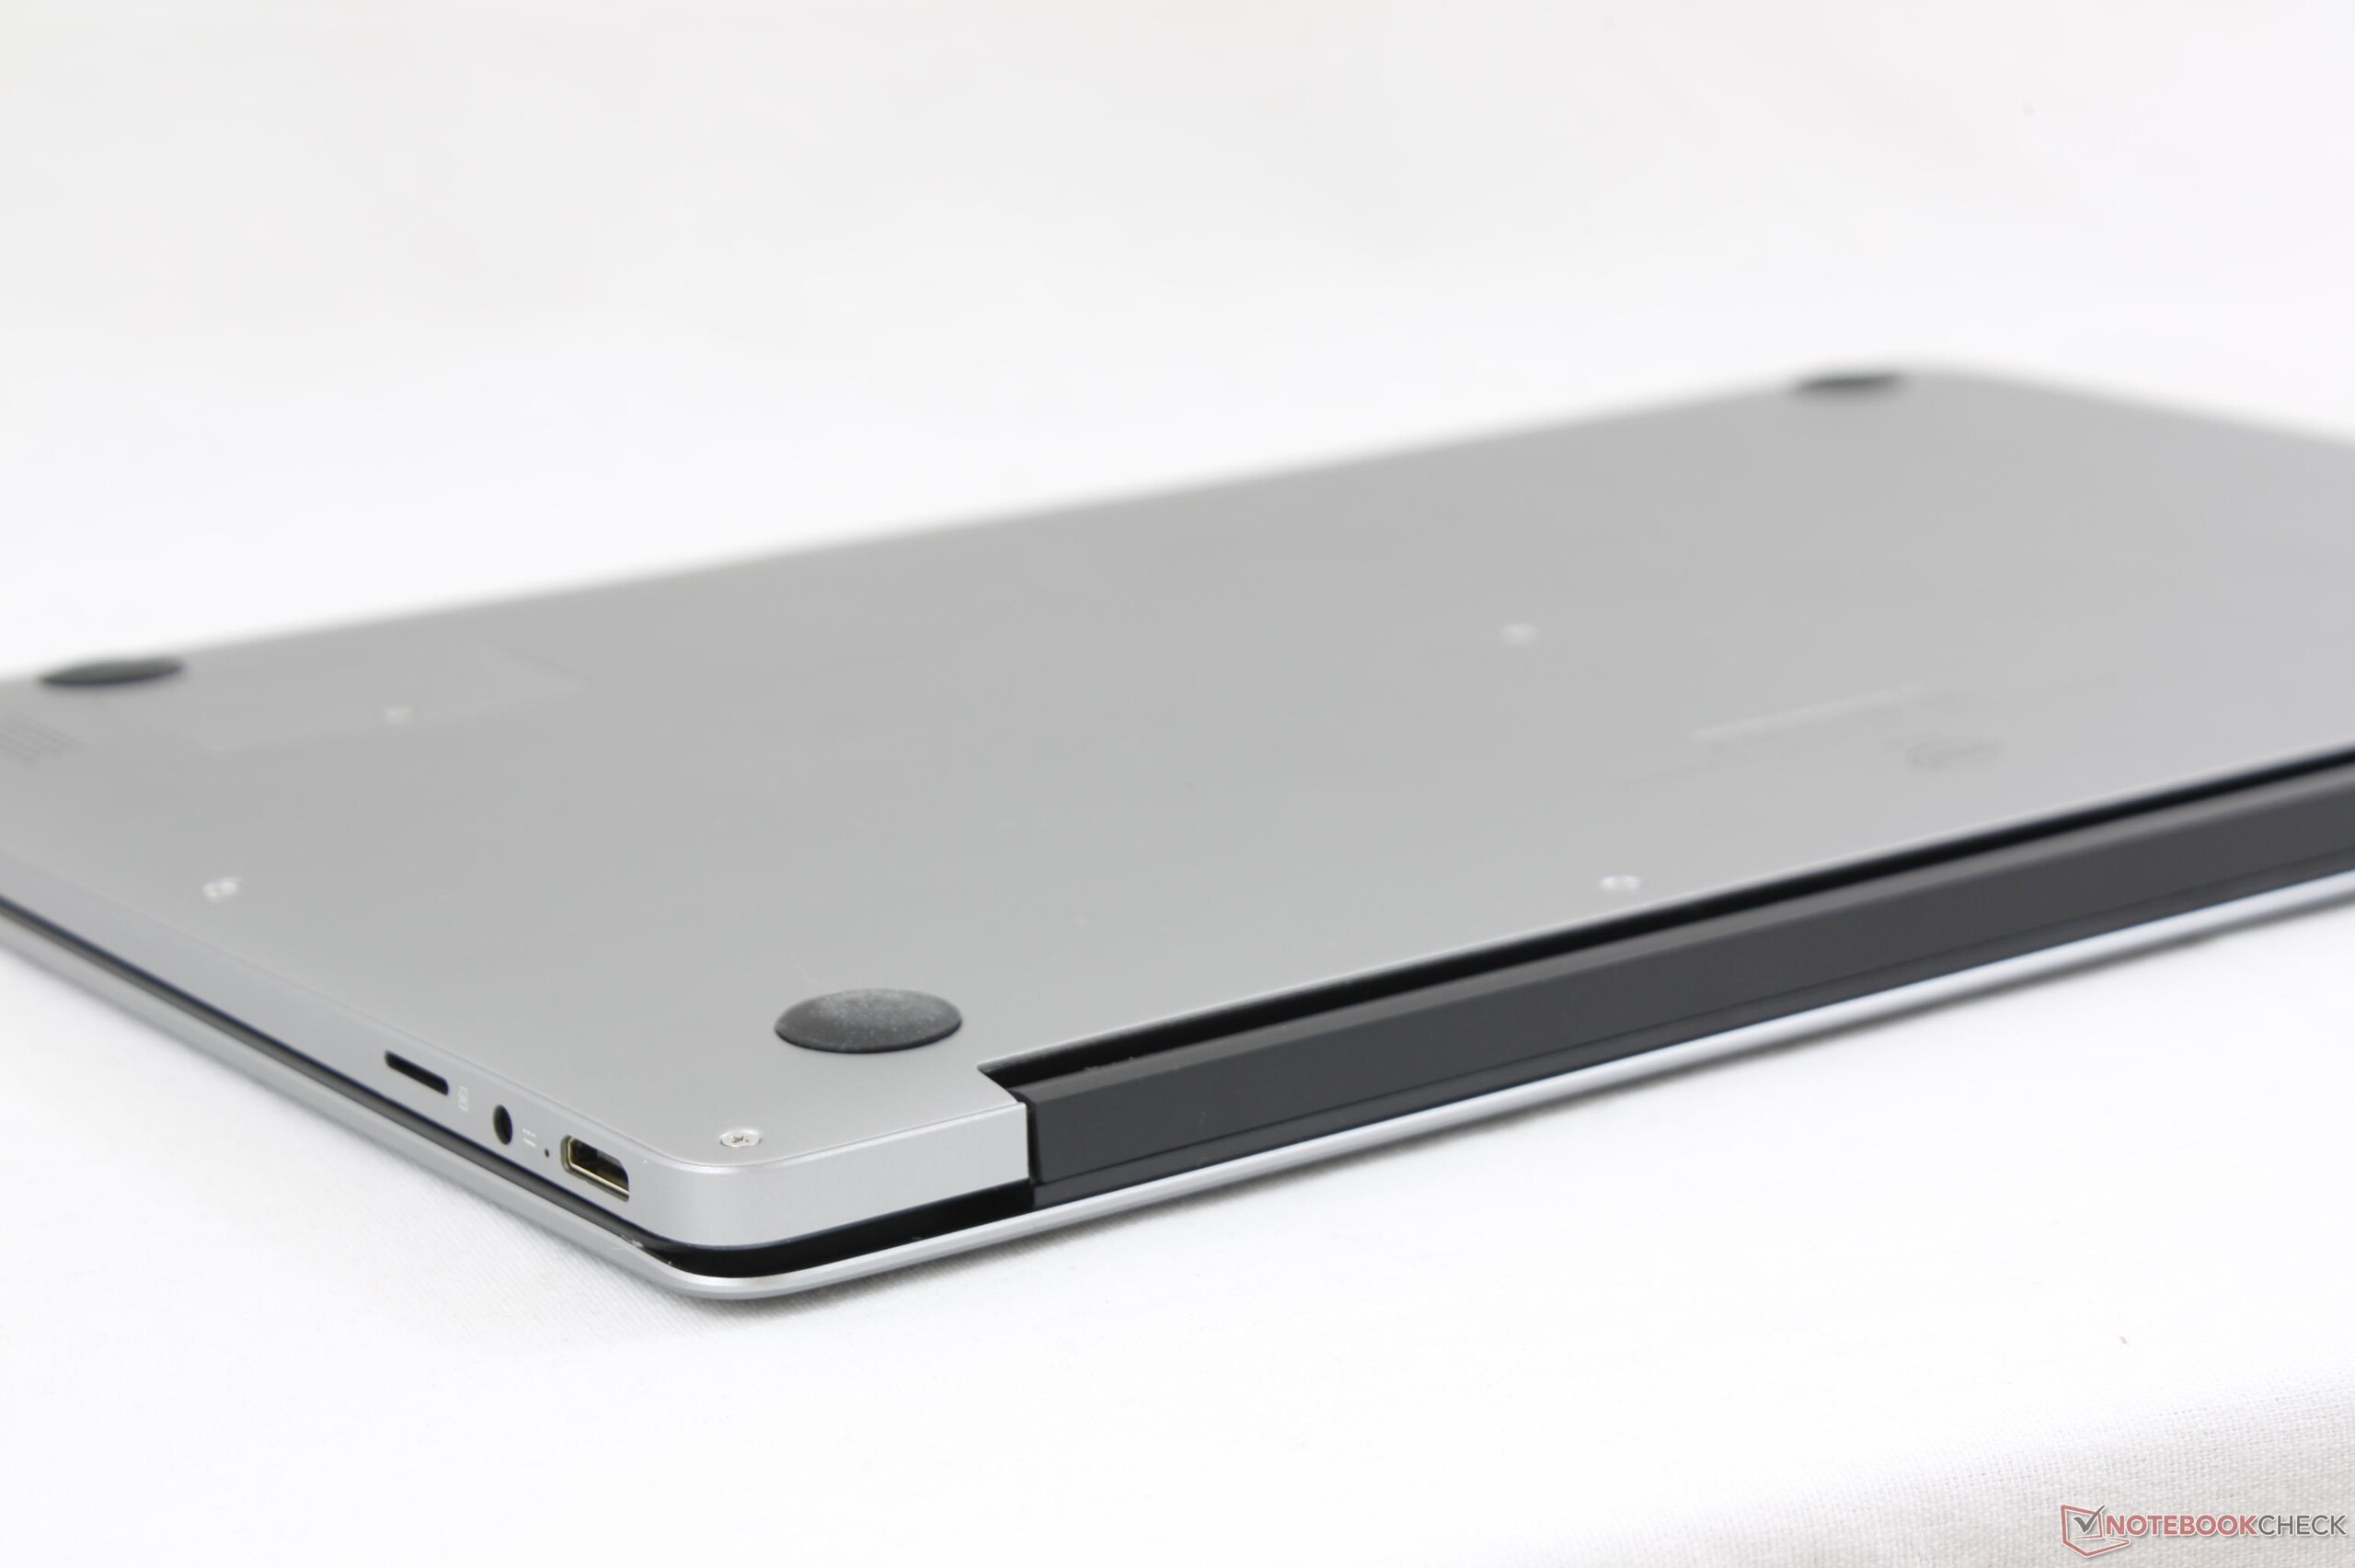
O LapBook Air se vê e se sente incrível considerando o baixo preço de $400. A tela IPS de 1080p é nítida, a opção de armazenamento interno secundária é rara e inclusive o teclado é iluminado. Infelizmente, o fabricante teve que fazer alguns cortes profundos em quase todos os outros lugares para atingir o preço impossivelmente baixo.
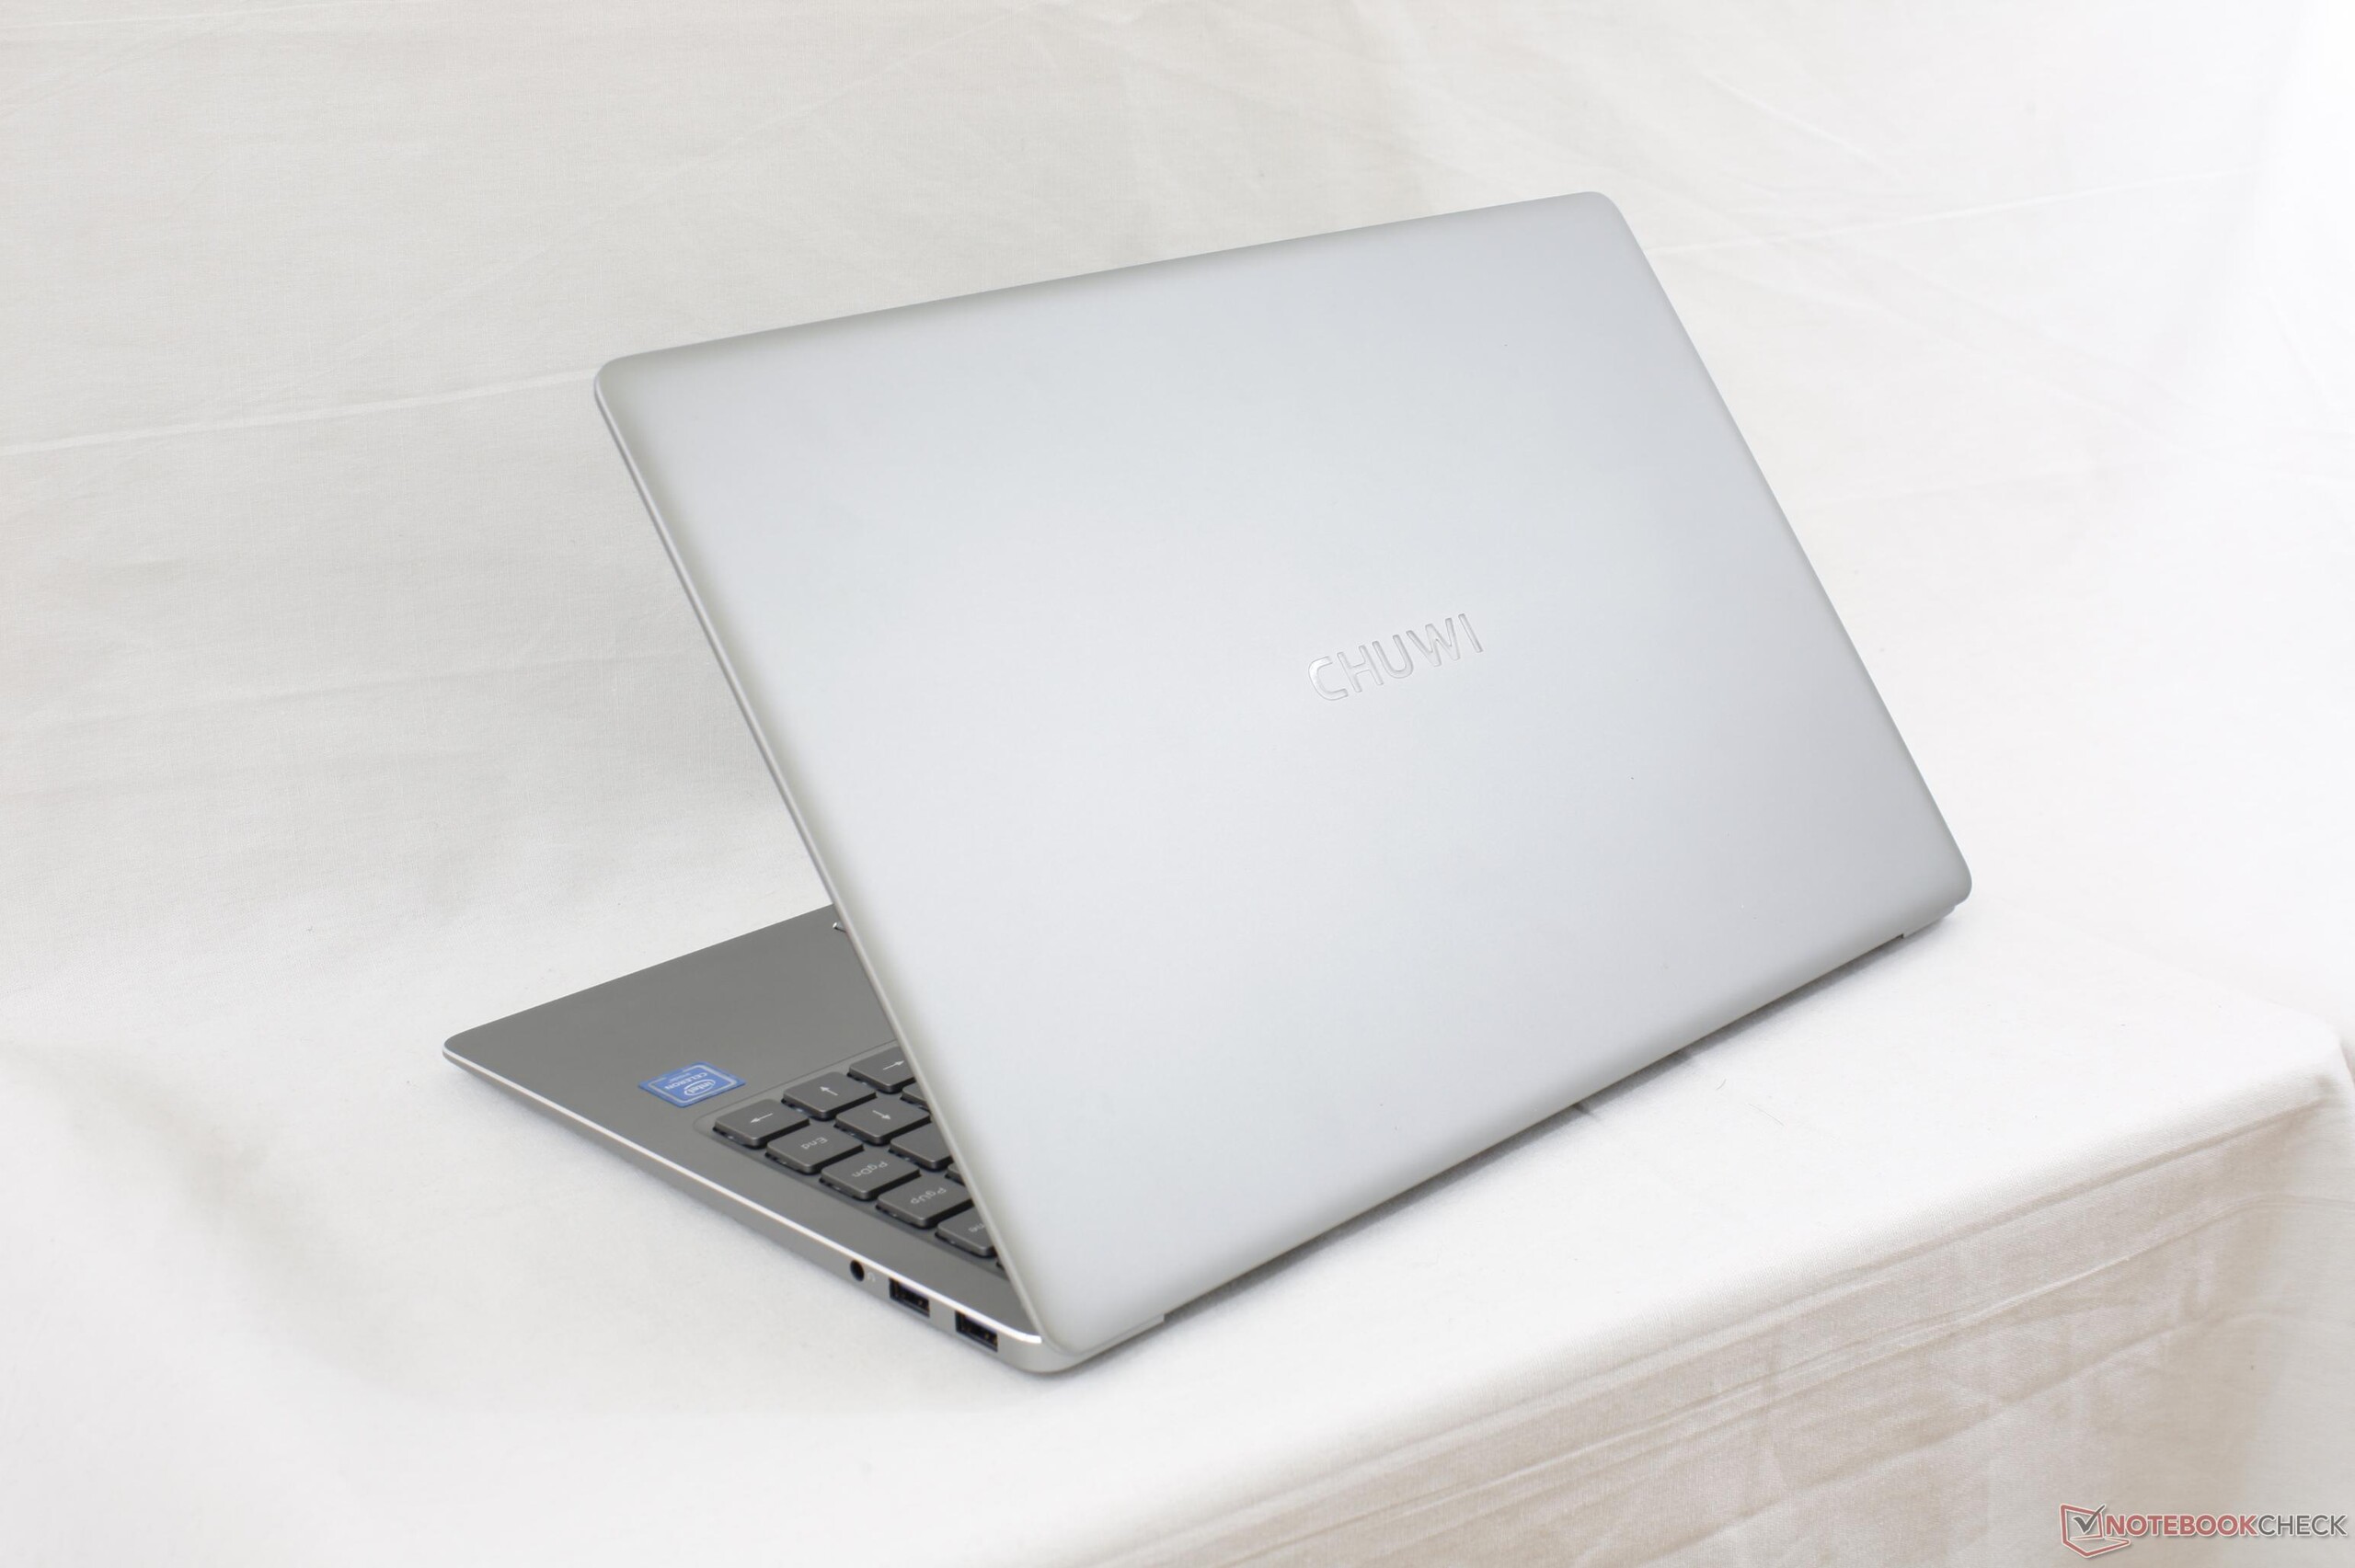
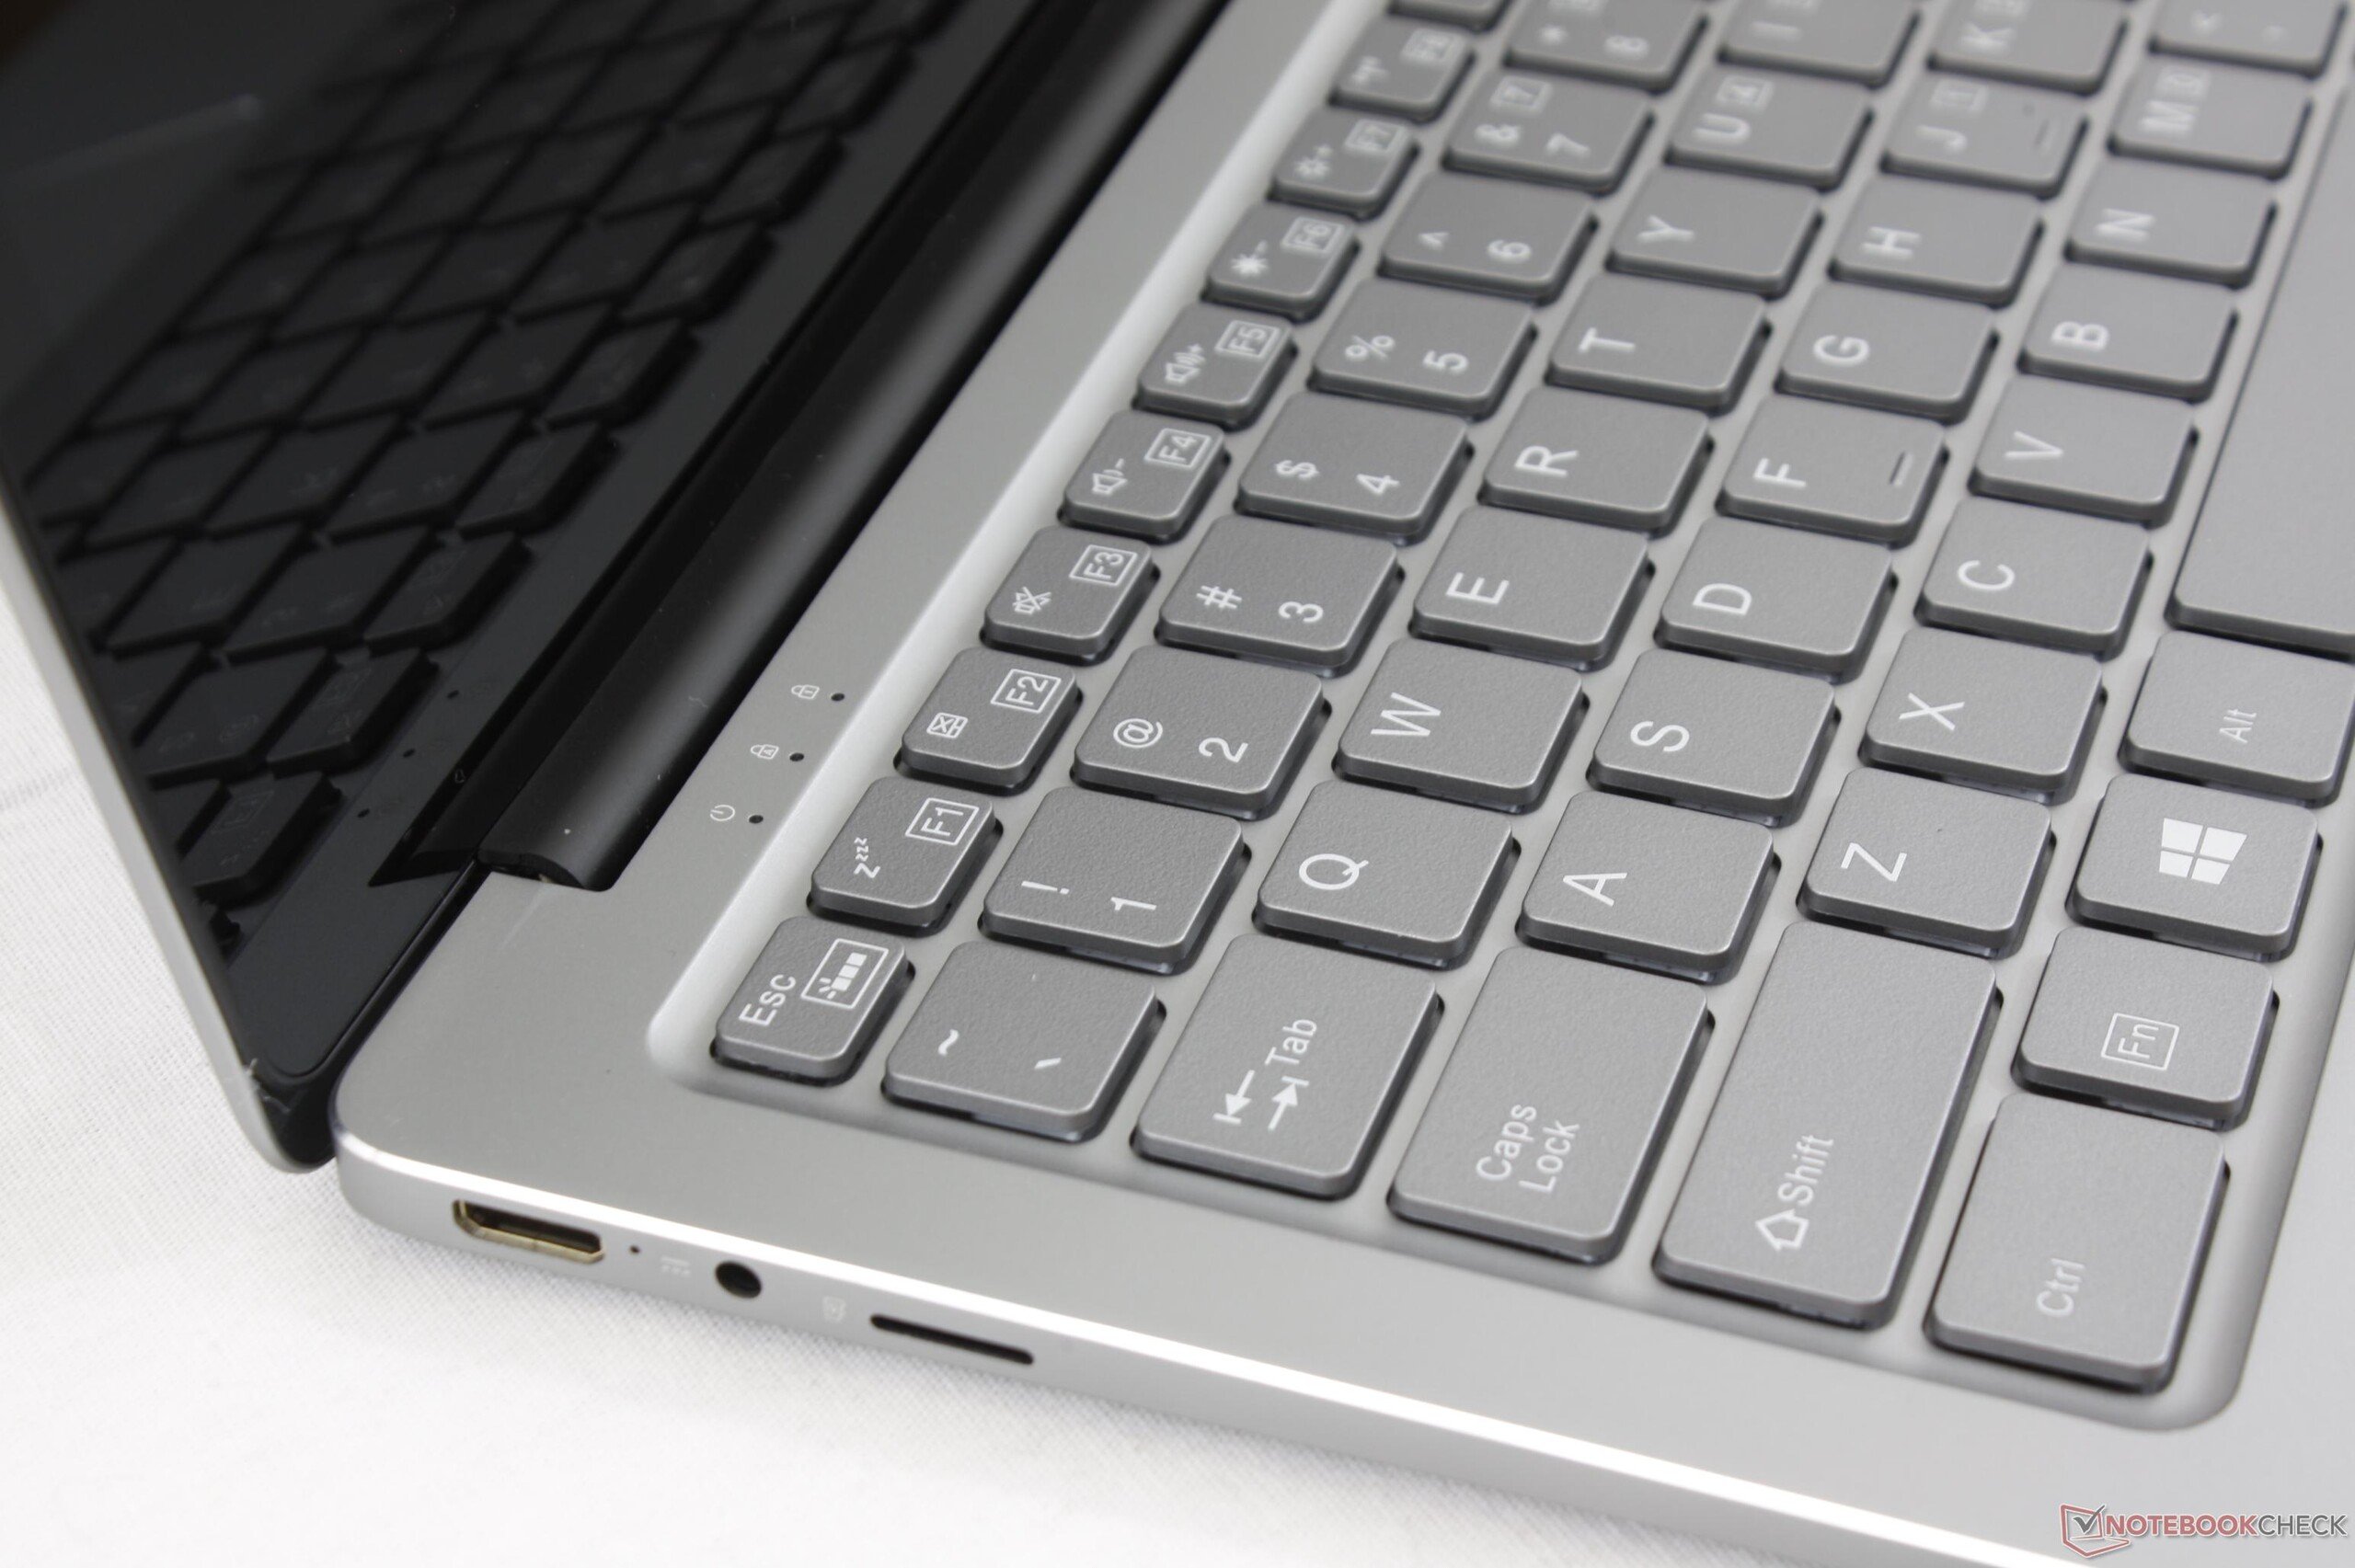
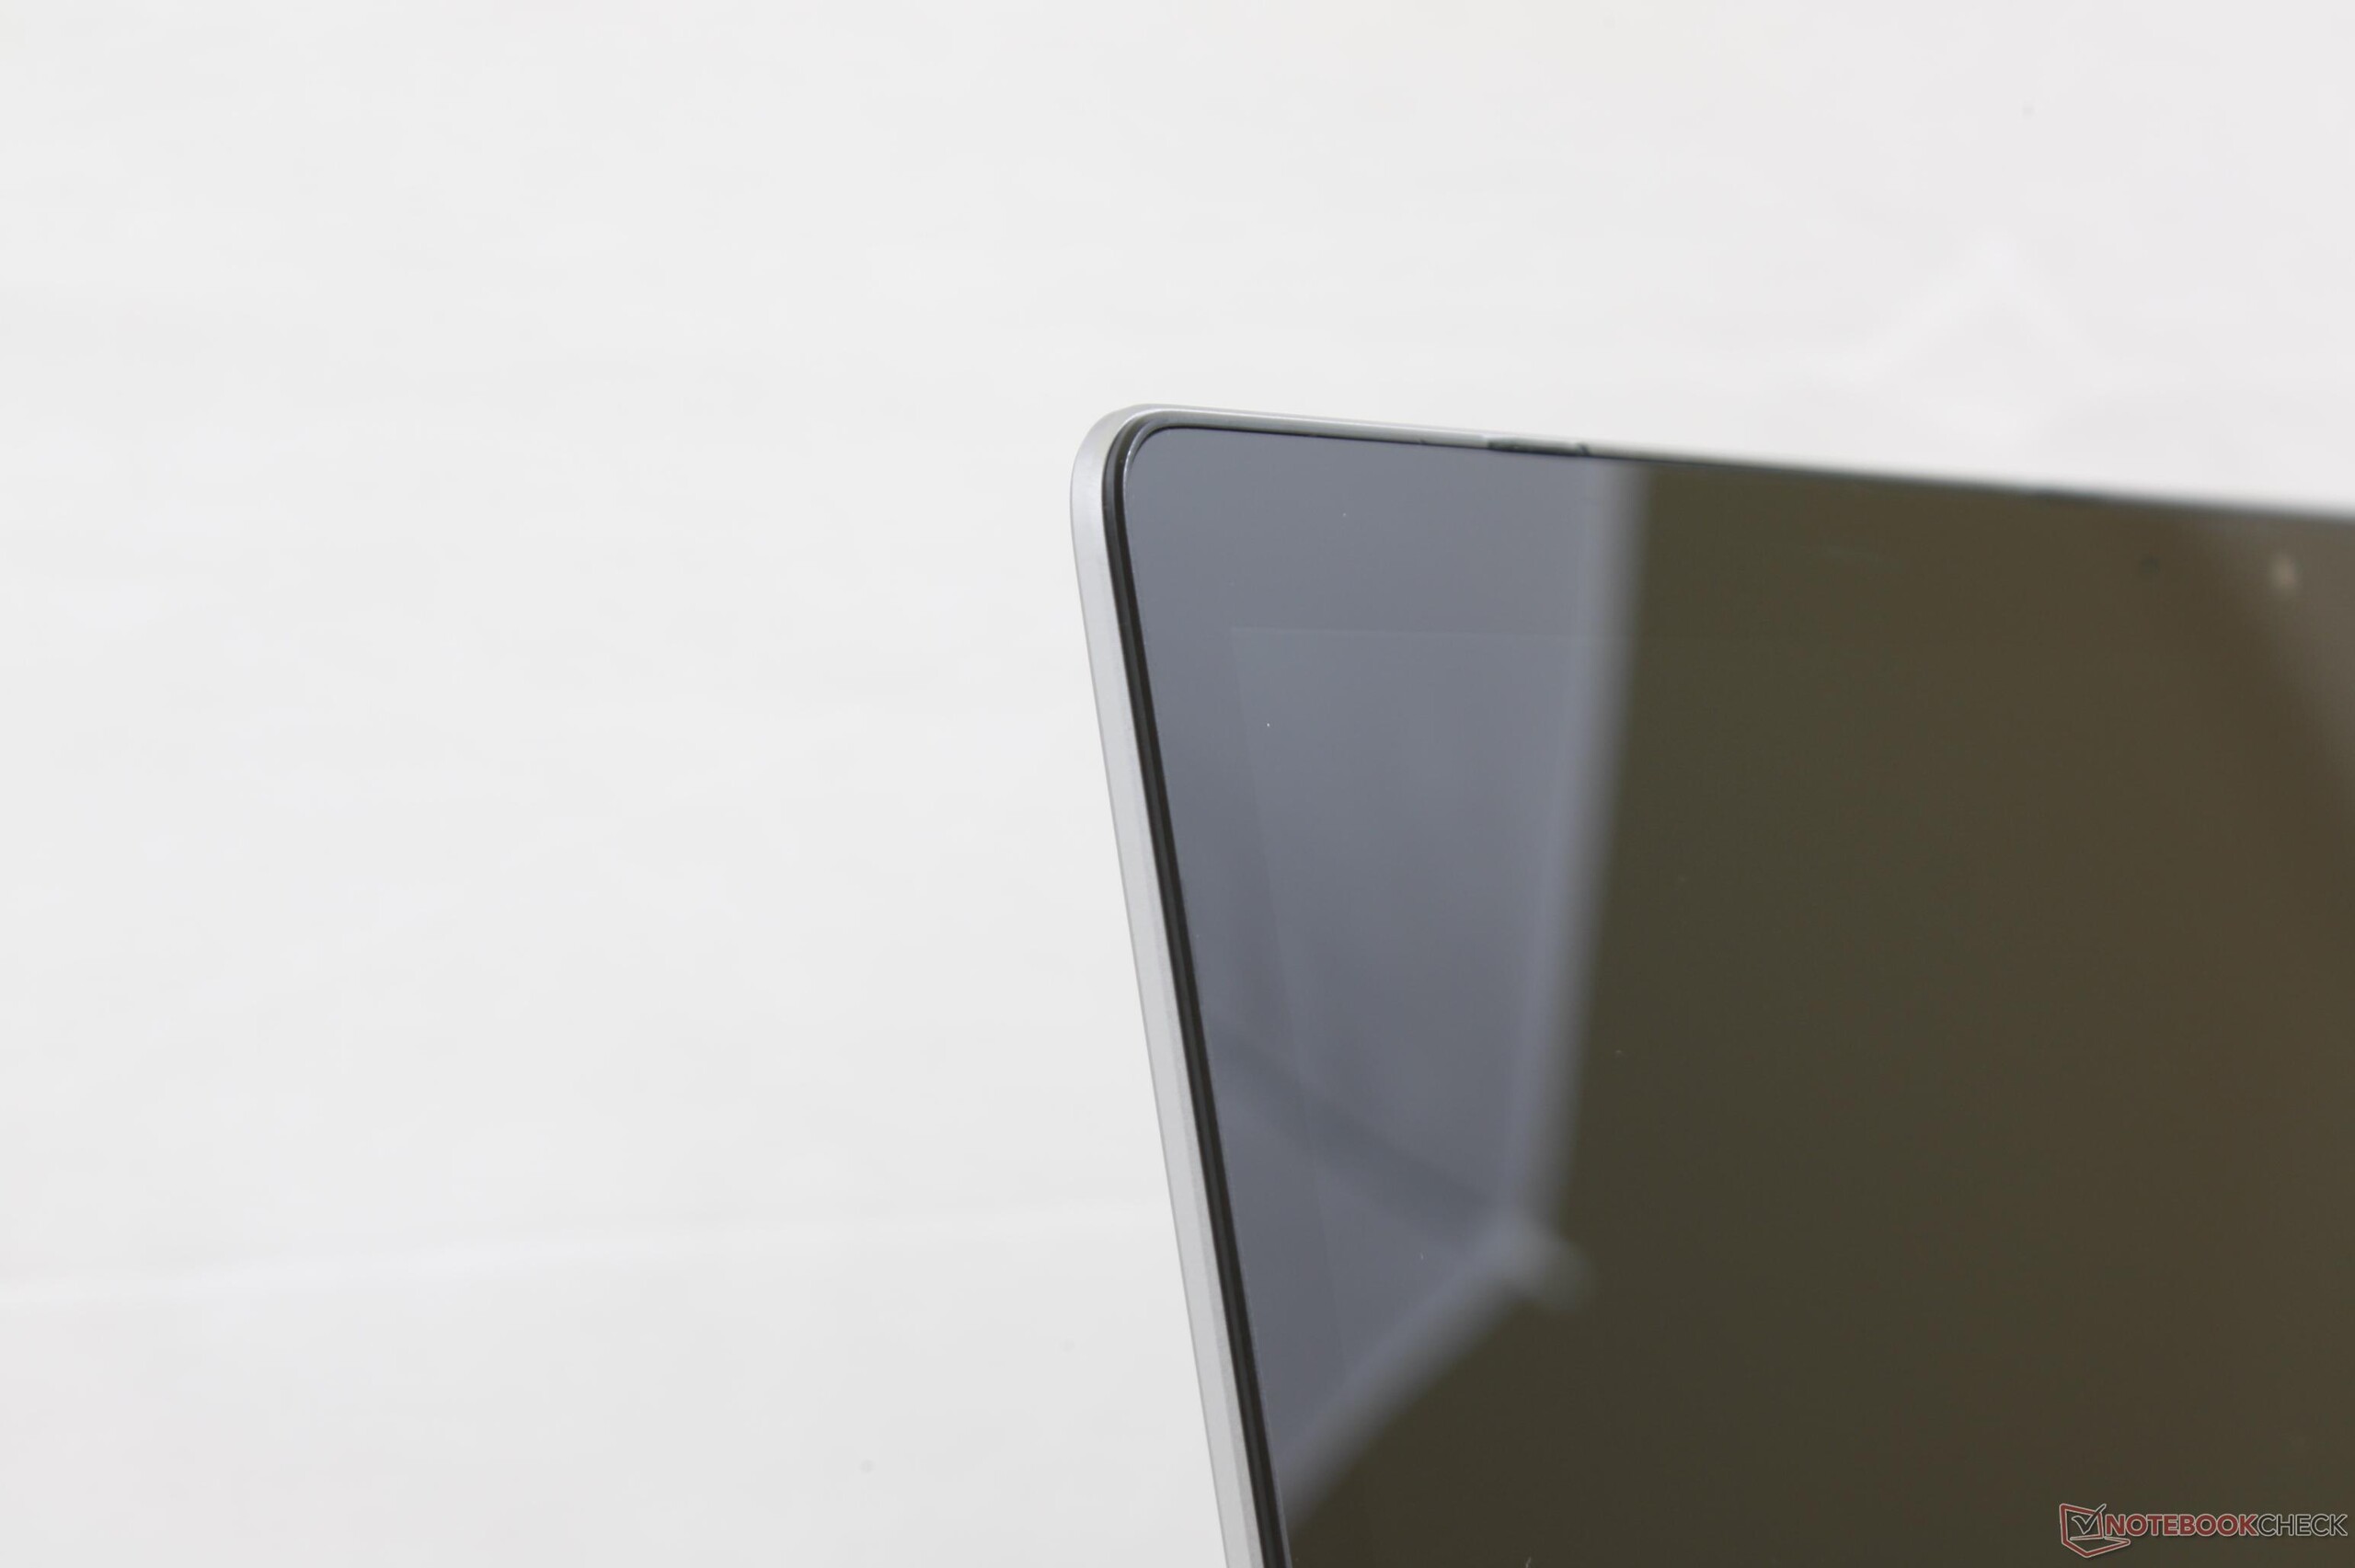
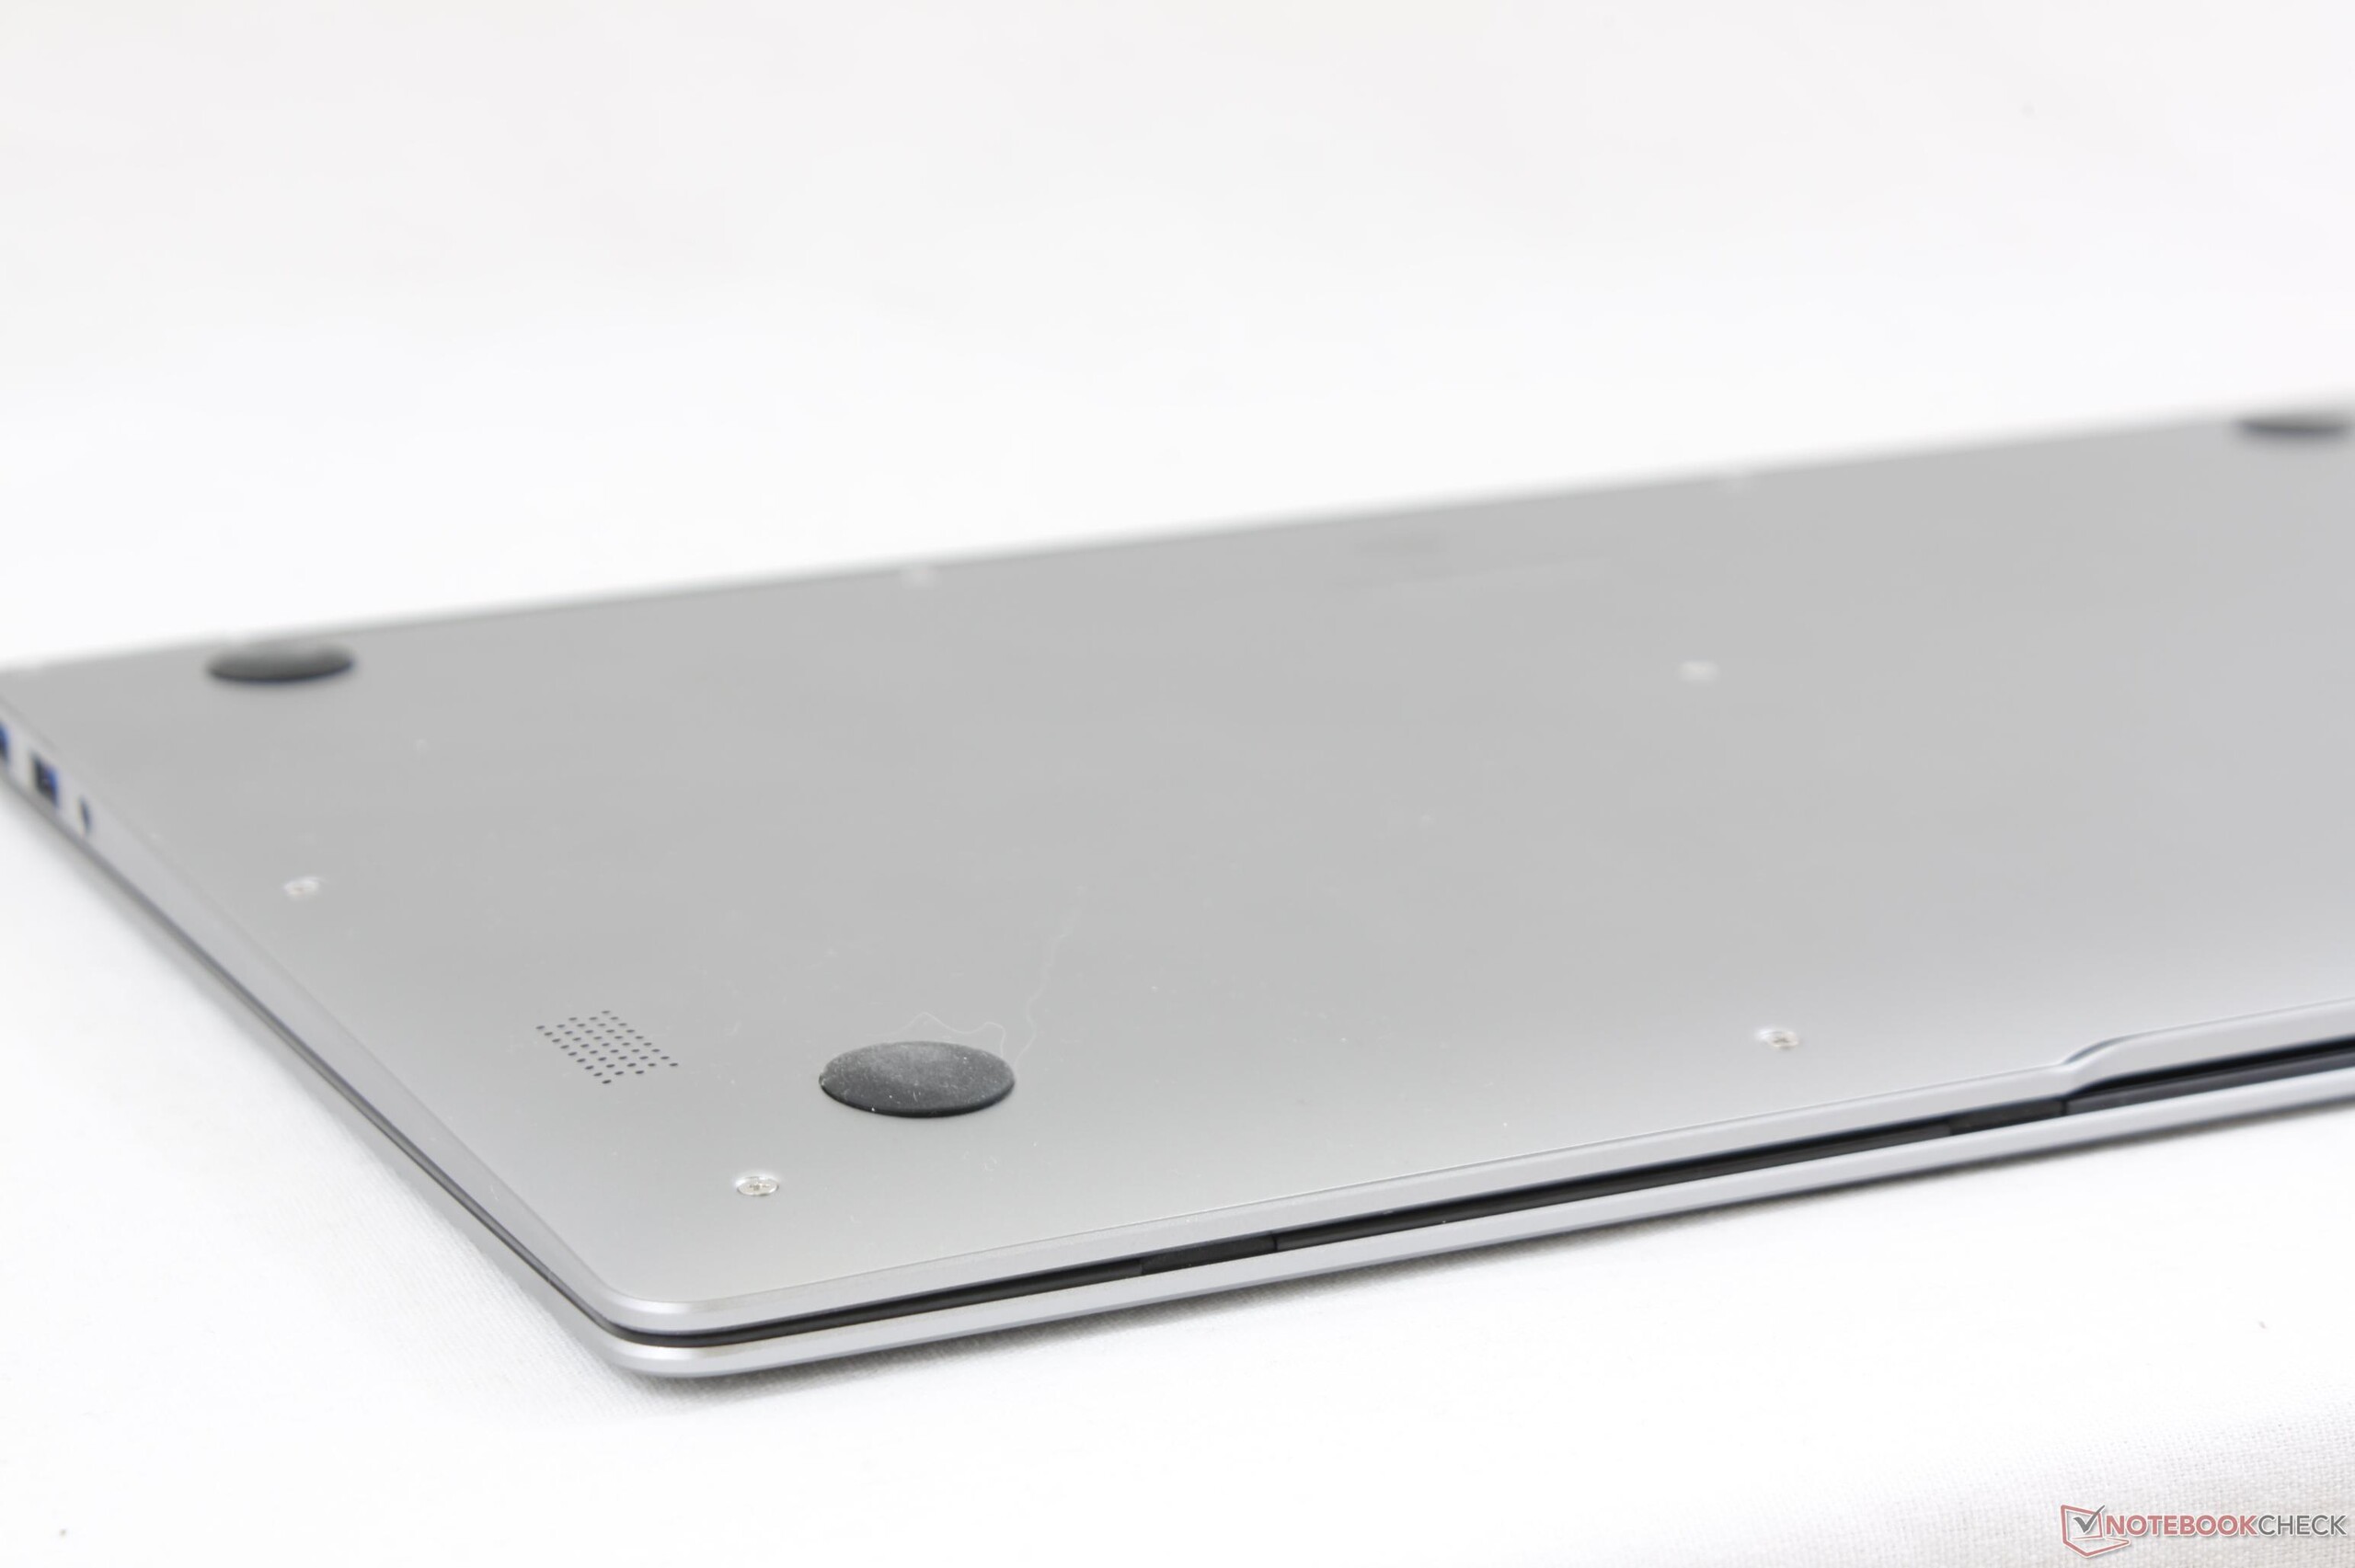
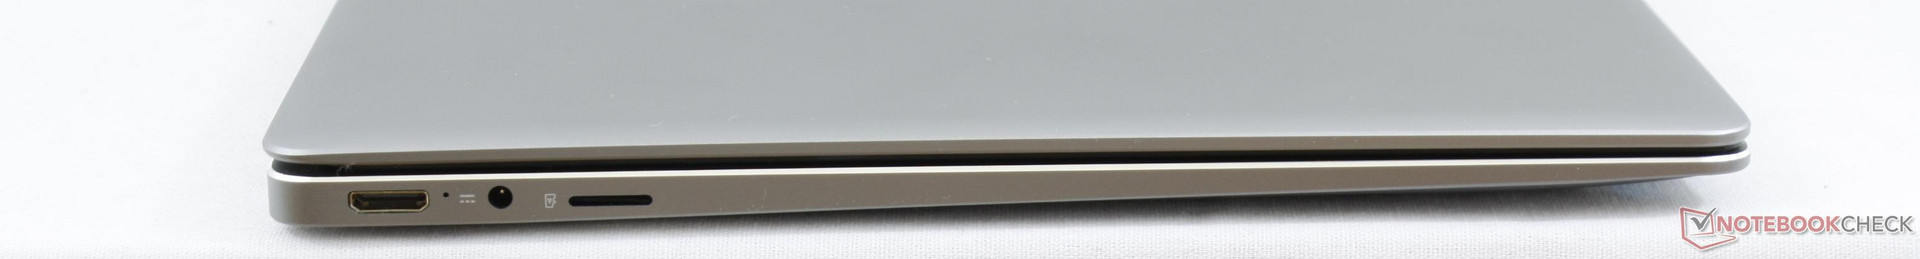
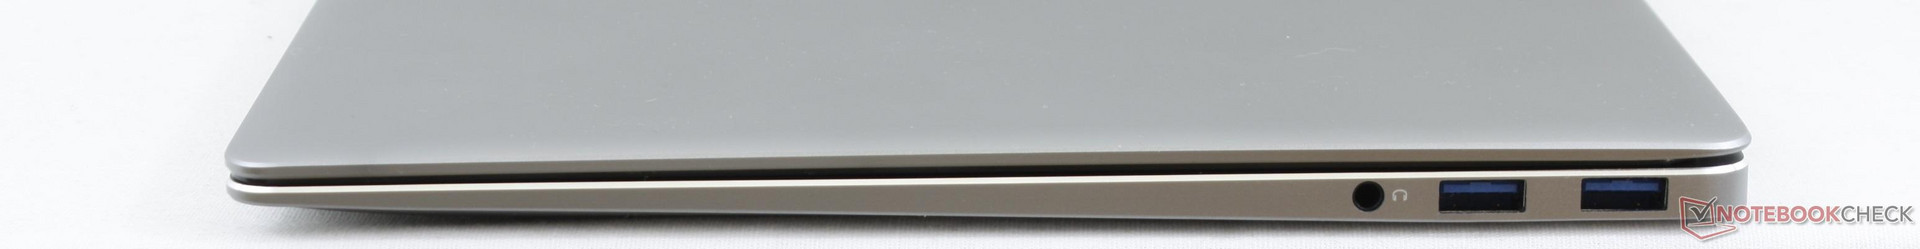
Para começar, a garantia de qualidade não está à altura das alternativas mais conhecidas. Nossa unidade de teste sofre de "bleeding" moderado da iluminação de fundo da tela, iluminação do teclado irregular, uma tecla Ctrl quebrada, uma porta USB defeituosa, falhas múltiplas e uma borda dobrada. Recomendamos que os novos proprietários testem cada porta e tecla para garantir que não haja nada danificado fisicamente. Em segundo lugar, o processador Celeron passivamente resfriado, o SSD primário e o carregador de CA são todos muito lentos. Os usuários que querem algo um pouco mais poderoso estariam melhor com um portátil ULV Haswell mais antigo que provavelmente terá teclas mais firmes e trackpads mais precisos. Se usado principalmente para streaming e reprodução de vídeos em movimento, no entanto, o LapBook Air não é ruim.
O LapBook deve ser útil para aqueles que planejam somente navegar na web, processamento de texto e transmissão de conteúdo de vídeo.
Chuwi LapBook 14 inch 2017
-
10/31/2017 v6(old)
Allen Ngo
Pricecompare
