 Deutsch
 English
 Español
 Français
 Italiano
 Nederlands
 Polski
 Português
 Русский
 Türkçe
 Svenska
 Chinese
 Magyar
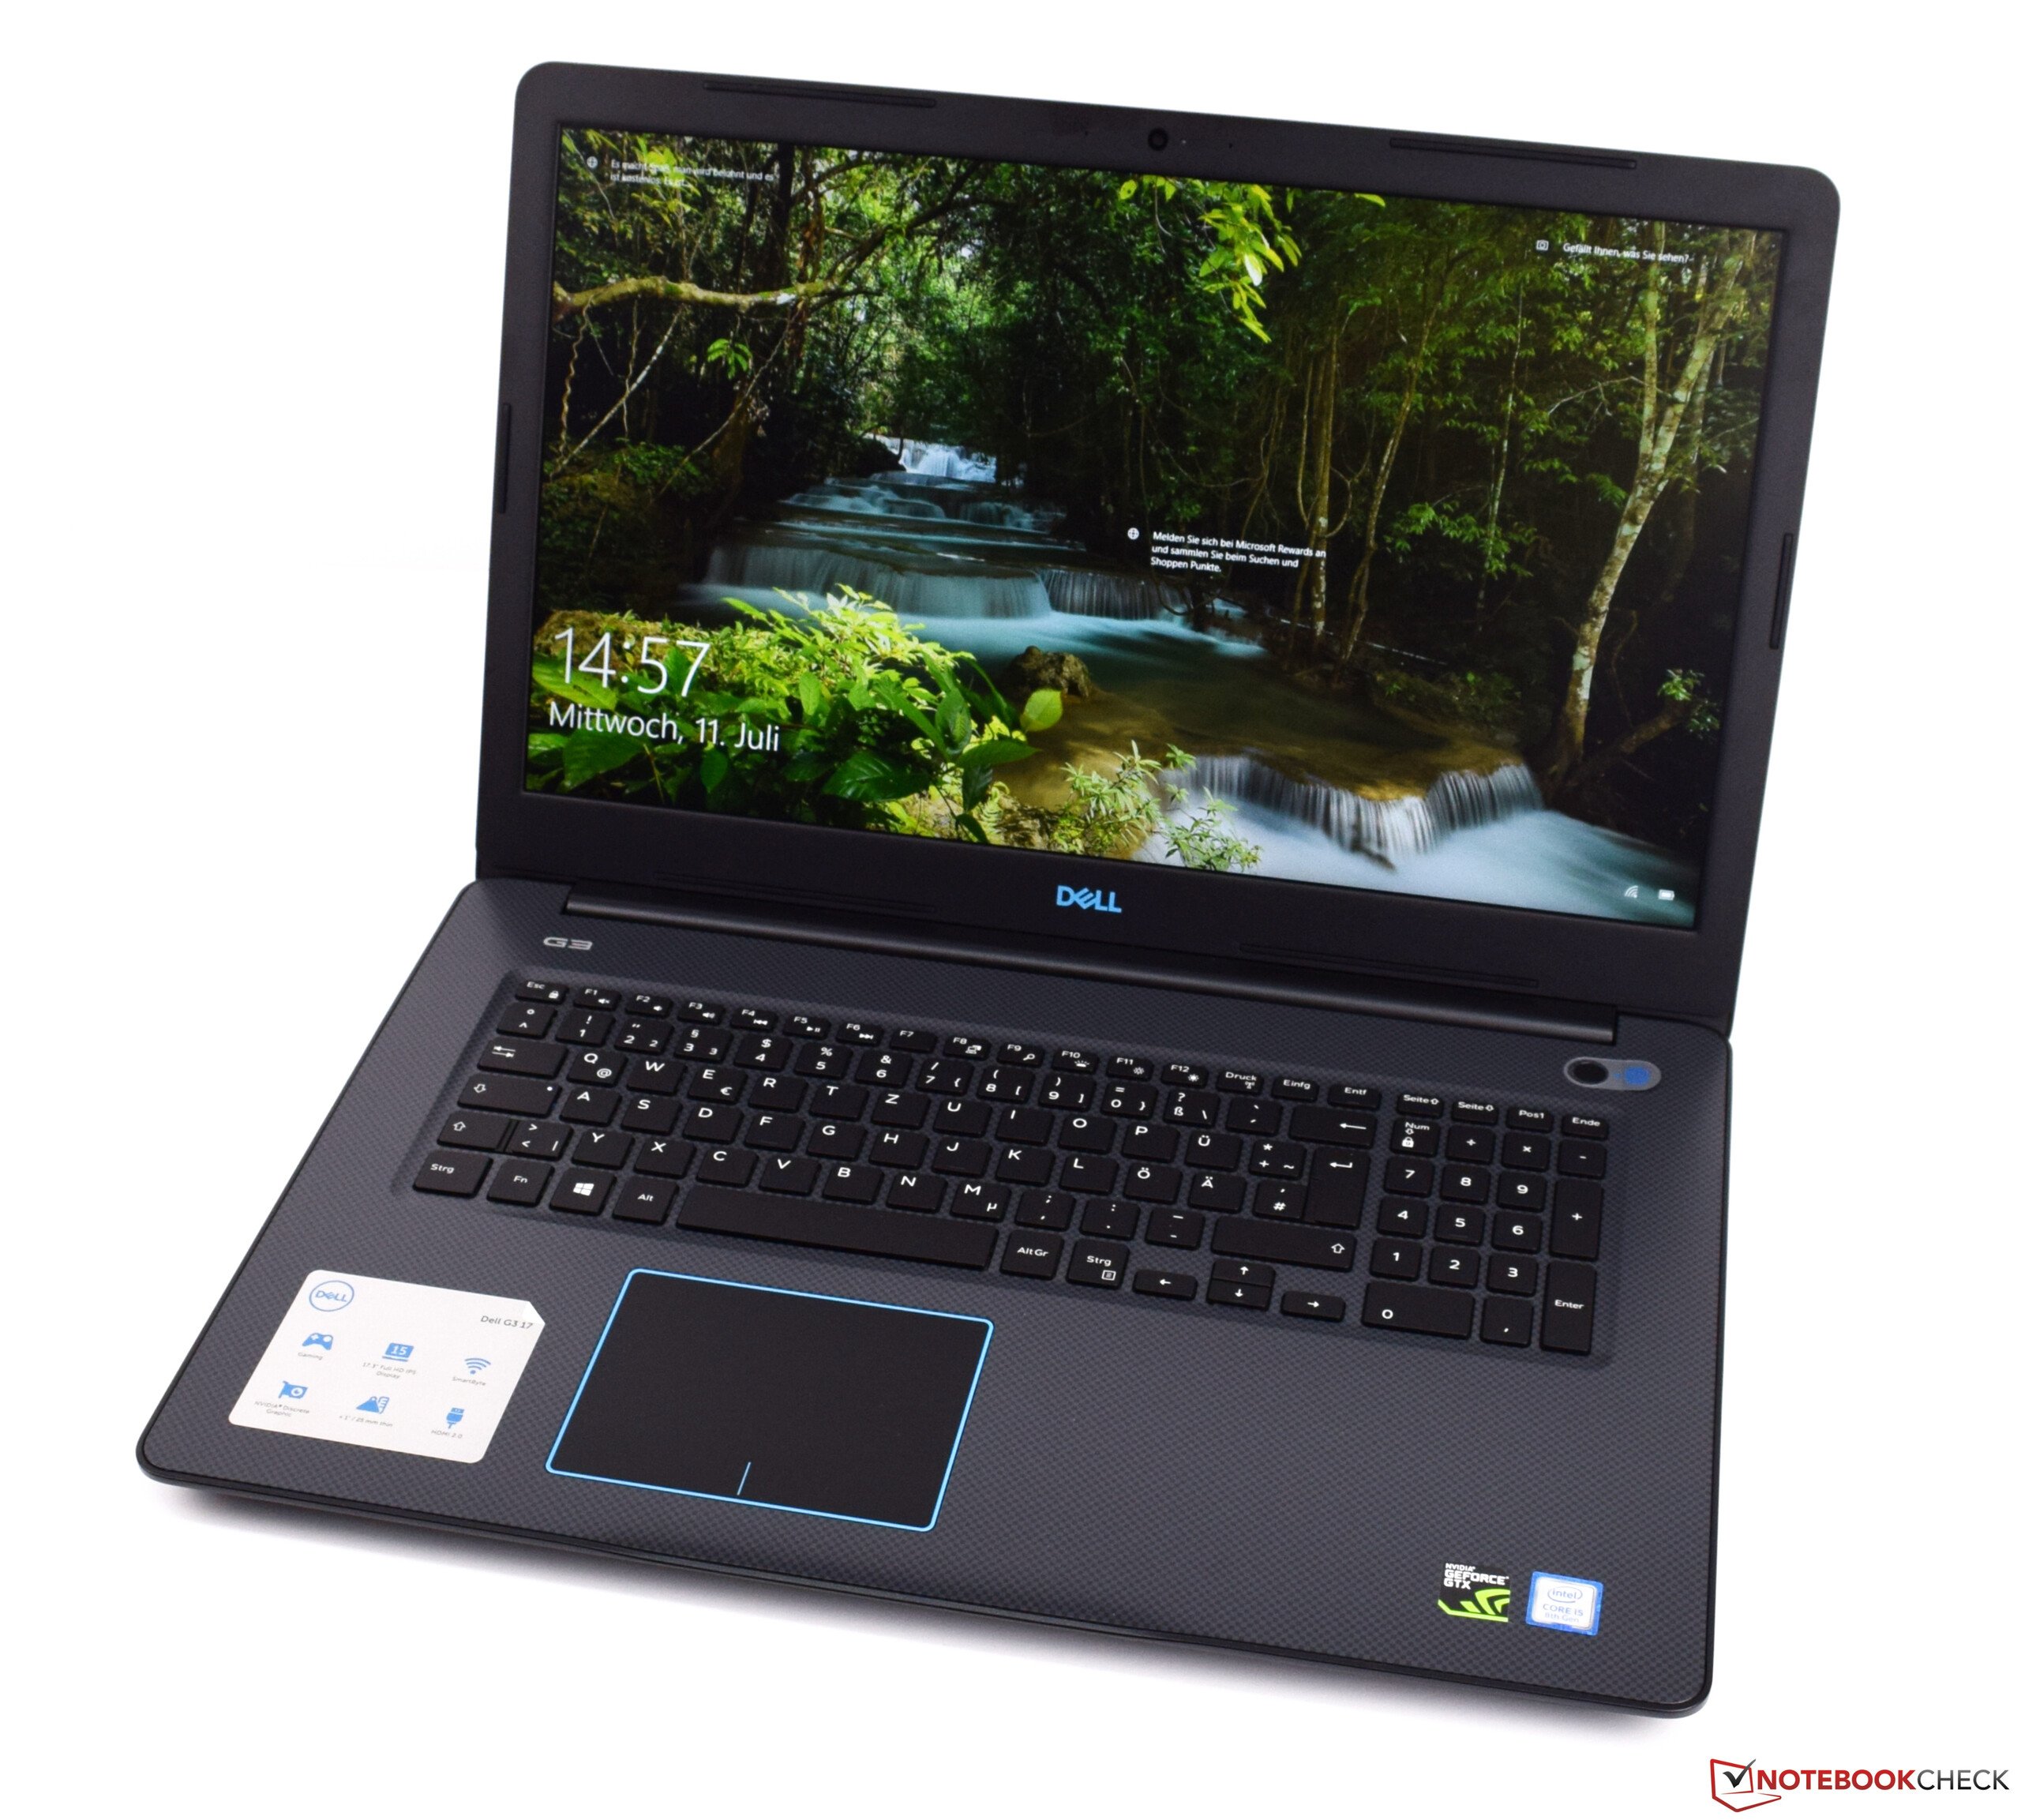
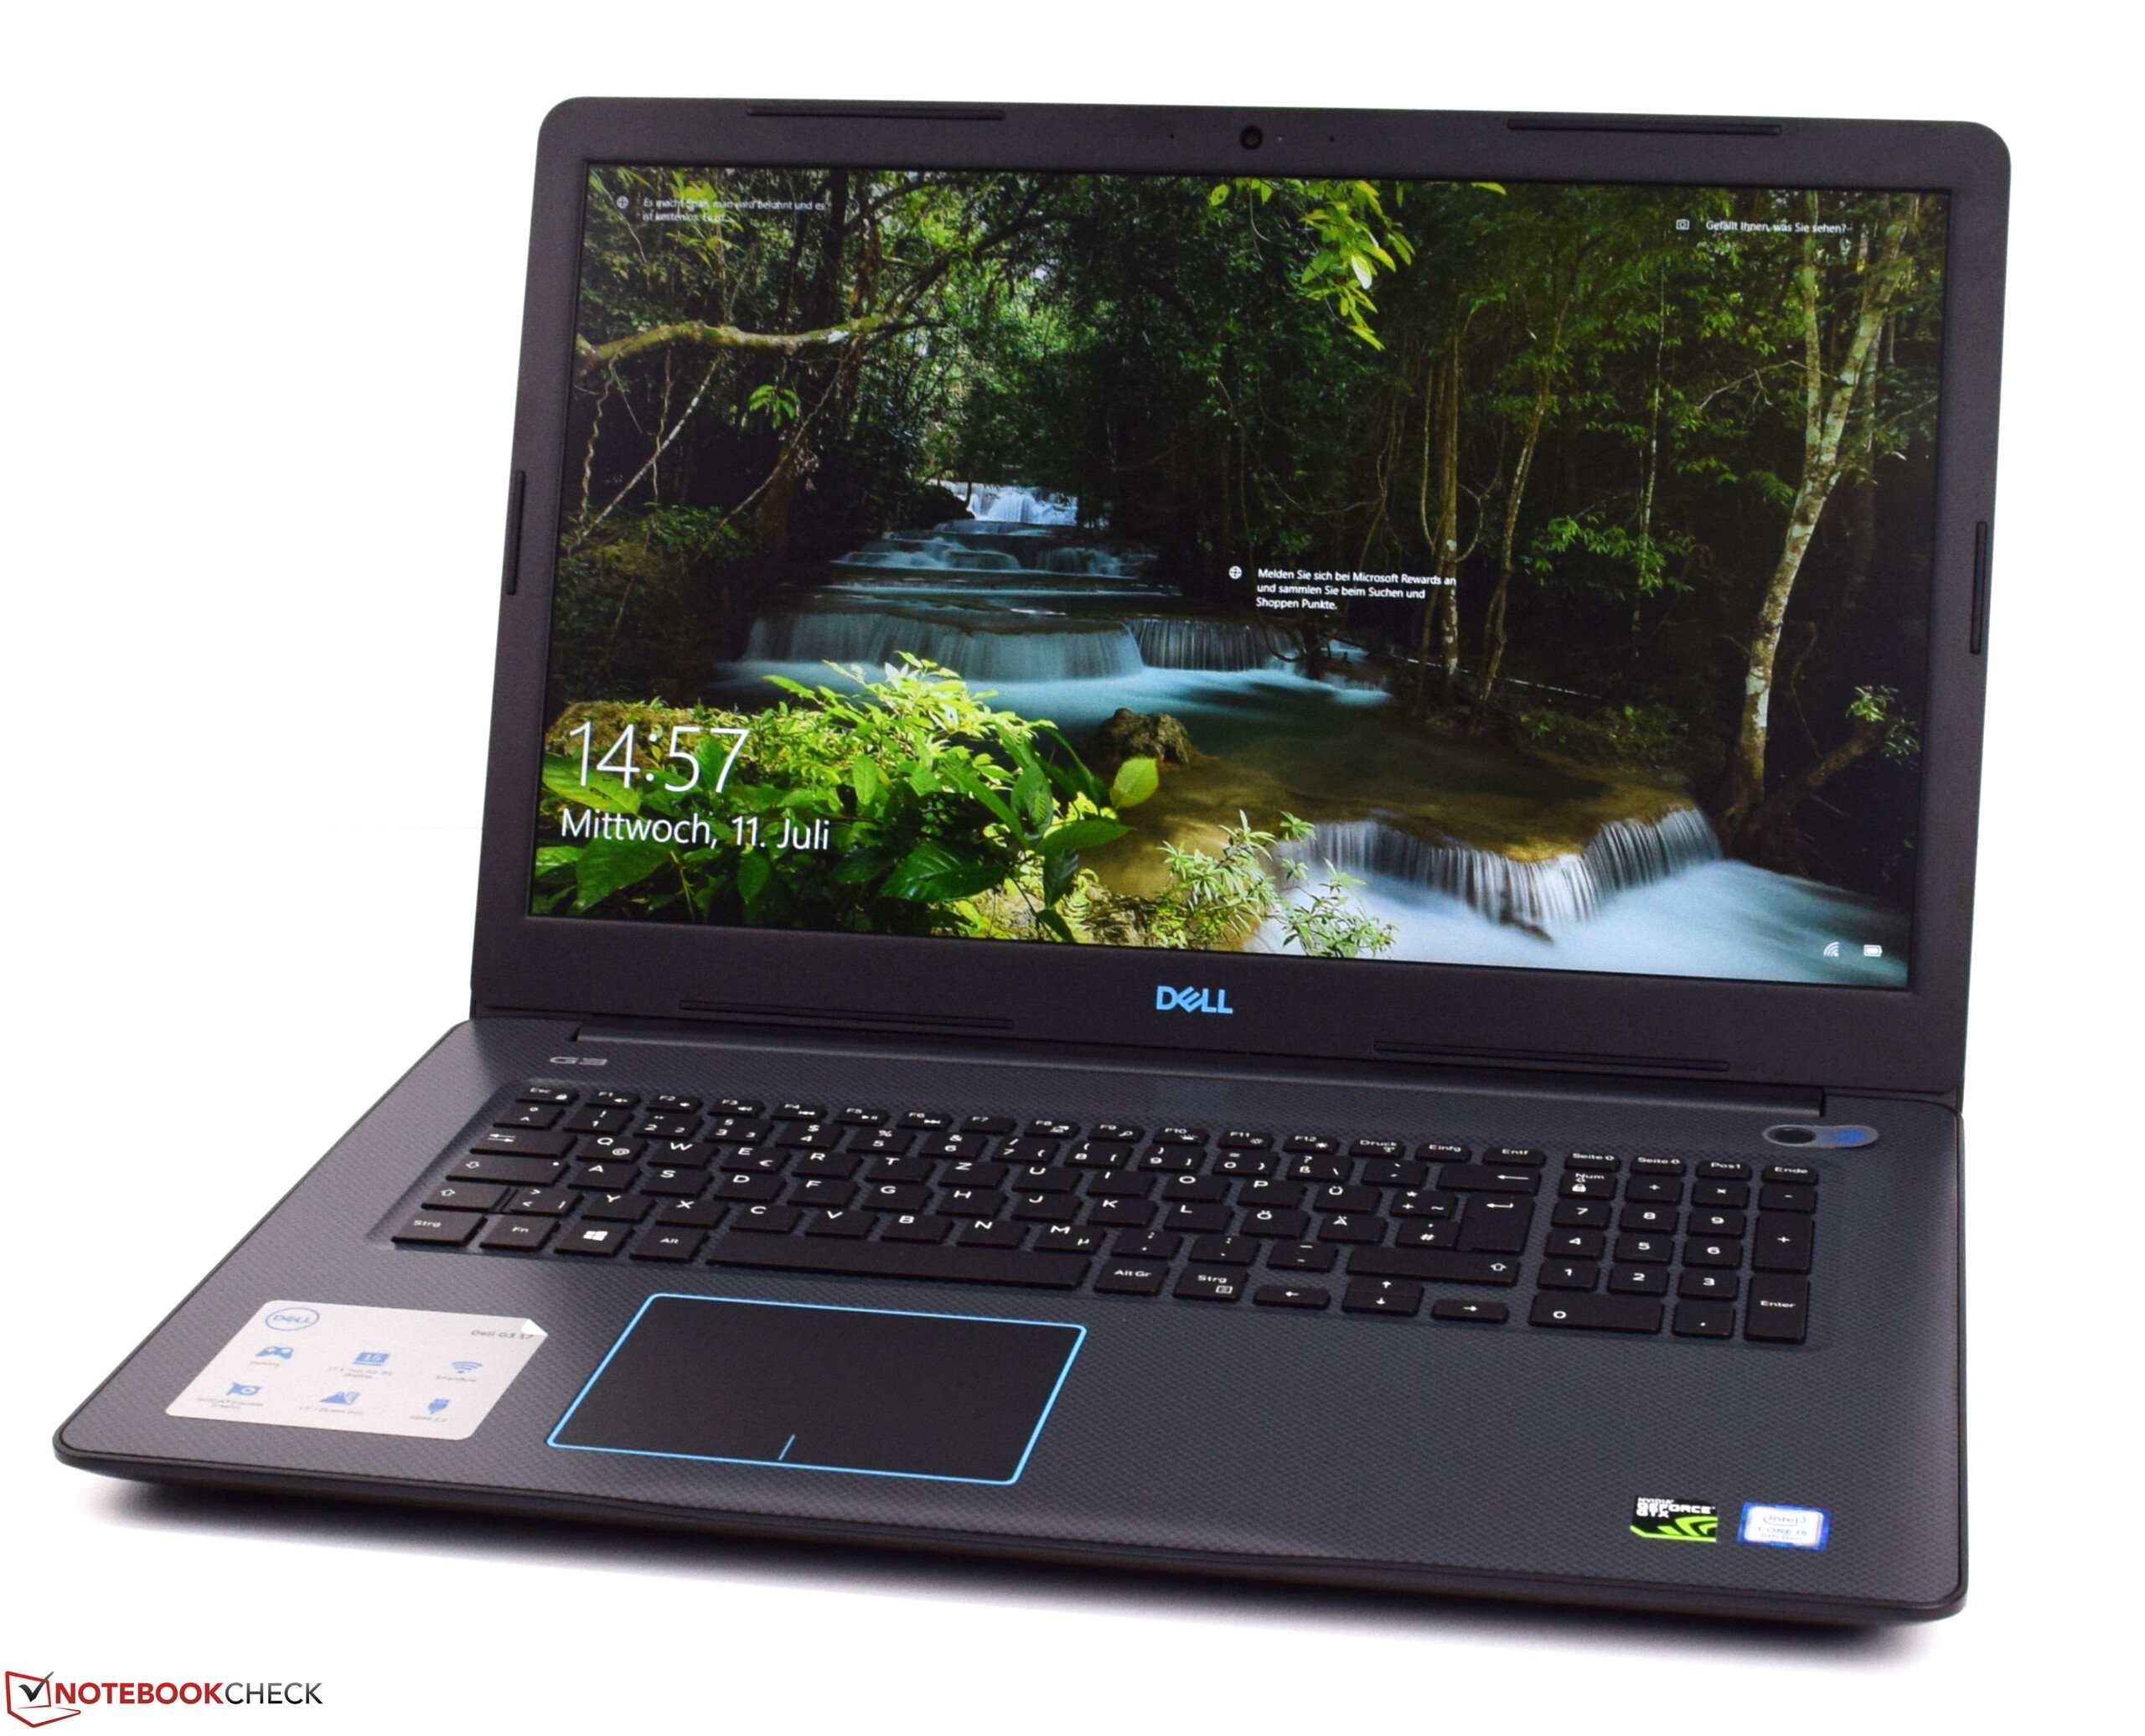
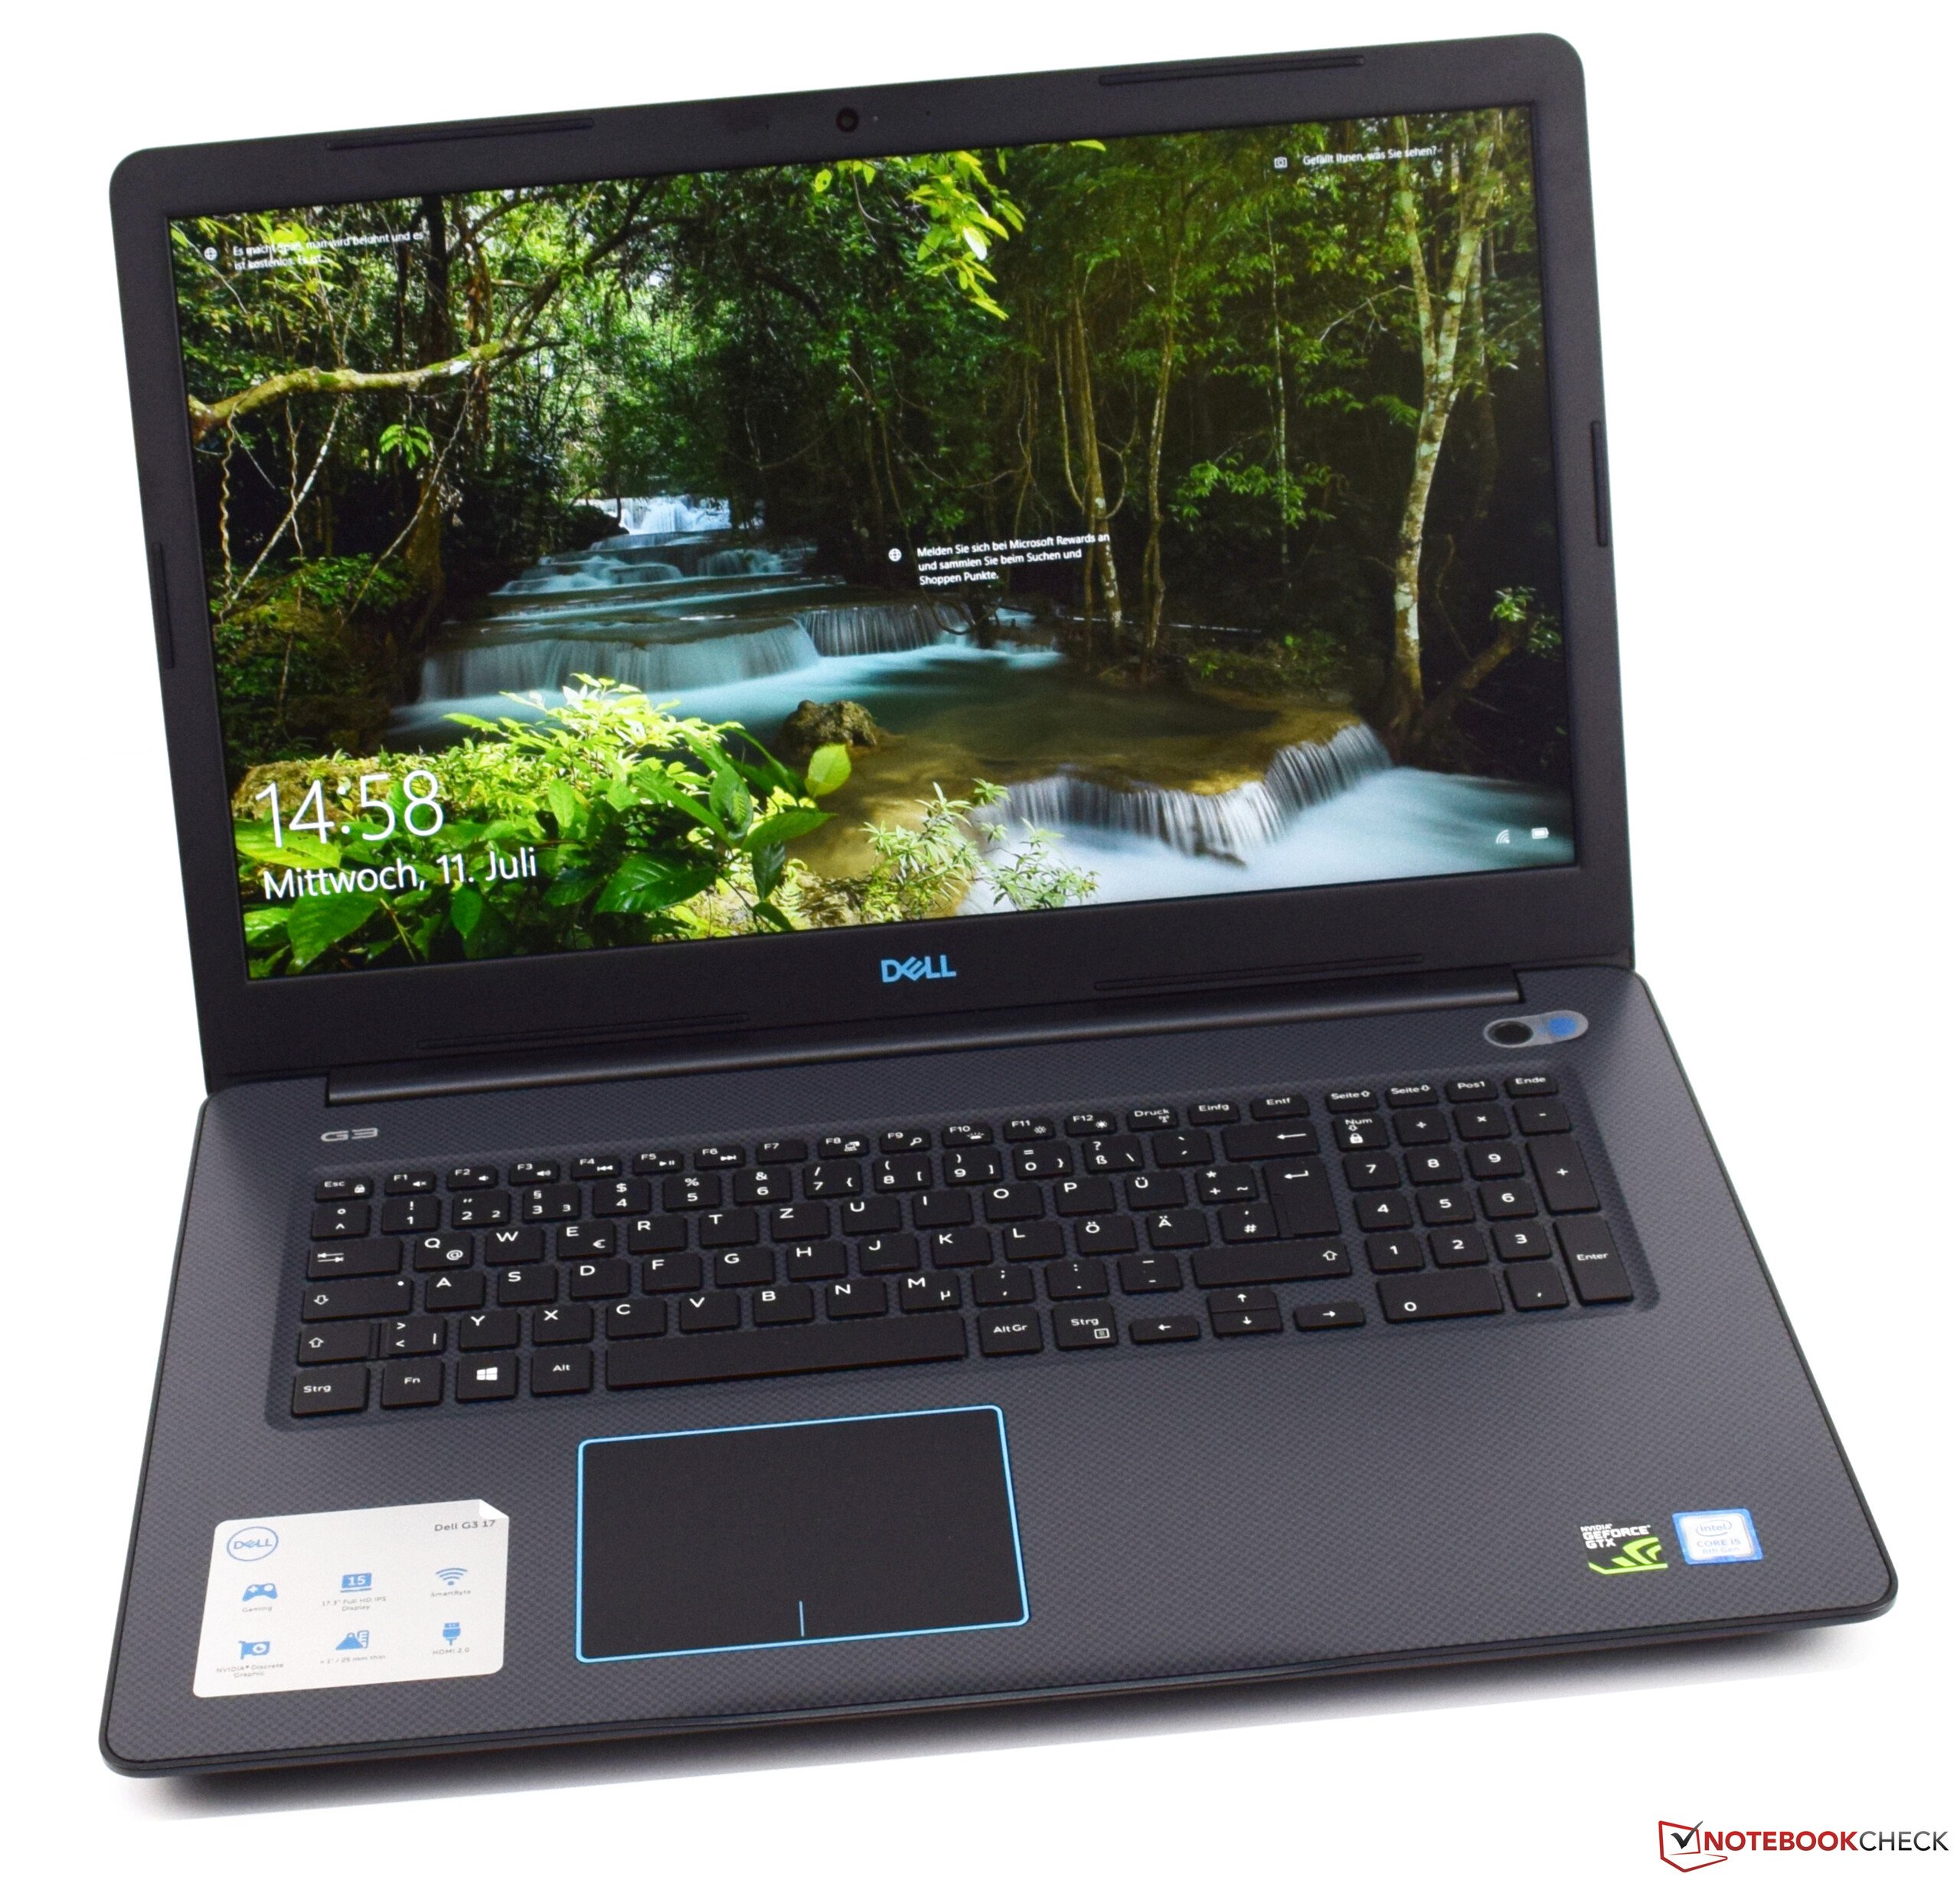
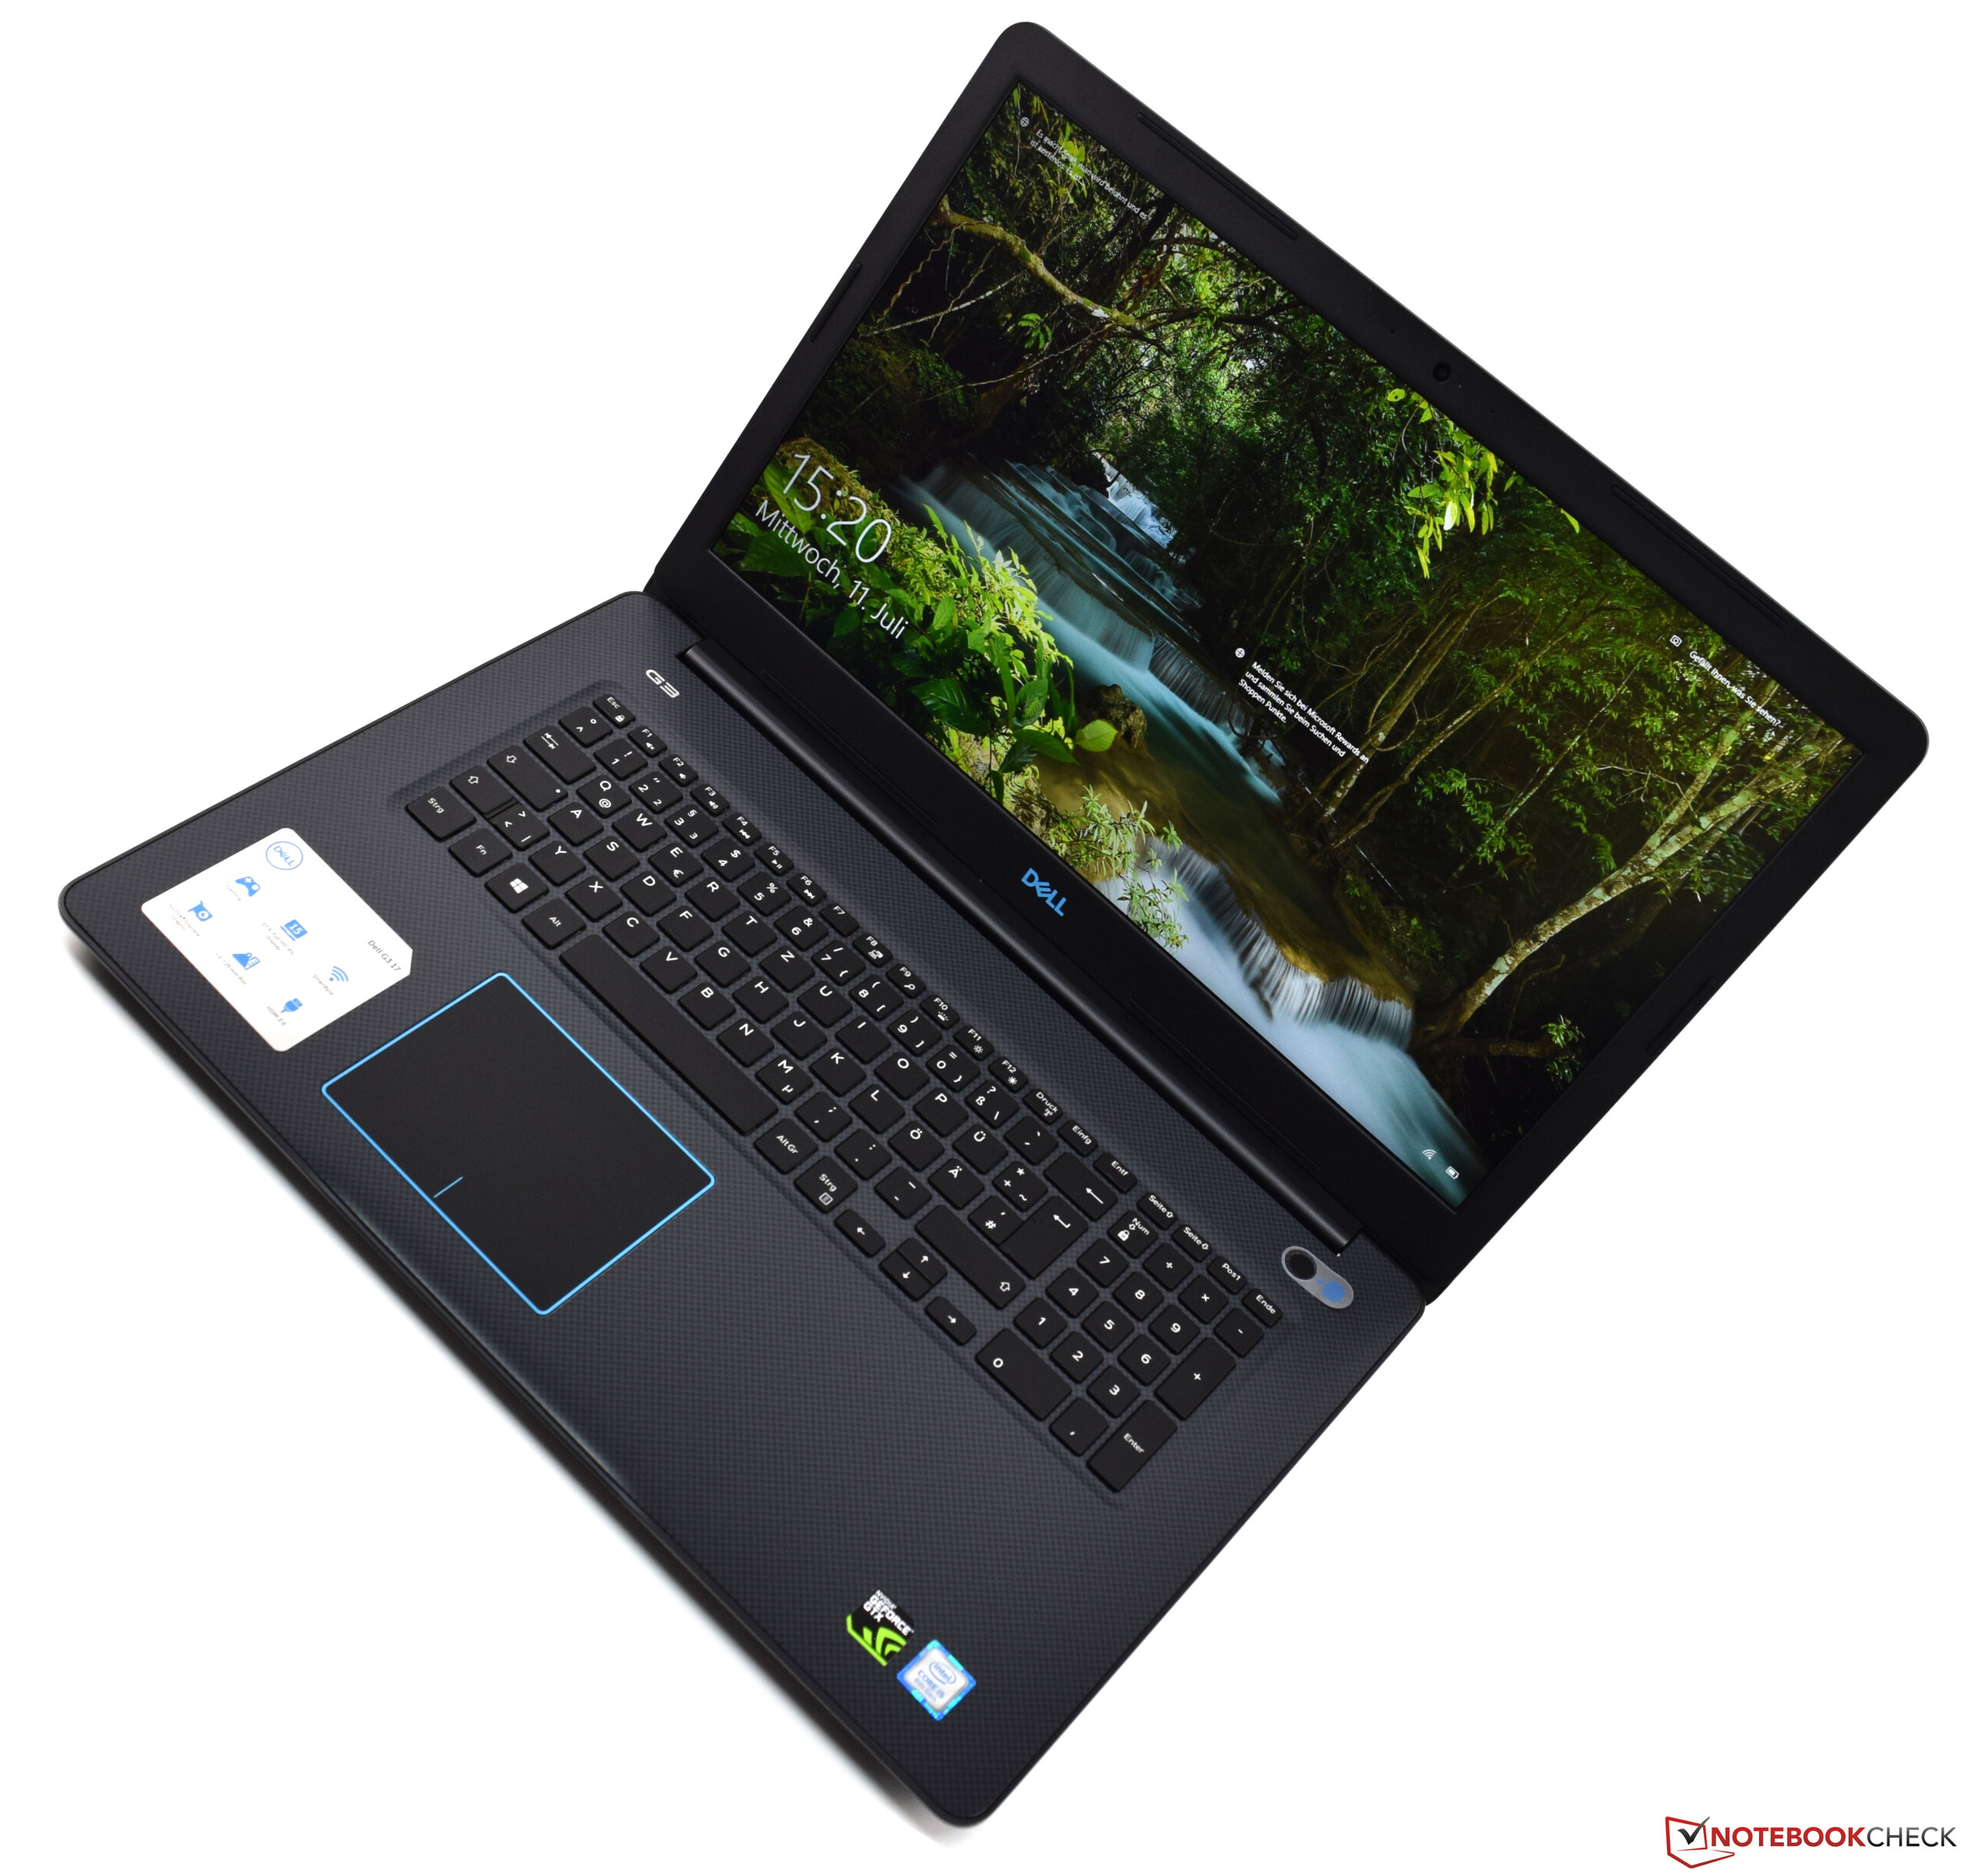
Breve Análise do Portátil Dell G3 17 3779 (i5-8300H, GTX 1050, SSD, IPS)
| SD Card Reader - average JPG Copy Test (av. of 3 runs) | |
| Average of class Gaming (19 - 202, n=100, last 2 years) | |
| Acer Predator Helios 300 PH317-52-51M6 (Toshiba Exceria Pro SDXC 64 GB UHS-II) | |
| Asus ROG Strix GL702ZC-GC204T (Toshiba Exceria Pro SDXC 64 GB UHS-II) | |
| Asus VivoBook Pro 17 N705UD-EH76 (Toshiba Exceria Pro SDXC 64 GB UHS-II) | |
| Dell G3 17 3779 (Toshiba Exceria Pro SDXC 64 GB UHS-II) | |
| Acer Aspire Nitro BE VN7-793G-5811 (Toshiba Exceria Pro SDXC 64 GB UHS-II) | |
| MSI GL72 7RDX-602 (Toshiba Exceria Pro SDXC 64 GB UHS-II) | |
| |||||||||||||||||||||||||
iluminação: 89 %
iluminação com acumulador: 323 cd/m²
Contraste: 1042:1 (Preto: 0.31 cd/m²)
ΔE Color 4.96 | 0.5-29.43 Ø5
ΔE Greyscale 5.65 | 0.57-98 Ø5.3
90% sRGB (Argyll 1.6.3 3D)
58% AdobeRGB 1998 (Argyll 1.6.3 3D)
64.9% AdobeRGB 1998 (Argyll 2.2.0 3D)
89.8% sRGB (Argyll 2.2.0 3D)
63.9% Display P3 (Argyll 2.2.0 3D)
Gamma: 2.24
| Dell G3 17 3779 AUO, B173HAN01.3, 1920x1080, 17.30 | Acer Predator Helios 300 PH317-52-51M6 LG Philips LP173WF4-SPF5 (LGD056D), 1920x1080, 17.30 | Asus ROG Strix GL702ZC-GC204T LG Philips LP173WF4-SPF5, 1920x1080, 17.30 | MSI GL72 7RDX-602 Chi Mei CMN1735 N173HGE-E11, 1920x1080, 17.30 | Acer Aspire Nitro BE VN7-793G-5811 AU Optronics, 1920x1080, 17.30 | Asus VivoBook Pro 17 N705UD-EH76 LP173WF4-SPF5, 1920x1080, 17.30 | |
|---|---|---|---|---|---|---|
| Display | -1% | -4% | 3% | -2% | 0% | |
| Display P3 Coverage | 63.9 | 67.1 5% | 65.4 2% | 65.2 2% | 63.1 -1% | 67.9 6% |
| sRGB Coverage | 89.8 | 86.1 -4% | 82.6 -8% | 94.3 5% | 86.5 -4% | 86.8 -3% |
| AdobeRGB 1998 Coverage | 64.9 | 63 -3% | 60.4 -7% | 65.6 1% | 63.3 -2% | 63.5 -2% |
| Response Times | 10% | 9% | 12% | -2% | 15% | |
| Response Time Grey 50% / Grey 80% * | 38 ? | 36 ? 5% | 36 ? 5% | 29 ? 24% | 38 ? -0% | 30.8 ? 19% |
| Response Time Black / White * | 26 ? | 22 ? 15% | 23 ? 12% | 26 ? -0% | 27 ? -4% | 23.2 ? 11% |
| PWM Frequency | 122000 ? | 961 | 119000 ? | |||
| Screen | -9% | -1% | -42% | 2% | -1% | |
| Brightness middle | 323 | 365 13% | 415 28% | 299 -7% | 301 -7% | 376.2 16% |
| Brightness | 306 | 341 11% | 365 19% | 274 -10% | 270 -12% | 355 16% |
| Brightness Distribution | 89 | 89 0% | 82 -8% | 80 -10% | 79 -11% | 89 0% |
| Black Level * | 0.31 | 0.32 -3% | 0.42 -35% | 0.25 19% | 0.38 -23% | 0.42 -35% |
| Contrast | 1042 | 1141 10% | 988 -5% | 1196 15% | 792 -24% | 896 -14% |
| Colorchecker dE 2000 * | 4.96 | 6.51 -31% | 4.95 -0% | 12.92 -160% | 3.49 30% | 4.21 15% |
| Colorchecker dE 2000 max. * | 8.25 | 12.32 -49% | 9.34 -13% | 19.91 -141% | 7.49 9% | 8.31 -1% |
| Greyscale dE 2000 * | 5.65 | 7.65 -35% | 4.69 17% | 13.16 -133% | 1.88 67% | 5.5 3% |
| Gamma | 2.24 98% | 2.64 83% | 2.33 94% | 2.36 93% | 2.35 94% | 2.335 94% |
| CCT | 7441 87% | 8066 81% | 6485 100% | 15046 43% | 6587 99% | 7056 92% |
| Color Space (Percent of AdobeRGB 1998) | 58 | 56 -3% | 54 -7% | 60 3% | 56 -3% | 57 -2% |
| Color Space (Percent of sRGB) | 90 | 86 -4% | 82 -9% | 94 4% | 86 -4% | 87 -3% |
| Colorchecker dE 2000 calibrated * | 2.9 | 3.95 | ||||
| Total Average (Program / Settings) | 0% /
-5% | 1% /
-1% | -9% /
-26% | -1% /
1% | 5% /
2% |
* ... smaller is better
Display Response Times
| ↔ Response Time Black to White | ||
|---|---|---|
| 26 ms ... rise ↗ and fall ↘ combined | ↗ 15 ms rise | 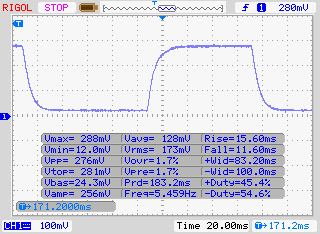 |
| ↘ 11 ms fall | ||
| The screen shows relatively slow response rates in our tests and may be too slow for gamers. In comparison, all tested devices range from 0.1 (minimum) to 240 (maximum) ms. » 57 % of all devices are better. This means that the measured response time is worse than the average of all tested devices (21.5 ms). | ||
| ↔ Response Time 50% Grey to 80% Grey | ||
| 38 ms ... rise ↗ and fall ↘ combined | ↗ 18 ms rise | 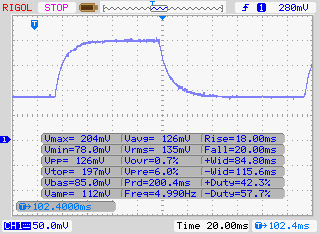 |
| ↘ 20 ms fall | ||
| The screen shows slow response rates in our tests and will be unsatisfactory for gamers. In comparison, all tested devices range from 0.2 (minimum) to 636 (maximum) ms. » 49 % of all devices are better. This means that the measured response time is worse than the average of all tested devices (33.7 ms). | ||
Screen Flickering / PWM (Pulse-Width Modulation)
| Screen flickering / PWM not detected | 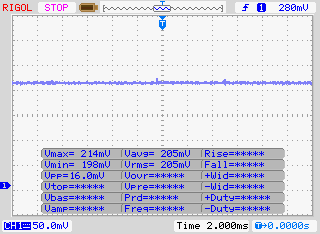 | ||
In comparison: 53 % of all tested devices do not use PWM to dim the display. If PWM was detected, an average of 17900 (minimum: 5 - maximum: 3846000) Hz was measured. | |||

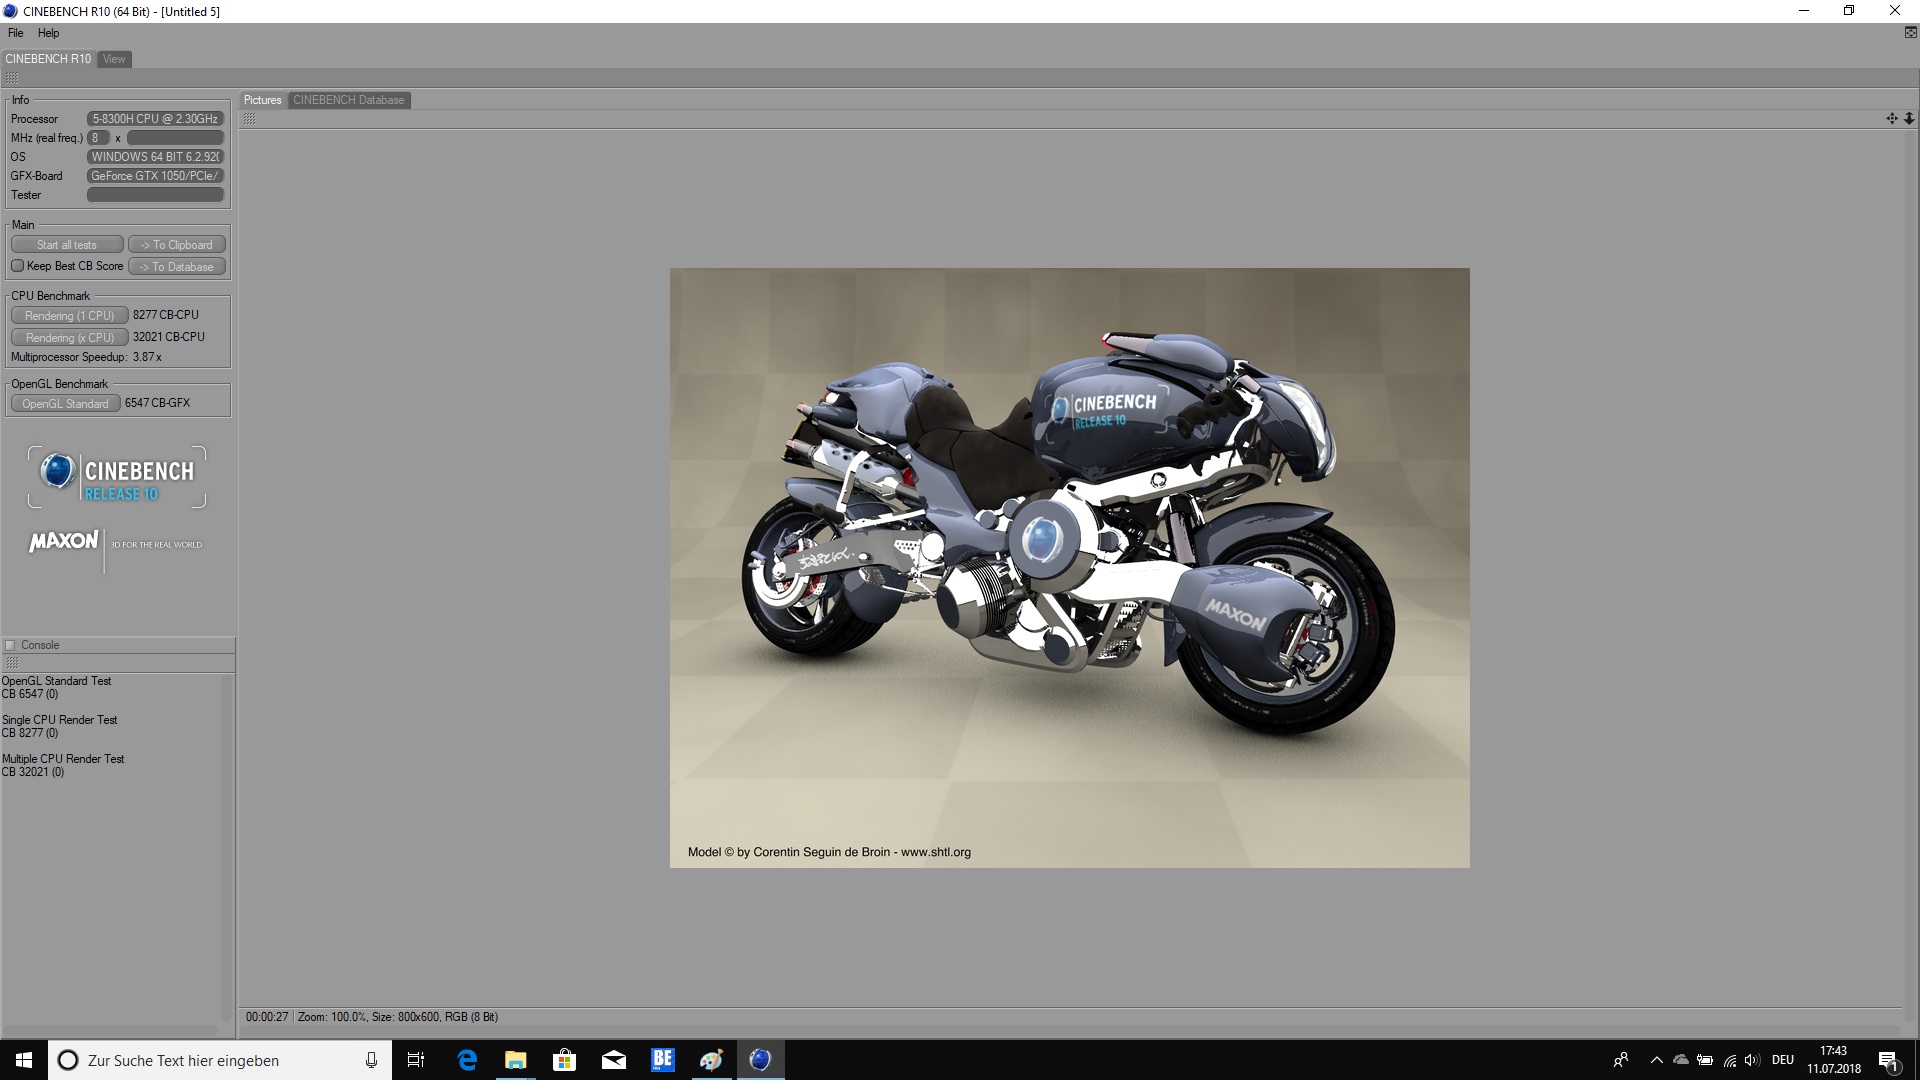
| Cinebench R10 | |
| Rendering Single CPUs 64Bit | |
| Average of class Gaming (11095 - 17400, n=8, last 2 years) | |
| Average Intel Core i5-8300H (8277 - 8506, n=2) | |
| Dell G3 17 3779 | |
| Rendering Multiple CPUs 64Bit | |
| Average of class Gaming (57574 - 125983, n=8, last 2 years) | |
| Dell G3 17 3779 | |
| Average Intel Core i5-8300H (28616 - 32021, n=2) | |
* ... smaller is better
| PCMark 8 Home Score Accelerated v2 | 3886 pontos | |
| PCMark 8 Creative Score Accelerated v2 | 4704 pontos | |
| PCMark 8 Work Score Accelerated v2 | 5218 pontos | |
| PCMark 10 Score | 4442 pontos | |
Ajuda | ||
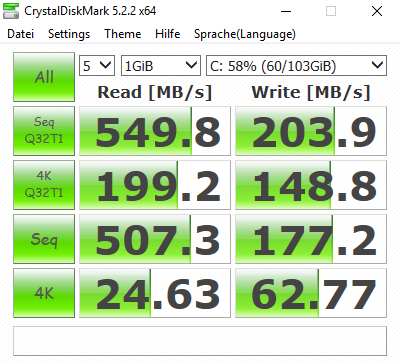
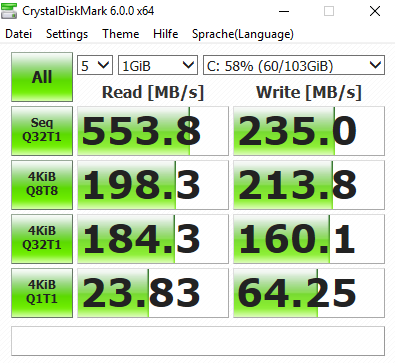
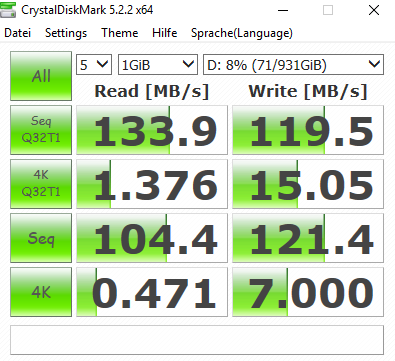
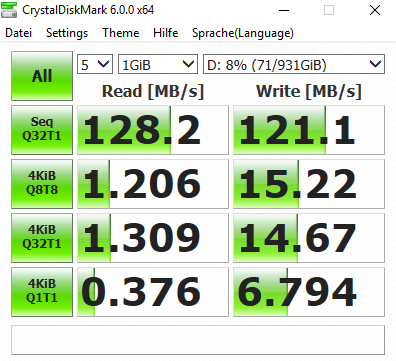
| Dell G3 17 3779 SK hynix SC311 SATA | Asus ROG Strix GL702ZC-GC204T Seagate Mobile HDD 1TB ST1000LX015-1U7172 | MSI GL72 7RDX-602 HGST Travelstar 7K1000 HTS721010A9E630 | Acer Aspire Nitro BE VN7-793G-5811 Seagate Mobile HDD 1TB ST1000LM035 | Average SK hynix SC311 SATA | |
|---|---|---|---|---|---|
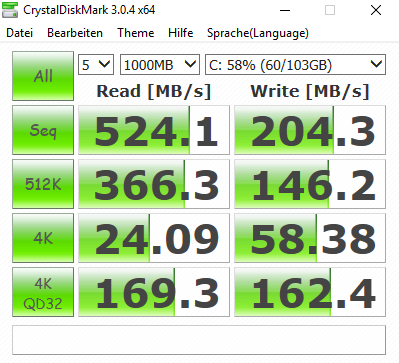
| CrystalDiskMark 3.0 | -81% | -82% | -80% | 27% | |
| Read Seq | 524 | 92.5 -82% | 135.3 -74% | 117.6 -78% | 507 ? -3% |
| Write Seq | 204.3 | 105.1 -49% | 127 -38% | 109.1 -47% | 372 ? 82% |
| Read 512 | 366.3 | 37.67 -90% | 45.57 -88% | 39.93 -89% | 367 ? 0% |
| Write 512 | 146.2 | 101.8 -30% | 58.3 -60% | 98.6 -33% | 282 ? 93% |
| Read 4k | 24.09 | 0.484 -98% | 0.582 -98% | 0.435 -98% | 22.9 ? -5% |
| Write 4k | 58.4 | 0.169 -100% | 1.022 -98% | 3.152 -95% | 50.3 ? -14% |
| Read 4k QD32 | 169.3 | 1.294 -99% | 1.068 -99% | 1.008 -99% | 208 ? 23% |
| Write 4k QD32 | 162.4 | 0.221 -100% | 1.102 -99% | 4.705 -97% | 231 ? 42% |

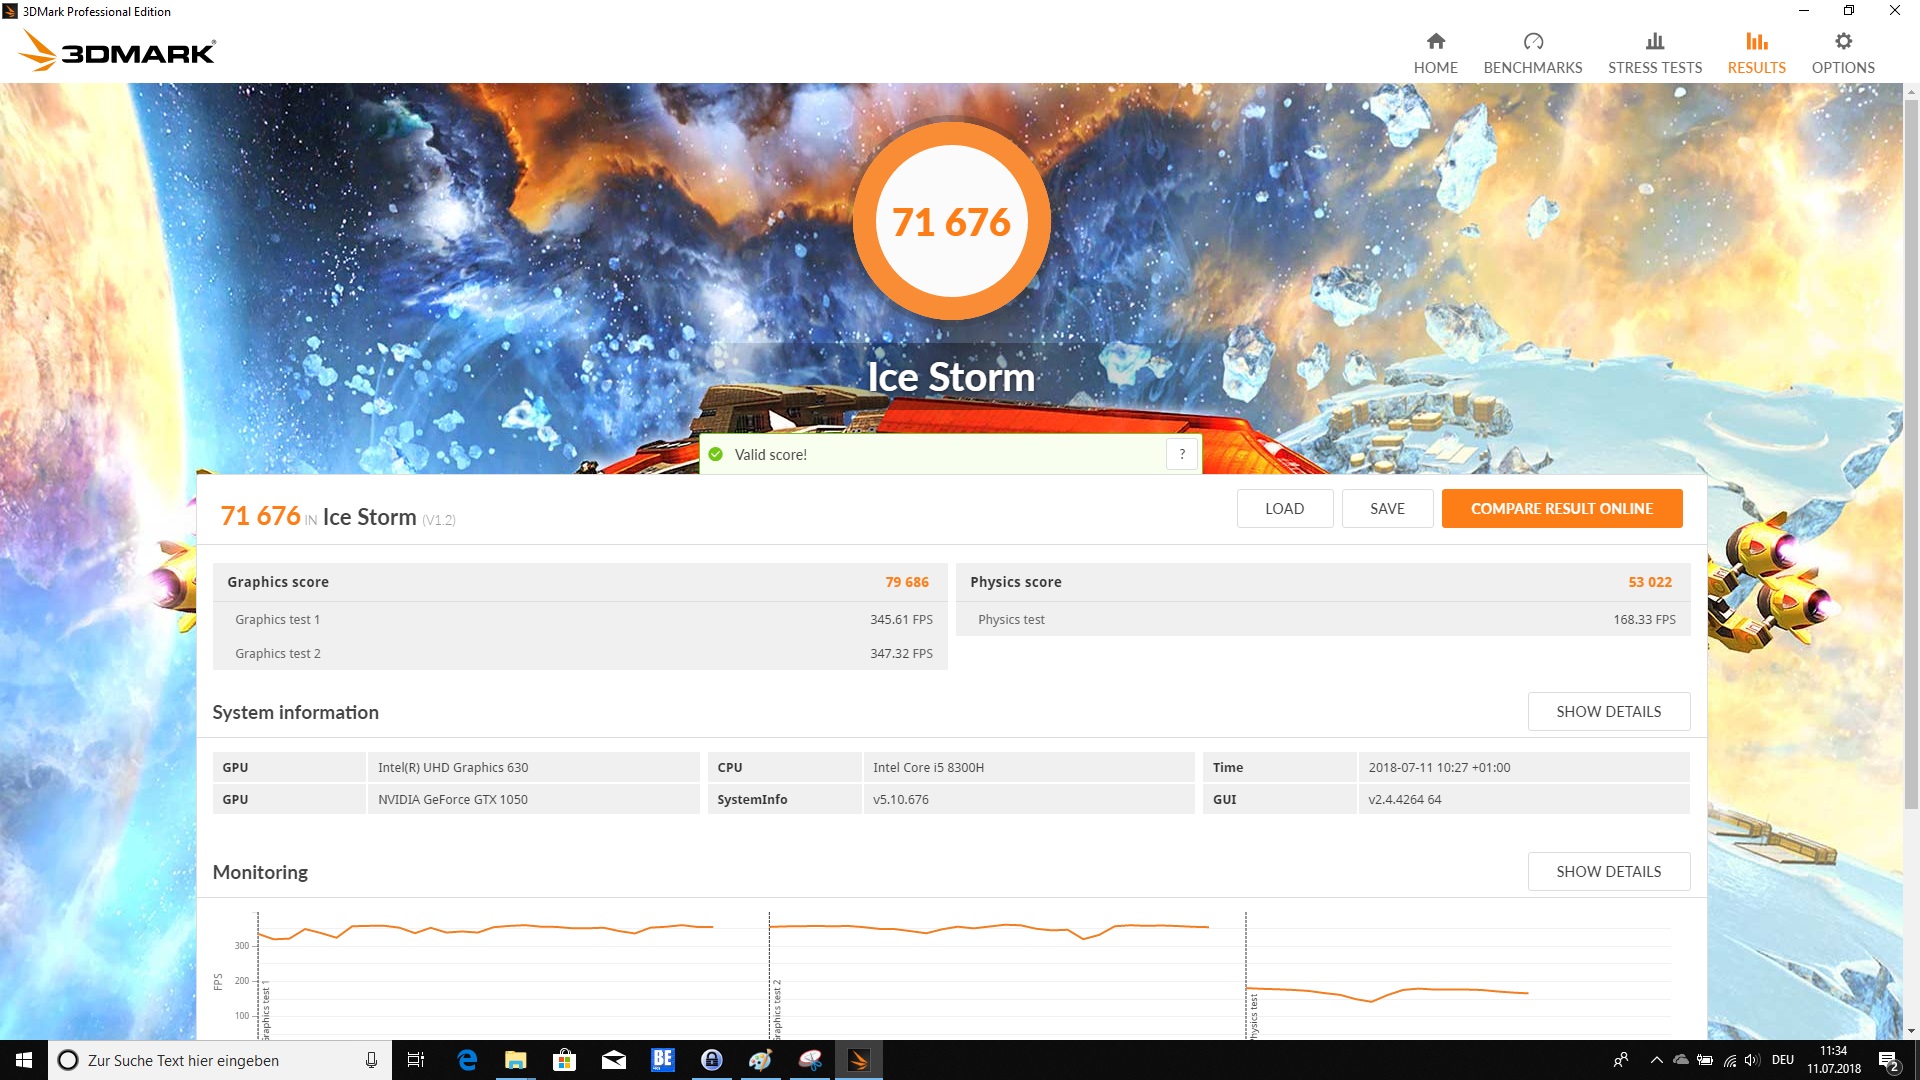
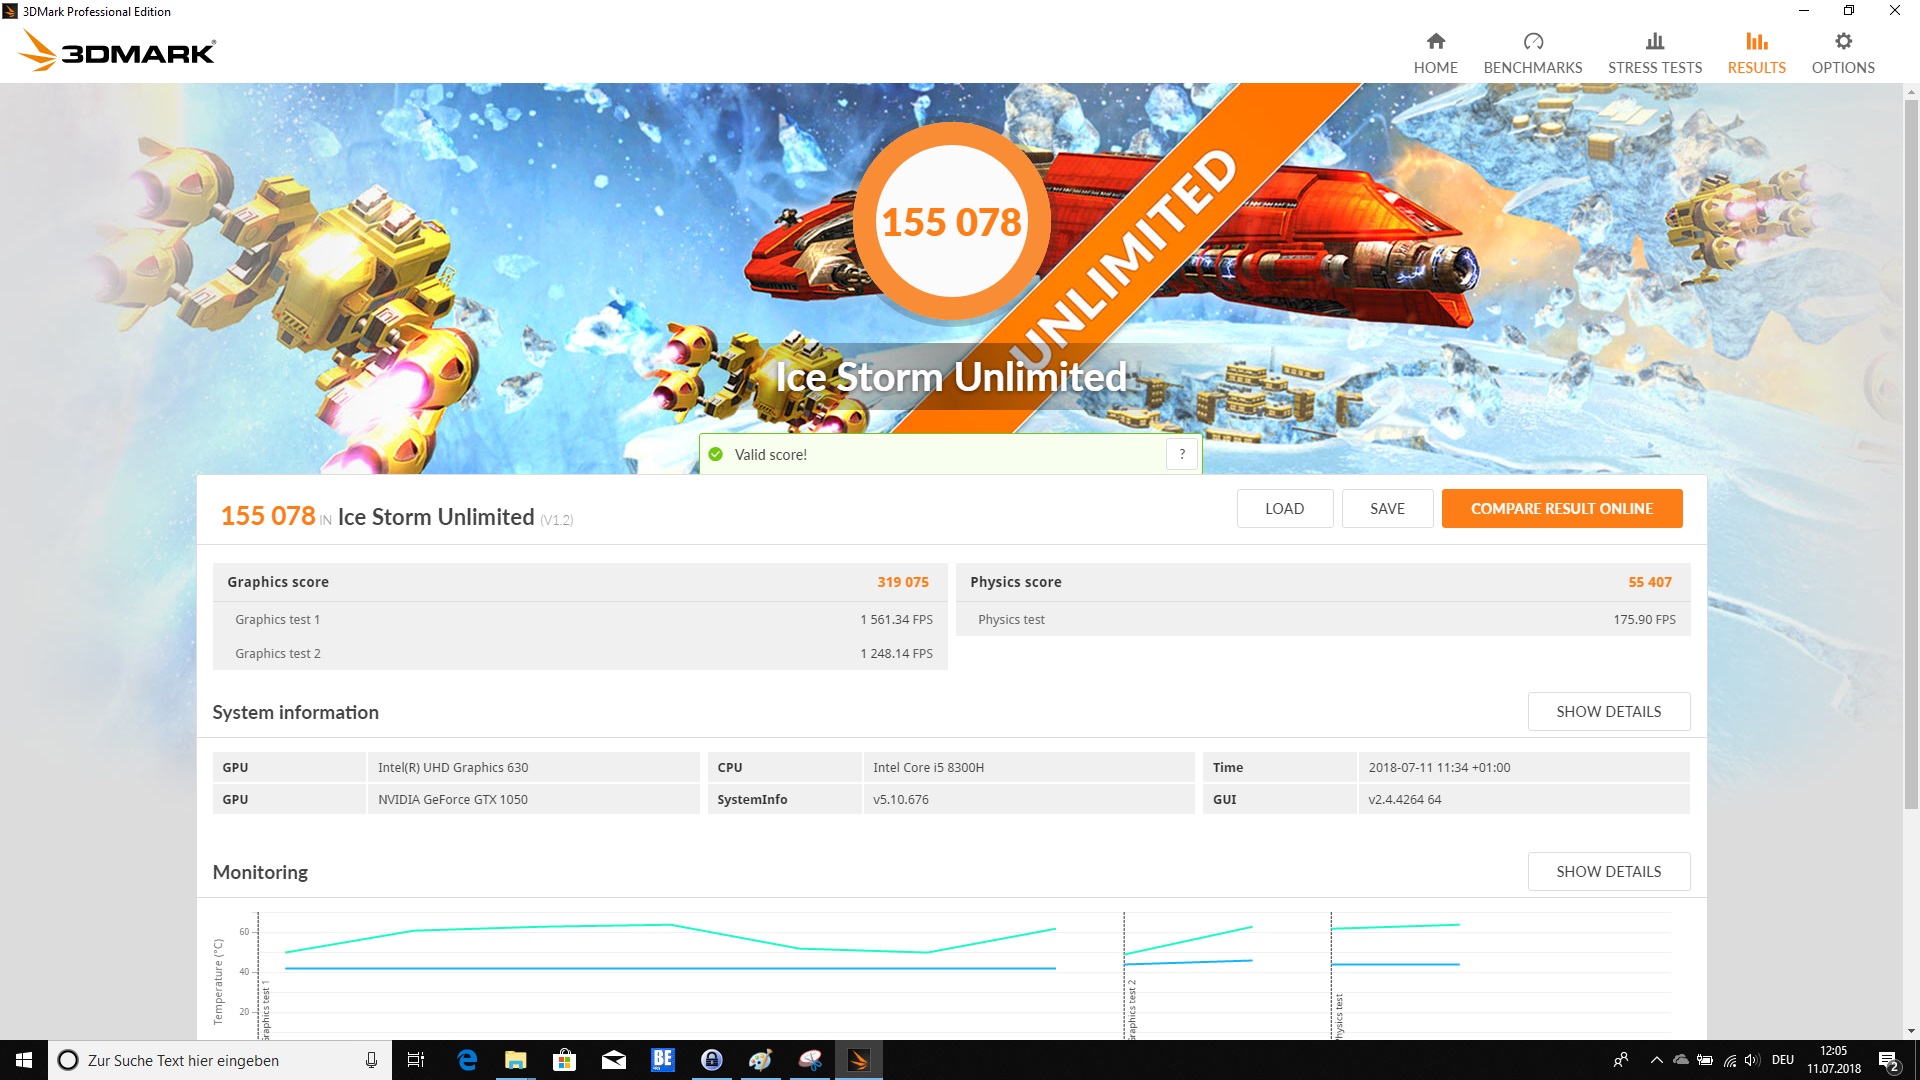
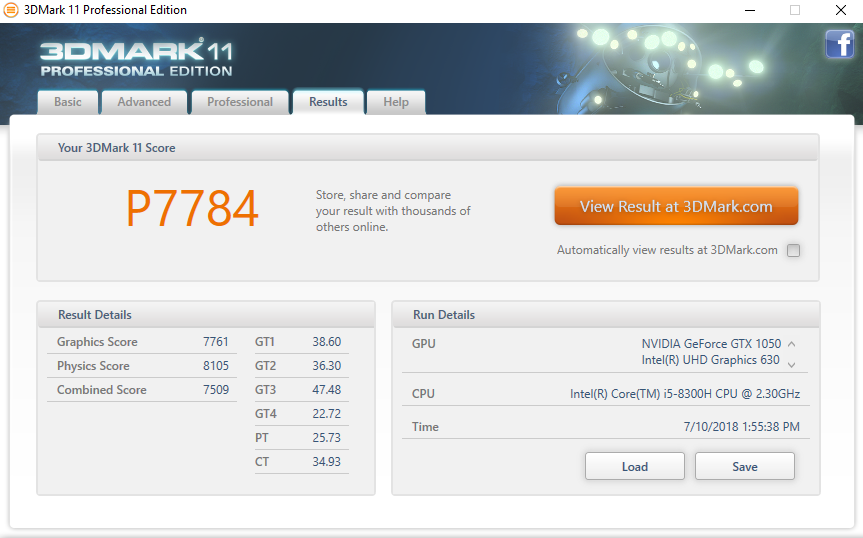
| 3DMark 11 Performance | 7784 pontos | |
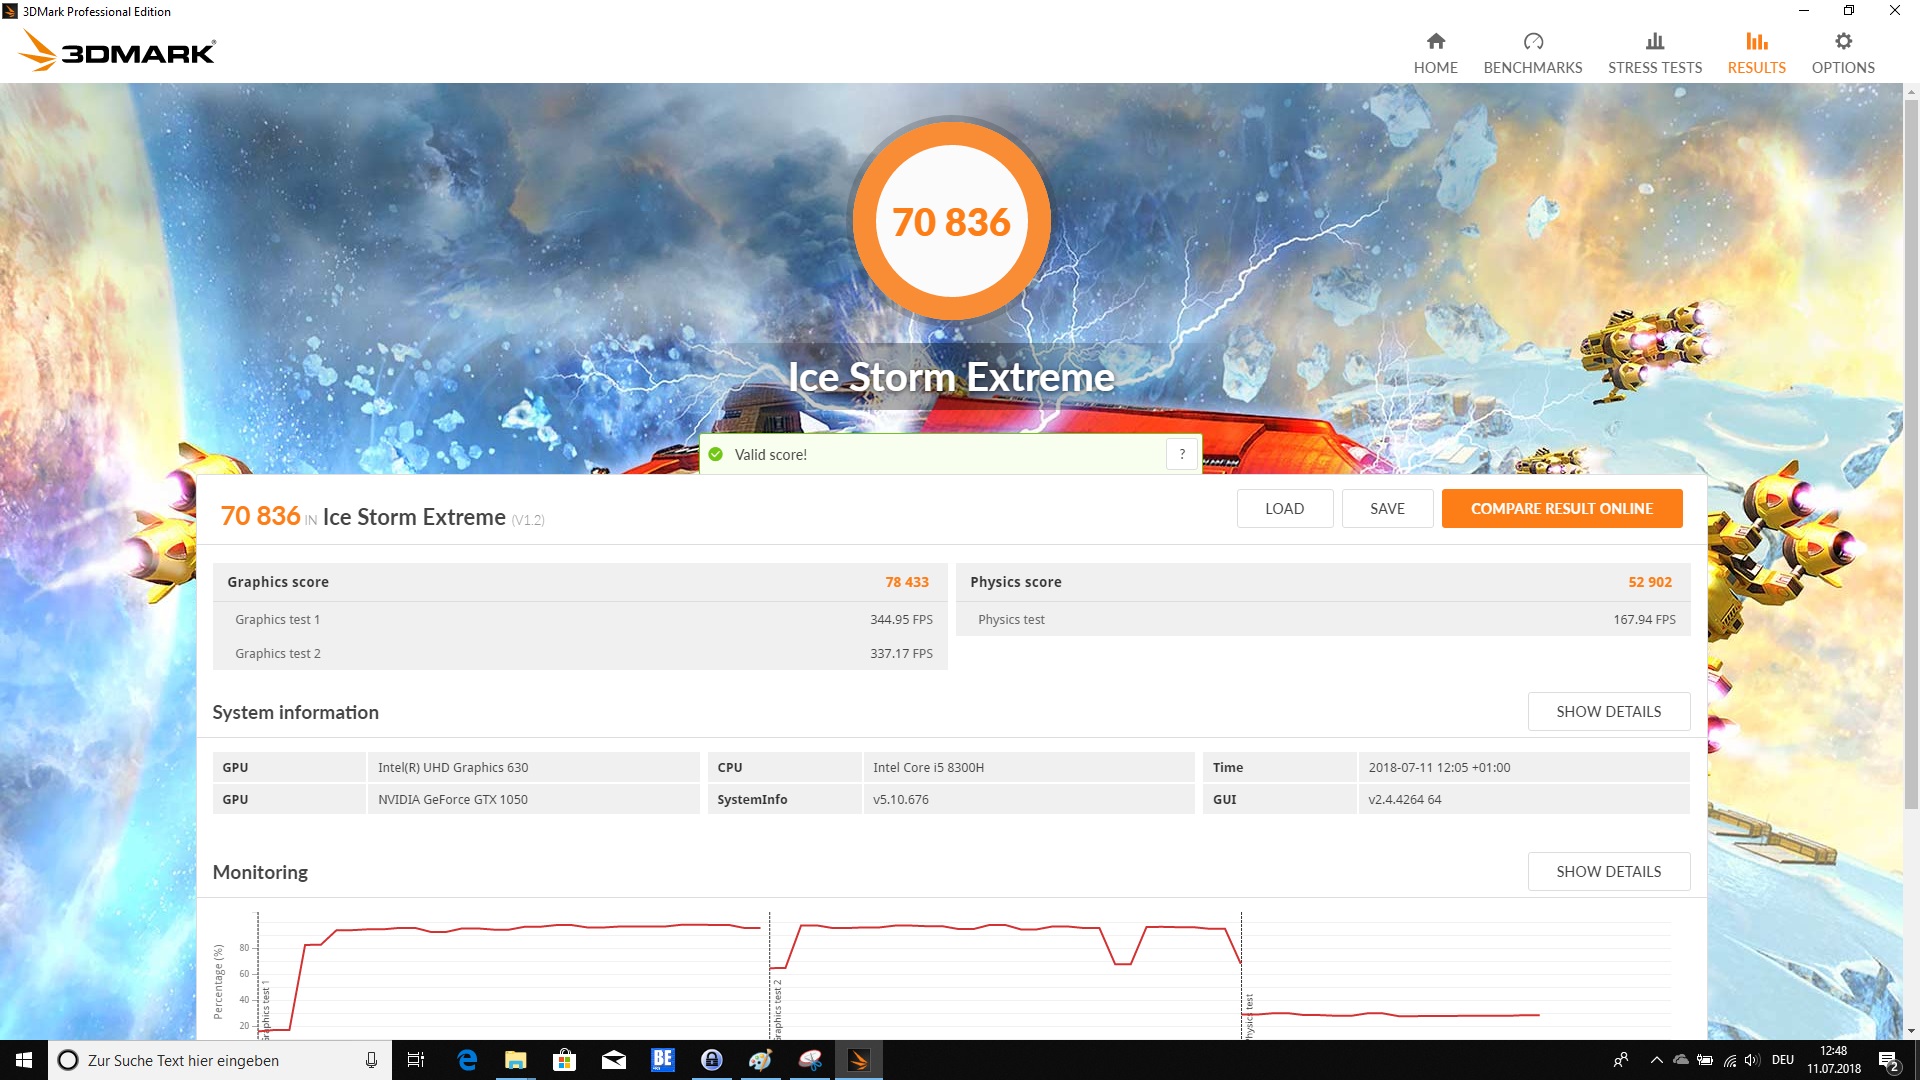
| 3DMark Ice Storm Standard Score | 71676 pontos | |
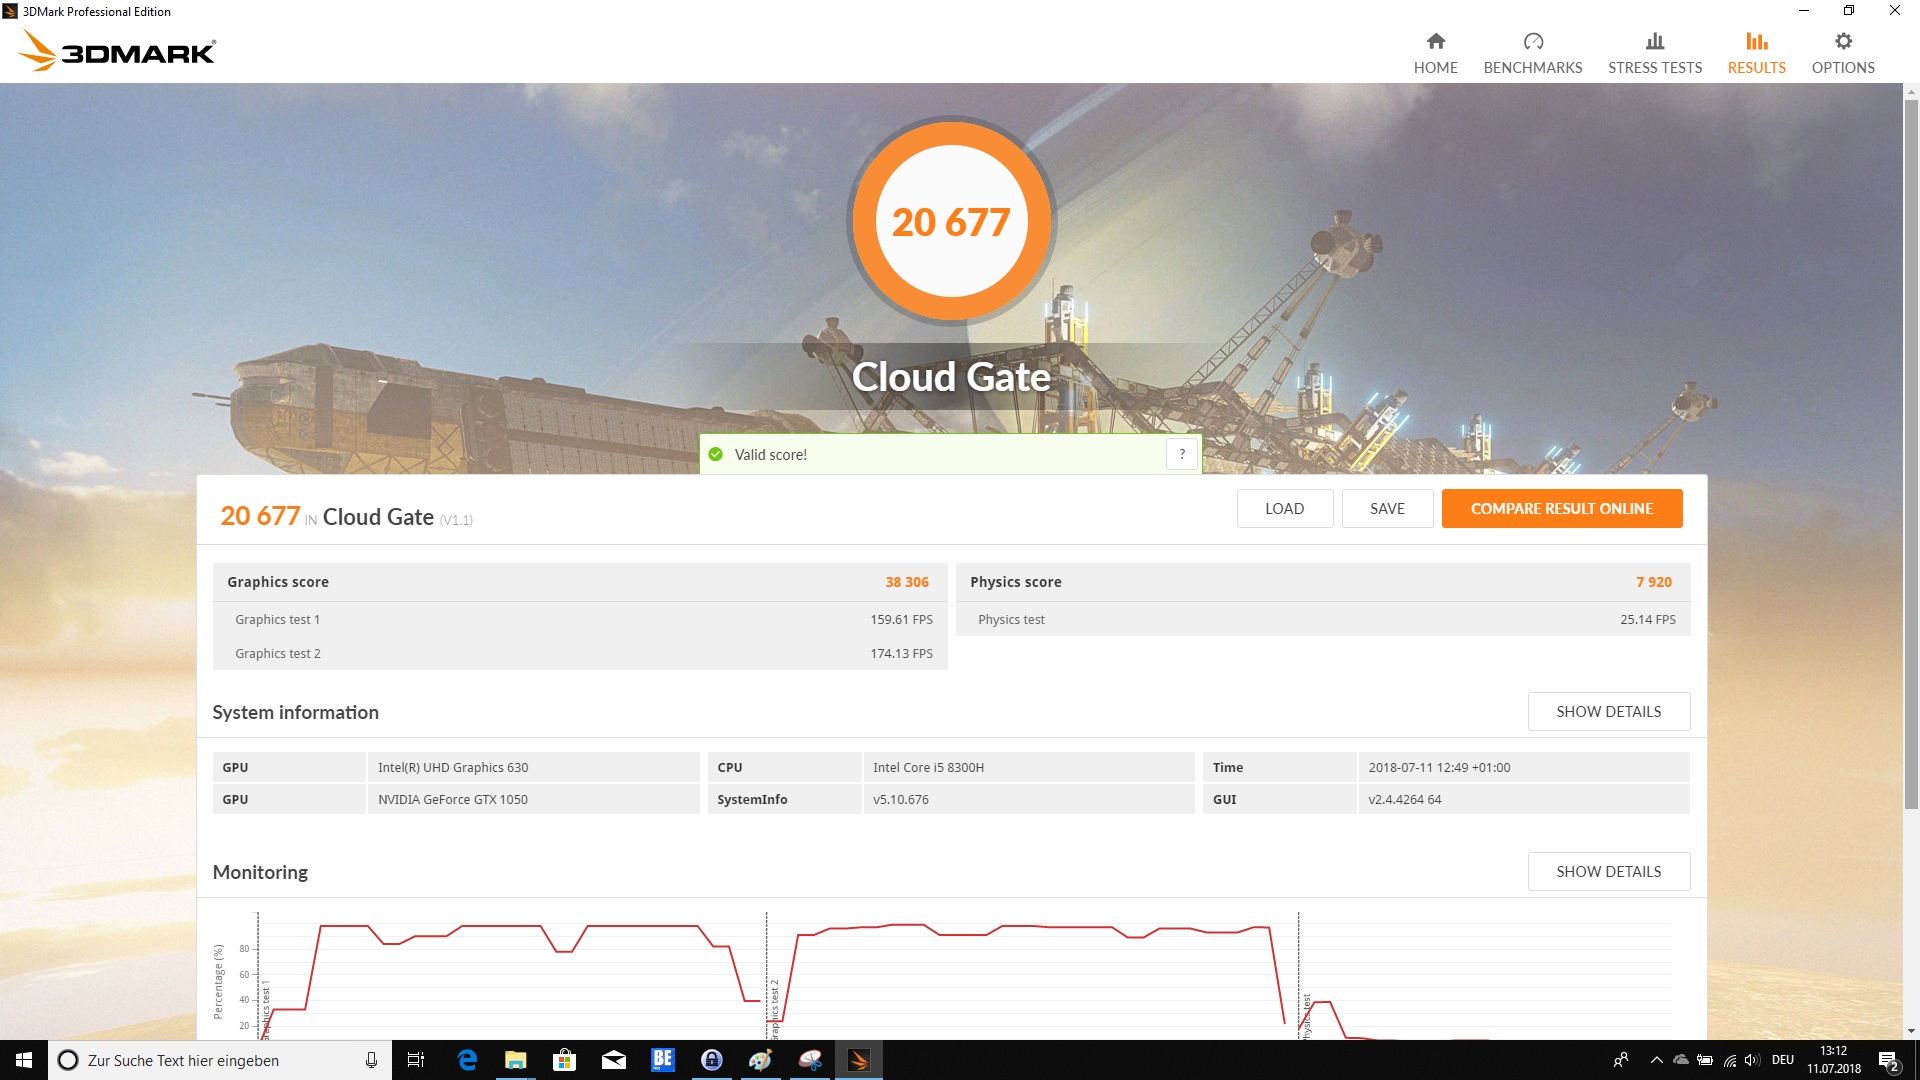
| 3DMark Cloud Gate Standard Score | 20677 pontos | |
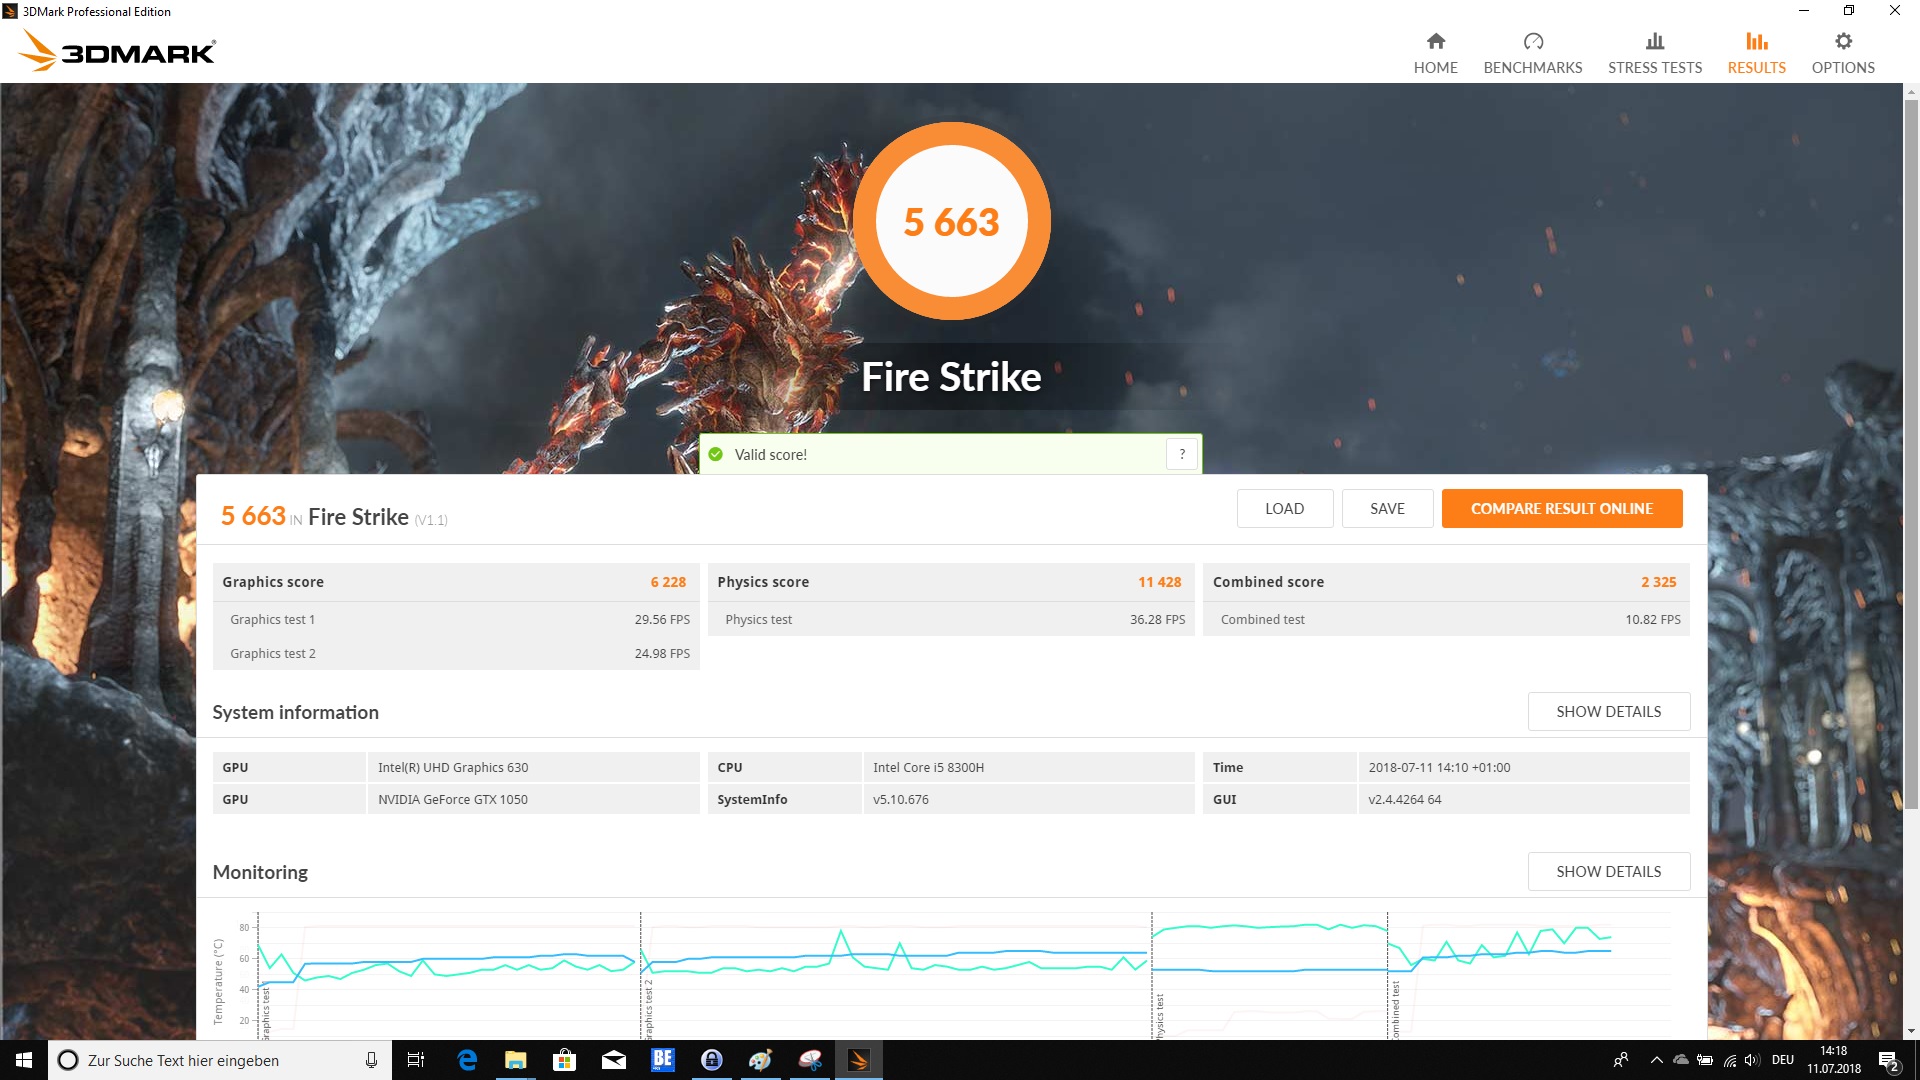
| 3DMark Fire Strike Score | 5663 pontos | |
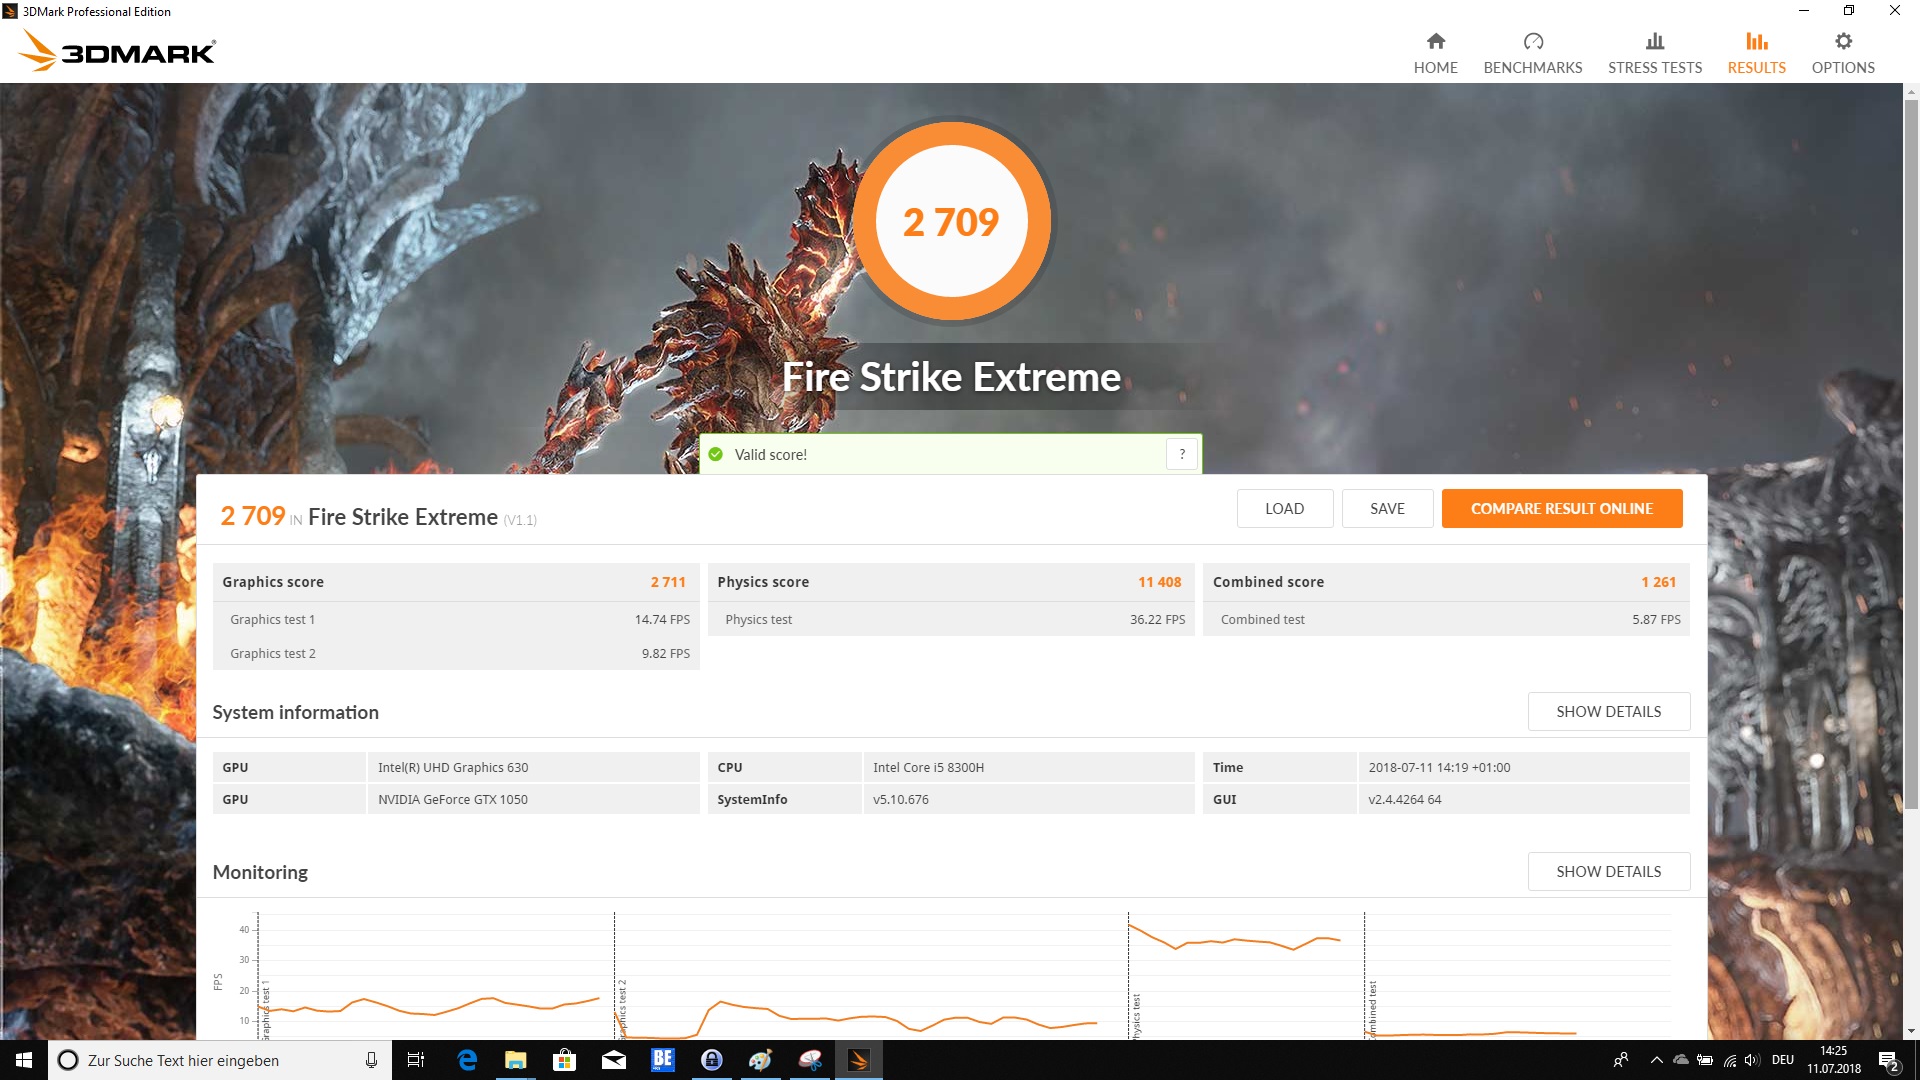
| 3DMark Fire Strike Extreme Score | 2709 pontos | |
Ajuda | ||
| baixo | média | alto | ultra | |
| BioShock Infinite (2013) | 224.2 | 176.4 | 157.8 | 64.3 |
| The Witcher 3 (2015) | 114.5 | 71 | 40.3 | 21.6 |
| Rise of the Tomb Raider (2016) | 120.7 | 69.2 | 38.2 | 33.6 |
| Far Cry 5 (2018) | 74 | 40 | 37 | 33 |
Barulho
| Ocioso |
| 30.5 / 31.1 / 32.1 dB |
| Carga |
| 43.4 / 39.2 dB |
 | ||
30 dB silencioso 40 dB(A) audível 50 dB(A) ruidosamente alto |
||
min: | ||
| Dell G3 17 3779 GeForce GTX 1050 Mobile, i5-8300H, SK hynix SC311 SATA | Acer Predator Helios 300 PH317-52-51M6 GeForce GTX 1050 Ti Mobile, i5-8300H, Hynix HFS128G39TND | Asus ROG Strix GL702ZC-GC204T Radeon RX 580 (Laptop), R5 1600, Seagate Mobile HDD 1TB ST1000LX015-1U7172 | MSI GL72 7RDX-602 GeForce GTX 1050 Mobile, i7-7700HQ, HGST Travelstar 7K1000 HTS721010A9E630 | Acer Aspire Nitro BE VN7-793G-5811 GeForce GTX 1050 Ti Mobile, i5-7300HQ, Seagate Mobile HDD 1TB ST1000LM035 | Asus VivoBook Pro 17 N705UD-EH76 GeForce GTX 1050 Mobile, i5-8550U, Samsung PM961 NVMe MZVLW512HMJP | |
|---|---|---|---|---|---|---|
| Noise | -5% | -4% | -3% | 4% | 6% | |
| off / environment * | 30.5 | 29 5% | 30.2 1% | 30.8 -1% | 29.7 3% | 28.3 7% |
| Idle Minimum * | 30.5 | 29 5% | 30.6 -0% | 32.4 -6% | 30.2 1% | 28.3 7% |
| Idle Average * | 31.1 | 31 -0% | 32.7 -5% | 32.4 -4% | 30.2 3% | 29 7% |
| Idle Maximum * | 32.1 | 33 -3% | 32.7 -2% | 32.8 -2% | 30.6 5% | 29 10% |
| Load Average * | 43.4 | 45 -4% | 38.9 10% | 40.9 6% | 33.8 22% | 36.7 15% |
| Load Maximum * | 39.2 | 51 -30% | 50.6 -29% | 43.6 -11% | 42.6 -9% | 42.8 -9% |
| Witcher 3 ultra * | 45 | 53.4 | 39.5 | 44.7 |
* ... smaller is better
(-) The maximum temperature on the upper side is 53 °C / 127 F, compared to the average of 40.4 °C / 105 F, ranging from 21.2 to 68.8 °C for the class Gaming.
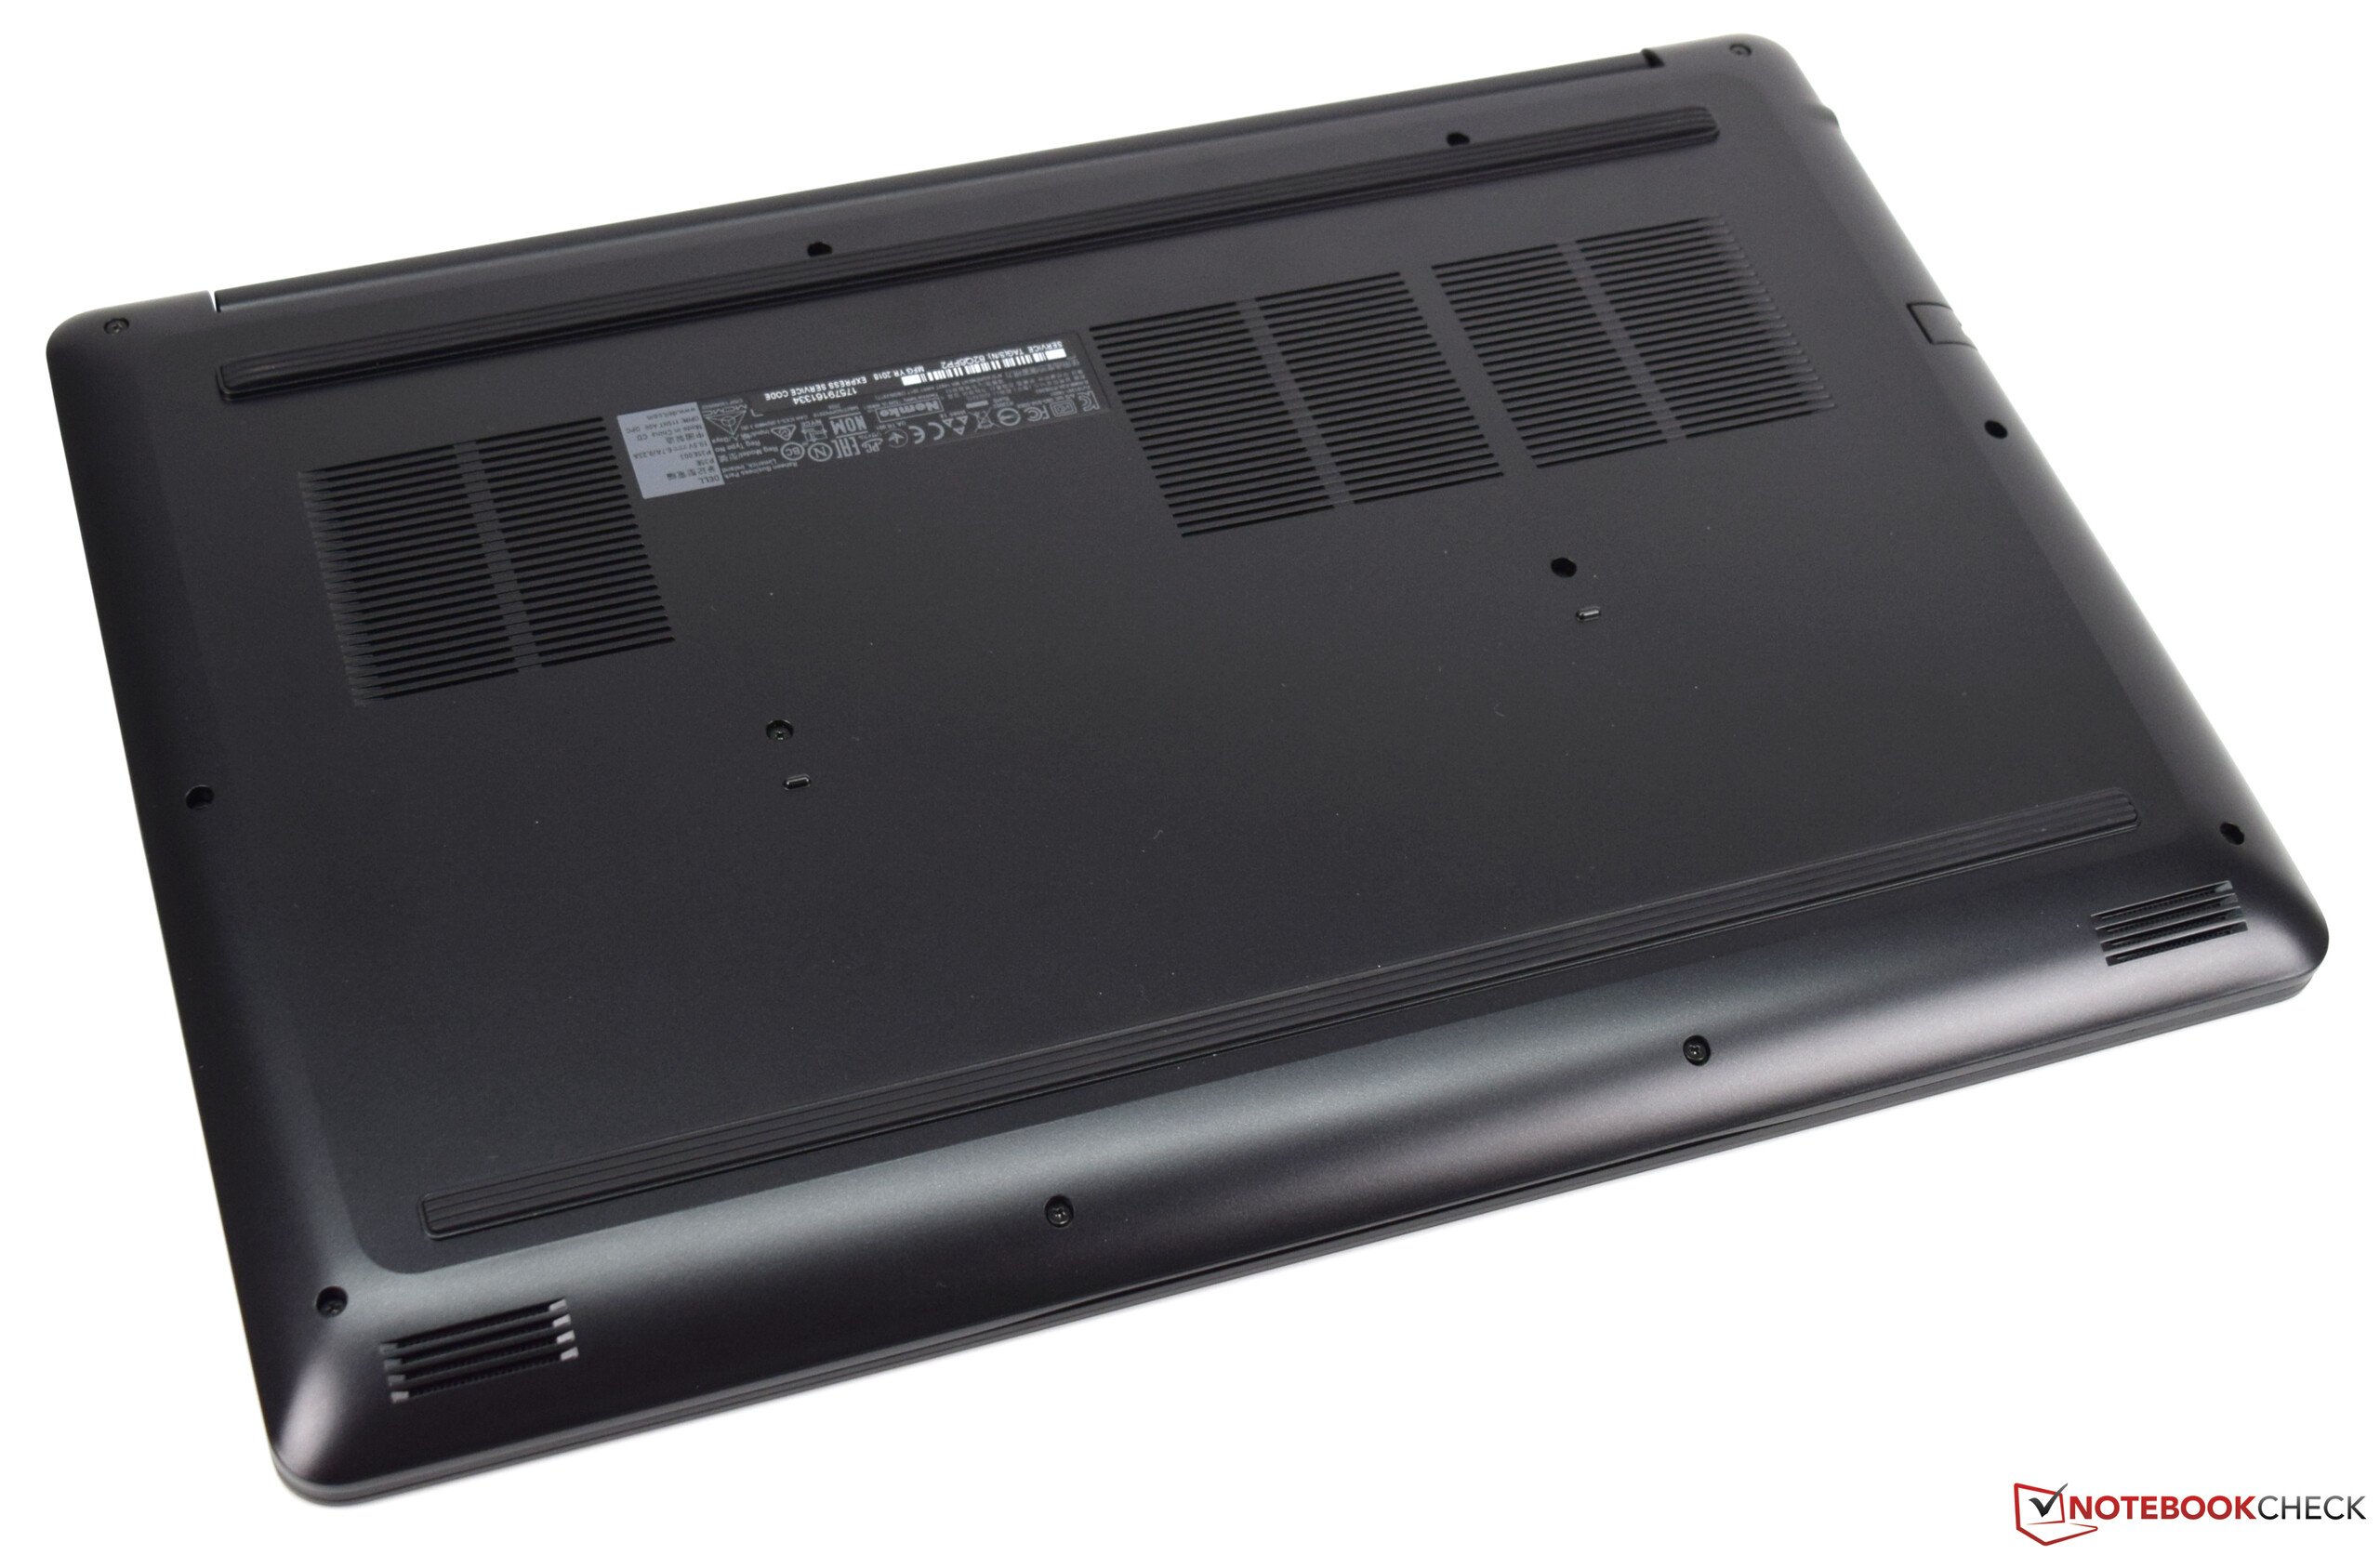
(-) The bottom heats up to a maximum of 60.5 °C / 141 F, compared to the average of 43.2 °C / 110 F
(+) In idle usage, the average temperature for the upper side is 28 °C / 82 F, compared to the device average of 33.8 °C / 93 F.
(+) The palmrests and touchpad are cooler than skin temperature with a maximum of 27.6 °C / 81.7 F and are therefore cool to the touch.
(±) The average temperature of the palmrest area of similar devices was 28.9 °C / 84 F (+1.3 °C / 2.3 F).
| Dell G3 17 3779 GeForce GTX 1050 Mobile, i5-8300H, SK hynix SC311 SATA | Acer Predator Helios 300 PH317-52-51M6 GeForce GTX 1050 Ti Mobile, i5-8300H, Hynix HFS128G39TND | Asus ROG Strix GL702ZC-GC204T Radeon RX 580 (Laptop), R5 1600, Seagate Mobile HDD 1TB ST1000LX015-1U7172 | MSI GL72 7RDX-602 GeForce GTX 1050 Mobile, i7-7700HQ, HGST Travelstar 7K1000 HTS721010A9E630 | Acer Aspire Nitro BE VN7-793G-5811 GeForce GTX 1050 Ti Mobile, i5-7300HQ, Seagate Mobile HDD 1TB ST1000LM035 | Asus VivoBook Pro 17 N705UD-EH76 GeForce GTX 1050 Mobile, i5-8550U, Samsung PM961 NVMe MZVLW512HMJP | |
|---|---|---|---|---|---|---|
| Heat | 4% | -3% | 10% | 13% | 2% | |
| Maximum Upper Side * | 53 | 50 6% | 54.3 -2% | 45 15% | 48 9% | 46 13% |
| Maximum Bottom * | 60.5 | 52 14% | 51 16% | 44 27% | 40.8 33% | 56.2 7% |
| Idle Upper Side * | 30.3 | 33 -9% | 36 -19% | 29 4% | 29.9 1% | 28.6 6% |
| Idle Bottom * | 32 | 30 6% | 34.3 -7% | 34.2 -7% | 29.8 7% | 37.6 -18% |
* ... smaller is better
| desligado | |
| Ocioso | |
| Carga |
|
| Dell G3 17 3779 i5-8300H, GeForce GTX 1050 Mobile, SK hynix SC311 SATA, IPS, 1920x1080, 17.30 | Acer Predator Helios 300 PH317-52-51M6 i5-8300H, GeForce GTX 1050 Ti Mobile, Hynix HFS128G39TND, IPS, 1920x1080, 17.30 | Asus ROG Strix GL702ZC-GC204T R5 1600, Radeon RX 580 (Laptop), Seagate Mobile HDD 1TB ST1000LX015-1U7172, IPS, 1920x1080, 17.30 | MSI GL72 7RDX-602 i7-7700HQ, GeForce GTX 1050 Mobile, HGST Travelstar 7K1000 HTS721010A9E630, TN LED, 1920x1080, 17.30 | Acer Aspire Nitro BE VN7-793G-5811 i5-7300HQ, GeForce GTX 1050 Ti Mobile, Seagate Mobile HDD 1TB ST1000LM035, IPS, 1920x1080, 17.30 | Asus VivoBook Pro 17 N705UD-EH76 i5-8550U, GeForce GTX 1050 Mobile, Samsung PM961 NVMe MZVLW512HMJP, IPS, 1920x1080, 17.30 | Average NVIDIA GeForce GTX 1050 Mobile | Average of class Gaming | |
|---|---|---|---|---|---|---|---|---|
| Power Consumption | 10% | -282% | -14% | -0% | 22% | 11% | -69% | |
| Idle Minimum * | 7.7 | 6 22% | 49 -536% | 9.6 -25% | 8.7 -13% | 5.06 34% | 6.99 ? 9% | 13.8 ? -79% |
| Idle Average * | 14 | 9 36% | 60 -329% | 15 -7% | 12.4 11% | 10.3 26% | 10.7 ? 24% | 19.2 ? -37% |
| Idle Maximum * | 15.5 | 13 16% | 68 -339% | 16.5 -6% | 15.4 1% | 10.7 31% | 12.7 ? 18% | 26.9 ? -74% |
| Load Average * | 95 | 95 -0% | 150 -58% | 104 -9% | 73 23% | 83 13% | 82.9 ? 13% | 111.1 ? -17% |
| Load Maximum * | 106 | 134 -26% | 262 -147% | 129 -22% | 130 -23% | 99.9 6% | 115.3 ? -9% | 251 ? -137% |
| Witcher 3 ultra * | 102 | 214 | 98 | 92.4 |
* ... smaller is better
| Dell G3 17 3779 i5-8300H, GeForce GTX 1050 Mobile, 56 Wh | Acer Predator Helios 300 PH317-52-51M6 i5-8300H, GeForce GTX 1050 Ti Mobile, 48 Wh | Asus ROG Strix GL702ZC-GC204T R5 1600, Radeon RX 580 (Laptop), 74 Wh | MSI GL72 7RDX-602 i7-7700HQ, GeForce GTX 1050 Mobile, 43.2 Wh | Acer Aspire Nitro BE VN7-793G-5811 i5-7300HQ, GeForce GTX 1050 Ti Mobile, 52.5 Wh | Asus VivoBook Pro 17 N705UD-EH76 i5-8550U, GeForce GTX 1050 Mobile, 42 Wh | Average of class Gaming | |
|---|---|---|---|---|---|---|---|
| Battery Runtime | -7% | -77% | -53% | -19% | -41% | -6% | |
| Reader / Idle | 733 | 710 -3% | 327 -55% | 544 ? -26% | |||
| H.264 | 315 | 169 -46% | 399 ? 27% | ||||
| WiFi v1.3 | 345 | 354 3% | 80 -77% | 203 -41% | 278 -19% | 265 -23% | 368 ? 7% |
| Load | 126 | 100 -21% | 40 -68% | 53 -58% | 84.4 ? -33% |
Pro
Contra

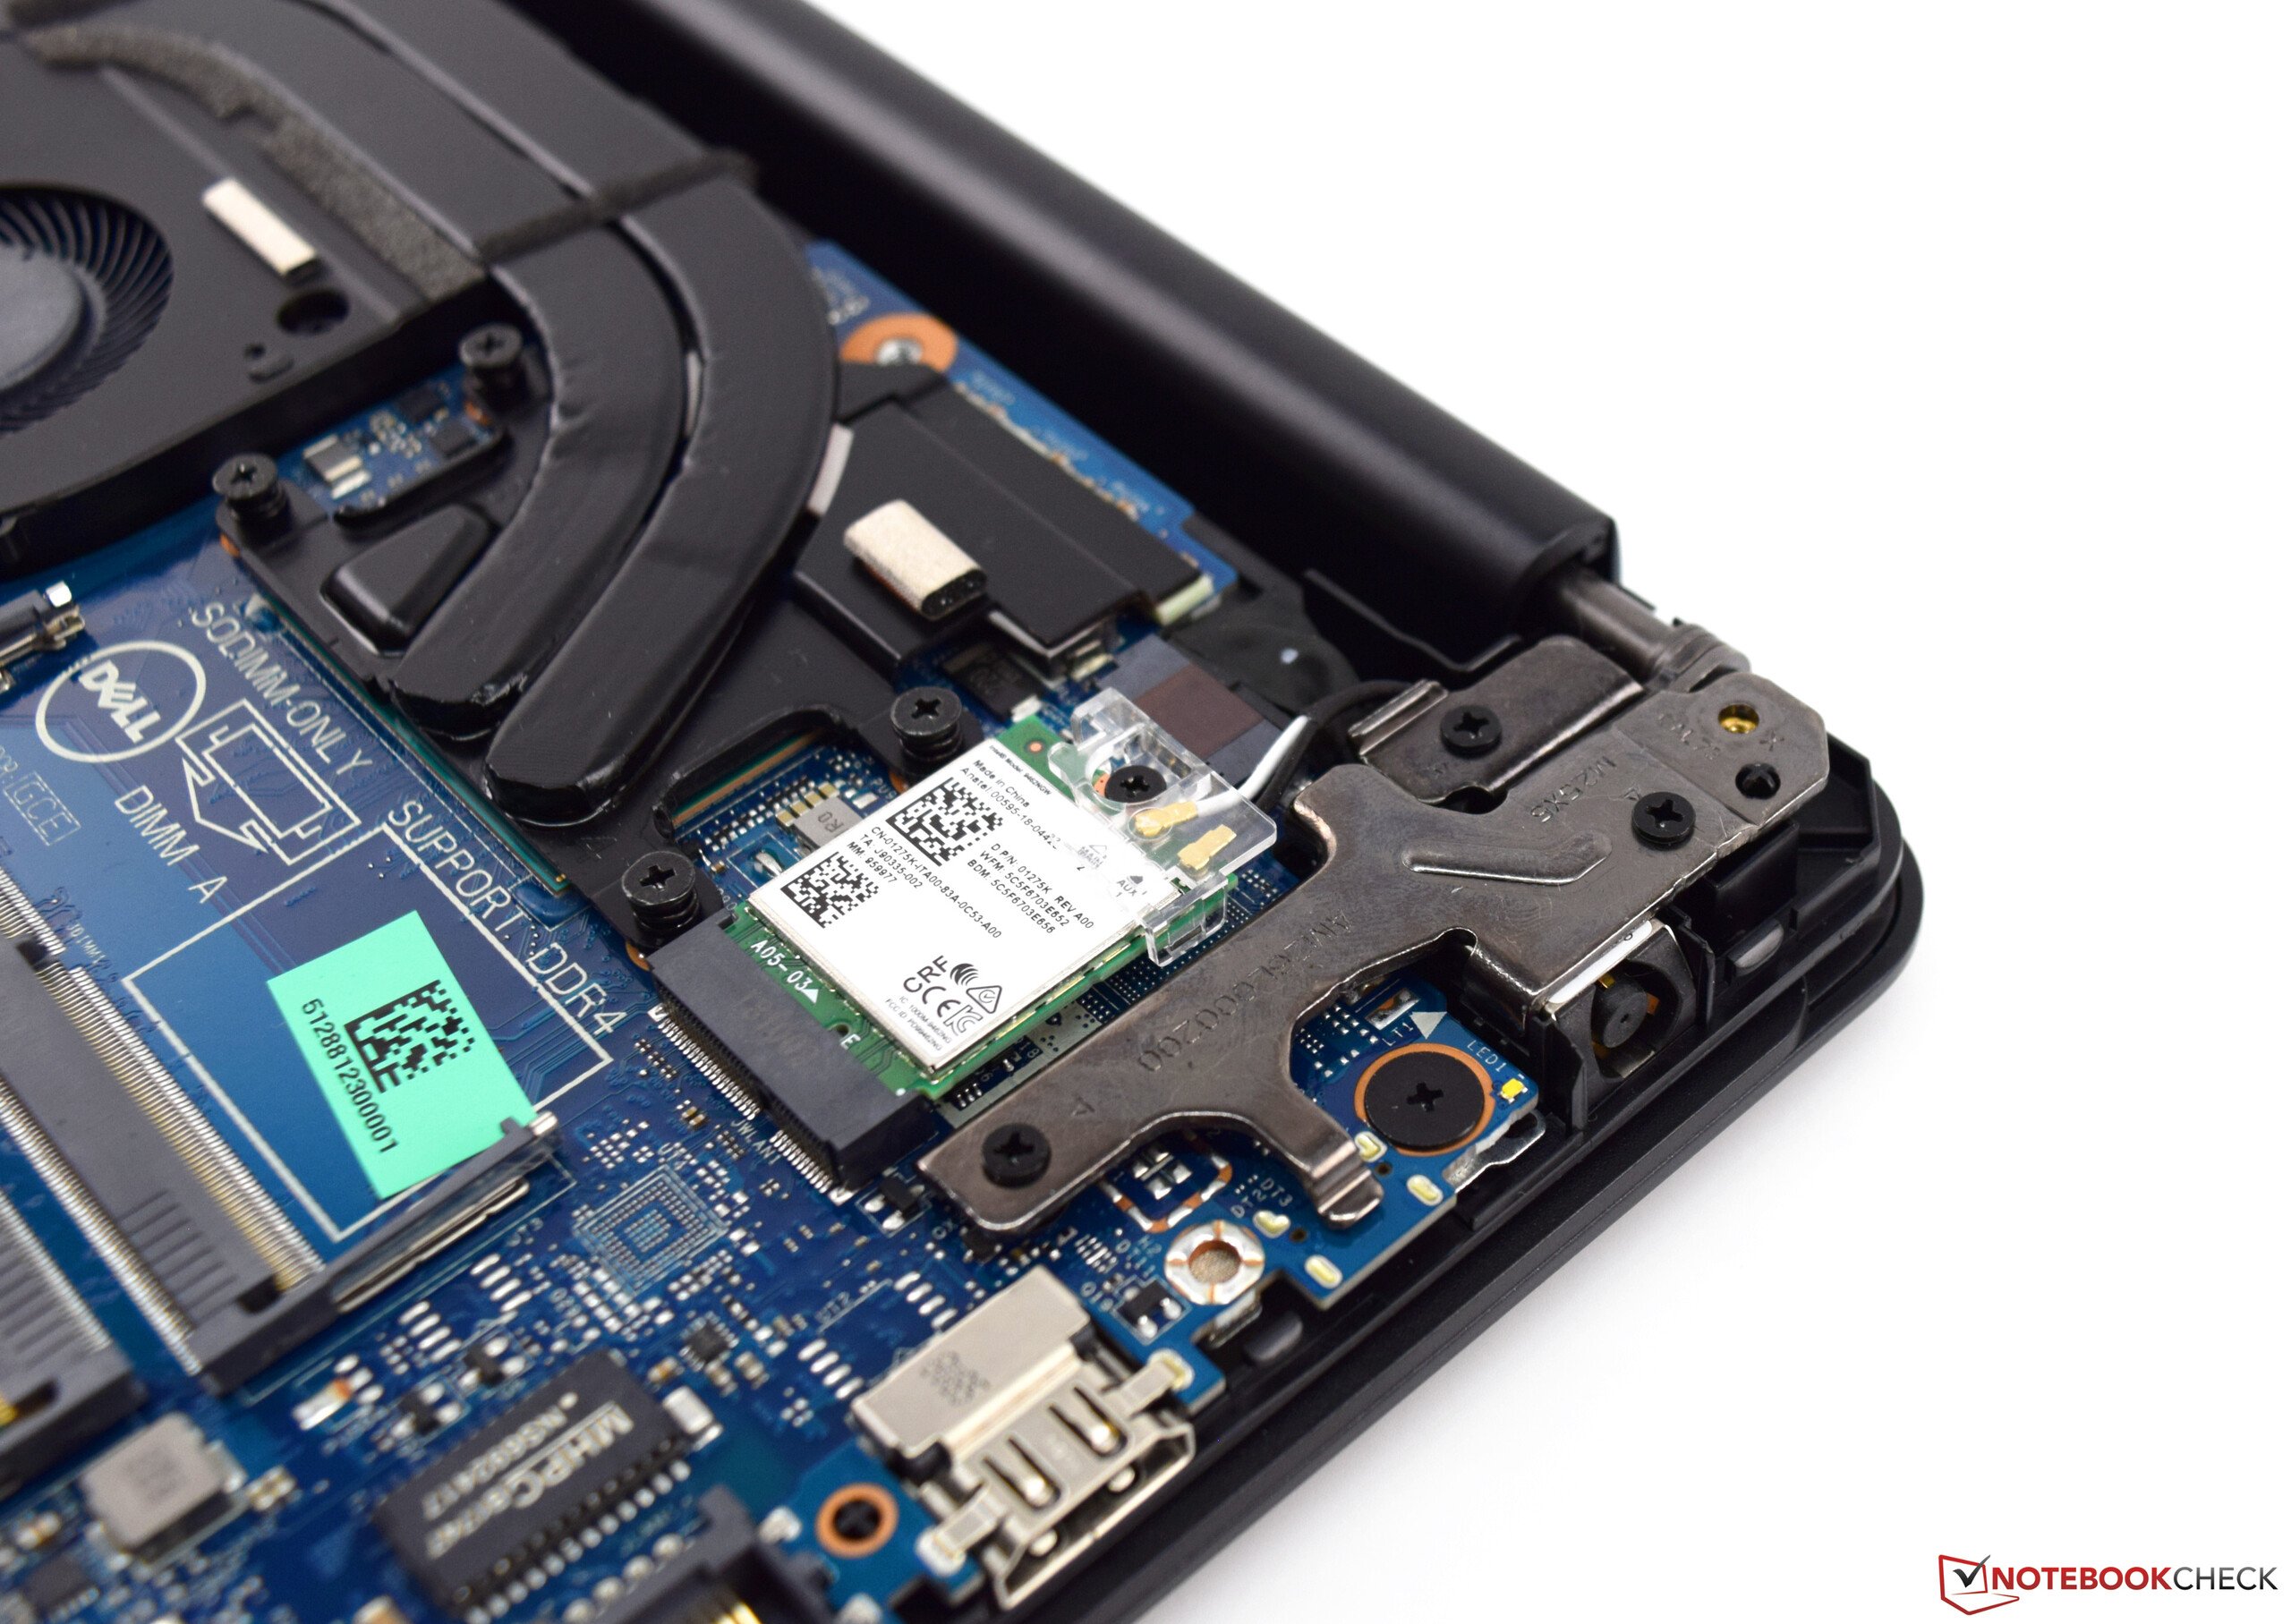
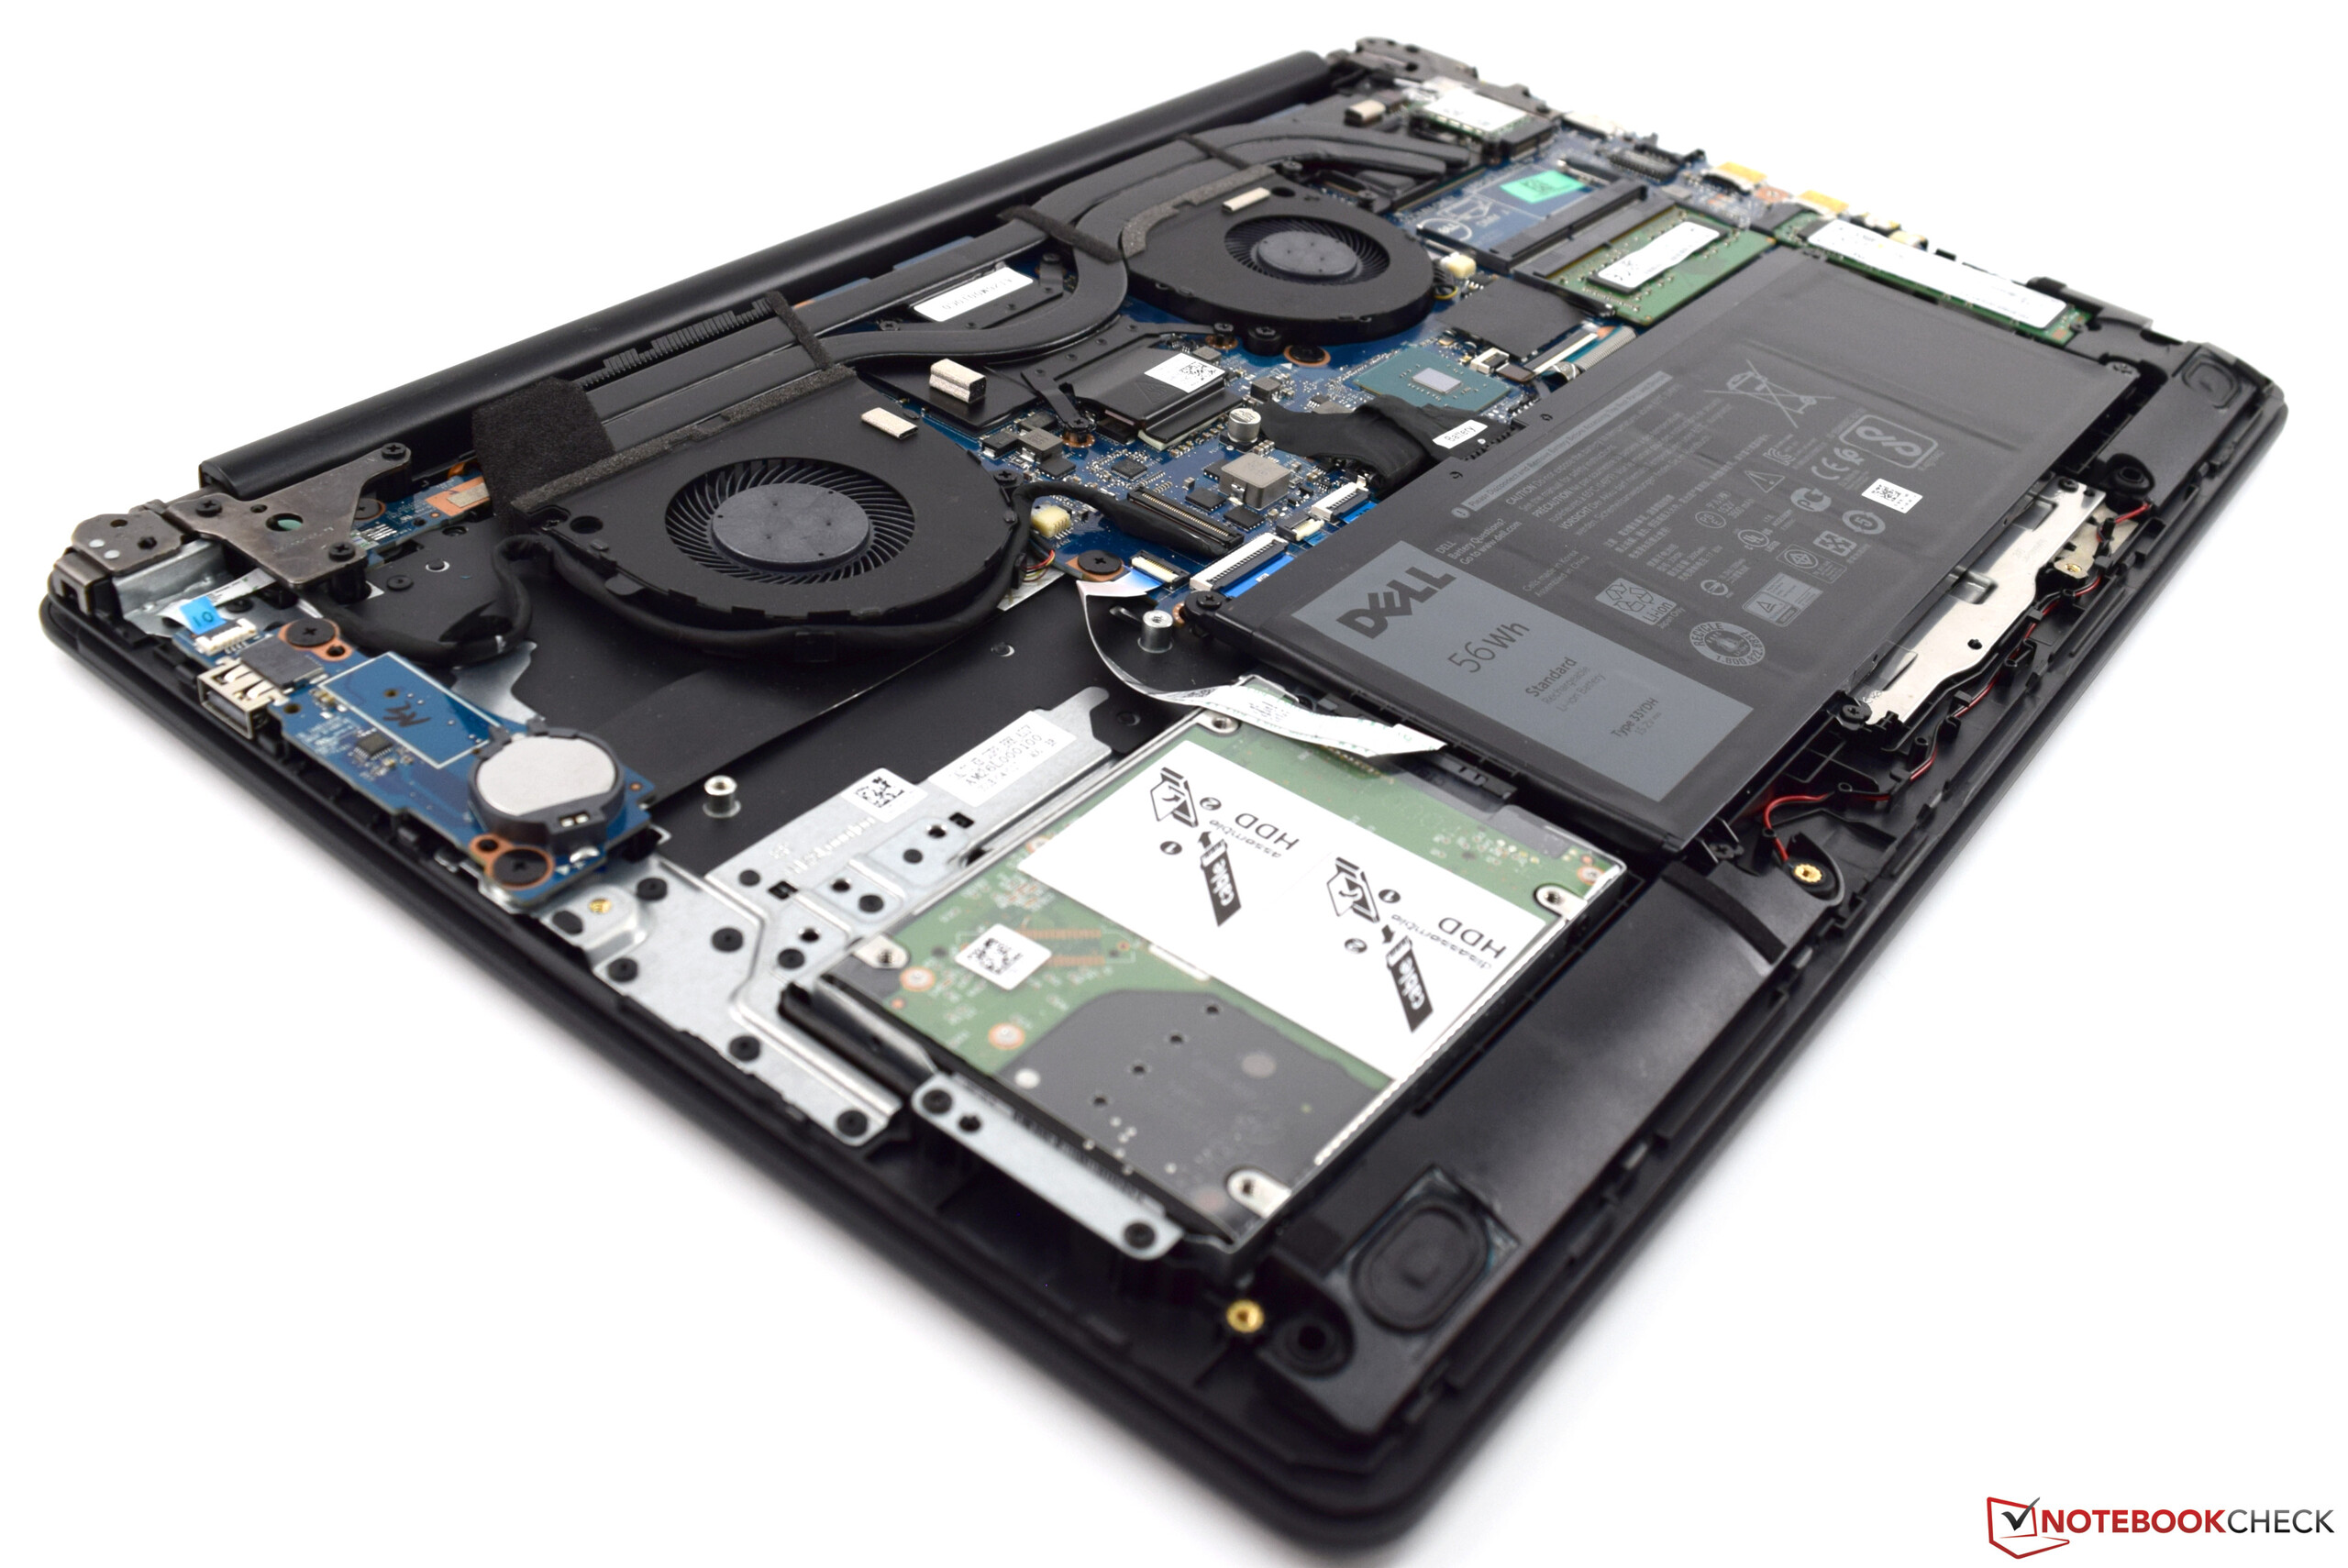
Com o Dell G3 17 3779, o fabricante tem um portátil para jogos acessível em seu portfólio que pode se tornar parte da lista restrita. Os mais recentes processadores Coffee-Lake podem ser selecionados e, com a Nvidia GeForce GTX 1050, a Dell também usa uma placa gráfica decente. Pelo preço de venda solicitado de 799 Euros (~$937), você também recebe 8 GB de RAM e uma solução de armazenamento com uma combinação de um SSD e HD. Com isso, o portátil de 17 polegadas oferece uma base muito boa para entrar no mundo dos jogos. O processador oferece um desempenho decente sem cobrar do dispositivo na operação com bateria.
O Dell G3 17 3779 atrai principalmente com a sua boa relação preço-desempenho. Muito dispositivo por relativamente pouco dinheiro; é isso que a Dell está oferecendo com a nova série G3 17.
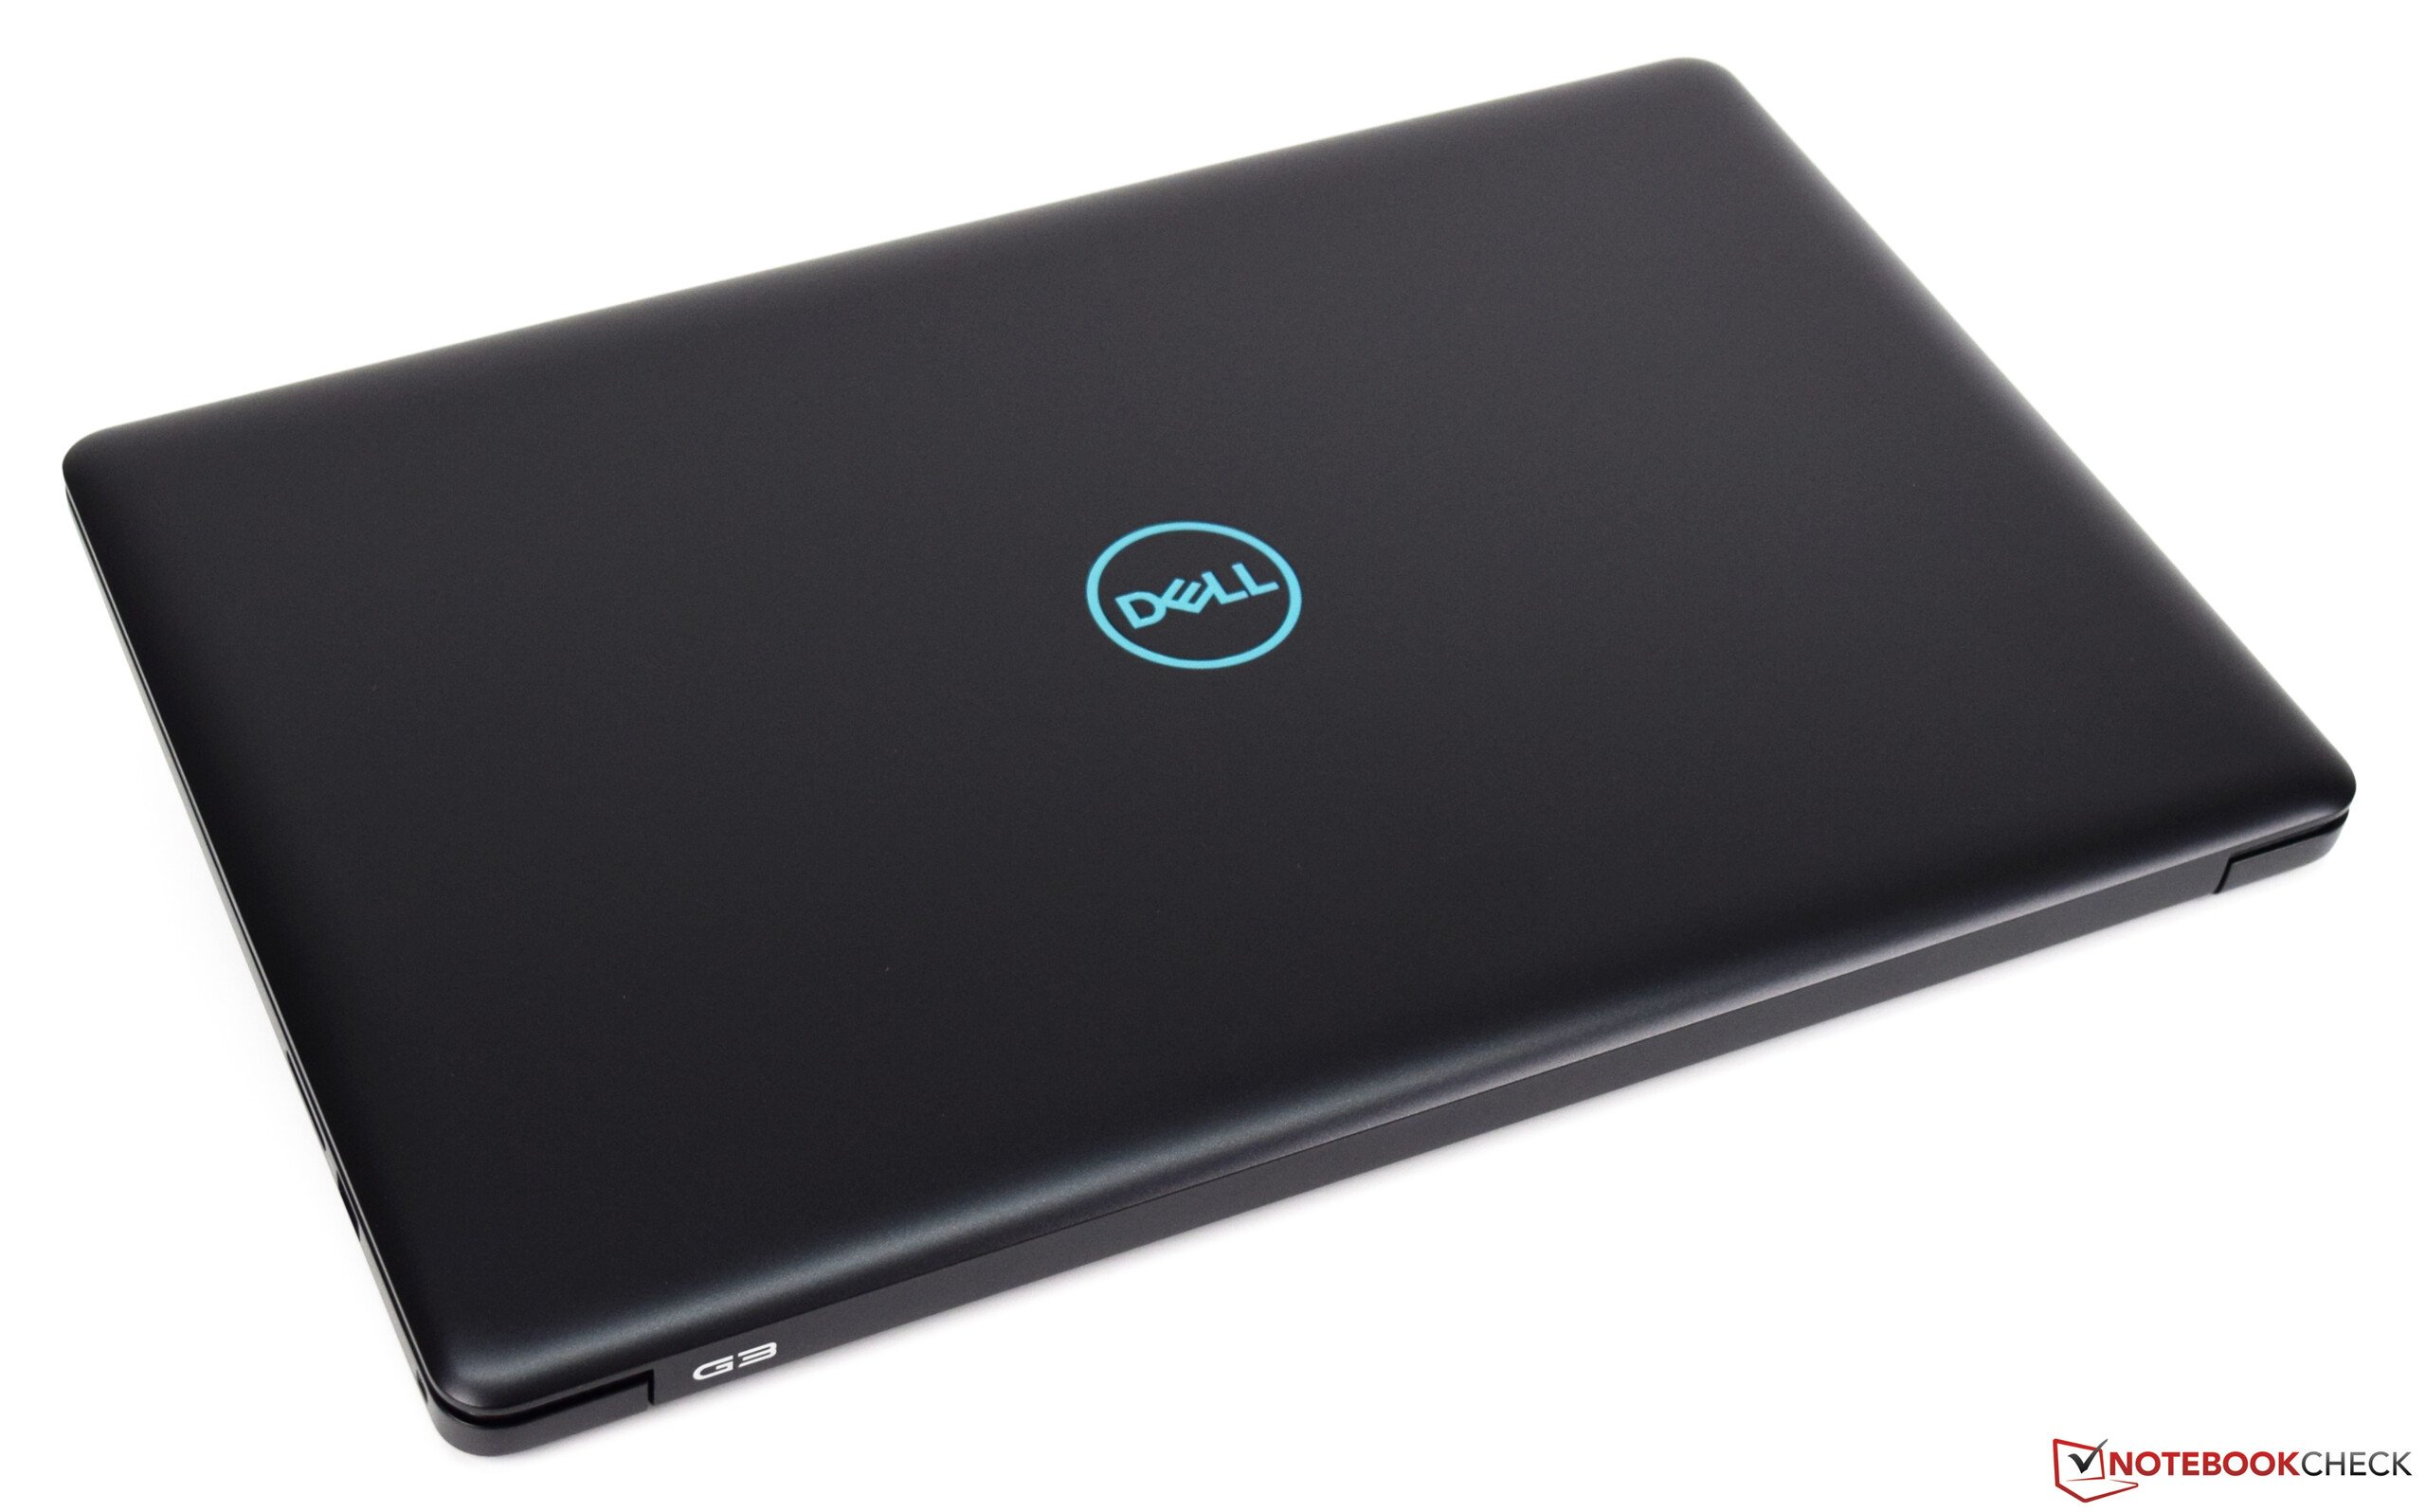
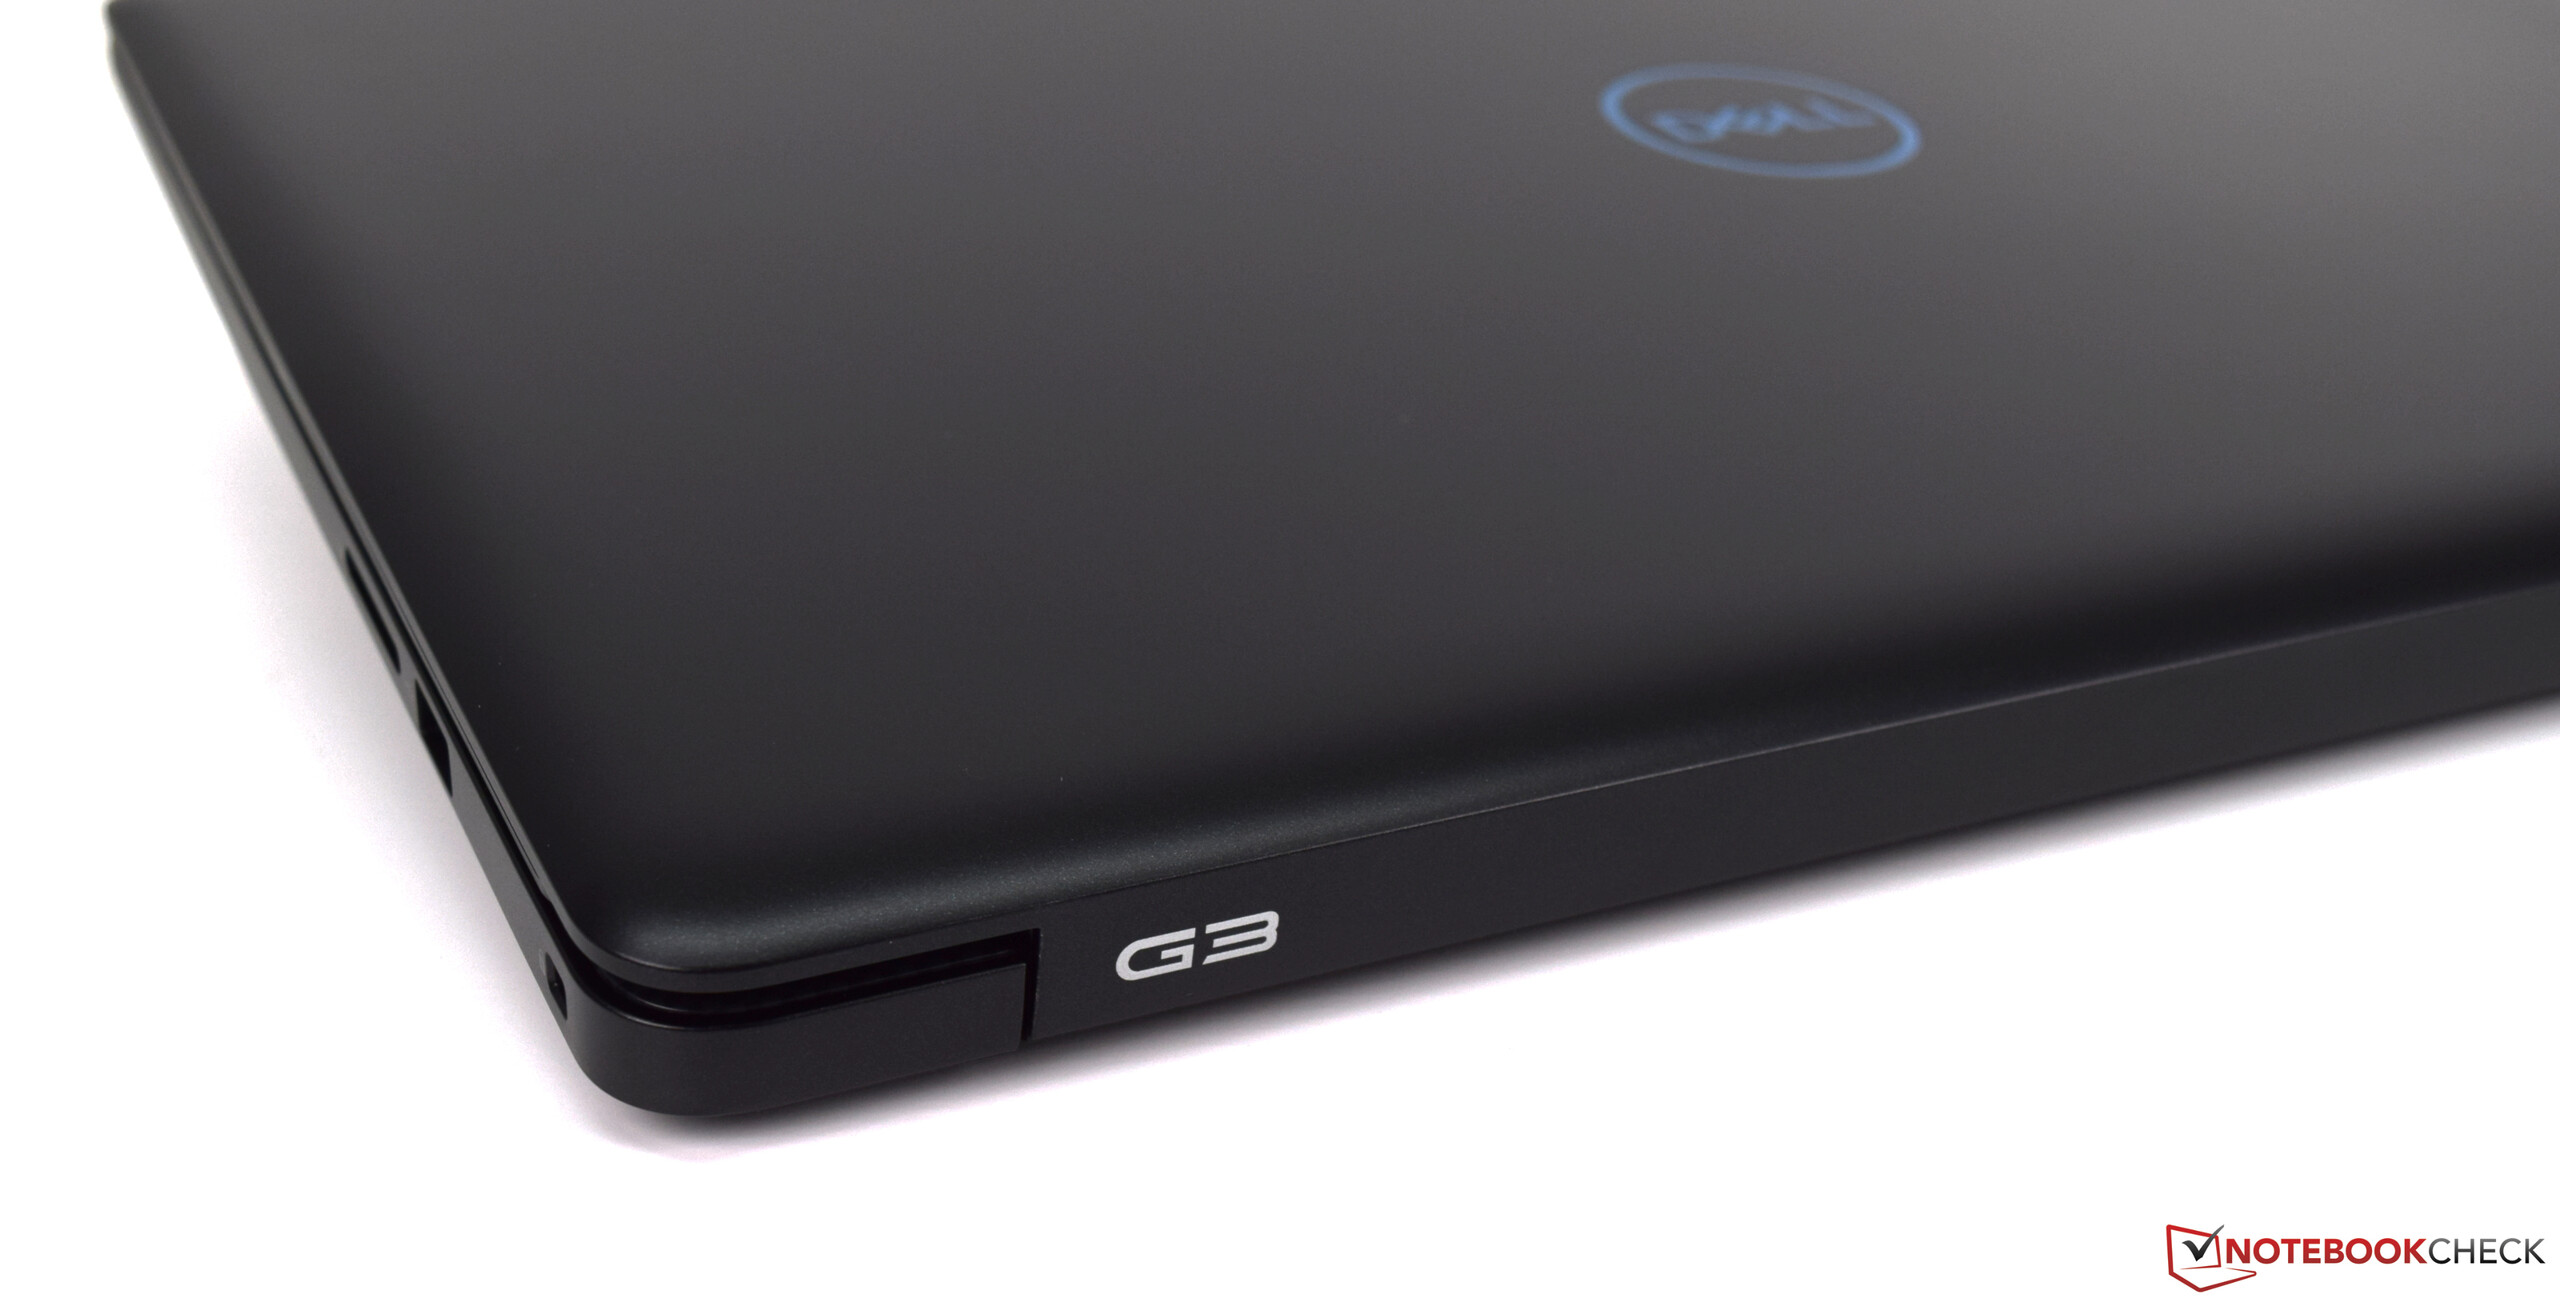
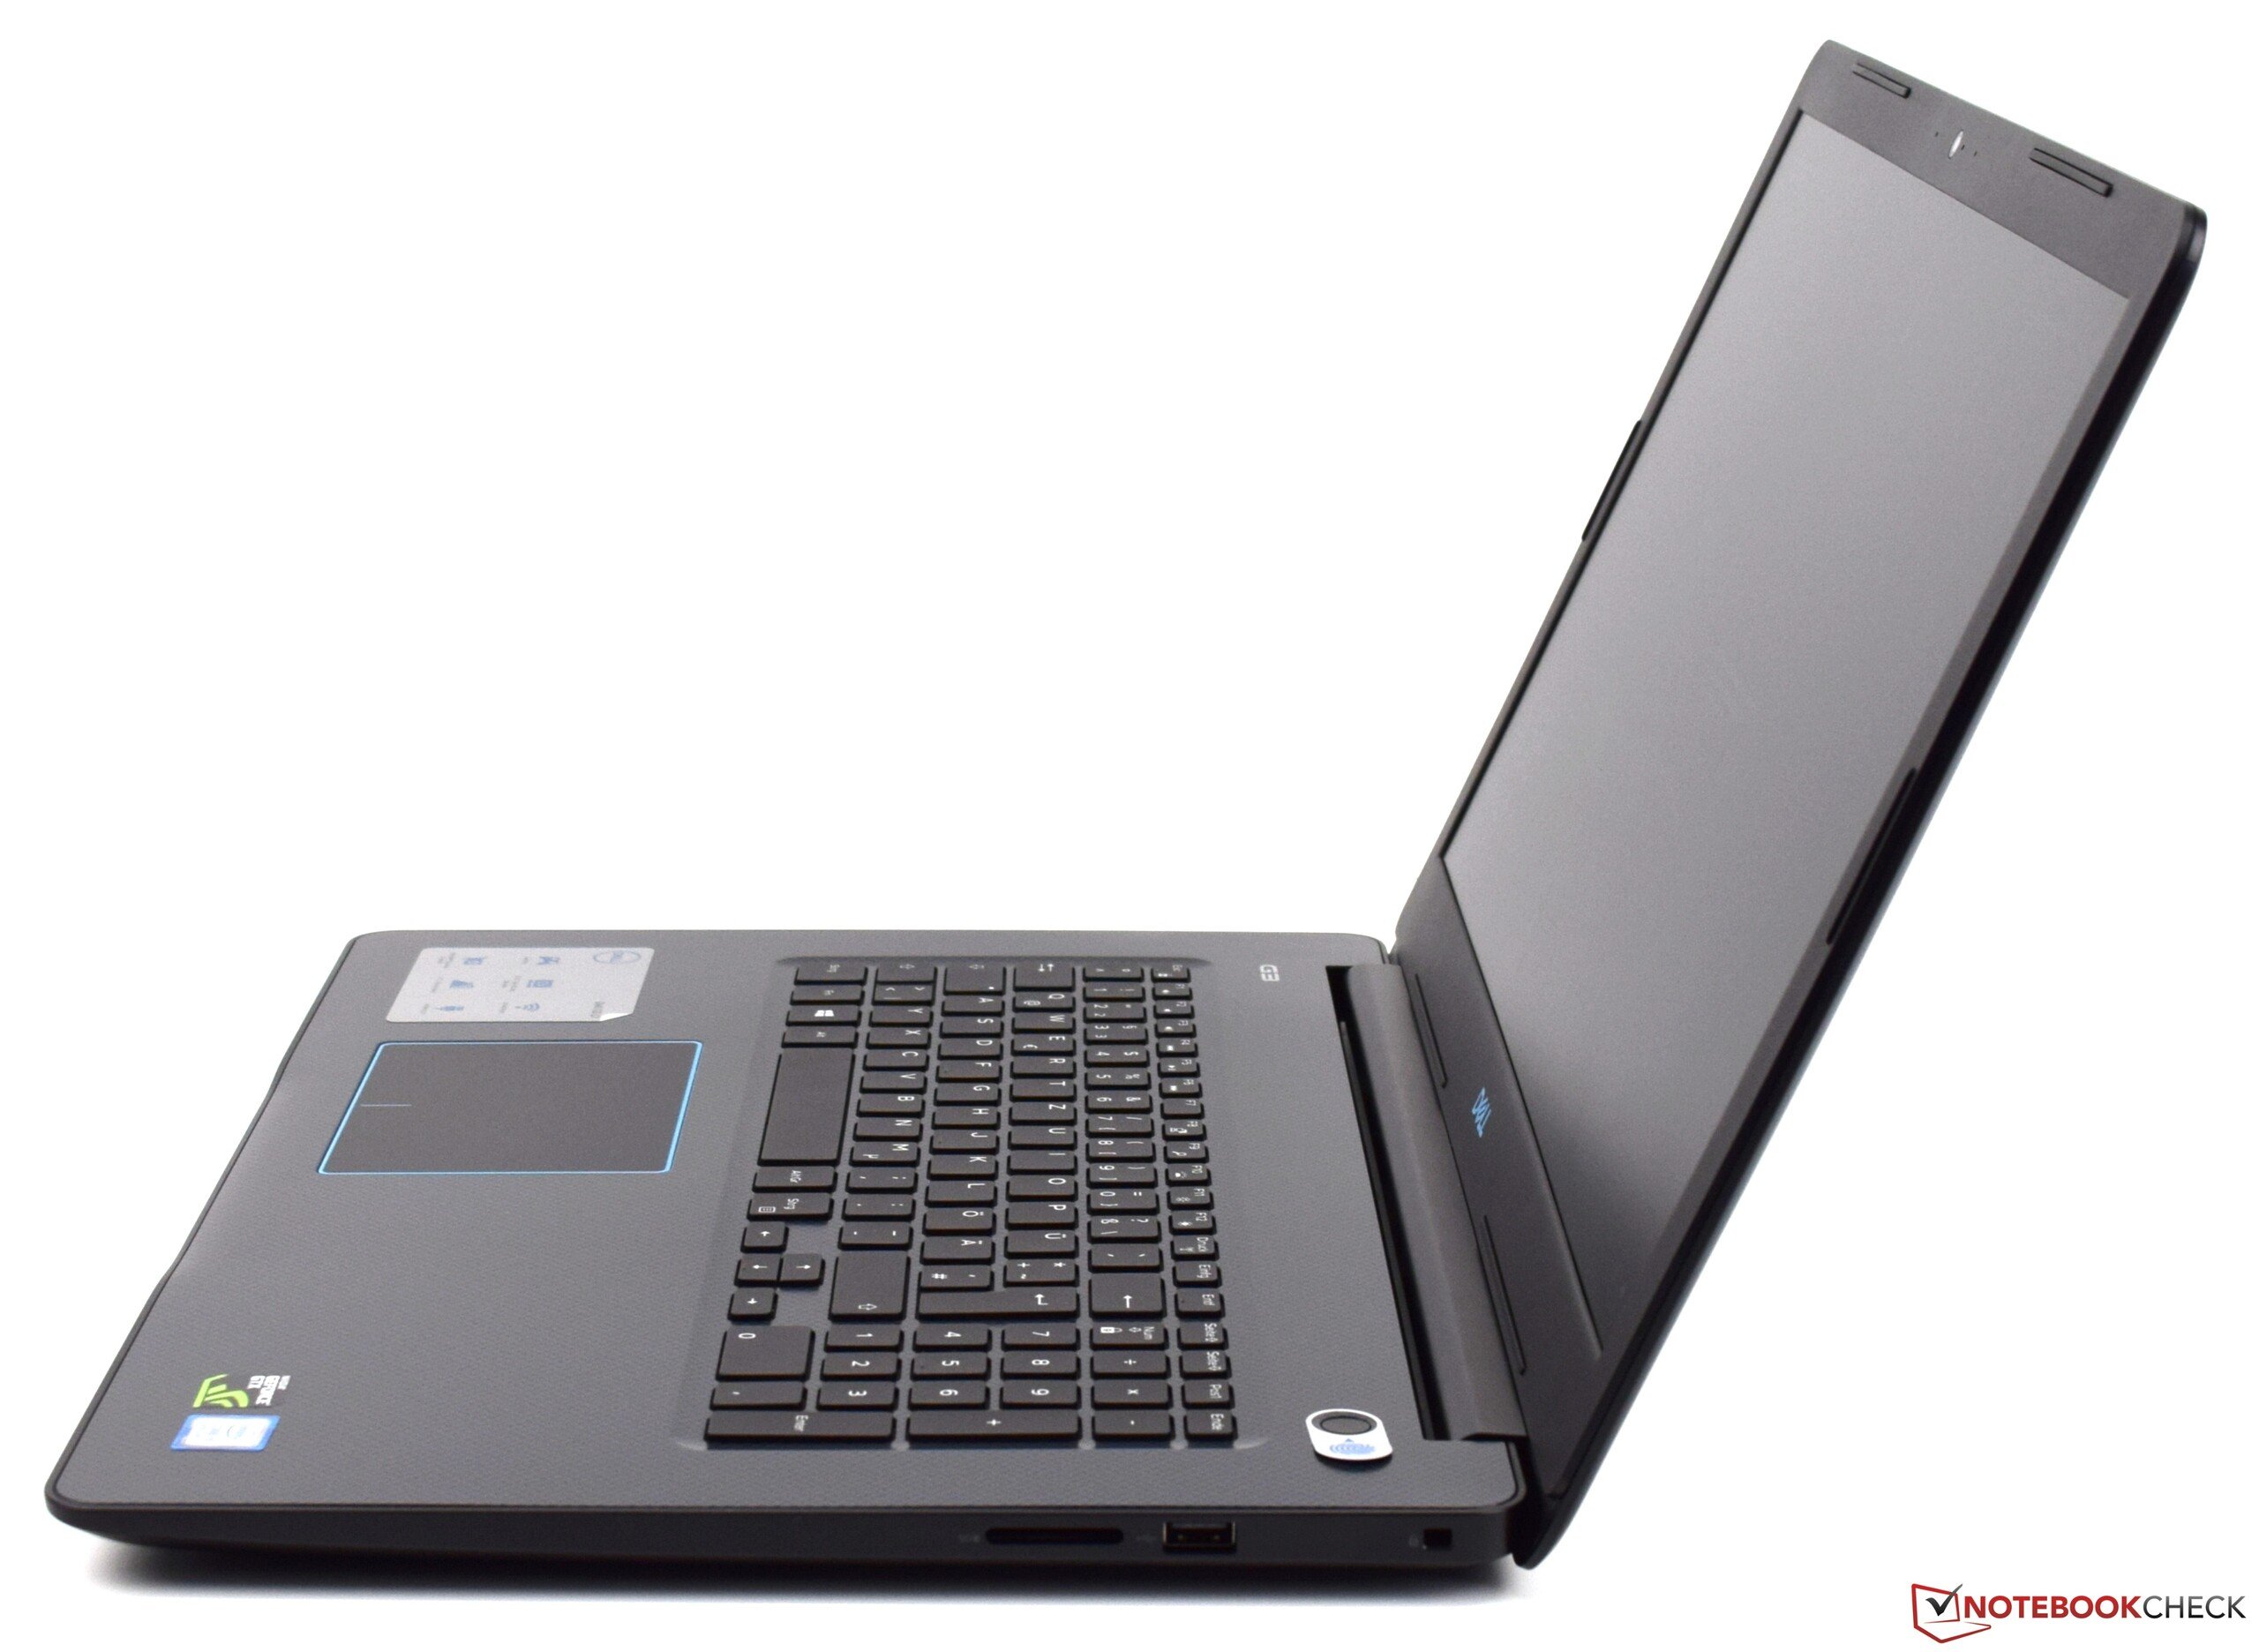
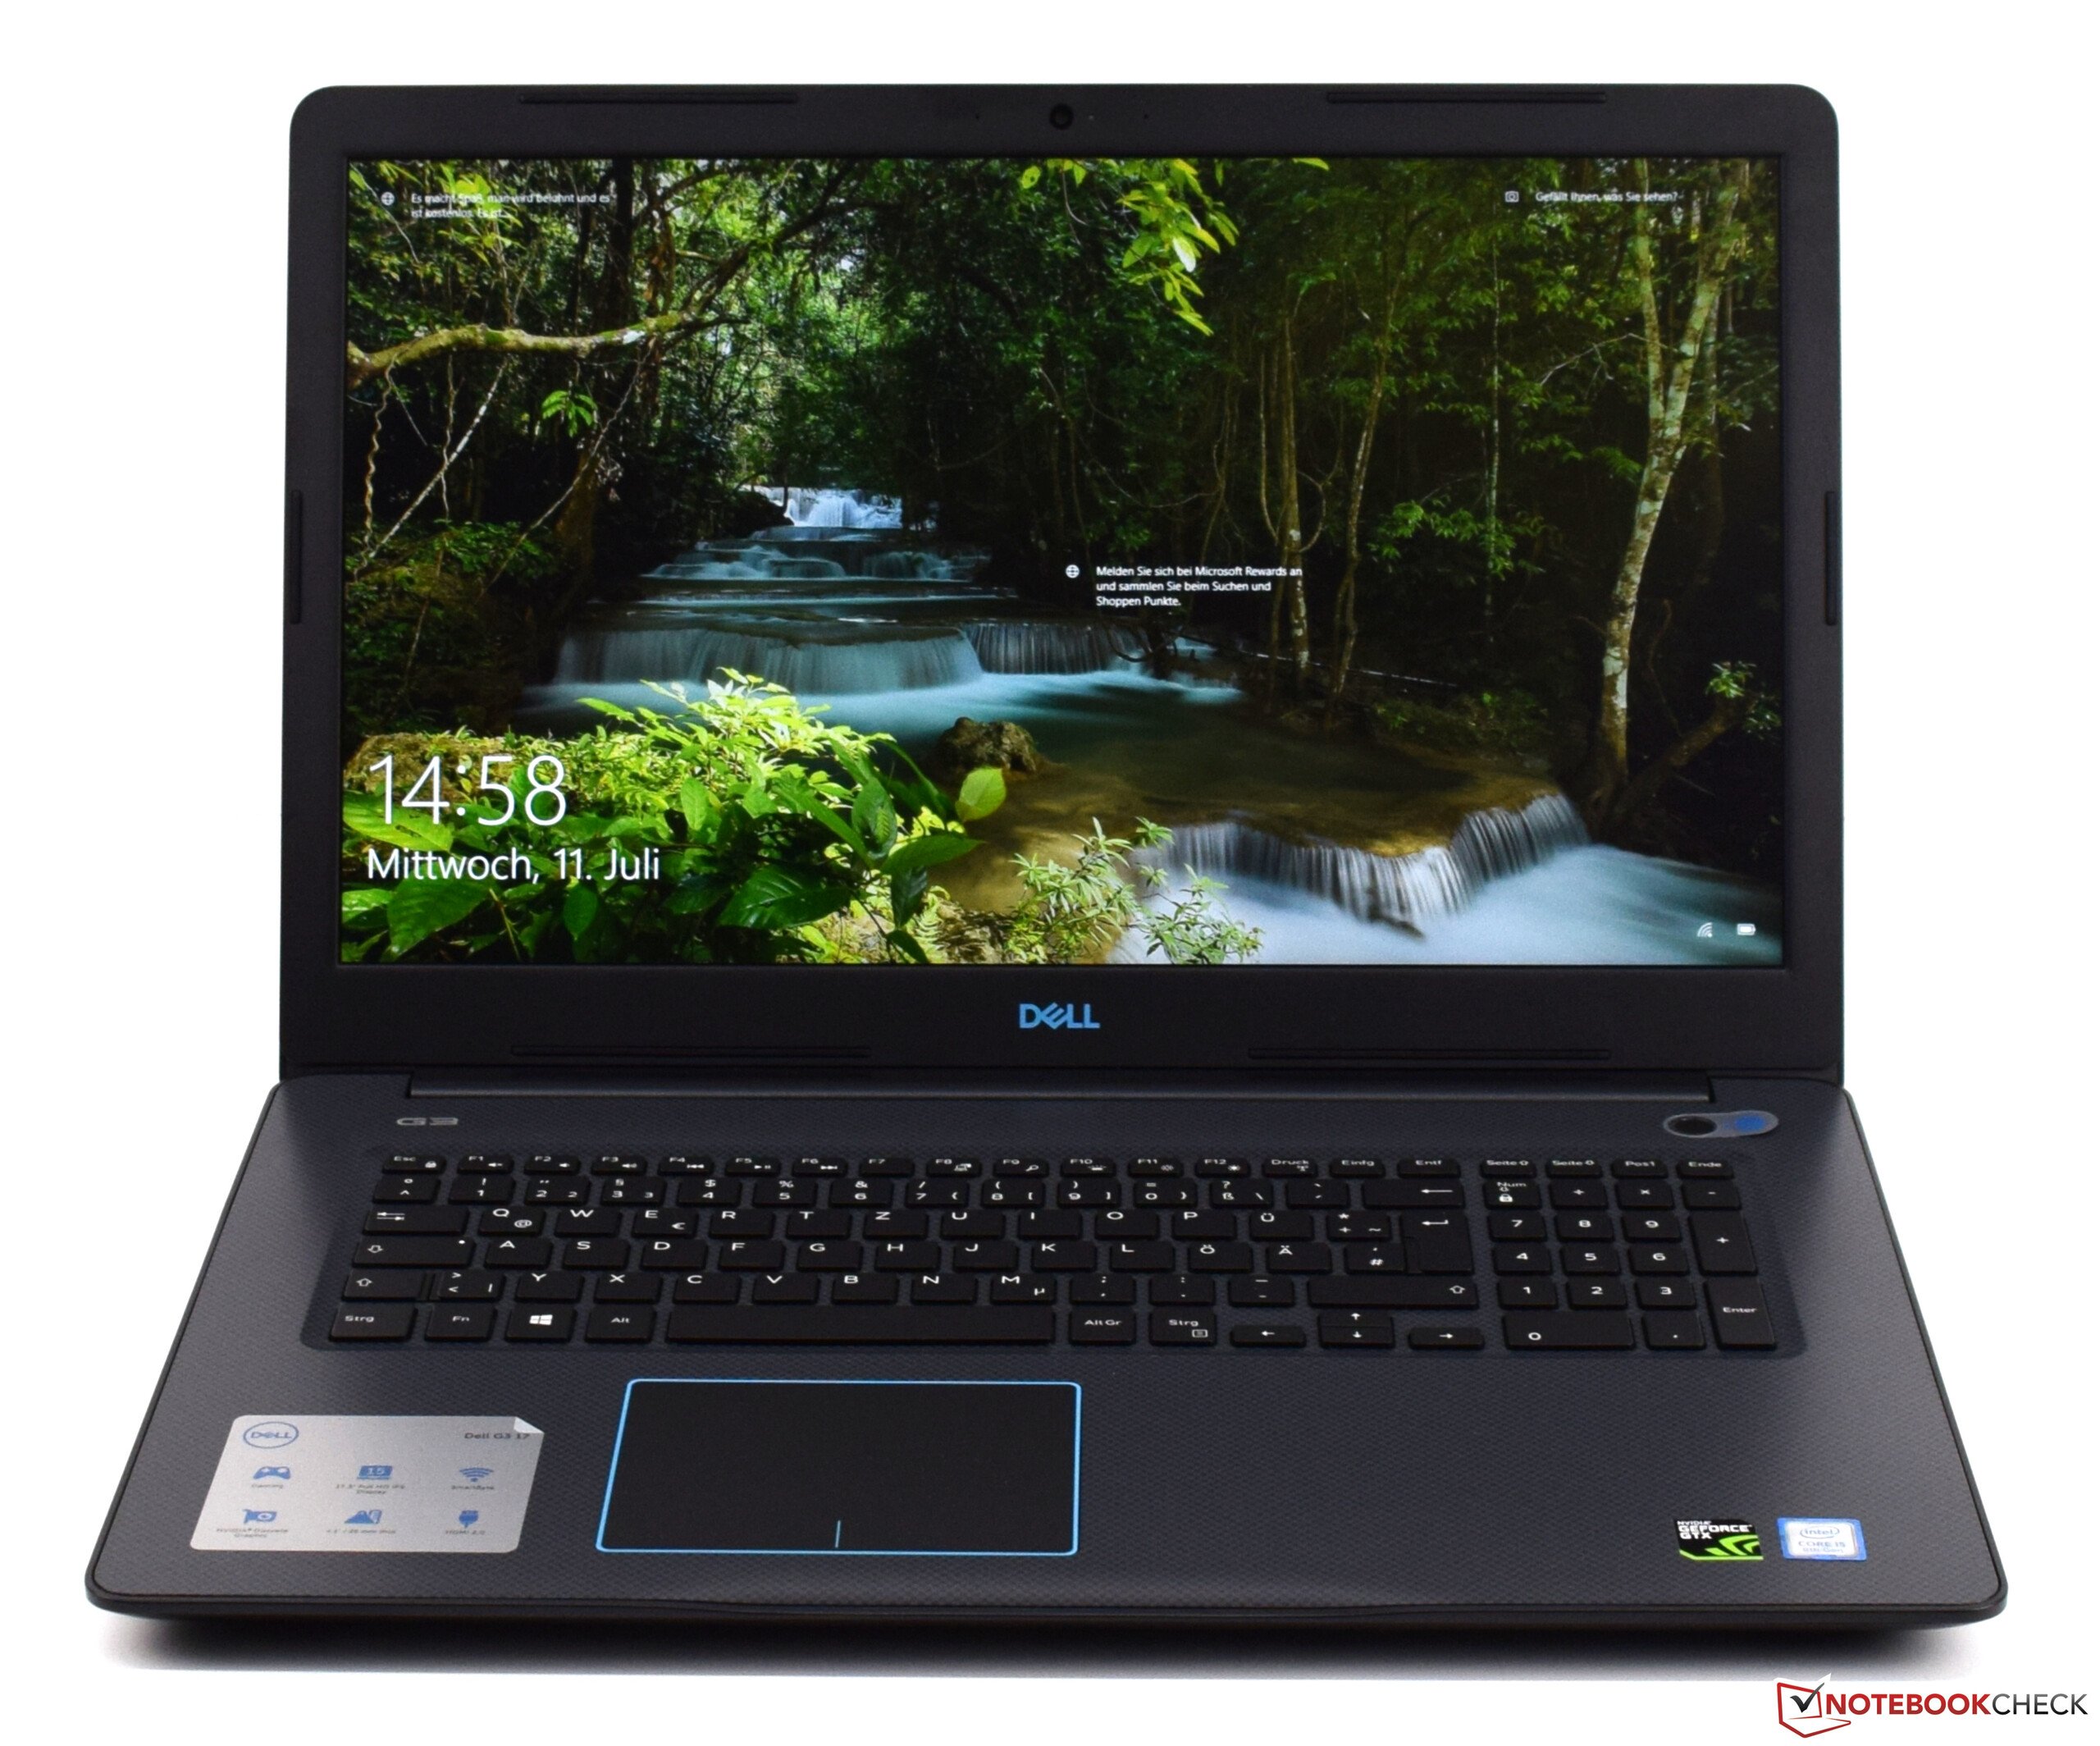
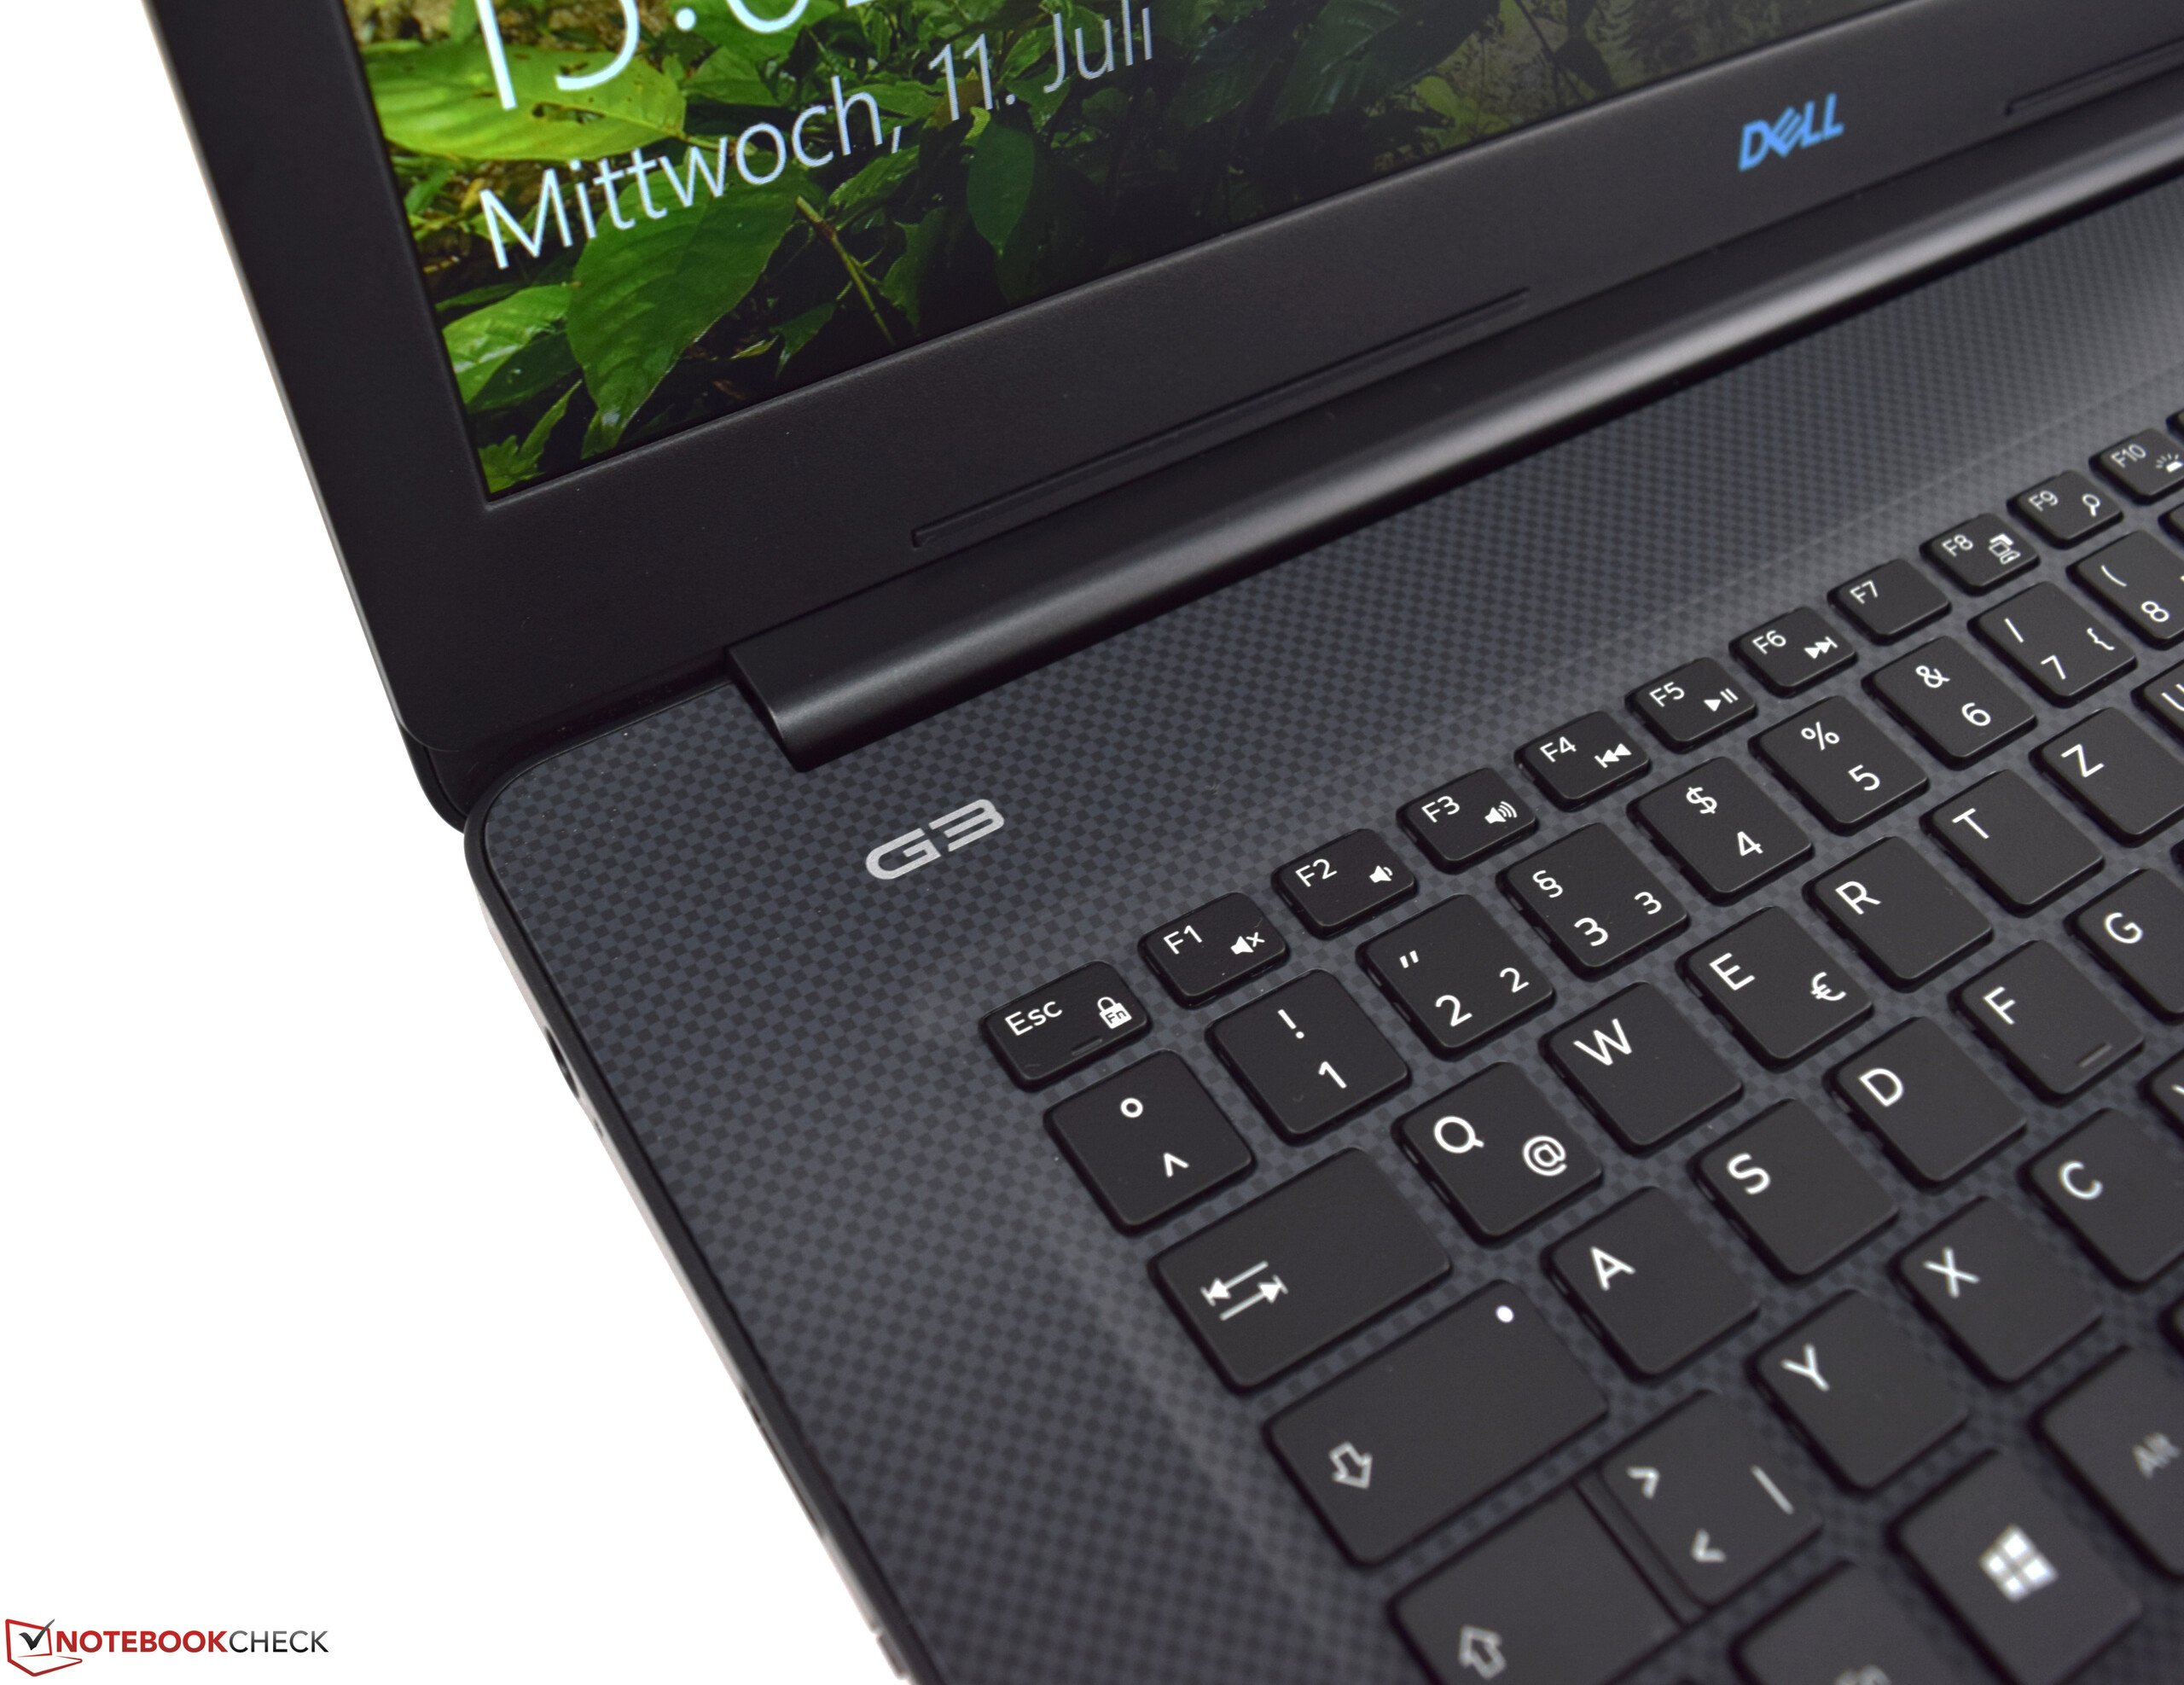
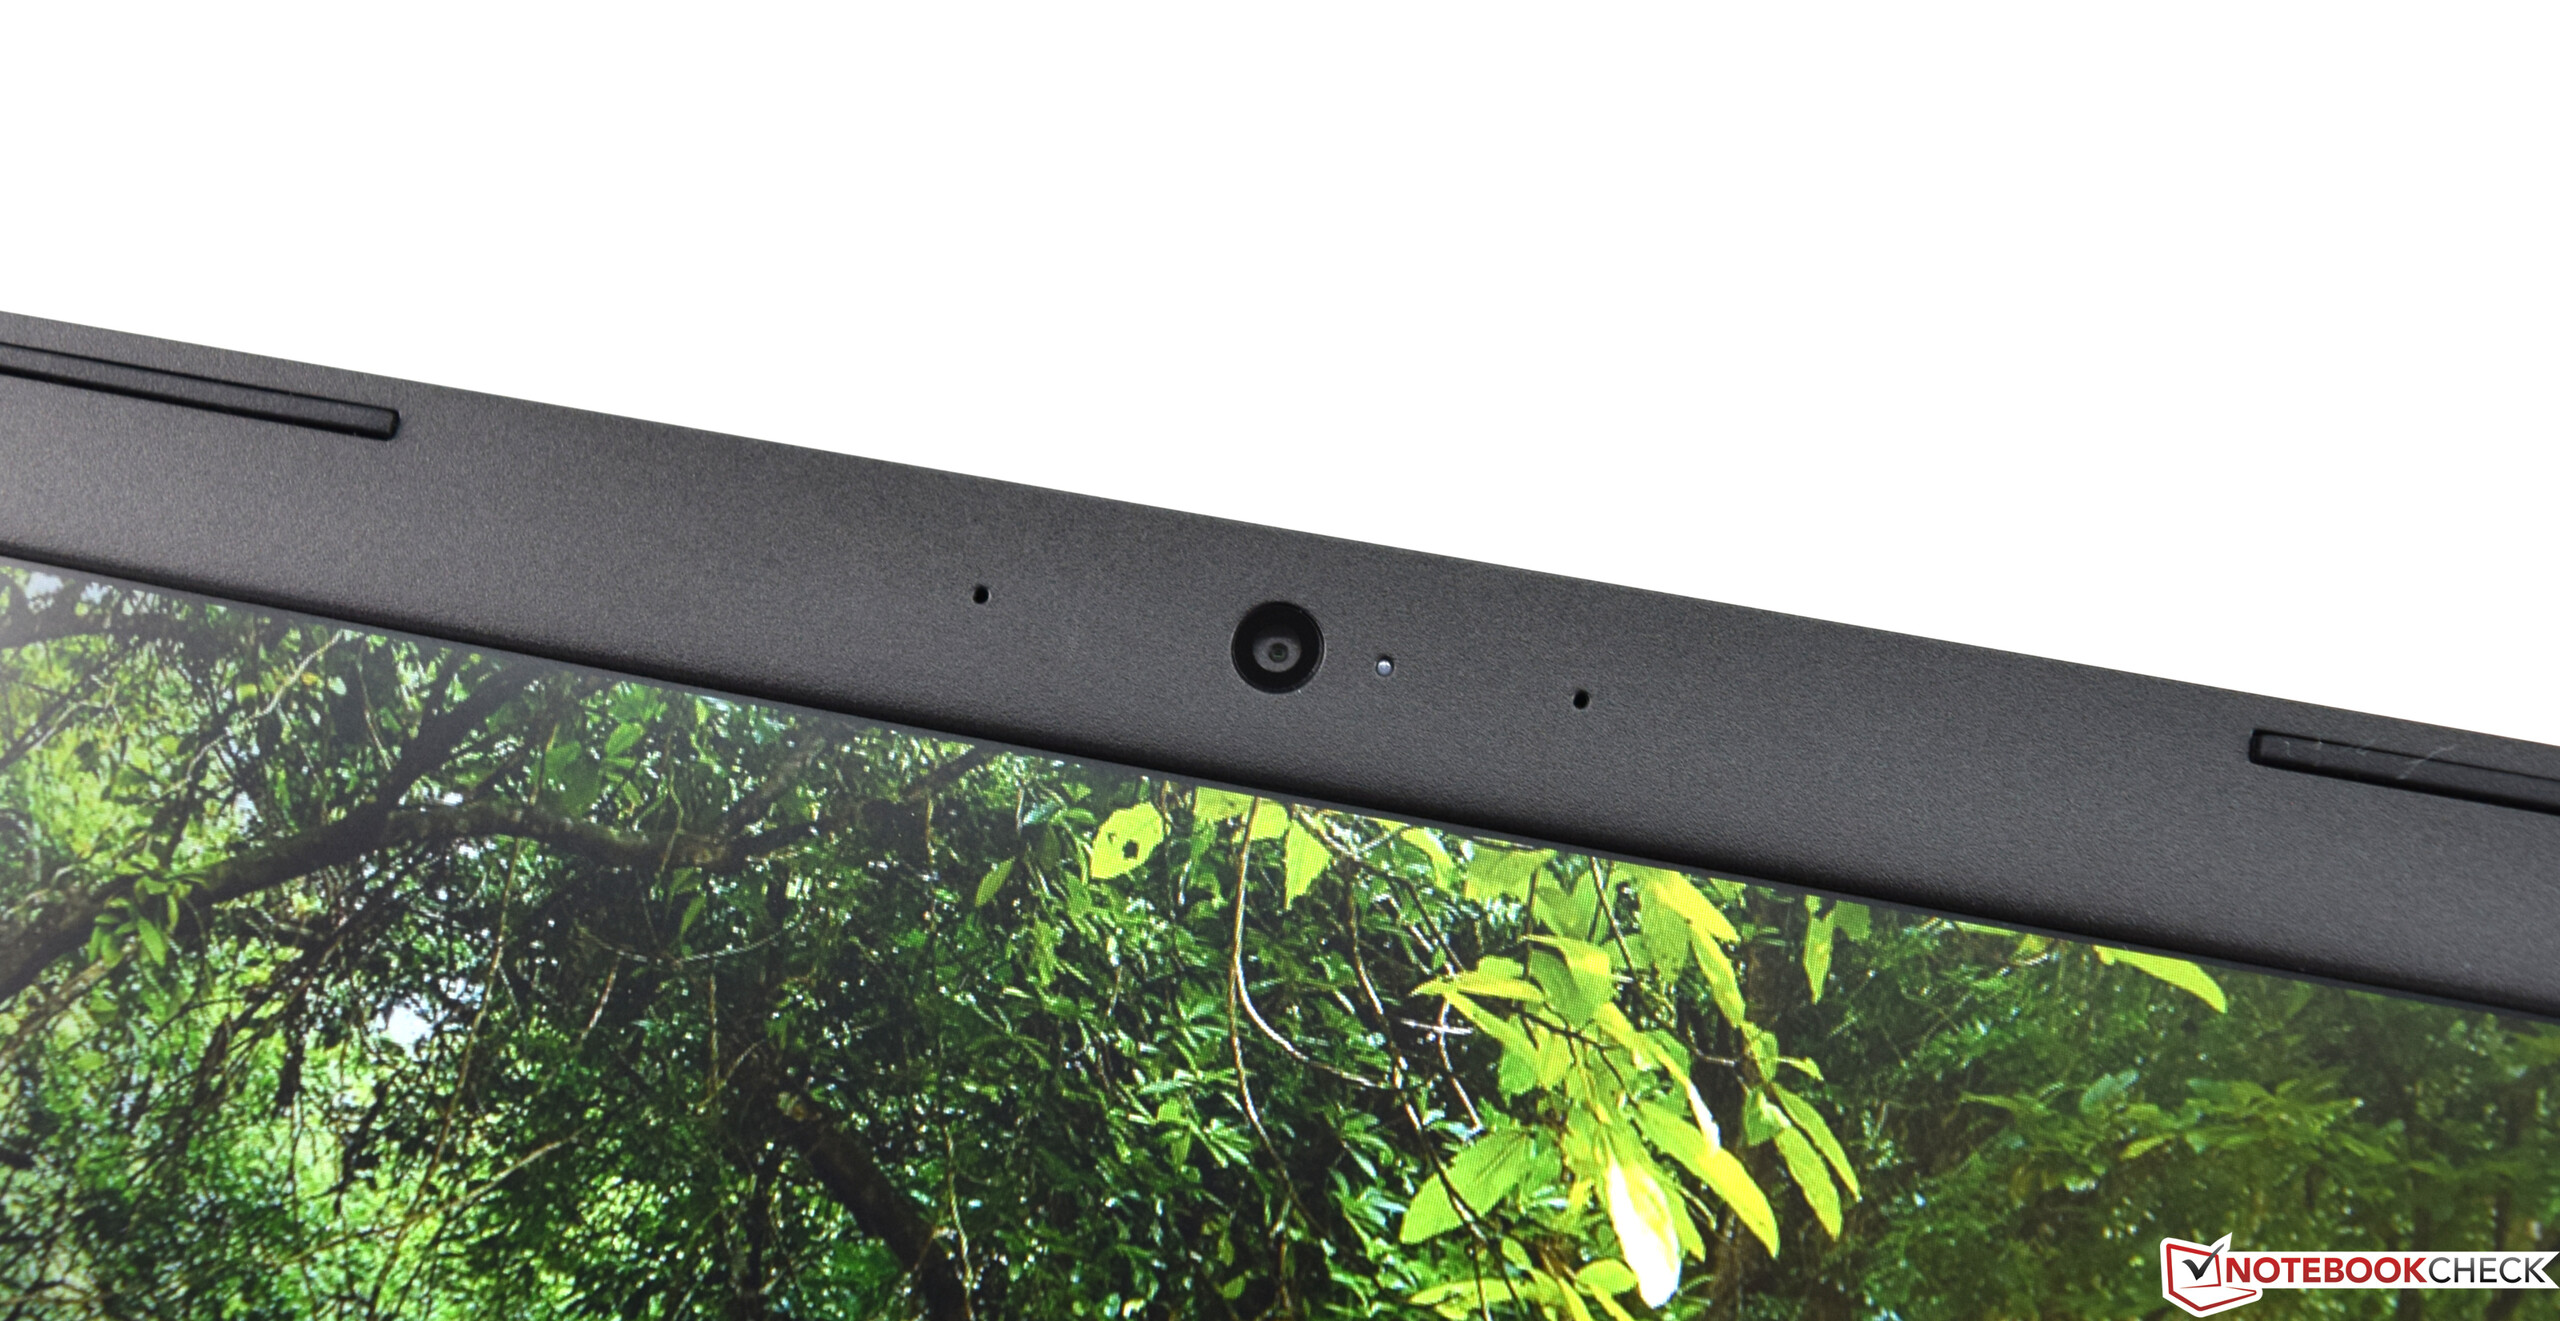
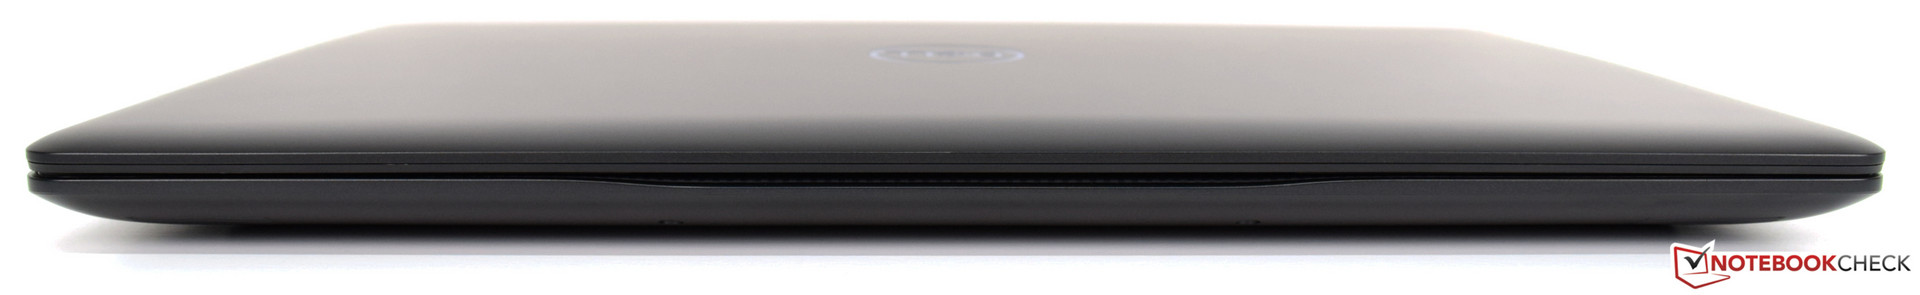
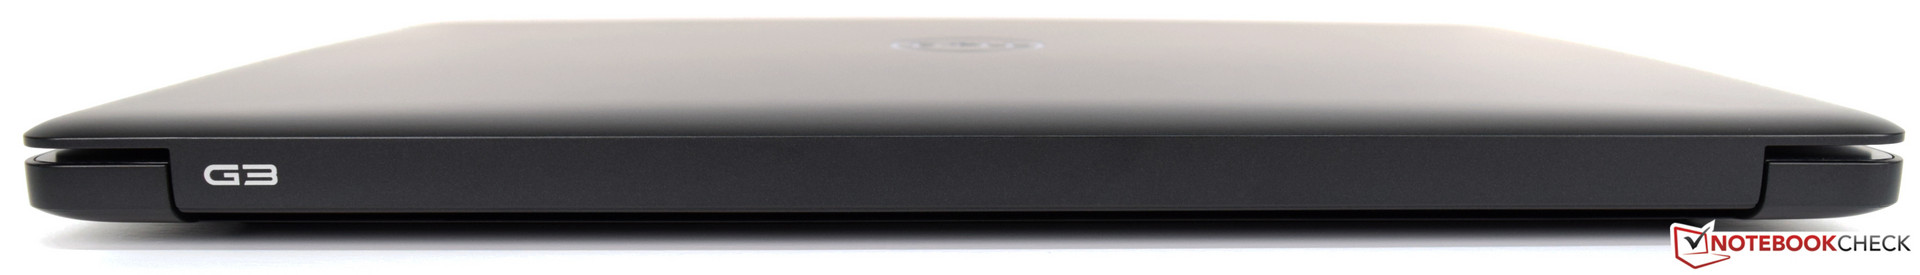
Por melhor que possa parecer, há também alguns motivos para reclamar. A carcaça, que é feito principalmente de plástico, não deixa uma impressão reconhecível, e as impressões digitais ficam rapidamente visíveis na tampa da tela mate. Embora a Dell não cometa muitos erros no assunto extenso da tela, no nosso caso, a pronunciada turvação deixa um gosto ruim. De outra forma, a tela IPS oferece uma cobertura de espaço de cores muito boa, uma superfície de tela mate e um brilho decente.
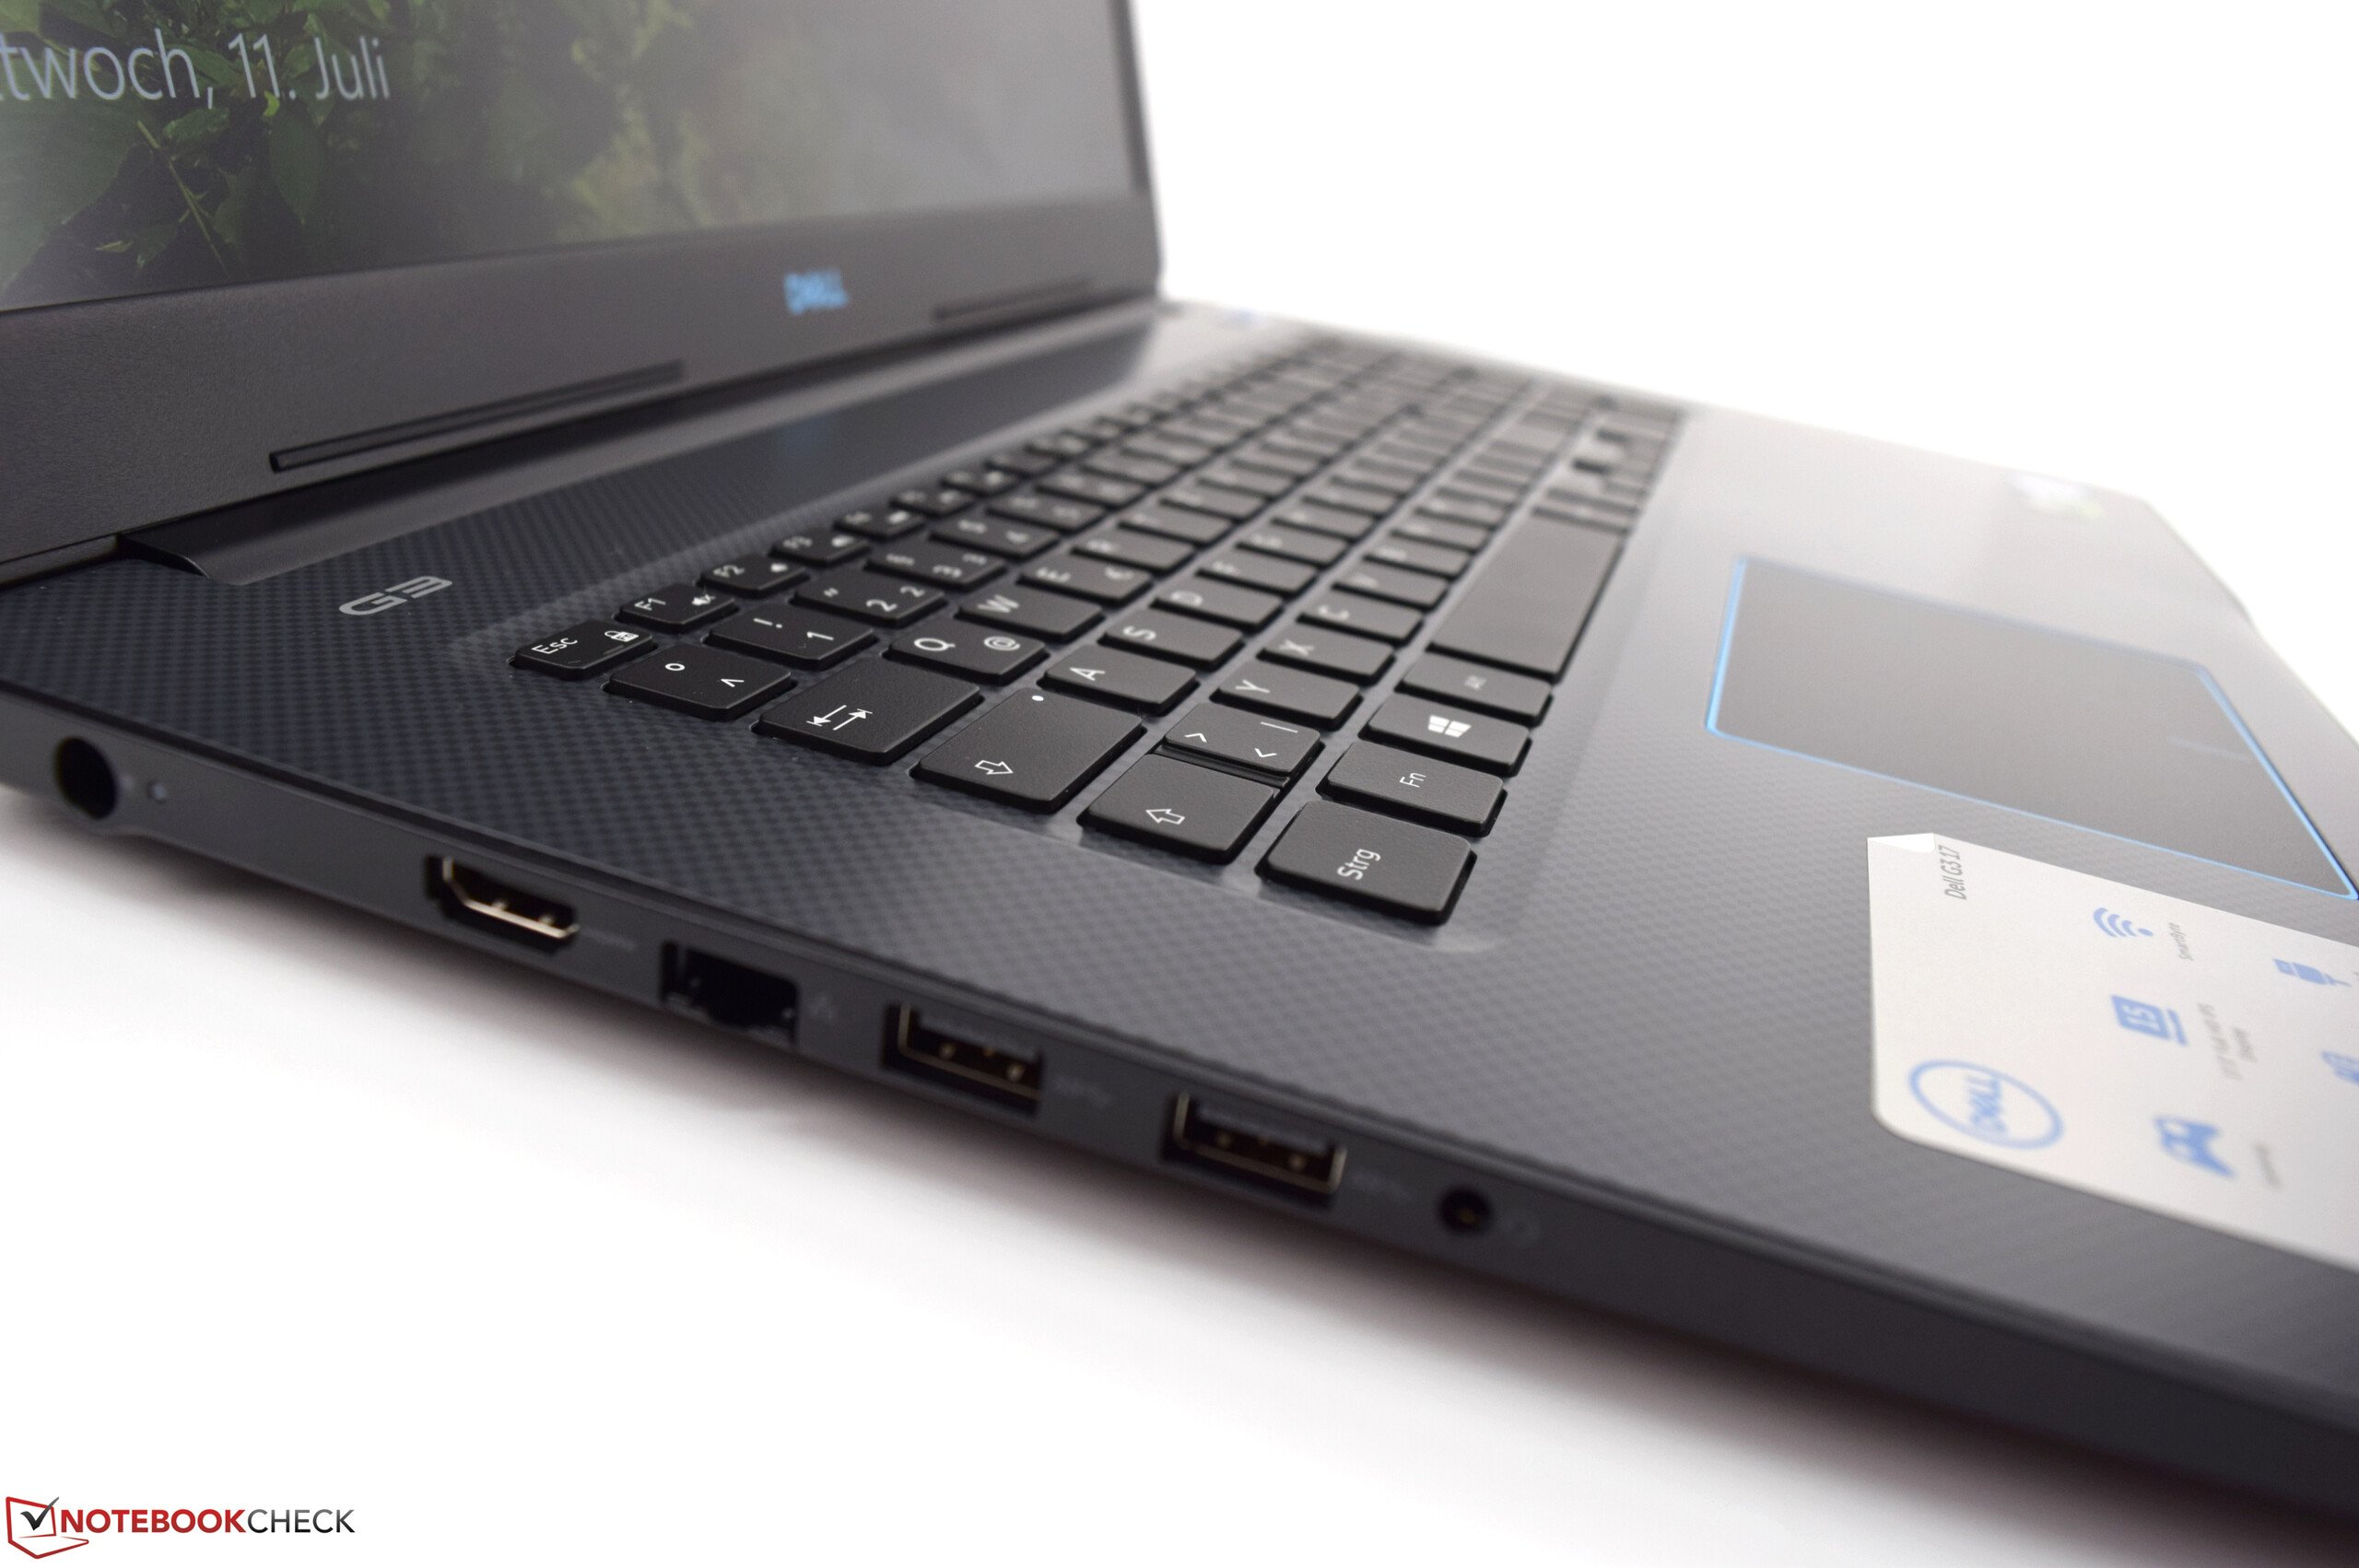
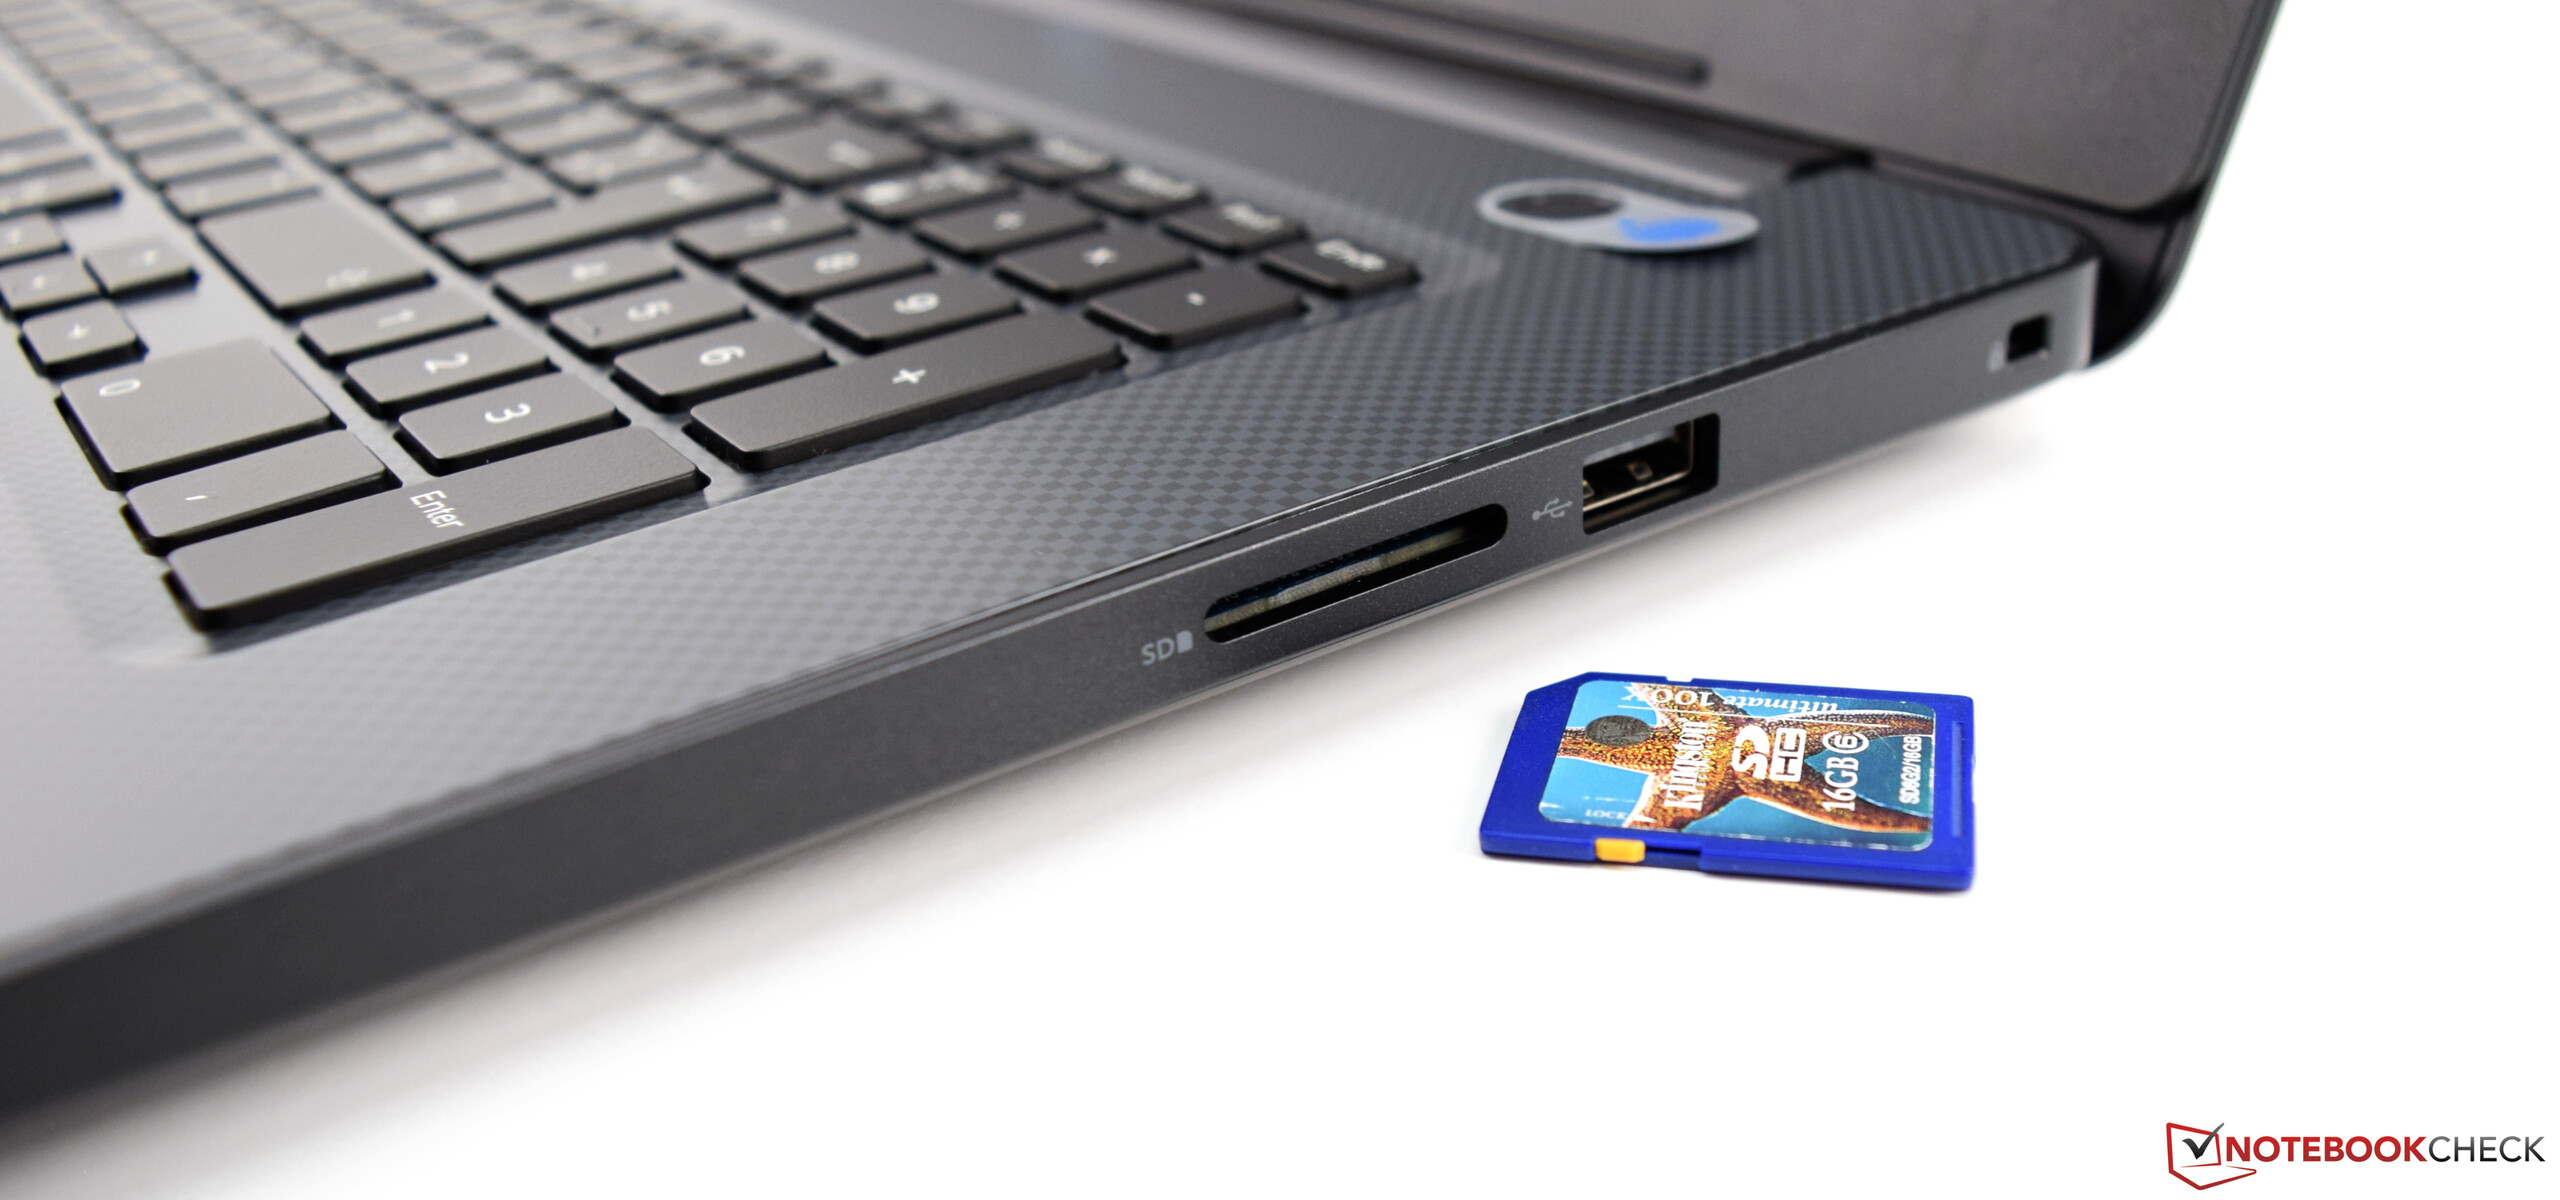
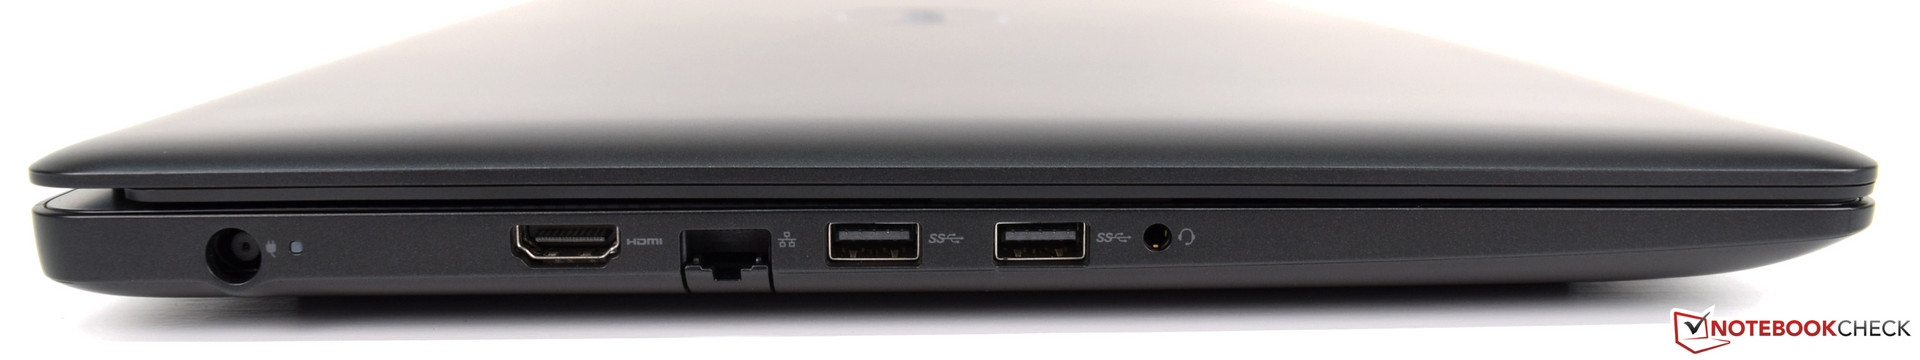
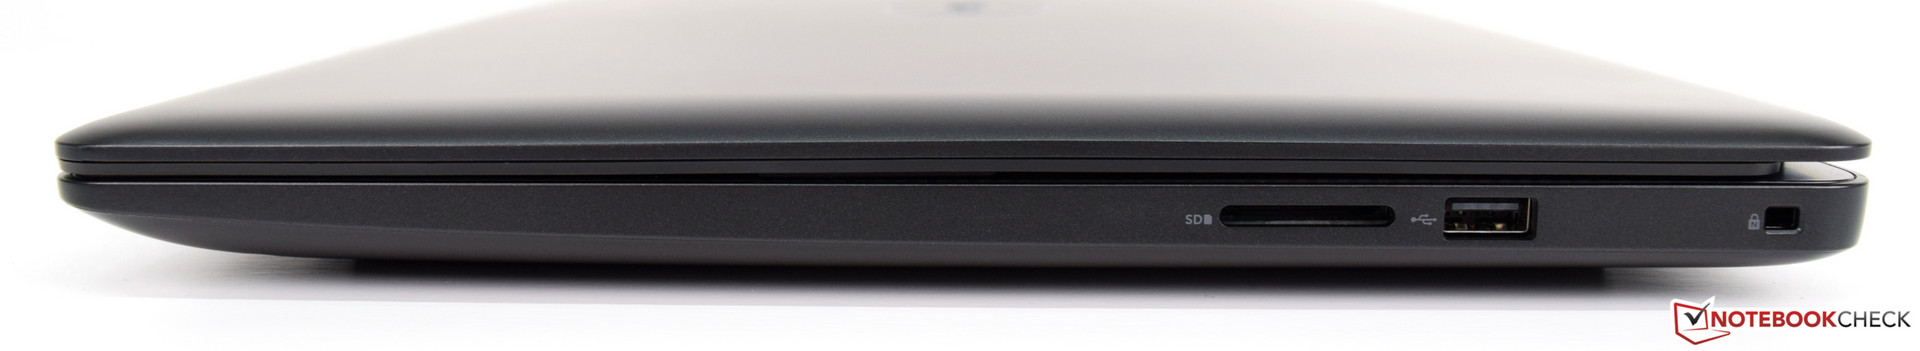
Embora o leitor de cartões de armazenamento permaneça significativamente abaixo da média, estamos satisfeitos com o fato de que a Dell ainda oferece isso, pois, na maioria das vezes, ele é removido sem substituição. Também esperávamos muito mais no desempenho do WLAN, já que o Dell G3 17 3779 permaneceu cerca de 50% atrás da classe do dispositivo.
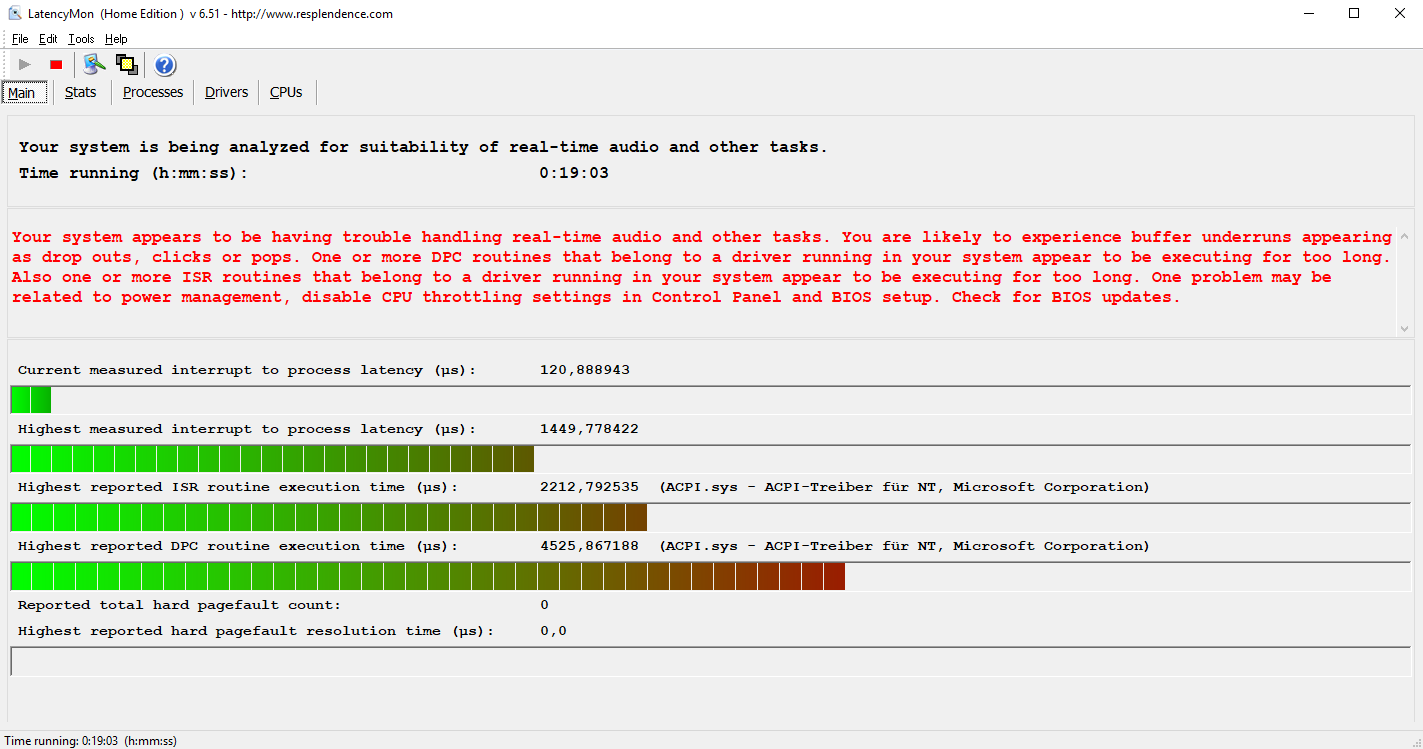
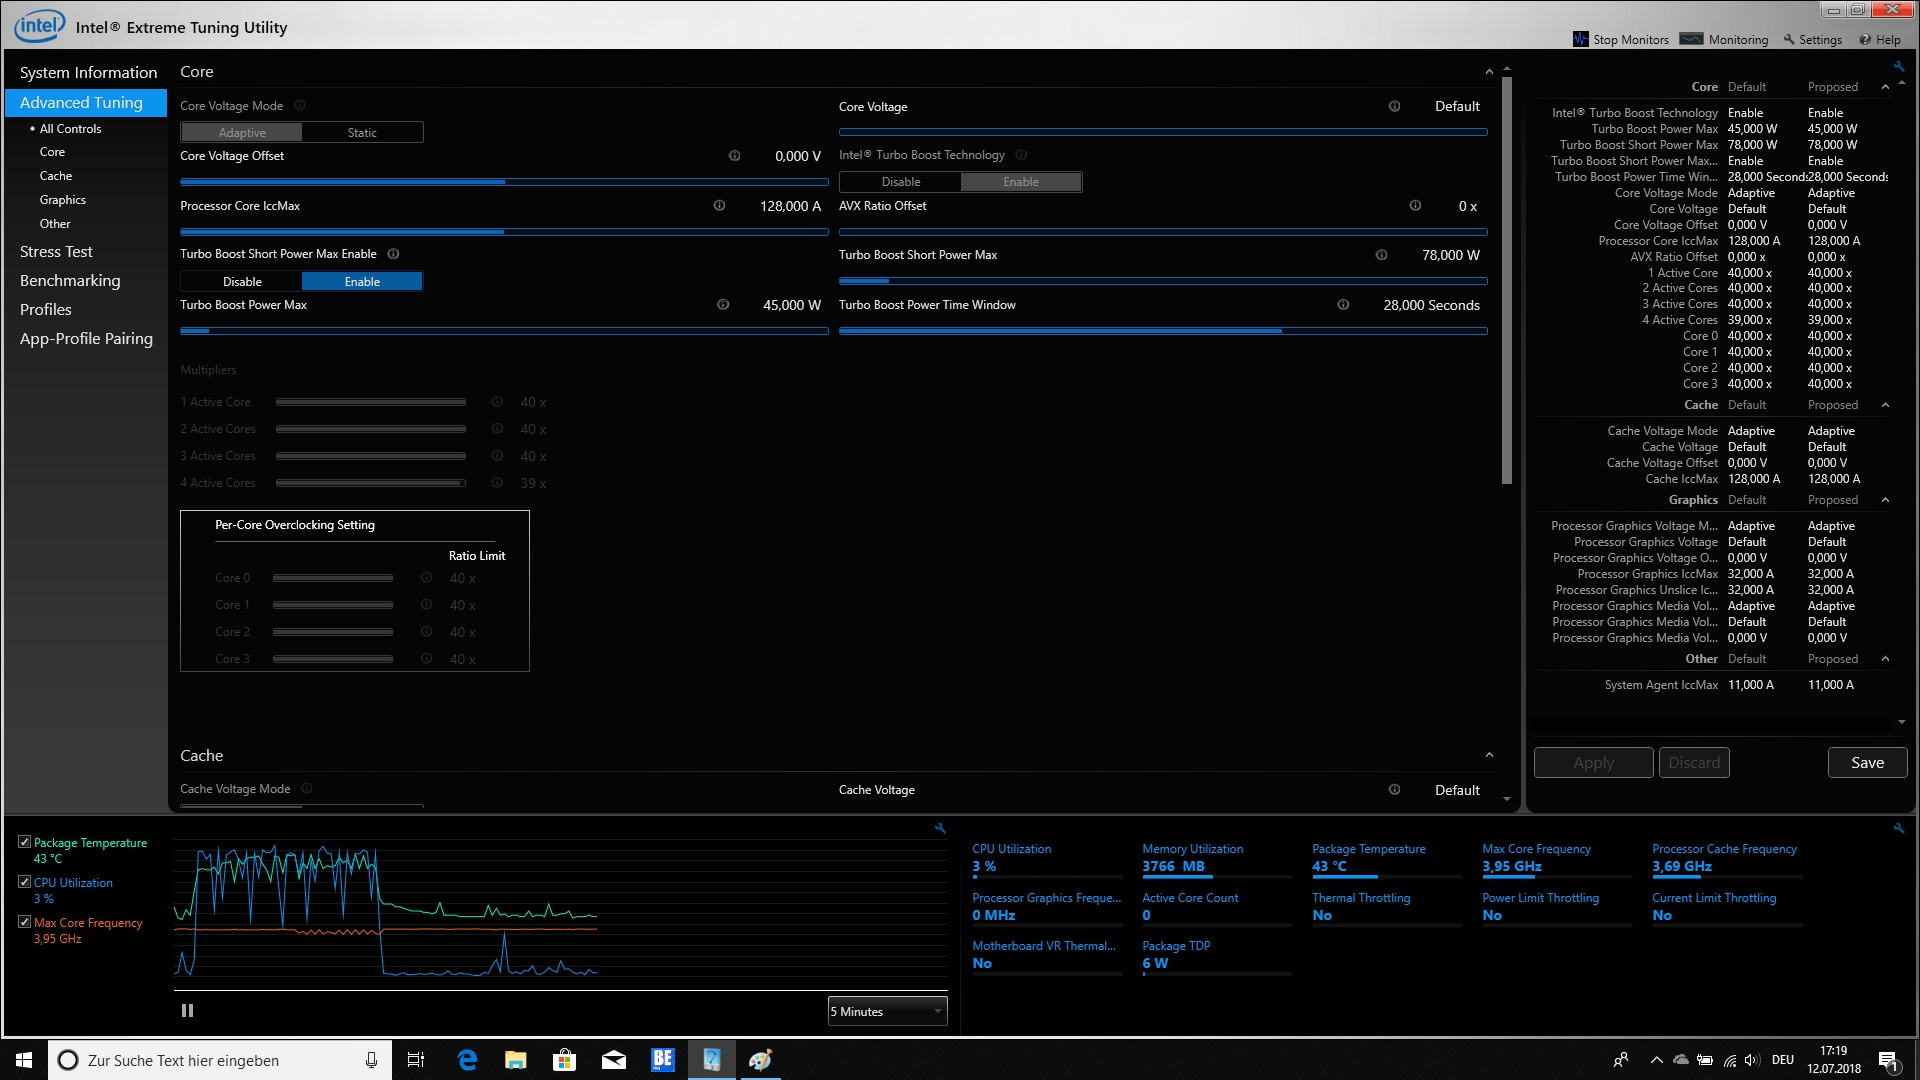
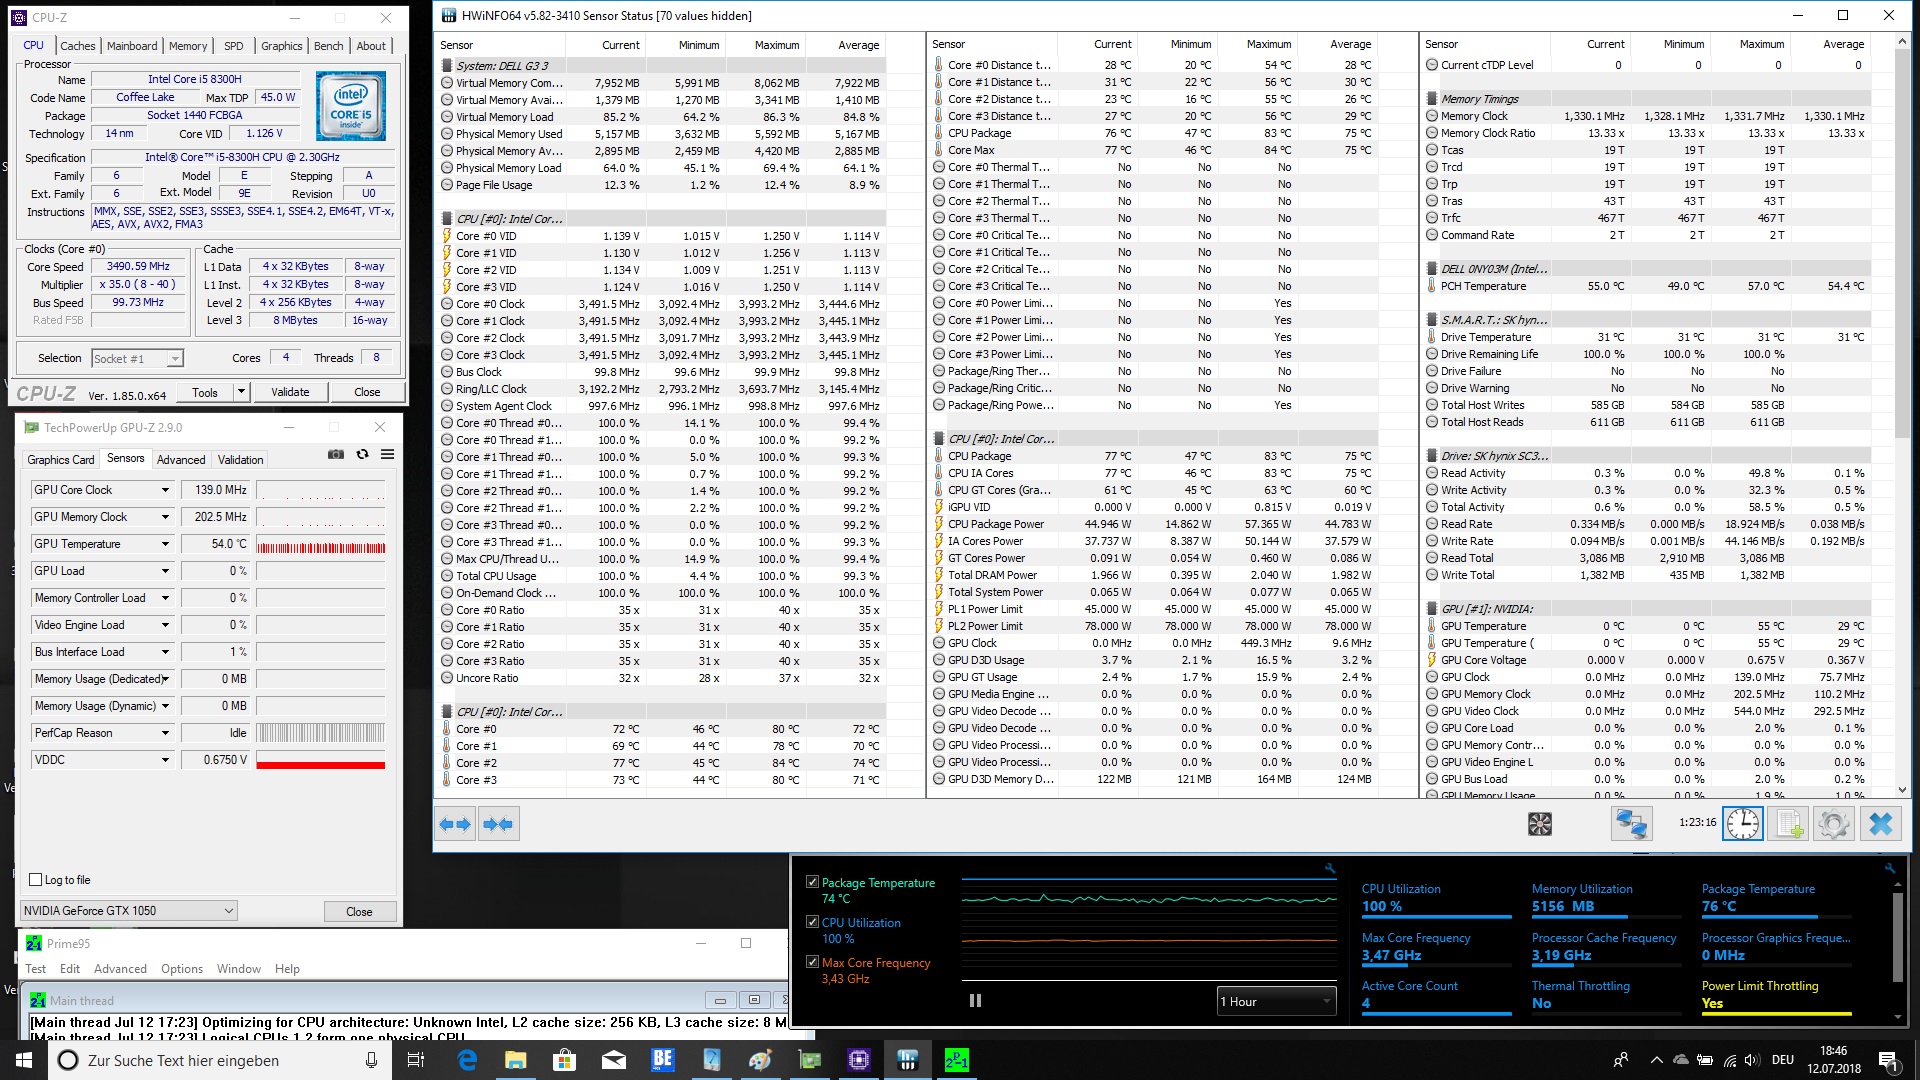
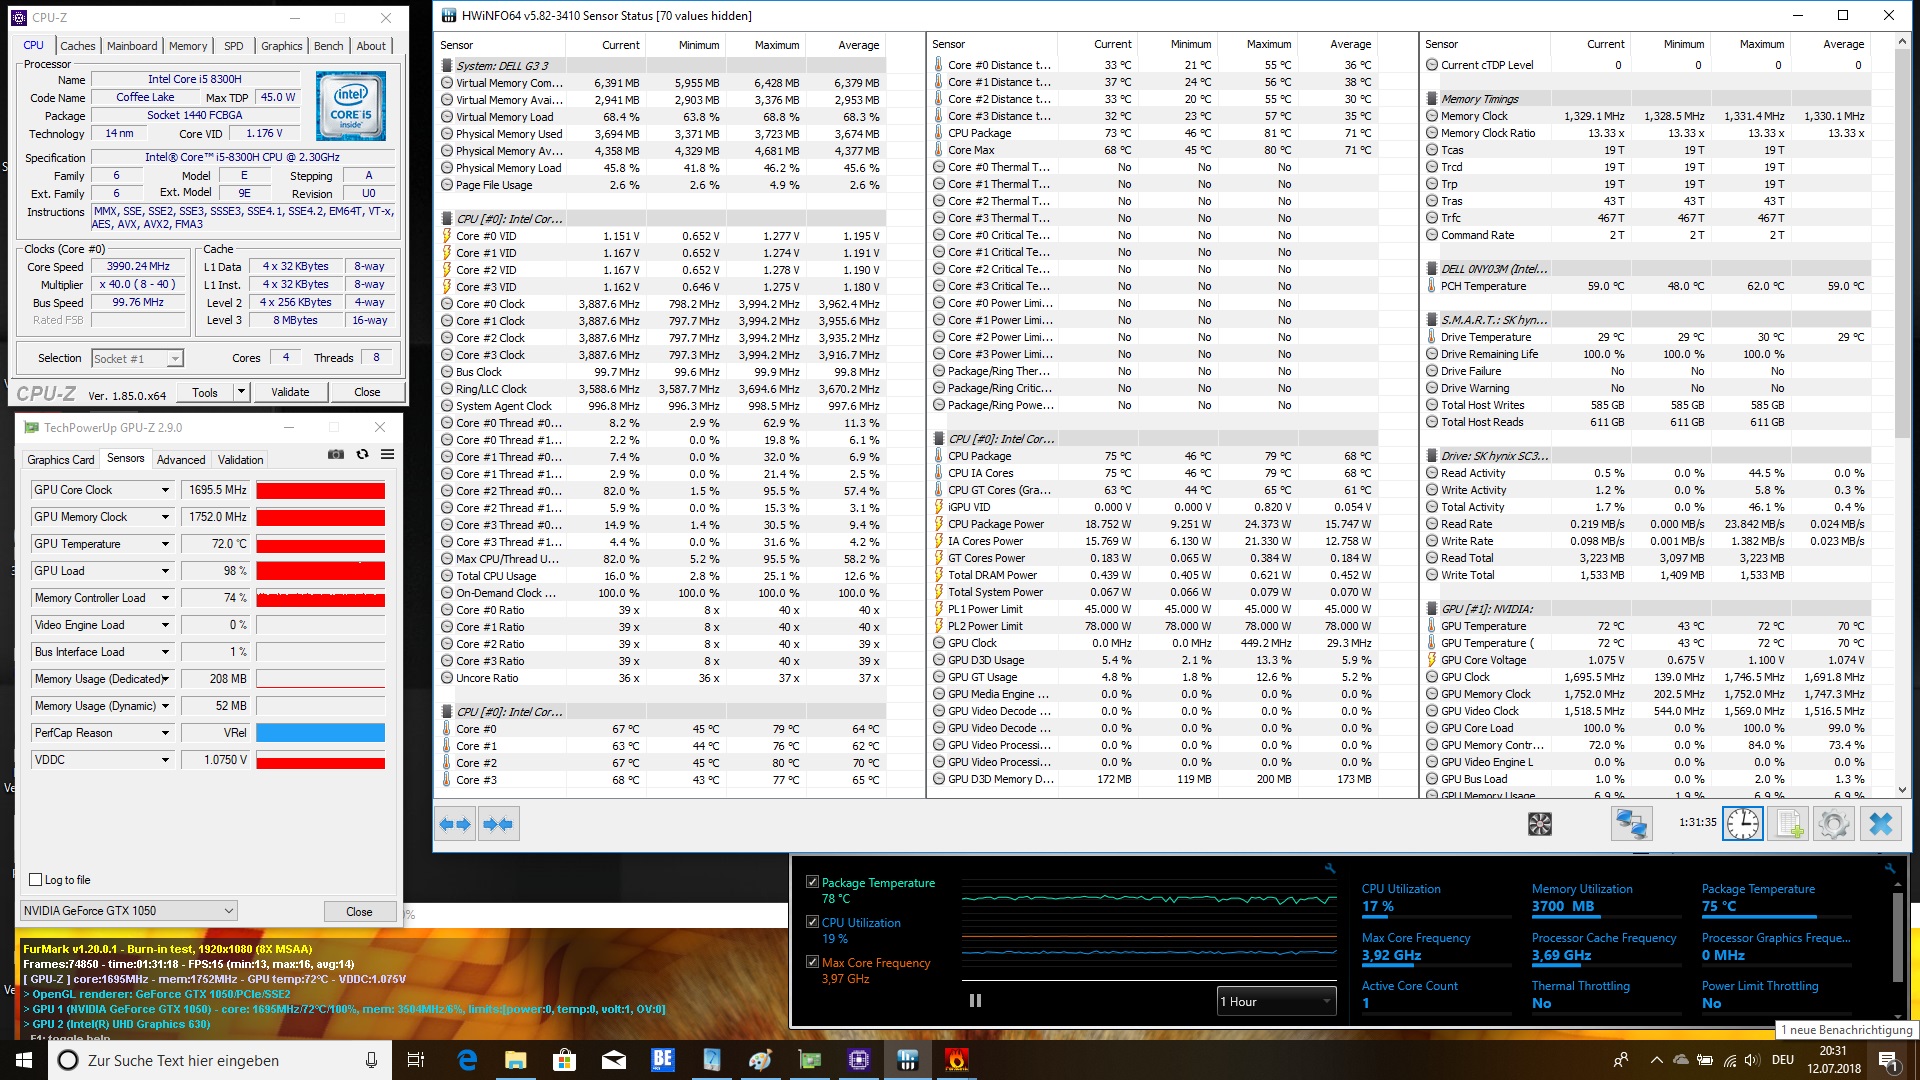
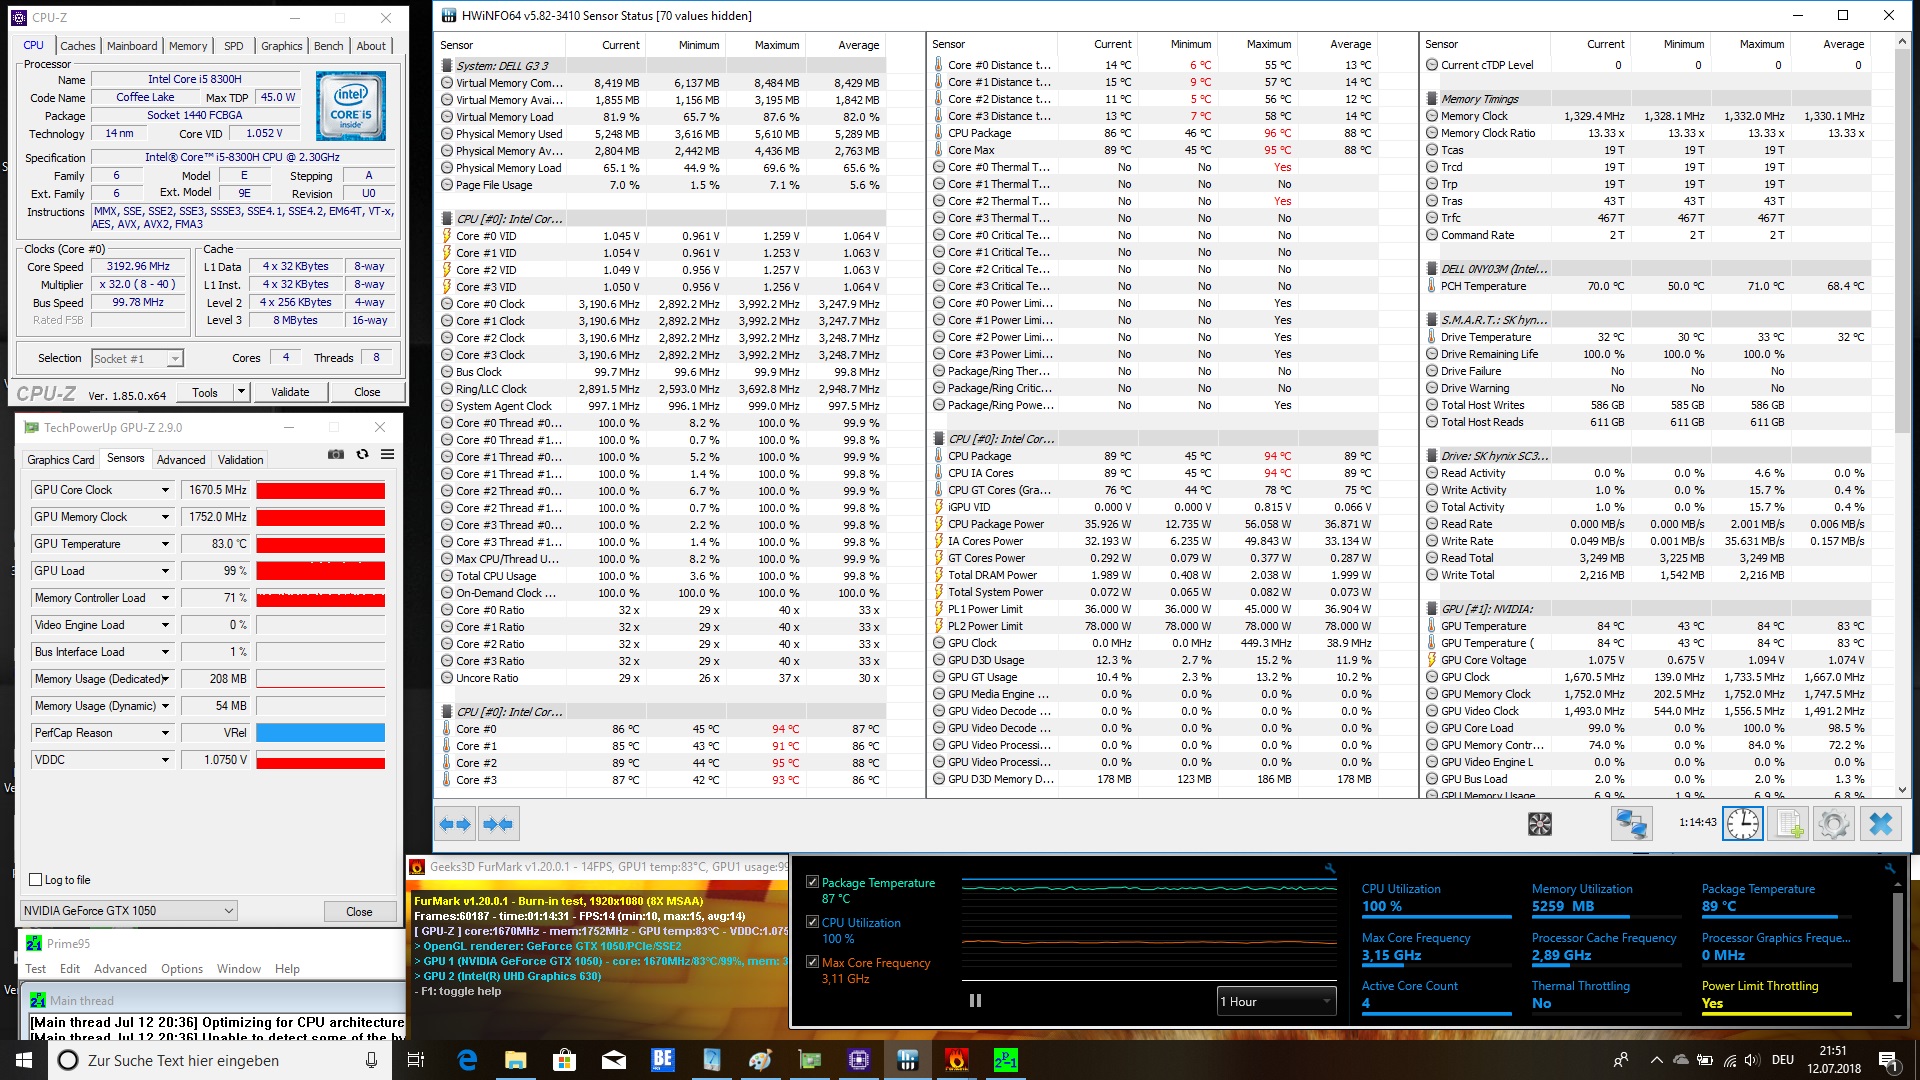
As temperaturas da carcaça são um pouco altas em nossa opinião. Devido ao acúmulo de calor, há um afogamento térmico para a CPU, mas, felizmente, isso não tem um efeito muito extremo. Um Intel Core i7-8750H pode ter mais dificuldade aqui.
Finalmente, podemos dizer que a Dell oferece um dispositivo de jogos decente com o G3 17 3779 sem deixar um enorme buraco no seu orçamento familiar.
Dell G3 17 3779
-
07/19/2018 v6(old)
Sebastian Bade