 Deutsch
 English
 Español
 Français
 Italiano
 Nederlands
 Polski
 Português
 Русский
 Türkçe
 Svenska
 Chinese
 Magyar
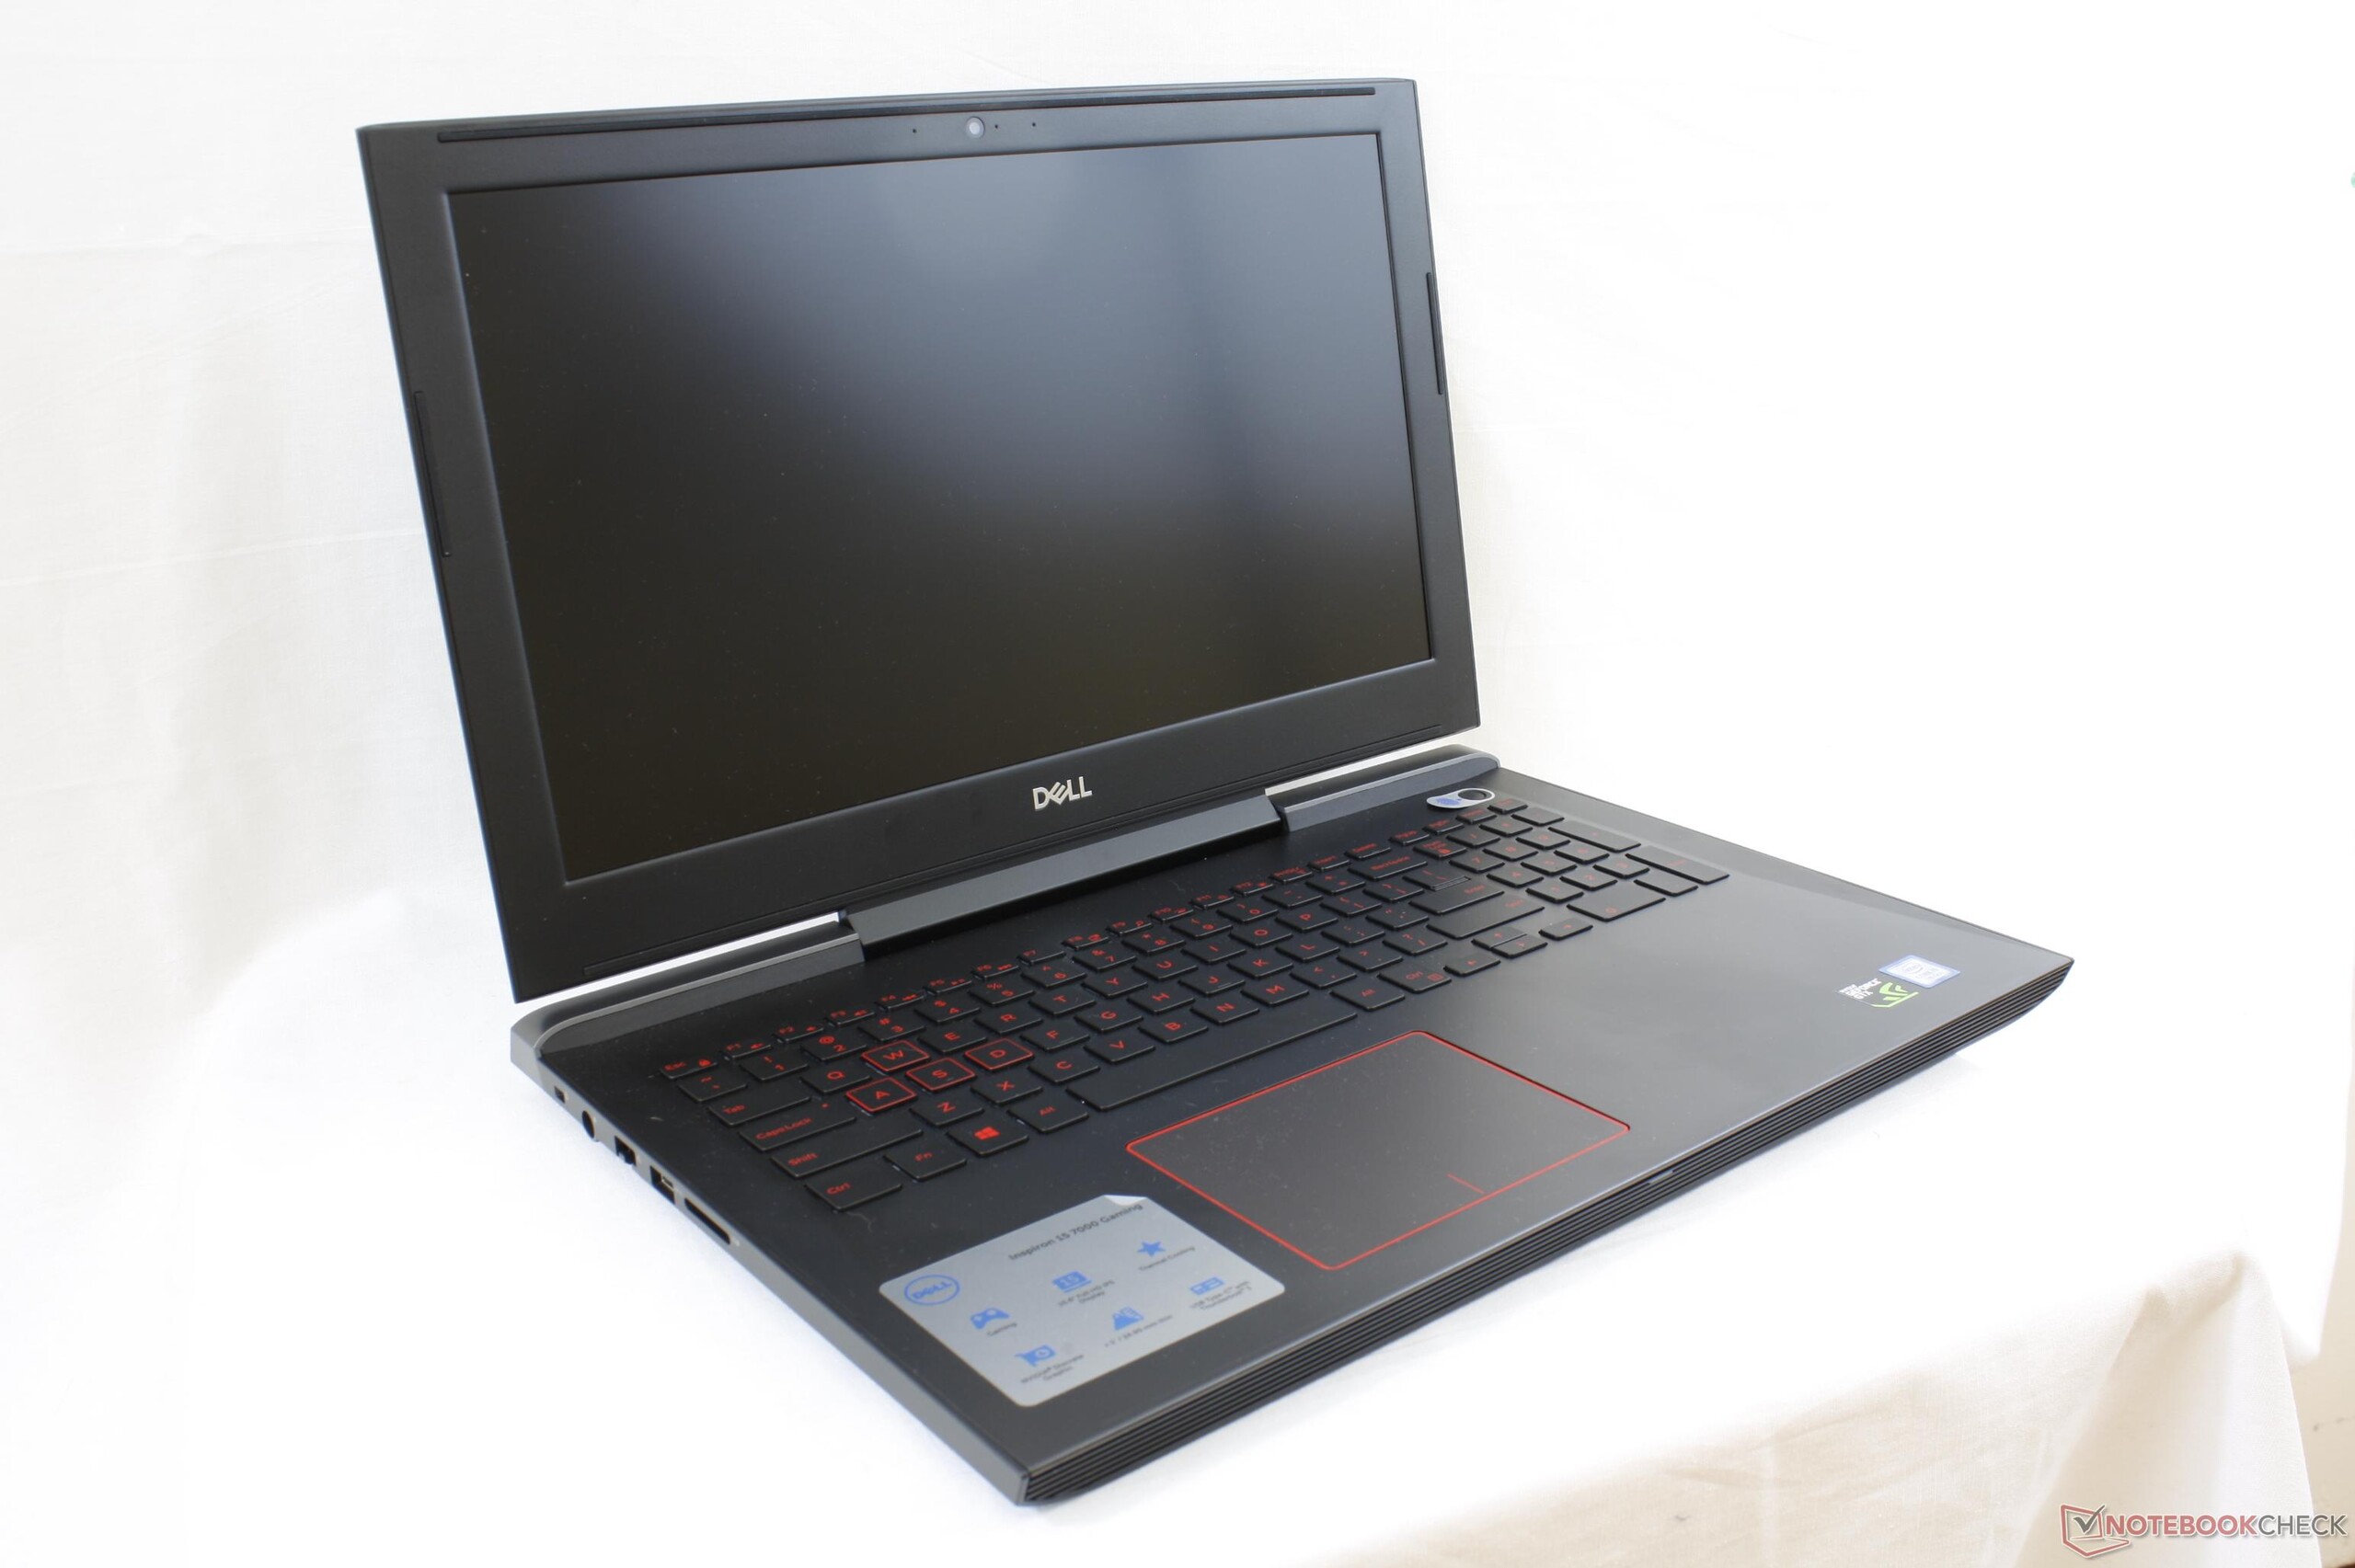
Breve Análise do Portátil Dell Inspiron 15 7000 7577 (i5-7300HQ, GTX 1060 Max-Q)
| SD Card Reader | |
| average JPG Copy Test (av. of 3 runs) | |
| Dell XPS 15 9560 (i7-7700HQ, UHD) | |
| Dell Inspiron 15 7000 7577 | |
| Dell Inspiron 15 7000 7567 | |
| maximum AS SSD Seq Read Test (1GB) | |
| Dell XPS 15 9560 (i7-7700HQ, UHD) | |
| Dell Inspiron 15 7000 7577 | |
| Dell Inspiron 15 7000 7567 | |
| Networking | |
| iperf3 transmit AX12 | |
| Dell XPS 15 9560 (i7-7700HQ, UHD) | |
| Dell Inspiron 15 7000 7577 | |
| Dell Inspiron 15 7000 7567 (jseb) | |
| iperf3 receive AX12 | |
| Dell Inspiron 15 7000 7577 | |
| Dell XPS 15 9560 (i7-7700HQ, UHD) | |
| Dell Inspiron 15 7000 7567 (jseb) | |
| |||||||||||||||||||||||||
iluminação: 91 %
iluminação com acumulador: 235.4 cd/m²
Contraste: 841:1 (Preto: 0.28 cd/m²)
ΔE Color 5.6 | 0.5-29.43 Ø5
ΔE Greyscale 3.6 | 0.57-98 Ø5.3
55.4% sRGB (Argyll 1.6.3 3D)
35.2% AdobeRGB 1998 (Argyll 1.6.3 3D)
38.32% AdobeRGB 1998 (Argyll 2.2.0 3D)
55.6% sRGB (Argyll 2.2.0 3D)
37.07% Display P3 (Argyll 2.2.0 3D)
Gamma: 2.23
| Dell Inspiron 15 7000 7577 ID: LG Philips LGD053F, Name: 156WF6, Dell P/N: 4XK13, IPS, 15.60, 1920x1080 | Dell Inspiron 15 7000 7567 AU Optronics AUO38ED B156HTN 28H80, TN, 15.60, 1920x1080 | Acer Nitro 5 AN515-51-788E LG Philips LP156WF6-SPK6, IPS, 15.60, 1920x1080 | HP Omen 15-ce002ng AUO42ED, IPS, 15.60, 1920x1080 | Lenovo Legion Y520-15IKBN-80WK001KUS LP156WF6-SPK3, IPS, 15.60, 1920x1080 | |
|---|---|---|---|---|---|
| Display | -2% | 12% | 72% | ||
| Display P3 Coverage | 37.07 | 36.42 -2% | 41.7 12% | 65.8 78% | |
| sRGB Coverage | 55.6 | 54.9 -1% | 62.2 12% | 90.9 63% | |
| AdobeRGB 1998 Coverage | 38.32 | 37.62 -2% | 43.17 13% | 66.5 74% | |
| Response Times | -16% | 11% | -17% | -48% | |
| Response Time Grey 50% / Grey 80% * | 35.6 ? | 36 ? -1% | 35 ? 2% | 43.2 ? -21% | 58.8 ? -65% |
| Response Time Black / White * | 27.6 ? | 36 ? -30% | 22 ? 20% | 31.2 ? -13% | 36 ? -30% |
| PWM Frequency | 21550 ? | ||||
| Screen | -61% | 9% | 36% | -13% | |
| Brightness middle | 235.4 | 246 5% | 276 17% | 304 29% | 239 2% |
| Brightness | 223 | 235 5% | 265 19% | 289 30% | 244 9% |
| Brightness Distribution | 91 | 75 -18% | 91 0% | 86 -5% | 88 -3% |
| Black Level * | 0.28 | 0.55 -96% | 0.25 11% | 0.26 7% | 0.35 -25% |
| Contrast | 841 | 447 -47% | 1104 31% | 1169 39% | 683 -19% |
| Colorchecker dE 2000 * | 5.6 | 10.97 -96% | 5.06 10% | 3.46 38% | 7.3 -30% |
| Colorchecker dE 2000 max. * | 20.3 | 10.13 50% | 7.72 62% | 24.7 -22% | |
| Greyscale dE 2000 * | 3.6 | 14.25 -296% | 6.25 -74% | 2.46 32% | 4.9 -36% |
| Gamma | 2.23 99% | 1.83 120% | 1.76 125% | 2.38 92% | 2.19 100% |
| CCT | 7214 90% | 11200 58% | 6873 95% | 6915 94% | 7332 89% |
| Color Space (Percent of AdobeRGB 1998) | 35.2 | 35 -1% | 40 14% | 59 68% | 35 -1% |
| Color Space (Percent of sRGB) | 55.4 | 55 -1% | 62 12% | 91 64% | 55 -1% |
| Total Average (Program / Settings) | -26% /
-42% | 11% /
10% | 30% /
36% | -31% /
-18% |
* ... smaller is better
Display Response Times
| ↔ Response Time Black to White | ||
|---|---|---|
| 27.6 ms ... rise ↗ and fall ↘ combined | ↗ 15.6 ms rise | 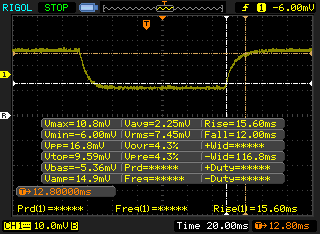 |
| ↘ 12 ms fall | ||
| The screen shows relatively slow response rates in our tests and may be too slow for gamers. In comparison, all tested devices range from 0.1 (minimum) to 240 (maximum) ms. » 66 % of all devices are better. This means that the measured response time is worse than the average of all tested devices (21.5 ms). | ||
| ↔ Response Time 50% Grey to 80% Grey | ||
| 35.6 ms ... rise ↗ and fall ↘ combined | ↗ 20 ms rise | 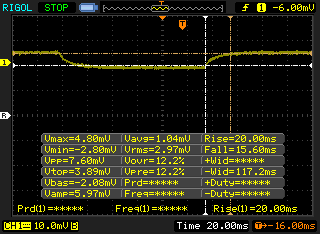 |
| ↘ 15.6 ms fall | ||
| The screen shows slow response rates in our tests and will be unsatisfactory for gamers. In comparison, all tested devices range from 0.2 (minimum) to 636 (maximum) ms. » 44 % of all devices are better. This means that the measured response time is similar to the average of all tested devices (33.7 ms). | ||
Screen Flickering / PWM (Pulse-Width Modulation)
| Screen flickering / PWM not detected | 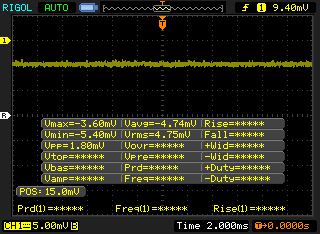 | ||
In comparison: 53 % of all tested devices do not use PWM to dim the display. If PWM was detected, an average of 17900 (minimum: 5 - maximum: 3846000) Hz was measured. | |||
| wPrime 2.10 - 1024m | |
| Lenovo Yoga 920-13IKB-80Y7 | |
| Dell Inspiron 15 7000 7567 Gaming (Core i5-7300HQ, GTX 1050) | |
| Dell Inspiron 15 7000 7577 | |
| Lenovo IdeaPad Y50 | |
| Razer Blade Pro RZ09-0220 | |
* ... smaller is better
| PCMark 10 - Score | |
| Acer Nitro 5 AN515-51-788E | |
| Dell Inspiron 15 7000 7577 | |
| Dell Inspiron 15 7000 7567 Gaming (Core i5-7300HQ, GTX 1050) | |
| PCMark 8 Home Score Accelerated v2 | 3759 pontos | |
| PCMark 8 Creative Score Accelerated v2 | 4723 pontos | |
| PCMark 8 Work Score Accelerated v2 | 4856 pontos | |
| PCMark 10 Score | 4406 pontos | |
Ajuda | ||
| Dell Inspiron 15 7000 7577 Samsung PM961 MZVLW256HEHP | Dell Inspiron 15 7000 7567 Intel SSDSCKKF256H6 | Gigabyte Sabre 15G Liteonit CV3-8D128 | Lenovo Legion Y520-15IKBN-80WK001KUS Samsung PM961 MZVLW256HEHP | HP Omen 17-w100ng SanDisk Z400s SD8SNAT-128G | |
|---|---|---|---|---|---|
| AS SSD | -56% | -64% | 41% | -94% | |
| Copy Game MB/s | 382.5 | 286.2 -25% | 323.5 -15% | 1115 192% | 159.8 -58% |
| Copy Program MB/s | 274.8 | 224 -18% | 195.3 -29% | 502 83% | 80.6 -71% |
| Copy ISO MB/s | 814 | 425.4 -48% | 446.8 -45% | 1912 135% | 233.4 -71% |
| Score Total | 2405 | 734 -69% | 752 -69% | 2617 9% | 537 -78% |
| Score Write | 594 | 227 -62% | 234 -61% | 807 36% | 236 -60% |
| Score Read | 1241 | 332 -73% | 337 -73% | 1232 -1% | 206 -83% |
| Access Time Write * | 0.037 | 0.057 -54% | 0.073 -97% | 0.027 27% | 0.162 -338% |
| Access Time Read * | 0.058 | 0.094 -62% | 0.141 -143% | 0.065 -12% | 0.14 -141% |
| 4K-64 Write | 375.8 | 118.3 -69% | 132.2 -65% | 529 41% | 155 -59% |
| 4K-64 Read | 929 | 258.6 -72% | 257 -72% | 919 -1% | 137.4 -85% |
| 4K Write | 100.2 | 66.6 -34% | 53.8 -46% | 139.4 39% | 64.2 -36% |
| 4K Read | 46.95 | 25.16 -46% | 28.3 -40% | 48.57 3% | 17.76 -62% |
| Seq Write | 1181 | 416.1 -65% | 479.8 -59% | 1392 18% | 166.7 -86% |
| Seq Read | 2652 | 481.6 -82% | 516 -81% | 2649 0% | 507 -81% |
* ... smaller is better

| 3DMark | |
| 1920x1080 Fire Strike Graphics | |
| Asus G701VIK-BA049T | |
| Alienware 15 R3 Max-Q | |
| Aorus X5 v7 | |
| Gigabyte Aero 15X | |
| AMD Radeon RX 480 8 GB Reference | |
| Razer Blade Pro RZ09-0220 | |
| HP Omen 15-ce002ng | |
| Dell Inspiron 15 7000 7577 | |
| EVGA SC17 | |
| Lenovo Legion Y520-15IKBN-80WK001KUS | |
| Asus GL503VD-DB74 | |
| Acer Swift 3 SF315-51G-57E5 | |
| Fire Strike Extreme Graphics | |
| Alienware 15 R3 Max-Q | |
| Gigabyte Aero 15X | |
| AMD Radeon RX 480 8 GB Reference | |
| Razer Blade Pro RZ09-0220 | |
| Dell Inspiron 15 7000 7577 | |
| EVGA SC17 | |
| Lenovo Legion Y520-15IKBN-80WK001KUS | |
| Asus GL503VD-DB74 | |
| 3DMark 11 | |
| 1280x720 Performance GPU | |
| Asus G701VIK-BA049T | |
| Alienware 15 R3 Max-Q | |
| Aorus X5 v7 | |
| Gigabyte Aero 15X | |
| AMD Radeon RX 480 8 GB Reference | |
| Razer Blade Pro RZ09-0220 | |
| HP Omen 15-ce002ng | |
| Dell Inspiron 15 7000 7577 | |
| EVGA SC17 | |
| Asus GL503VD-DB74 | |
| Acer Swift 3 SF315-51G-57E5 | |
| 1280x720 Performance Combined | |
| Asus G701VIK-BA049T | |
| AMD Radeon RX 480 8 GB Reference | |
| Aorus X5 v7 | |
| Alienware 15 R3 Max-Q | |
| EVGA SC17 | |
| Gigabyte Aero 15X | |
| Razer Blade Pro RZ09-0220 | |
| HP Omen 15-ce002ng | |
| Asus GL503VD-DB74 | |
| Dell Inspiron 15 7000 7577 | |
| Acer Swift 3 SF315-51G-57E5 | |
| 3DMark 11 Performance | 10176 pontos | |
| 3DMark Ice Storm Standard Score | 96790 pontos | |
| 3DMark Cloud Gate Standard Score | 17325 pontos | |
| 3DMark Fire Strike Score | 8292 pontos | |
| 3DMark Fire Strike Extreme Score | 4467 pontos | |
Ajuda | ||
| Rise of the Tomb Raider - 1920x1080 Very High Preset AA:FX AF:16x | |
| MSI GE73VR 7RF Raider | |
| Nvidia GeForce GTX 1060 Founders Edition 6 GB | |
| Nvidia GeForce GTX 1060 Founders Edition 6 GB | |
| Razer Blade Pro RZ09-0220 | |
| Dell Inspiron 15 7000 7577 | |
| HP Omen 15-ce002ng | |
| Asus Strix GL502VT-DS74 | |
| Lenovo Legion Y520-15IKBN-80WK001KUS | |
| Gigabyte Sabre 15G | |
| MSI GL72 6QF | |
| The Witcher 3 - 1920x1080 Ultra Graphics & Postprocessing (HBAO+) | |
| MSI GE73VR 7RF Raider | |
| Nvidia GeForce GTX 1060 Founders Edition 6 GB | |
| Razer Blade Pro RZ09-0220 | |
| Lenovo Legion Y520-15IKBN-80WK001KUS | |
| Dell Inspiron 15 7000 7577 | |
| HP Omen 15-ce002ng | |
| Gigabyte Sabre 15G | |
| BioShock Infinite - 1920x1080 Ultra Preset, DX11 (DDOF) | |
| MSI GE73VR 7RF Raider | |
| Razer Blade Pro RZ09-0220 | |
| Dell Inspiron 15 7000 7577 | |
| Lenovo Legion Y520-15IKBN-80WK001KUS | |
| Asus Strix GL502VT-DS74 | |
| Gigabyte Sabre 15G | |
| MSI GL72 6QF | |
| baixo | média | alto | ultra | |
| Guild Wars 2 (2012) | 45.7 | |||
| BioShock Infinite (2013) | 95.3 | |||
| Metro: Last Light (2013) | 64.3 | |||
| Thief (2014) | 64.6 | |||
| The Witcher 3 (2015) | 73.4 | 35.2 | ||
| Batman: Arkham Knight (2015) | 74 | 49 | ||
| Metal Gear Solid V (2015) | 60 | |||
| Fallout 4 (2015) | 73.9 | 61.3 | ||
| Rise of the Tomb Raider (2016) | 67.5 | 55.4 | ||
| Overwatch (2016) | 98.4 | |||
| Mafia 3 (2016) | 36.2 | |||
| Prey (2017) | 97.1 | |||
| Dirt 4 (2017) | 118 | 87.1 | 46.5 | |
| F1 2017 (2017) | 94 | 77 | 56 | |
| Middle-earth: Shadow of War (2017) | 84 | 65 | 48 |
Barulho
| Ocioso |
| 28 / 28 / 28 dB |
| Carga |
| 30.3 / 46.5 dB |
 | ||
30 dB silencioso 40 dB(A) audível 50 dB(A) ruidosamente alto |
||
min: | ||
| Dell Inspiron 15 7000 7577 GeForce GTX 1060 Max-Q, i5-7300HQ, Samsung PM961 MZVLW256HEHP | Dell Inspiron 15 7000 7567 Gaming (Core i5-7300HQ, GTX 1050) GeForce GTX 1050 Mobile, i5-7300HQ, Toshiba MQ02ABD100H | Gigabyte Sabre 15G GeForce GTX 1050 Mobile, i7-7700HQ, Liteonit CV3-8D128 | Lenovo Legion Y520-15IKBN-80WK001KUS GeForce GTX 1050 Ti Mobile, i7-7700HQ, Samsung PM961 MZVLW256HEHP | Asus Strix GL502VT-DS74 GeForce GTX 970M, 6700HQ, Lite-On CV1-8B128 | HP Omen 15-ce002ng GeForce GTX 1060 Max-Q, i7-7700HQ, Samsung PM961 MZVLW256HEHP | |
|---|---|---|---|---|---|---|
| Noise | -12% | -21% | -7% | -13% | -16% | |
| off / environment * | 28 | 28 -0% | 28.2 -1% | 27.7 1% | 28.7 -3% | 30 -7% |
| Idle Minimum * | 28 | 31.6 -13% | 33 -18% | 30.5 -9% | 31 -11% | 30 -7% |
| Idle Average * | 28 | 31.8 -14% | 33.3 -19% | 30.5 -9% | 31 -11% | 33 -18% |
| Idle Maximum * | 28 | 31.8 -14% | 34.7 -24% | 30.6 -9% | 32 -14% | 37 -32% |
| Load Average * | 30.3 | 36.3 -20% | 44.5 -47% | 40 -32% | 40.7 -34% | 41 -35% |
| Witcher 3 ultra * | 39.5 | 46.3 -17% | 49.2 -25% | 40 -1% | 42 -6% | |
| Load Maximum * | 46.5 | 49 -5% | 52.8 -14% | 42.6 8% | 47.6 -2% | 50 -8% |
* ... smaller is better
(±) The maximum temperature on the upper side is 44 °C / 111 F, compared to the average of 40.4 °C / 105 F, ranging from 21.2 to 68.8 °C for the class Gaming.
(±) The bottom heats up to a maximum of 43.8 °C / 111 F, compared to the average of 43.2 °C / 110 F
(+) In idle usage, the average temperature for the upper side is 24.7 °C / 76 F, compared to the device average of 33.8 °C / 93 F.
(+) Playing The Witcher 3, the average temperature for the upper side is 27.9 °C / 82 F, compared to the device average of 33.8 °C / 93 F.
(+) The palmrests and touchpad are cooler than skin temperature with a maximum of 29.8 °C / 85.6 F and are therefore cool to the touch.
(±) The average temperature of the palmrest area of similar devices was 28.9 °C / 84 F (-0.9 °C / -1.6 F).
Dell Inspiron 15 7000 7577 audio analysis
(±) | speaker loudness is average but good (80.9 dB)
Bass 100 - 315 Hz
(±) | reduced bass - on average 13% lower than median
(+) | bass is linear (6.8% delta to prev. frequency)
Mids 400 - 2000 Hz
(+) | balanced mids - only 2.7% away from median
(+) | mids are linear (5.3% delta to prev. frequency)
Highs 2 - 16 kHz
(±) | higher highs - on average 8% higher than median
(±) | linearity of highs is average (10.6% delta to prev. frequency)
Overall 100 - 16.000 Hz
(±) | linearity of overall sound is average (18.9% difference to median)
Compared to same class
» 60% of all tested devices in this class were better, 8% similar, 32% worse
» The best had a delta of 6%, average was 18%, worst was 132%
Compared to all devices tested
» 38% of all tested devices were better, 8% similar, 54% worse
» The best had a delta of 4%, average was 25%, worst was 134%
Apple MacBook 12 (Early 2016) 1.1 GHz audio analysis
(+) | speakers can play relatively loud (83.6 dB)
Bass 100 - 315 Hz
(±) | reduced bass - on average 11.3% lower than median
(±) | linearity of bass is average (14.2% delta to prev. frequency)
Mids 400 - 2000 Hz
(+) | balanced mids - only 2.4% away from median
(+) | mids are linear (5.5% delta to prev. frequency)
Highs 2 - 16 kHz
(+) | balanced highs - only 2% away from median
(+) | highs are linear (4.5% delta to prev. frequency)
Overall 100 - 16.000 Hz
(+) | overall sound is linear (10.2% difference to median)
Compared to same class
» 5% of all tested devices in this class were better, 2% similar, 93% worse
» The best had a delta of 5%, average was 19%, worst was 53%
Compared to all devices tested
» 3% of all tested devices were better, 1% similar, 96% worse
» The best had a delta of 4%, average was 25%, worst was 134%
| desligado | |
| Ocioso | |
| Carga |
|
| Dell Inspiron 15 7000 7577 i5-7300HQ, GeForce GTX 1060 Max-Q, Samsung PM961 MZVLW256HEHP, IPS, 1920x1080, 15.60 | Dell Inspiron 15 7000 7567 i7-7700HQ, GeForce GTX 1050 Ti Mobile, Intel SSDSCKKF256H6, TN, 1920x1080, 15.60 | Gigabyte Sabre 15G i7-7700HQ, GeForce GTX 1050 Mobile, Liteonit CV3-8D128, IPS, 1920x1080, 15.60 | MSI GF62VR 7RF-877 i7-7700HQ, GeForce GTX 1060 Mobile, Intel SSD 600p SSDPEKKW256G7, TN LED, 1920x1080, 15.60 | Asus Strix GL502VY-DS71 6700HQ, GeForce GTX 980M, SanDisk SD8SN8U1T001122, IPS, 1920x1080, 15.60 | |
|---|---|---|---|---|---|
| Power Consumption | 1% | -19% | -85% | -144% | |
| Idle Minimum * | 7.1 | 4.4 38% | 8 -13% | 16.2 -128% | 20.6 -190% |
| Idle Average * | 7.6 | 6.8 11% | 10.9 -43% | 18.2 -139% | 22.1 -191% |
| Idle Maximum * | 8.6 | 8.3 3% | 11 -28% | 18.9 -120% | 22.5 -162% |
| Load Average * | 59.5 | 81 -36% | 76.7 -29% | 82.7 -39% | 130.6 -119% |
| Witcher 3 ultra * | 89 | 94.9 -7% | 125.7 -41% | ||
| Load Maximum * | 112.8 | 127 -13% | 106.4 6% | 162.3 -44% | 177.2 -57% |
* ... smaller is better
| Dell Inspiron 15 7000 7577 i5-7300HQ, GeForce GTX 1060 Max-Q, 56 Wh | Dell Inspiron 15 7000 7567 i7-7700HQ, GeForce GTX 1050 Ti Mobile, 74 Wh | Gigabyte Sabre 15G i7-7700HQ, GeForce GTX 1050 Mobile, 47 Wh | Lenovo Legion Y520-15IKBN-80WK001KUS i7-7700HQ, GeForce GTX 1050 Ti Mobile, 45 Wh | Asus Strix GL502VT-DS74 6700HQ, GeForce GTX 970M, 64 Wh | MSI GF62VR 7RF-877 i7-7700HQ, GeForce GTX 1060 Mobile, 41 Wh | |
|---|---|---|---|---|---|---|
| Battery Runtime | 37% | -27% | -39% | -22% | -68% | |
| Reader / Idle | 659 | 1174 78% | 493 -25% | 509 -23% | 584 -11% | 166 -75% |
| WiFi v1.3 | 416 | 622 50% | 261 -37% | 240 -42% | 356 -14% | 115 -72% |
| Load | 96 | 81 -16% | 77 -20% | 46 -52% | 56 -42% | 41 -57% |
Pro
Contra
O Inspiron 7577 é um incrível sistema para jogos pelo preço, tudo graças a sua base forte, componentes internos acessíveis, e GPU GTX 1060 Max-Q. Somente a mudança da GPU fez com que a máquina funcione de forma mais silenciosa e rápida, e mais eficientemente que todos os SKUs do Inspiron 7567. Não é todos os dias que um sucessor imediato oferece um aumento de 35 a 70% no desempenho gráfico por um pequeno aumento do consumo de energia de 5 a 10%, e ainda consegue ter ventoinhas mais silenciosas durante os jogos.
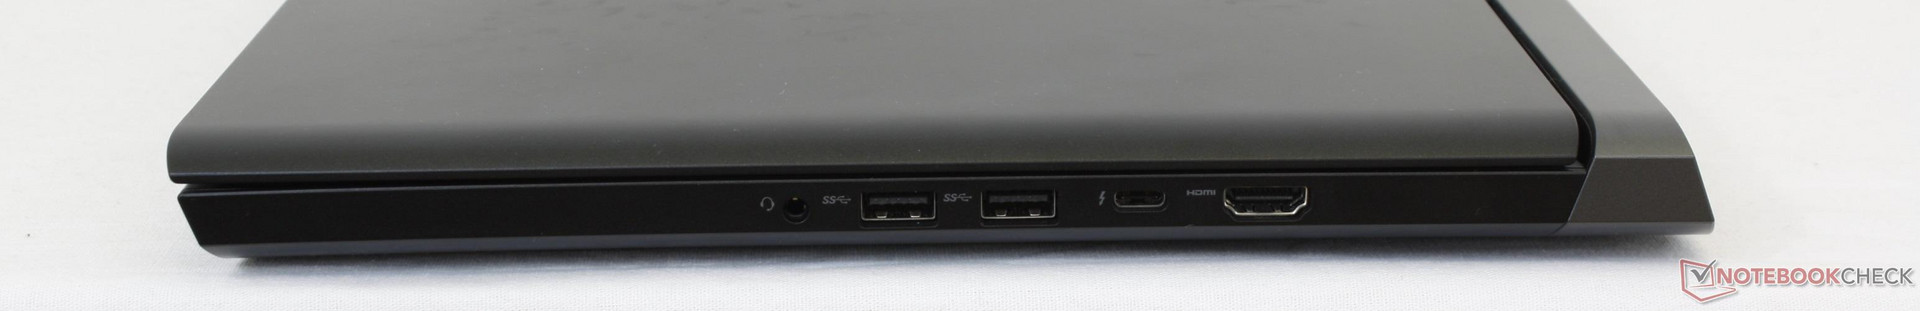
Quando comparado com os concorrentes como o Omen 15 (7700HQ, GTX 1060 Max-Q) ou MSI GF62VR (7700HQ, GTX 1060), o Dell facilmente supera ambos, no geral. O consumo de energia é inferior ao do MSI por cerca de 40 por cento por uma muito pequena redução de 5 a 10 por cento no desempenho gráfico. Por sua vez, o ruído do ventilador é reduzido significativamente e a duração da bateria é de mais horas. O sistema ainda consegue ser mais silencioso do que o Omen 15, apesar de ter a mesma GPU Max-Q e os mesmos resultados de desempenho 3D. Colocando Thunderbolt 3 e um baixo preço inicial de $900 USD o Inspiron 7577 rapidamente se tornou nosso portátil de jogos favorito por menos de mil.
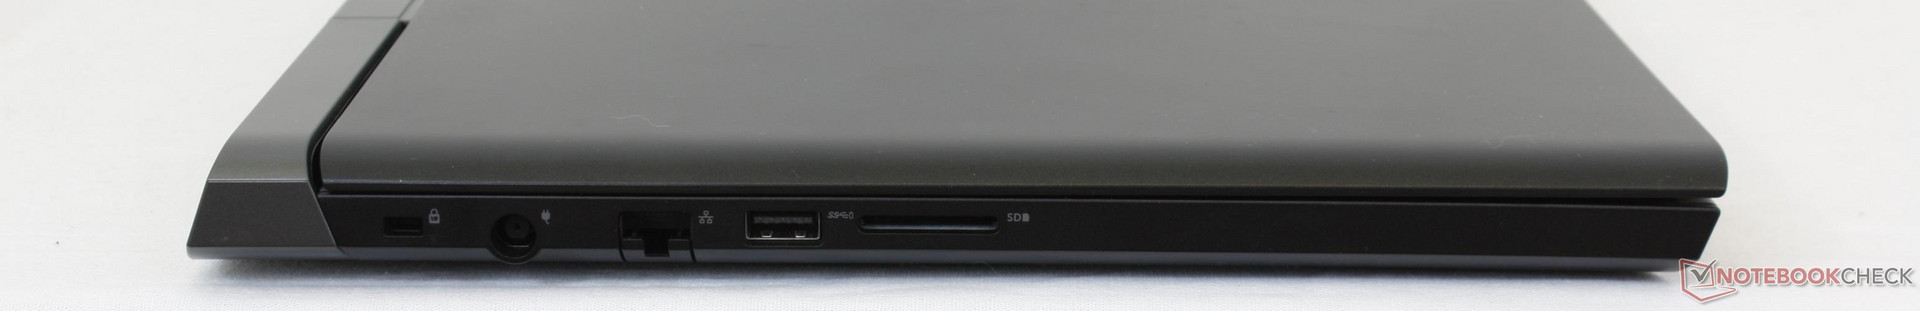
Algumas desvantagens importantes separam o Inspiron 7577 de modelos mais caros, como o Alienware 15 ou Aorus X5. Em primeiro lugar, a tela de 1080p não conta com muitos recursos. As cores não são problema para os painéis nos sistemas acima mencionados, onde >90% da cobertura sRGB é possível. Por mais vivas que sejam no Dell, as cores simplesmente não são tão profundas quanto poderiam ter sido. Teríamos desistido do painel UHD 4K na configuração superior do Inspiron 7577, se isso significasse G-Sync, tempos de resposta mais rápidos, cores mais precisas e uma luz de fundo mais brilhante para a série. Em segundo lugar, as teclas do teclado são mais suaves do que o esperado de um portátil de 15 polegadas. Nós já sabemos que a Dell pode fazer melhor do que isso, como demonstrou com os teclados superiores das séries Latitude e XPS, então não há motivo para que a série Inspiron não tenha um tratamento similar. Outras queixas menores, como a falta de iluminação RGB por tecla, leitor de cartões SD muito lento, alto-falantes mais fracos e um peso relativamente pesado, são menos importantes para a experiência de jogo, em comparação com o conforto do teclado, tela, ruído e desempenho.
O Inspiron 7577 é o melhor portátil de jogos para usuários com orçamentos apertados. É surpreendentemente silencioso e duradouro, com um desempenho gráfico forte que ultrapassa o preço solicitado. A tela e o teclado são os dois aspectos que sentem o "orçamento" nesta oferta padrão, que de outra forma, é excepcional.
Dell Inspiron 15 7000 7577
-
01/03/2018 v6(old)
Allen Ngo
Pricecompare
