 Deutsch
 English
 Español
 Français
 Italiano
 Nederlands
 Polski
 Português
 Русский
 Türkçe
 Svenska
 Chinese
 Magyar
Breve Análise do Portátil Dell Latitude 14 3470
| SD Card Reader | |
| average JPG Copy Test (av. of 3 runs) | |
| Dell Latitude 12 E7270 | |
| Lenovo ThinkPad E460-20EUS00000 | |
| HP ProBook 440 G3 | |
| Lenovo ThinkPad L460-20FVS01400 | |
| Dell Latitude 14 3470 | |
| maximum AS SSD Seq Read Test (1GB) | |
| Dell Latitude 12 E7270 | |
| HP ProBook 440 G3 | |
| Lenovo ThinkPad E460-20EUS00000 | |
| Lenovo ThinkPad L460-20FVS01400 | |
| Dell Latitude 14 3470 | |
| Networking | |
| iperf Server (receive) TCP 1 m | |
| Dell Latitude 14 3470 | |
| iperf Client (transmit) TCP 1 m | |
| Dell Latitude 14 3470 | |
| |||||||||||||||||||||||||
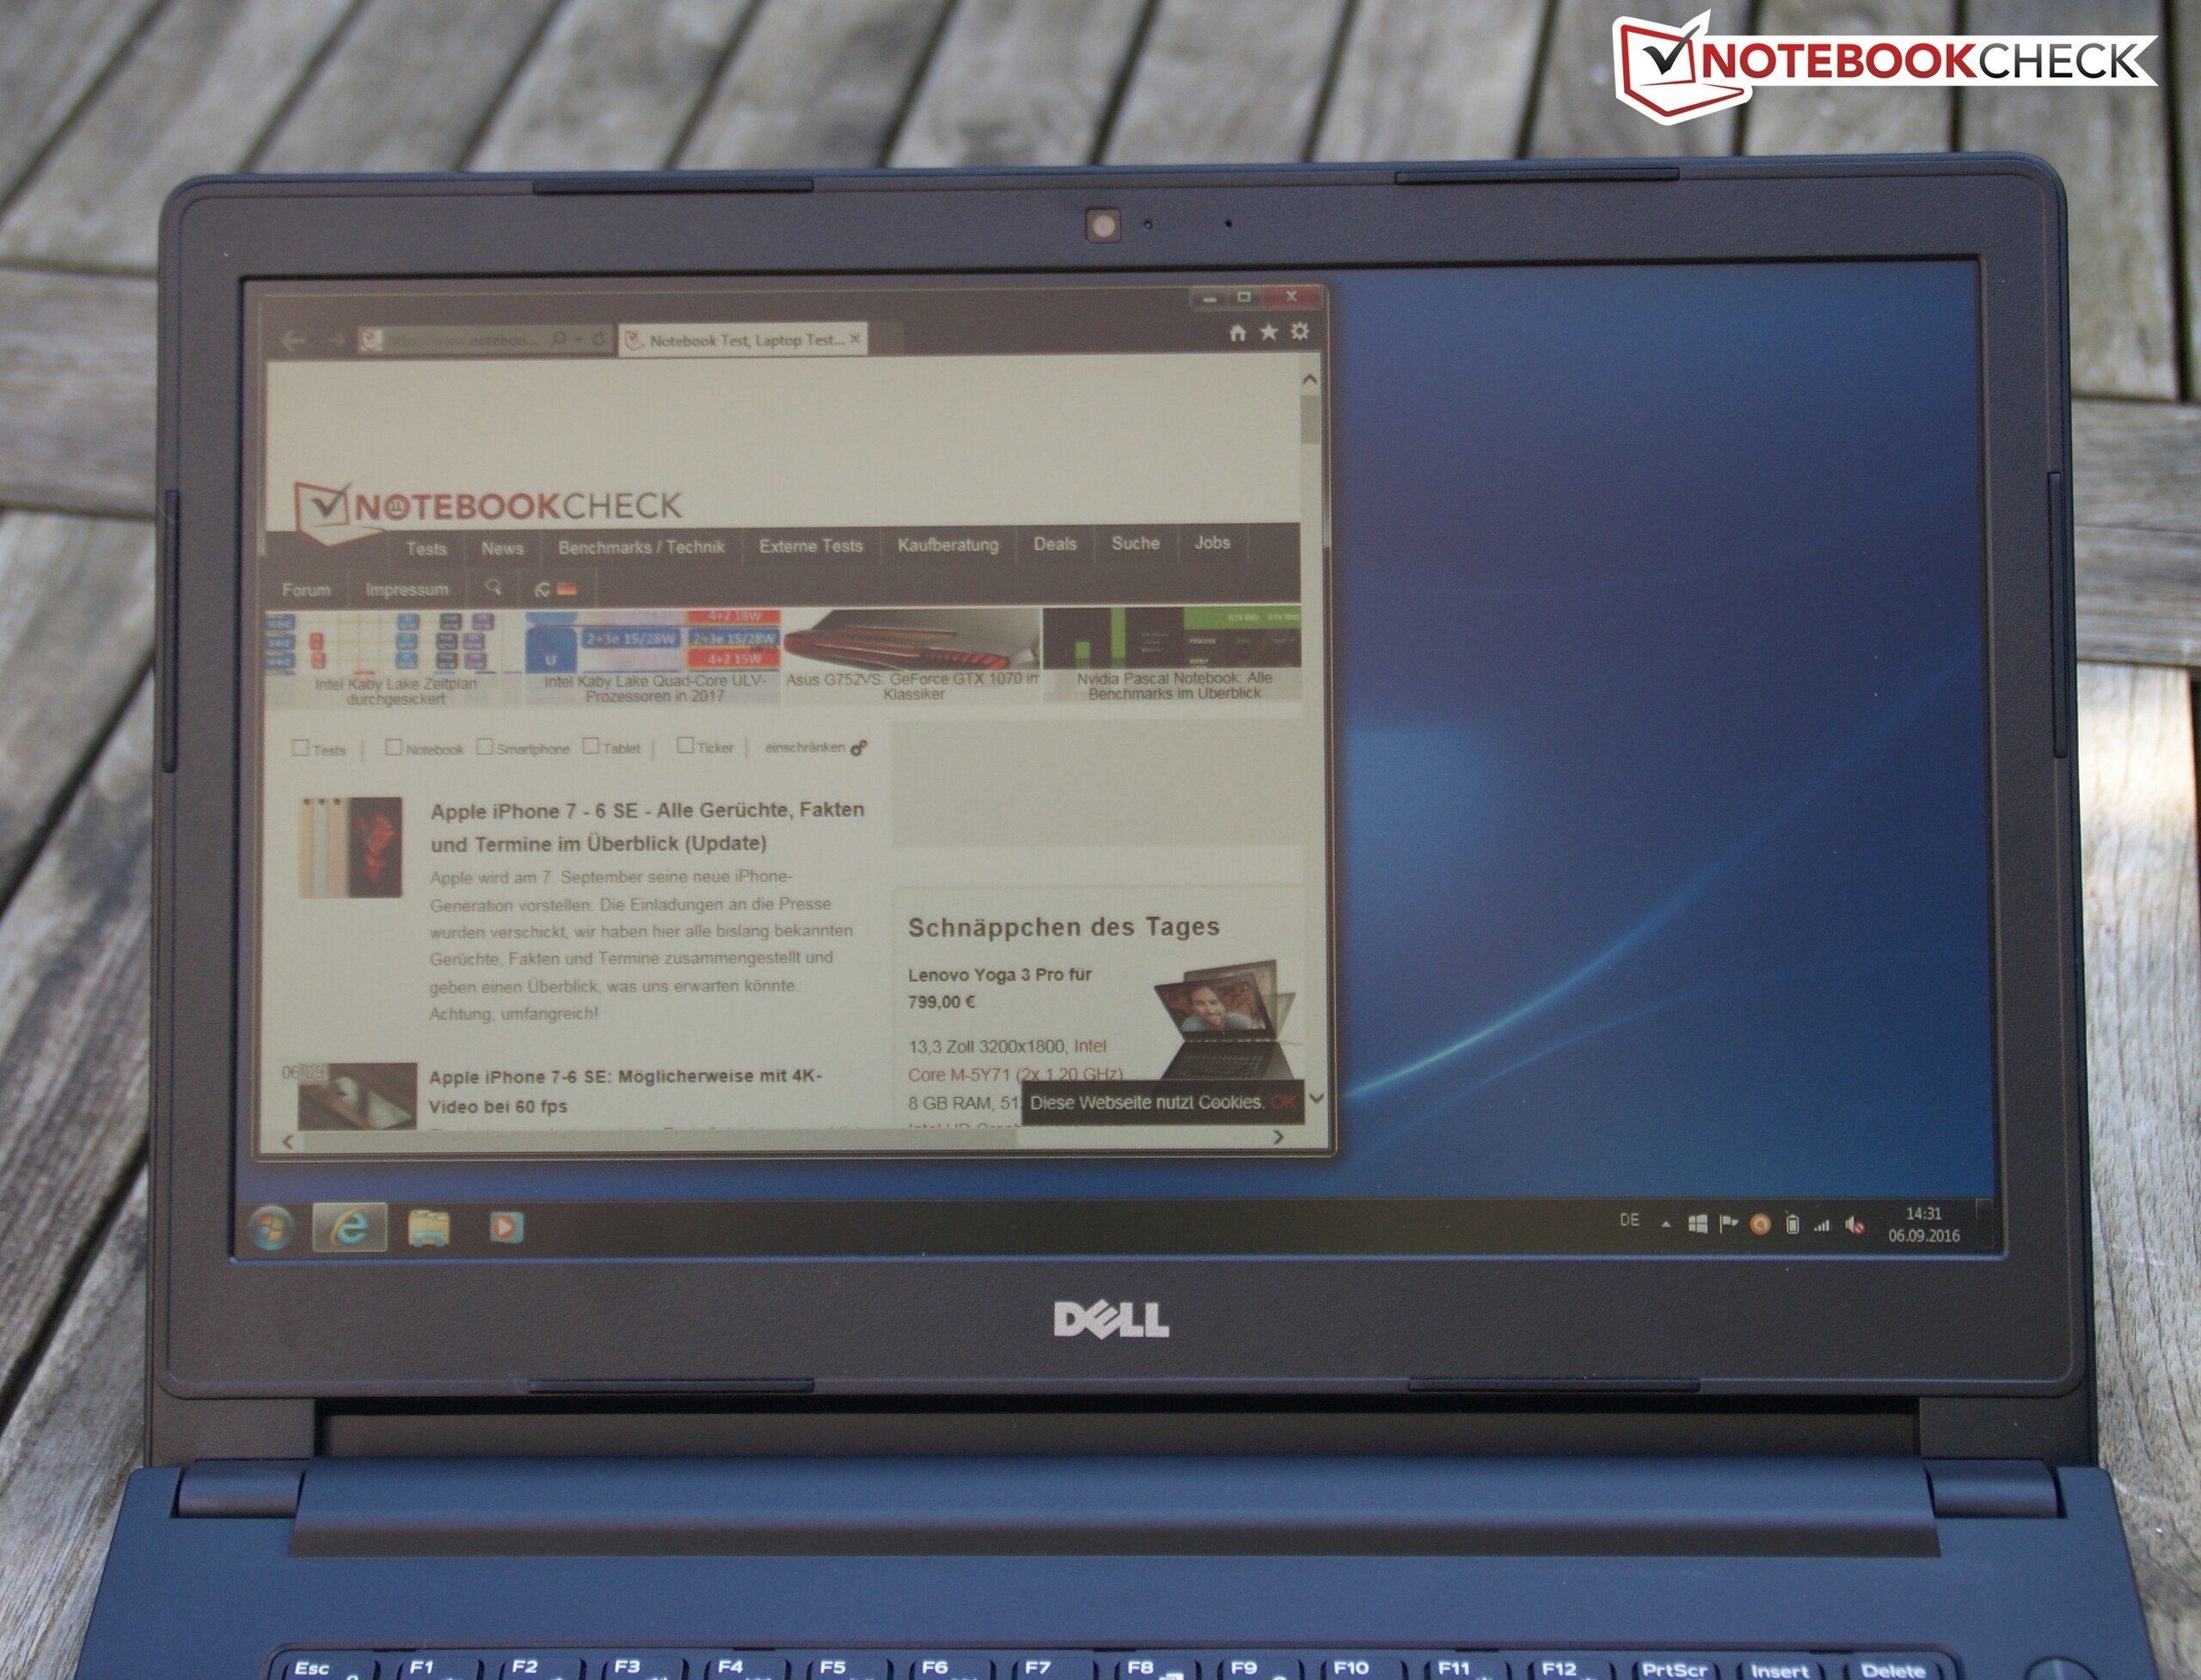
iluminação: 87 %
iluminação com acumulador: 206 cd/m²
Contraste: 429:1 (Preto: 0.48 cd/m²)
ΔE Color 11 | 0.5-29.43 Ø5
ΔE Greyscale 11.51 | 0.57-98 Ø5.3
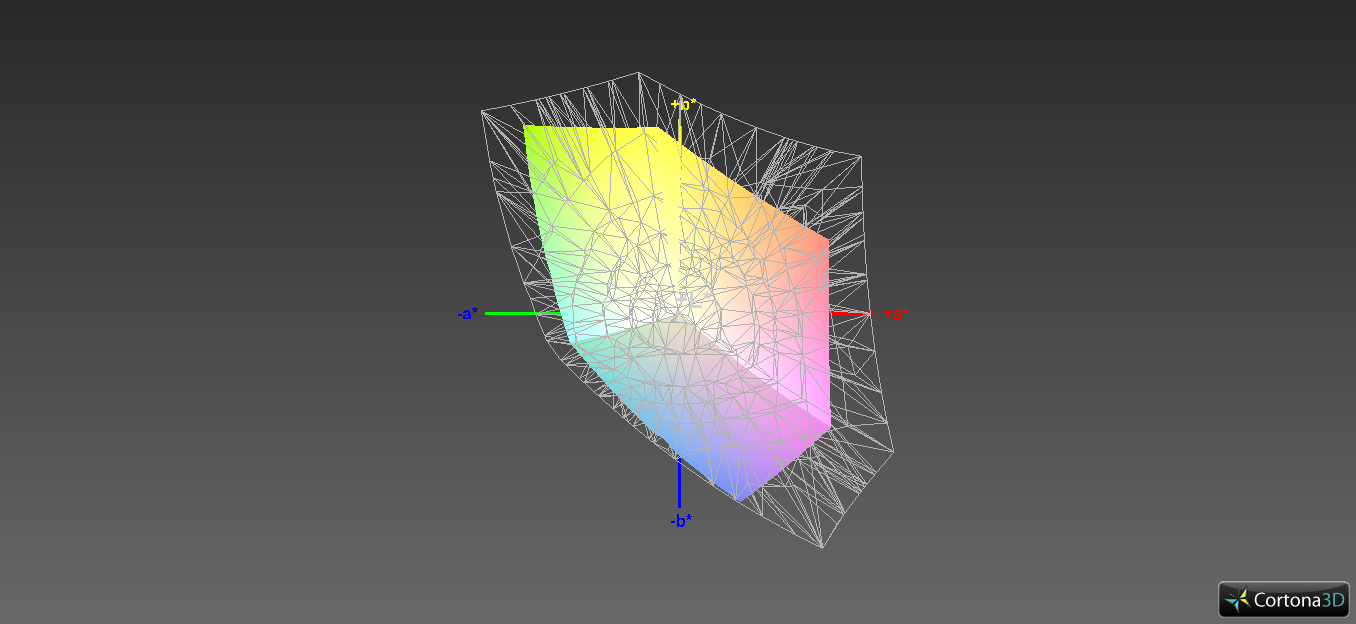
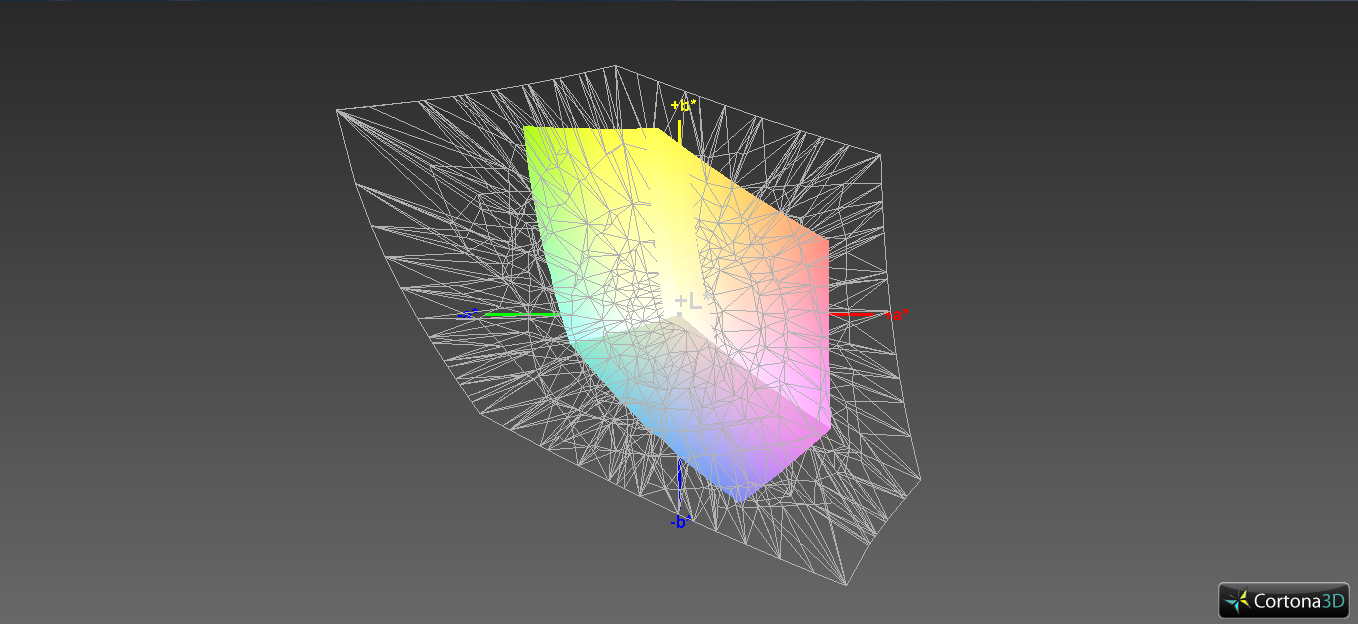
60.61% sRGB (Argyll 1.6.3 3D)
38.46% AdobeRGB 1998 (Argyll 1.6.3 3D)
41.55% AdobeRGB 1998 (Argyll 2.2.0 3D)
60.5% sRGB (Argyll 2.2.0 3D)
40.21% Display P3 (Argyll 2.2.0 3D)
Gamma: 2.23
| Dell Latitude 14 3470 Innolux N140BGE, TN LED, 1366x768, 14.00 | Lenovo ThinkPad L460-20FVS01400 Lenovo N140HCE-EAA, IPS, 1920x1080, 14.00 | Lenovo ThinkPad E460-20EUS00000 LG LP140WF6-SPB2, IPS-Panel, 1920x1080, 14.00 | HP ProBook 440 G3 Chi Mei CMN14A7, TN, 1920x1080, 14.00 | HP EliteBook Folio 1040 G3 AUO1136, IPS, 2560x1440, 14.00 | |
|---|---|---|---|---|---|
| Display | 4% | -3% | -2% | 66% | |
| Display P3 Coverage | 40.21 | 42.2 5% | 39.1 -3% | 39.6 -2% | 67.9 69% |
| sRGB Coverage | 60.5 | 62.3 3% | 58.8 -3% | 59.1 -2% | 96.8 60% |
| AdobeRGB 1998 Coverage | 41.55 | 43.72 5% | 40.41 -3% | 40.94 -1% | 70 68% |
| Response Times | -4% | 13% | -2% | -1% | |
| Response Time Grey 50% / Grey 80% * | 47 ? | 44.4 ? 6% | 40 ? 15% | 46 ? 2% | 46.4 ? 1% |
| Response Time Black / White * | 26 ? | 29.6 ? -14% | 23.2 ? 11% | 27.6 ? -6% | 26.4 ? -2% |
| PWM Frequency | |||||
| Screen | 32% | 30% | 8% | 57% | |
| Brightness middle | 206 | 245 19% | 233 13% | 246 19% | 327 59% |
| Brightness | 193 | 225 17% | 221 15% | 215 11% | 316 64% |
| Brightness Distribution | 87 | 83 -5% | 88 1% | 84 -3% | 87 0% |
| Black Level * | 0.48 | 0.24 50% | 0.3 37% | 0.5 -4% | 0.35 27% |
| Contrast | 429 | 1021 138% | 777 81% | 492 15% | 934 118% |
| Colorchecker dE 2000 * | 11 | 6.89 37% | 4.43 60% | 8.6 22% | 4.39 60% |
| Colorchecker dE 2000 max. * | 19.57 | 17.62 10% | 7.27 63% | ||
| Greyscale dE 2000 * | 11.51 | 6.45 44% | 3.78 67% | 9.36 19% | 4.69 59% |
| Gamma | 2.23 99% | 2.46 89% | 2.31 95% | 2.39 92% | 2.15 102% |
| CCT | 13671 48% | 6857 95% | 7171 91% | 11226 58% | 7101 92% |
| Color Space (Percent of AdobeRGB 1998) | 38.46 | 40.1 4% | 37.3 -3% | 37.8 -2% | 62.52 63% |
| Color Space (Percent of sRGB) | 60.61 | 61.8 2% | 58.7 -3% | 59.1 -2% | 96.71 60% |
| Total Average (Program / Settings) | 11% /
21% | 13% /
20% | 1% /
5% | 41% /
51% |
* ... smaller is better
Display Response Times
| ↔ Response Time Black to White | ||
|---|---|---|
| 26 ms ... rise ↗ and fall ↘ combined | ↗ 18 ms rise | 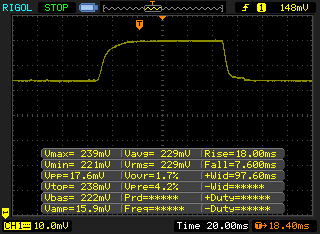 |
| ↘ 8 ms fall | ||
| The screen shows relatively slow response rates in our tests and may be too slow for gamers. In comparison, all tested devices range from 0.1 (minimum) to 240 (maximum) ms. » 57 % of all devices are better. This means that the measured response time is worse than the average of all tested devices (21.5 ms). | ||
| ↔ Response Time 50% Grey to 80% Grey | ||
| 47 ms ... rise ↗ and fall ↘ combined | ↗ 25 ms rise | 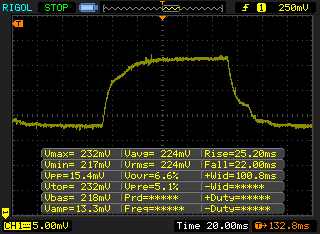 |
| ↘ 22 ms fall | ||
| The screen shows slow response rates in our tests and will be unsatisfactory for gamers. In comparison, all tested devices range from 0.2 (minimum) to 636 (maximum) ms. » 78 % of all devices are better. This means that the measured response time is worse than the average of all tested devices (33.7 ms). | ||
Screen Flickering / PWM (Pulse-Width Modulation)
| Screen flickering / PWM not detected | ||
In comparison: 53 % of all tested devices do not use PWM to dim the display. If PWM was detected, an average of 17915 (minimum: 5 - maximum: 3846000) Hz was measured. | ||
| PCMark 8 | |
| Home Score Accelerated v2 | |
| Lenovo ThinkPad E460-20EUS00000 | |
| Lenovo ThinkPad L460-20FVS01400 | |
| Dell Latitude 14 3470 | |
| HP ProBook 440 G3 | |
| Work Score Accelerated v2 | |
| Lenovo ThinkPad L460-20FVS01400 | |
| Lenovo ThinkPad E460-20EUS00000 | |
| Dell Latitude 14 3470 | |
| HP ProBook 440 G3 | |
| PCMark 8 Home Score Accelerated v2 | 3074 pontos | |
| PCMark 8 Work Score Accelerated v2 | 3982 pontos | |
Ajuda | ||
| Dell Latitude 14 3470 Toshiba MQ01ACF050 | Lenovo ThinkPad L460-20FVS01400 Toshiba HG6 THNSFJ256GCSU | Lenovo ThinkPad E460-20EUS00000 Samsung CM871 MZ7LF192HCGS | HP ProBook 440 G3 Hitachi Travelstar Z7K500 HTS725050A7E630 | |
|---|---|---|---|---|
| CrystalDiskMark 3.0 | 12972% | 4431% | 39% | |
| Read Seq | 108.9 | 480.9 342% | 497.6 357% | 124.8 15% |
| Write Seq | 103.2 | 426.4 313% | 180 74% | 123.6 20% |
| Read 4k | 0.362 | 21.51 5842% | 18.91 5124% | 0.559 54% |
| Write 4k | 0.946 | 71.5 7458% | 37.13 3825% | 1.277 35% |
| Read 4k QD32 | 0.721 | 277.6 38402% | 95.7 13173% | 1.179 64% |
| Write 4k QD32 | 0.901 | 230.4 25472% | 37.26 4035% | 1.304 45% |

| 3DMark 11 - 1280x720 Performance GPU | |
| Lenovo ThinkPad E460-20EUS00000 | |
| Lenovo ThinkPad L460-20FVS01400 | |
| HP ProBook 440 G3 | |
| Dell Latitude 14 3470 | |
| 3DMark | |
| 1280x720 Cloud Gate Standard Graphics | |
| HP ProBook 440 G3 | |
| Lenovo ThinkPad E460-20EUS00000 | |
| Dell Latitude 14 3470 | |
| Lenovo ThinkPad L460-20FVS01400 | |
| 1920x1080 Fire Strike Graphics | |
| Lenovo ThinkPad E460-20EUS00000 | |
| Lenovo ThinkPad L460-20FVS01400 | |
| HP ProBook 440 G3 | |
| Dell Latitude 14 3470 | |
| 3DMark 11 Performance | 1135 pontos | |
| 3DMark Cloud Gate Standard Score | 4181 pontos | |
| 3DMark Fire Strike Score | 536 pontos | |
Ajuda | ||
| baixo | média | alto | ultra | |
| Total War: Rome II (2013) | 25.4 | 18.6 | ||
| Dirt Rally (2015) | 62.3 | 13.25 | ||
| Rise of the Tomb Raider (2016) | 7 |
Barulho
| Ocioso |
| 32.3 / 32.3 / 32.3 dB |
| HDD |
| 32.9 dB |
| Carga |
| 33.3 / 33.4 dB |
 | ||
30 dB silencioso 40 dB(A) audível 50 dB(A) ruidosamente alto |
||
min: | ||
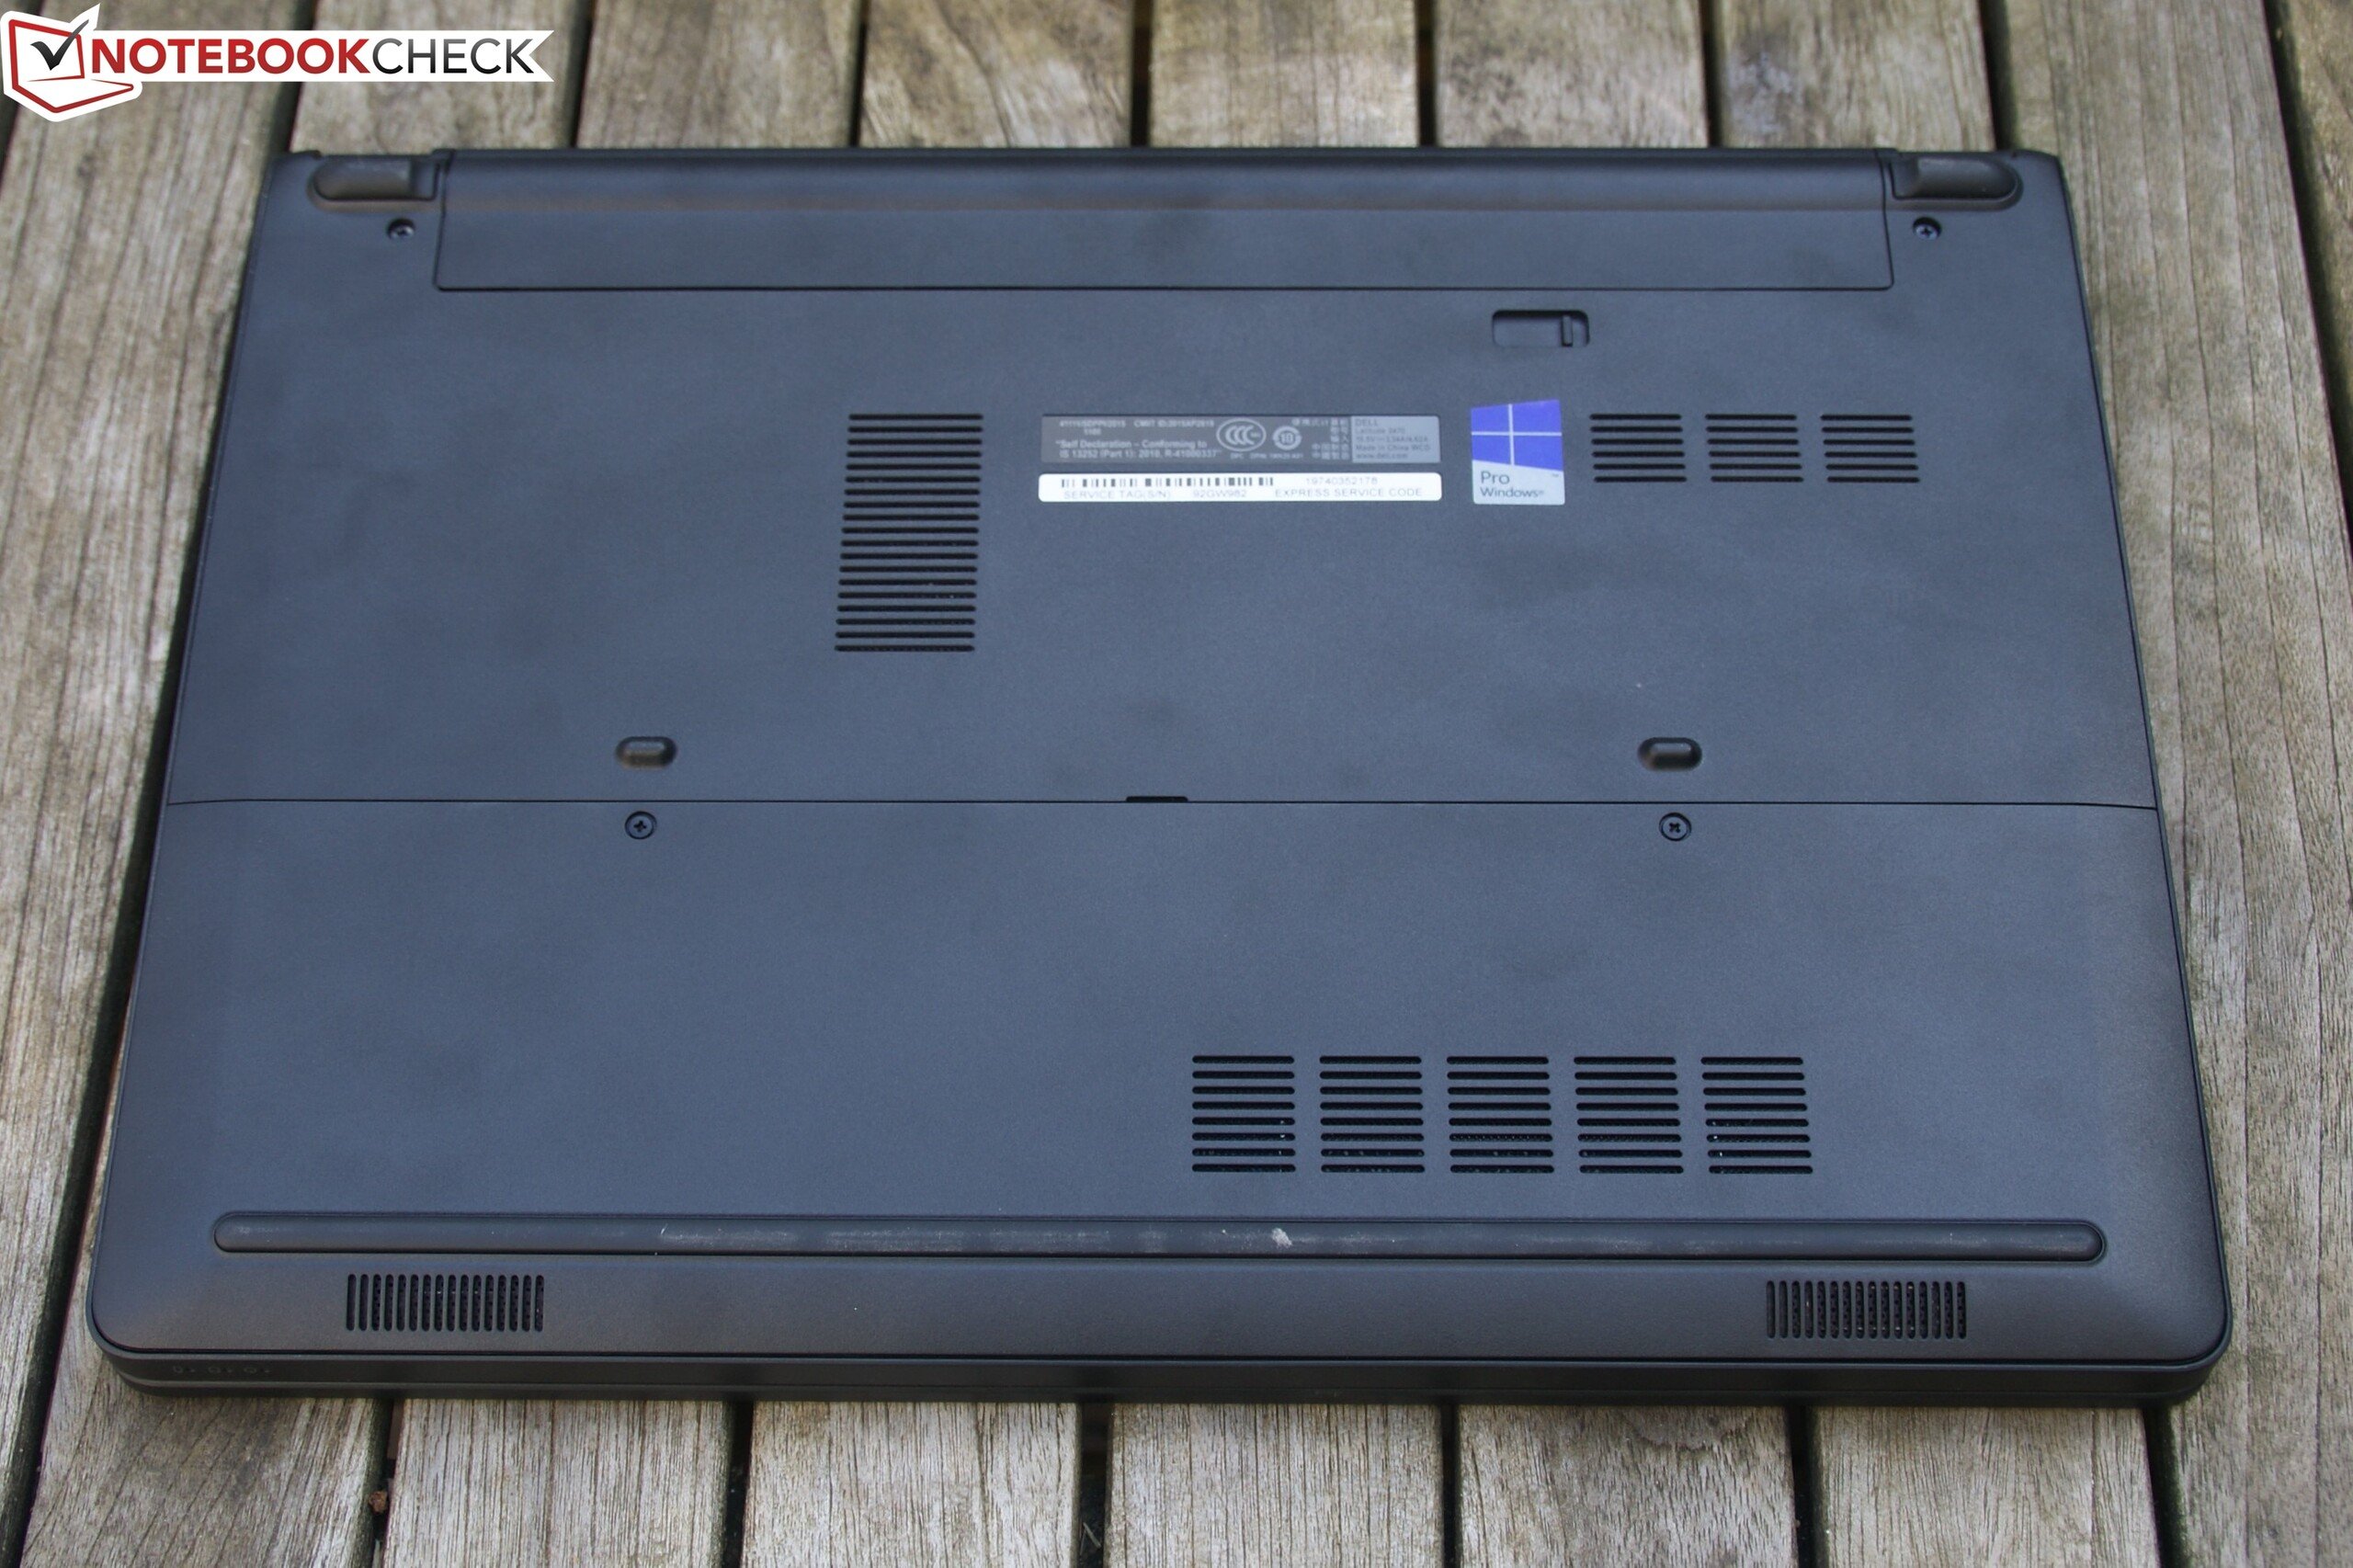
(+) The maximum temperature on the upper side is 38.9 °C / 102 F, compared to the average of 34.2 °C / 94 F, ranging from 21.2 to 62.5 °C for the class Office.
(+) The bottom heats up to a maximum of 37.7 °C / 100 F, compared to the average of 36.7 °C / 98 F
(±) In idle usage, the average temperature for the upper side is 32.1 °C / 90 F, compared to the device average of 29.5 °C / 85 F.
(+) The palmrests and touchpad are reaching skin temperature as a maximum (34.4 °C / 93.9 F) and are therefore not hot.
(-) The average temperature of the palmrest area of similar devices was 27.7 °C / 81.9 F (-6.7 °C / -12 F).
| desligado | |
| Ocioso | |
| Carga |
|
| Dell Latitude 14 3470 6100U, HD Graphics 520, Toshiba MQ01ACF050, TN LED, 1366x768, 14.00 | Lenovo ThinkPad L460-20FVS01400 6500U, Radeon R5 M330, Toshiba HG6 THNSFJ256GCSU, IPS, 1920x1080, 14.00 | Lenovo ThinkPad E460-20EUS00000 6200U, Radeon R7 M360, Samsung CM871 MZ7LF192HCGS, IPS-Panel, 1920x1080, 14.00 | HP ProBook 440 G3 6200U, HD Graphics 520, Hitachi Travelstar Z7K500 HTS725050A7E630, TN, 1920x1080, 14.00 | |
|---|---|---|---|---|
| Power Consumption | -7% | -23% | -9% | |
| Idle Minimum * | 5 | 3.1 38% | 4.1 18% | 5.2 -4% |
| Idle Average * | 6.8 | 6.3 7% | 8 -18% | 8.2 -21% |
| Idle Maximum * | 8.9 | 7.9 11% | 8.9 -0% | 9 -1% |
| Load Average * | 26.2 | 29.5 -13% | 39.3 -50% | 28.8 -10% |
| Load Maximum * | 31.8 | 57.3 -80% | 52.2 -64% | 34 -7% |
* ... smaller is better
| Dell Latitude 14 3470 6100U, HD Graphics 520, 41 Wh | Lenovo ThinkPad L460-20FVS01400 6500U, Radeon R5 M330, 48 Wh | HP ProBook 440 G3 6200U, HD Graphics 520, 44 Wh | Lenovo ThinkPad E460-20EUS00000 6200U, Radeon R7 M360, 47 Wh | |
|---|---|---|---|---|
| Battery Runtime | 32% | -14% | -2% | |
| Reader / Idle | 668 | 1153 73% | 537 -20% | 736 10% |
| WiFi v1.3 | 278 | 425 53% | 293 5% | 292 5% |
| Load | 140 | 97 -31% | 101 -28% | 112 -20% |
| H.264 | 431 | 321 | 425 |
Pro
Contra
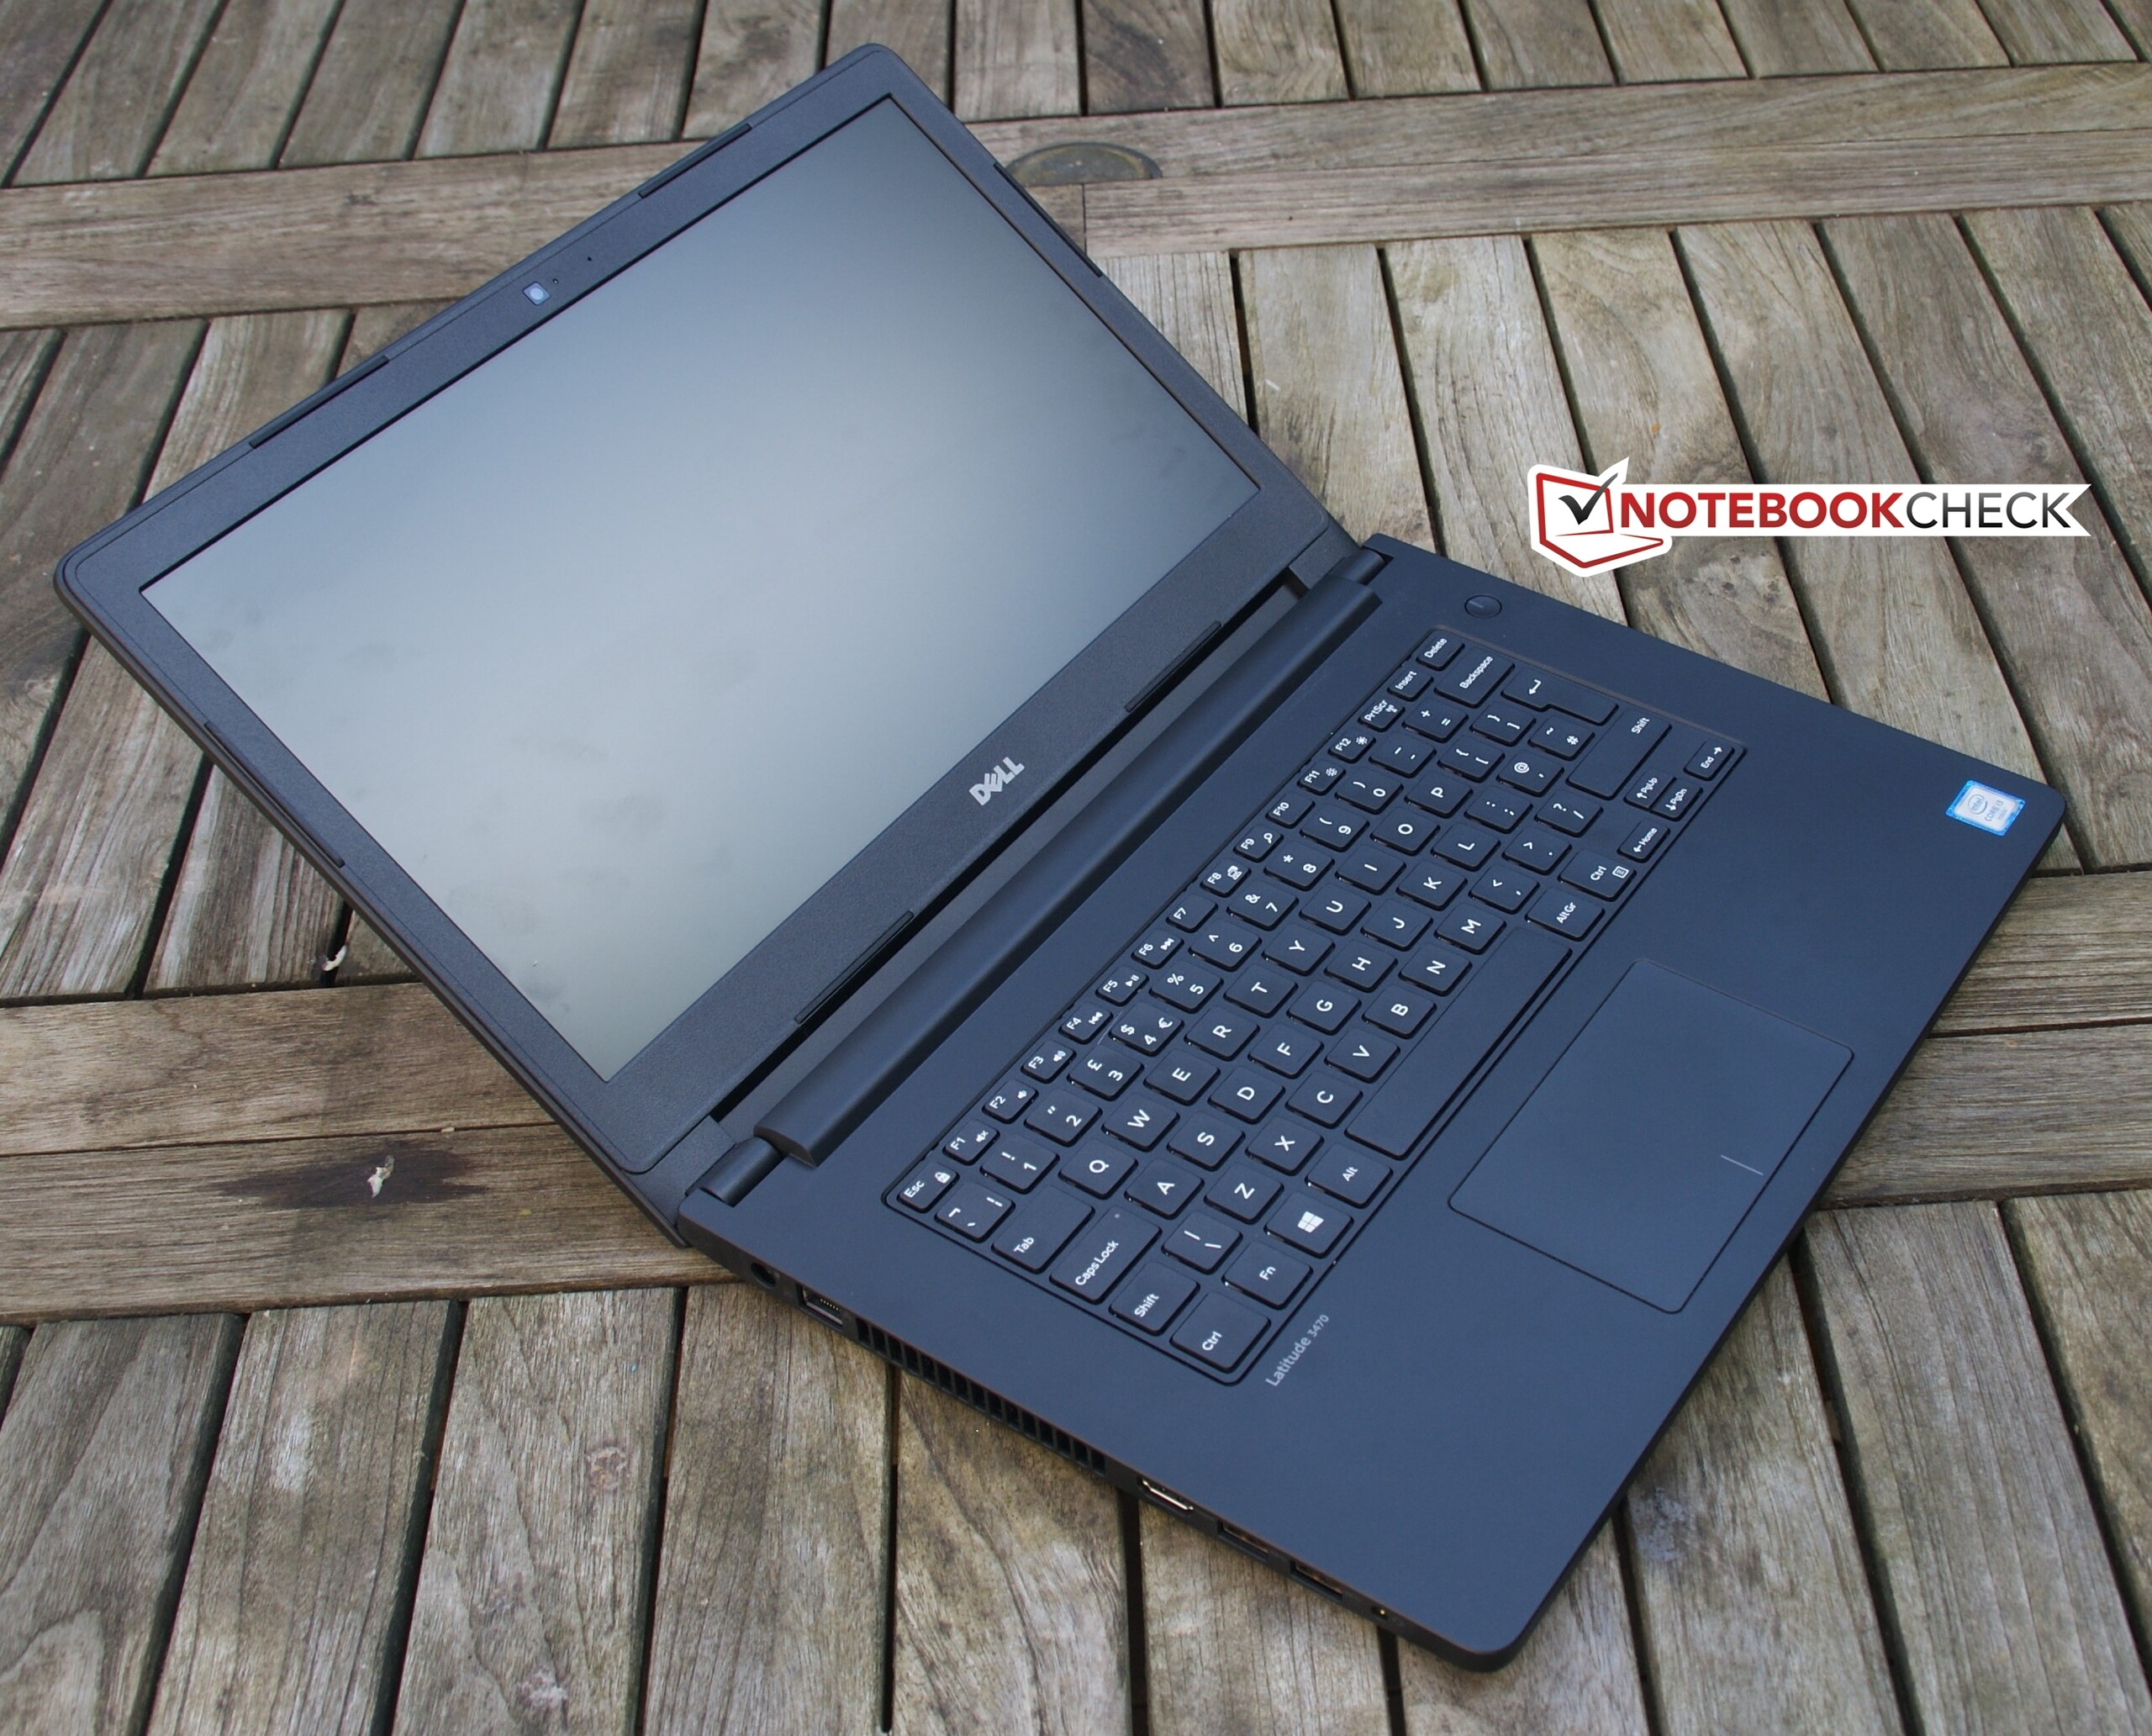
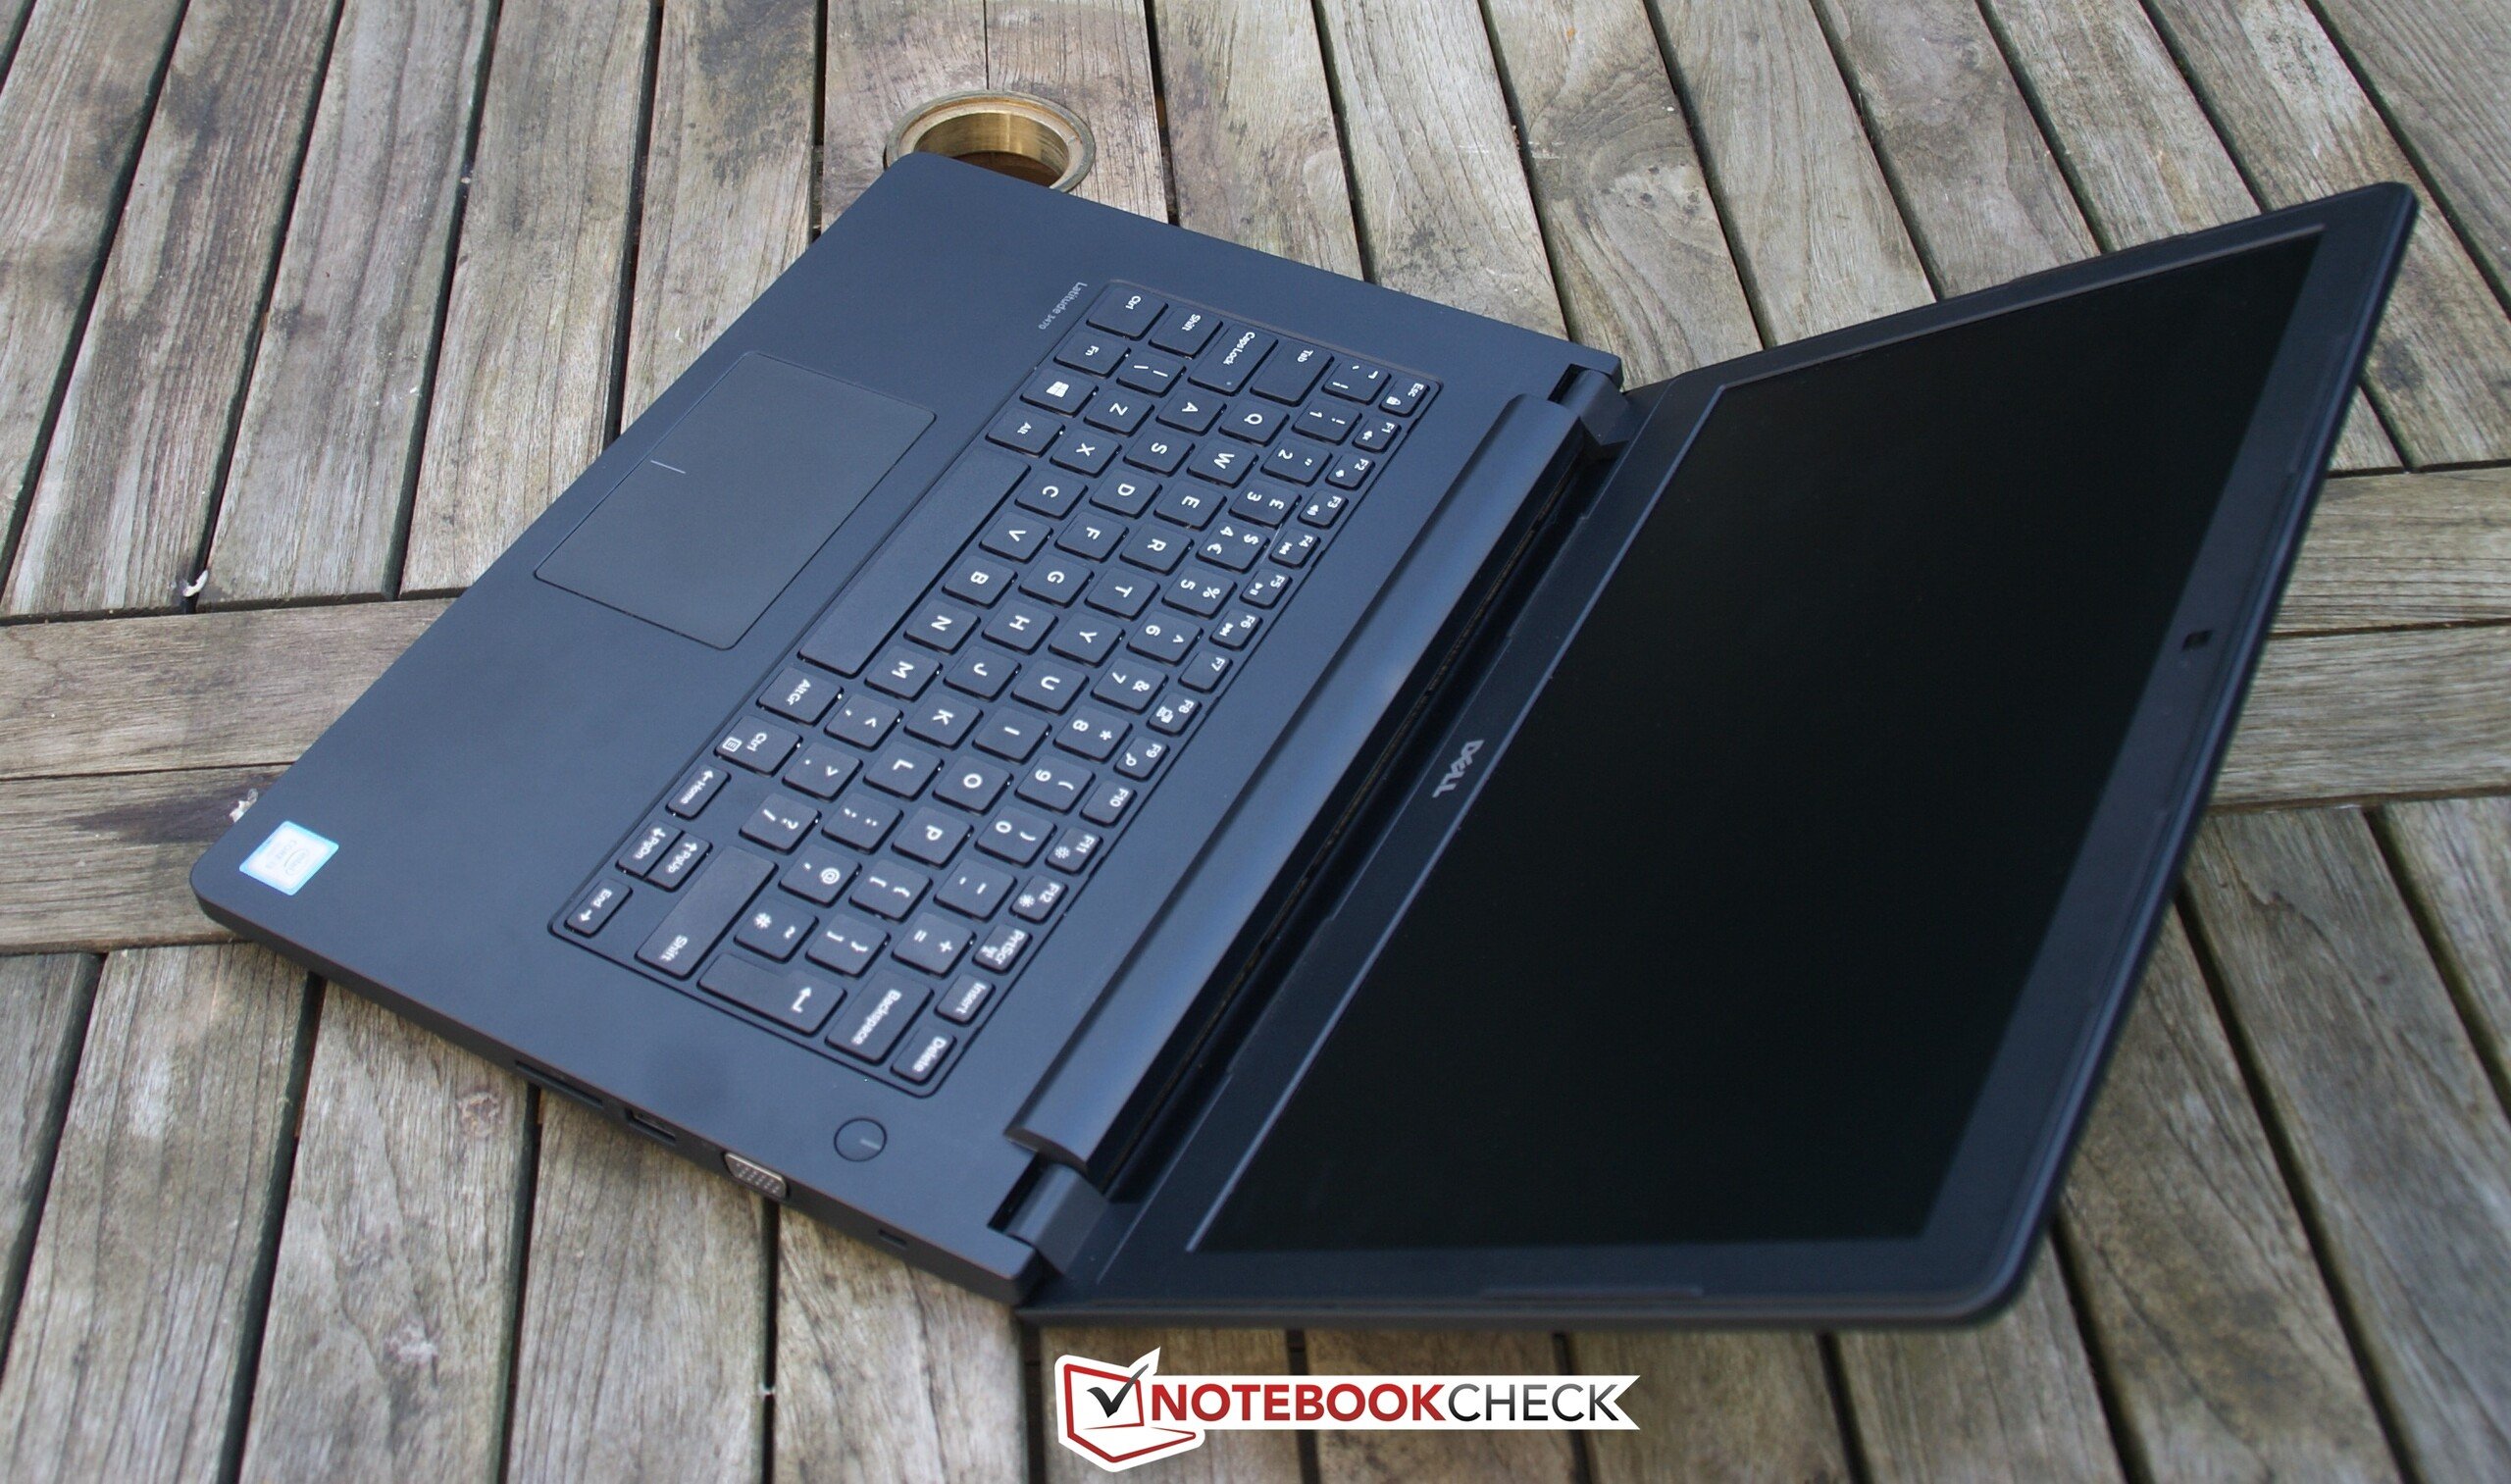
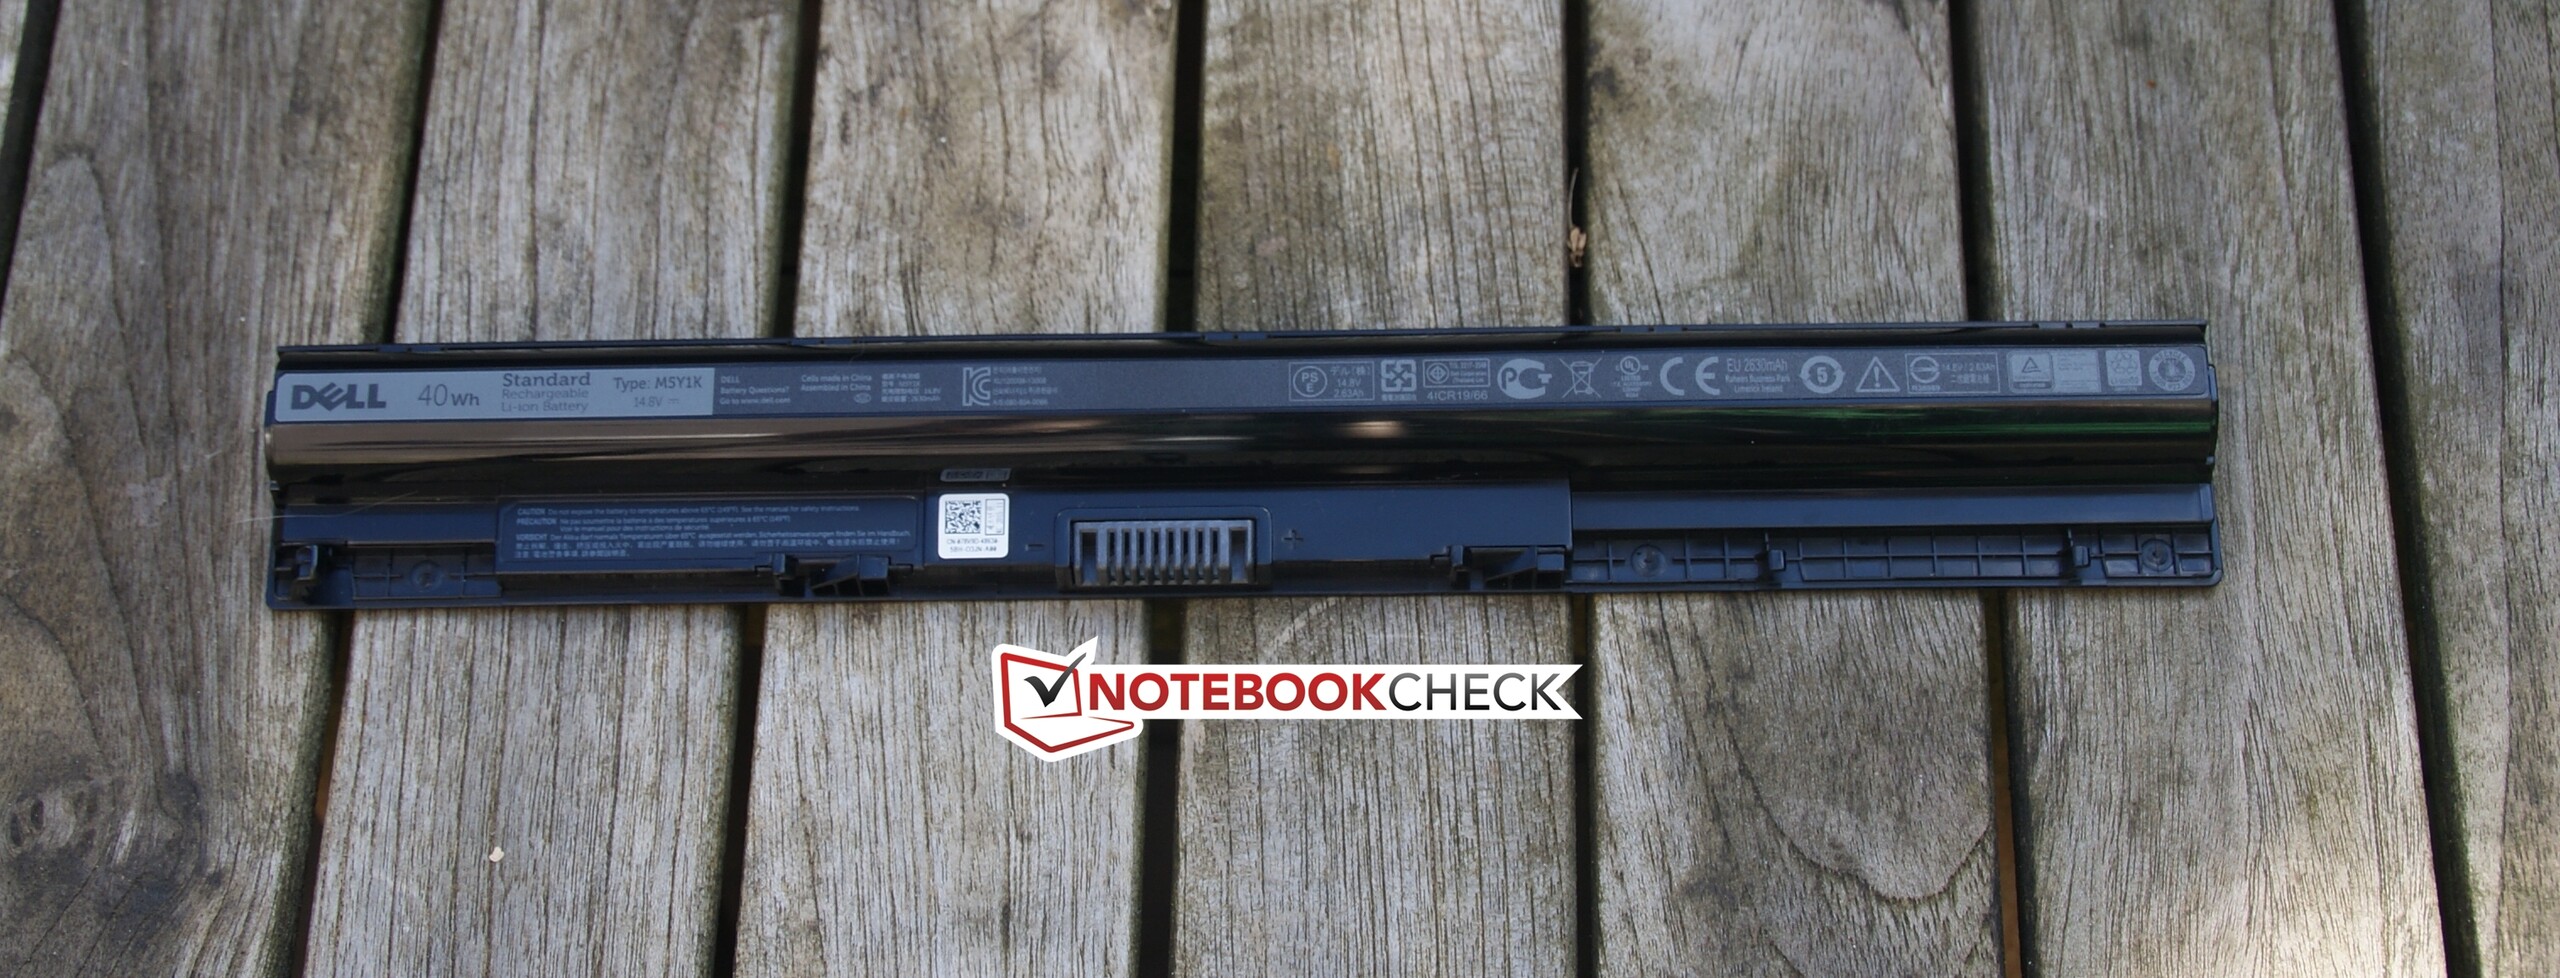
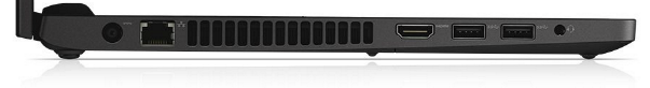
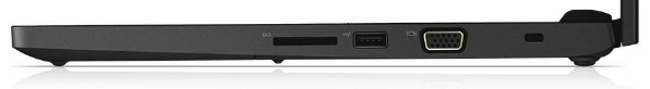
Queremos começar com alguns aspectos positivos: A tela do Latitude 3470 é mate, a bateria pode ser substituída e a seleção das portas é adequada para o seu tamanho. O teclado, embora esteja longe dos Latitudes mais caros, é melhor, comparado com aparelhos para usuários privados nesta faixa de preços. Finalmente, a tampa e o pousa palmas têm uma superfície emborrachada suave que fornece uma sensação táctil confortável.
Infelizmente isso seria tudo, especialmente porque esses aspectos positivos já estão bem detalhados. Se der uma olhada em todo o sistema, a Dell deseja atrair clientes com um recurso em particular: o preço. A Dell economiza dinheiro em muitas áreas para conseguir isso: O sistema de resfriamento não é suficientemente poderoso, porque as ventoinhas tendem a funcionar o tempo todo e o aparelho ainda esquenta. A Dell também implementa um leitor de cartões muito lento, onde o slot é pequeno demais para expansões de armazenamento permanentes. A tela é mate, mas deixa muito a desejar em outros aspectos. Os recursos empresariais também não são muito convincentes: Você não recebe um TrackPoint, o que normalmente é comum para aparelhos empresariais, uma porta docking ou um leitor de SmartCard.
O Dell Latitude 3470 convence... com o quê? Principalmente com o preço. De outra forma, o Latitude não oferece os mesmos recursos que os rivais da HP e Lenovo, e a escolha dos componentes está muito limitada para usuários privados na Alemanha.
No final, não podemos recomendar plenamente o 3470, exceto se você realmente deseja um sistema empresarial por um preço tão baixo. Os recursos do modelo de teste não conseguem se comparar com os aparelhos de comparação, mas eles também são amis caros que o modelo de teste.
Dell Latitude 14 3470
-
09/13/2016 v5.1(old)
Benjamin Herzig
Pricecompare
