 Deutsch
 English
 Español
 Français
 Italiano
 Nederlands
 Polski
 Português
 Русский
 Türkçe
 Svenska
 Chinese
 Magyar
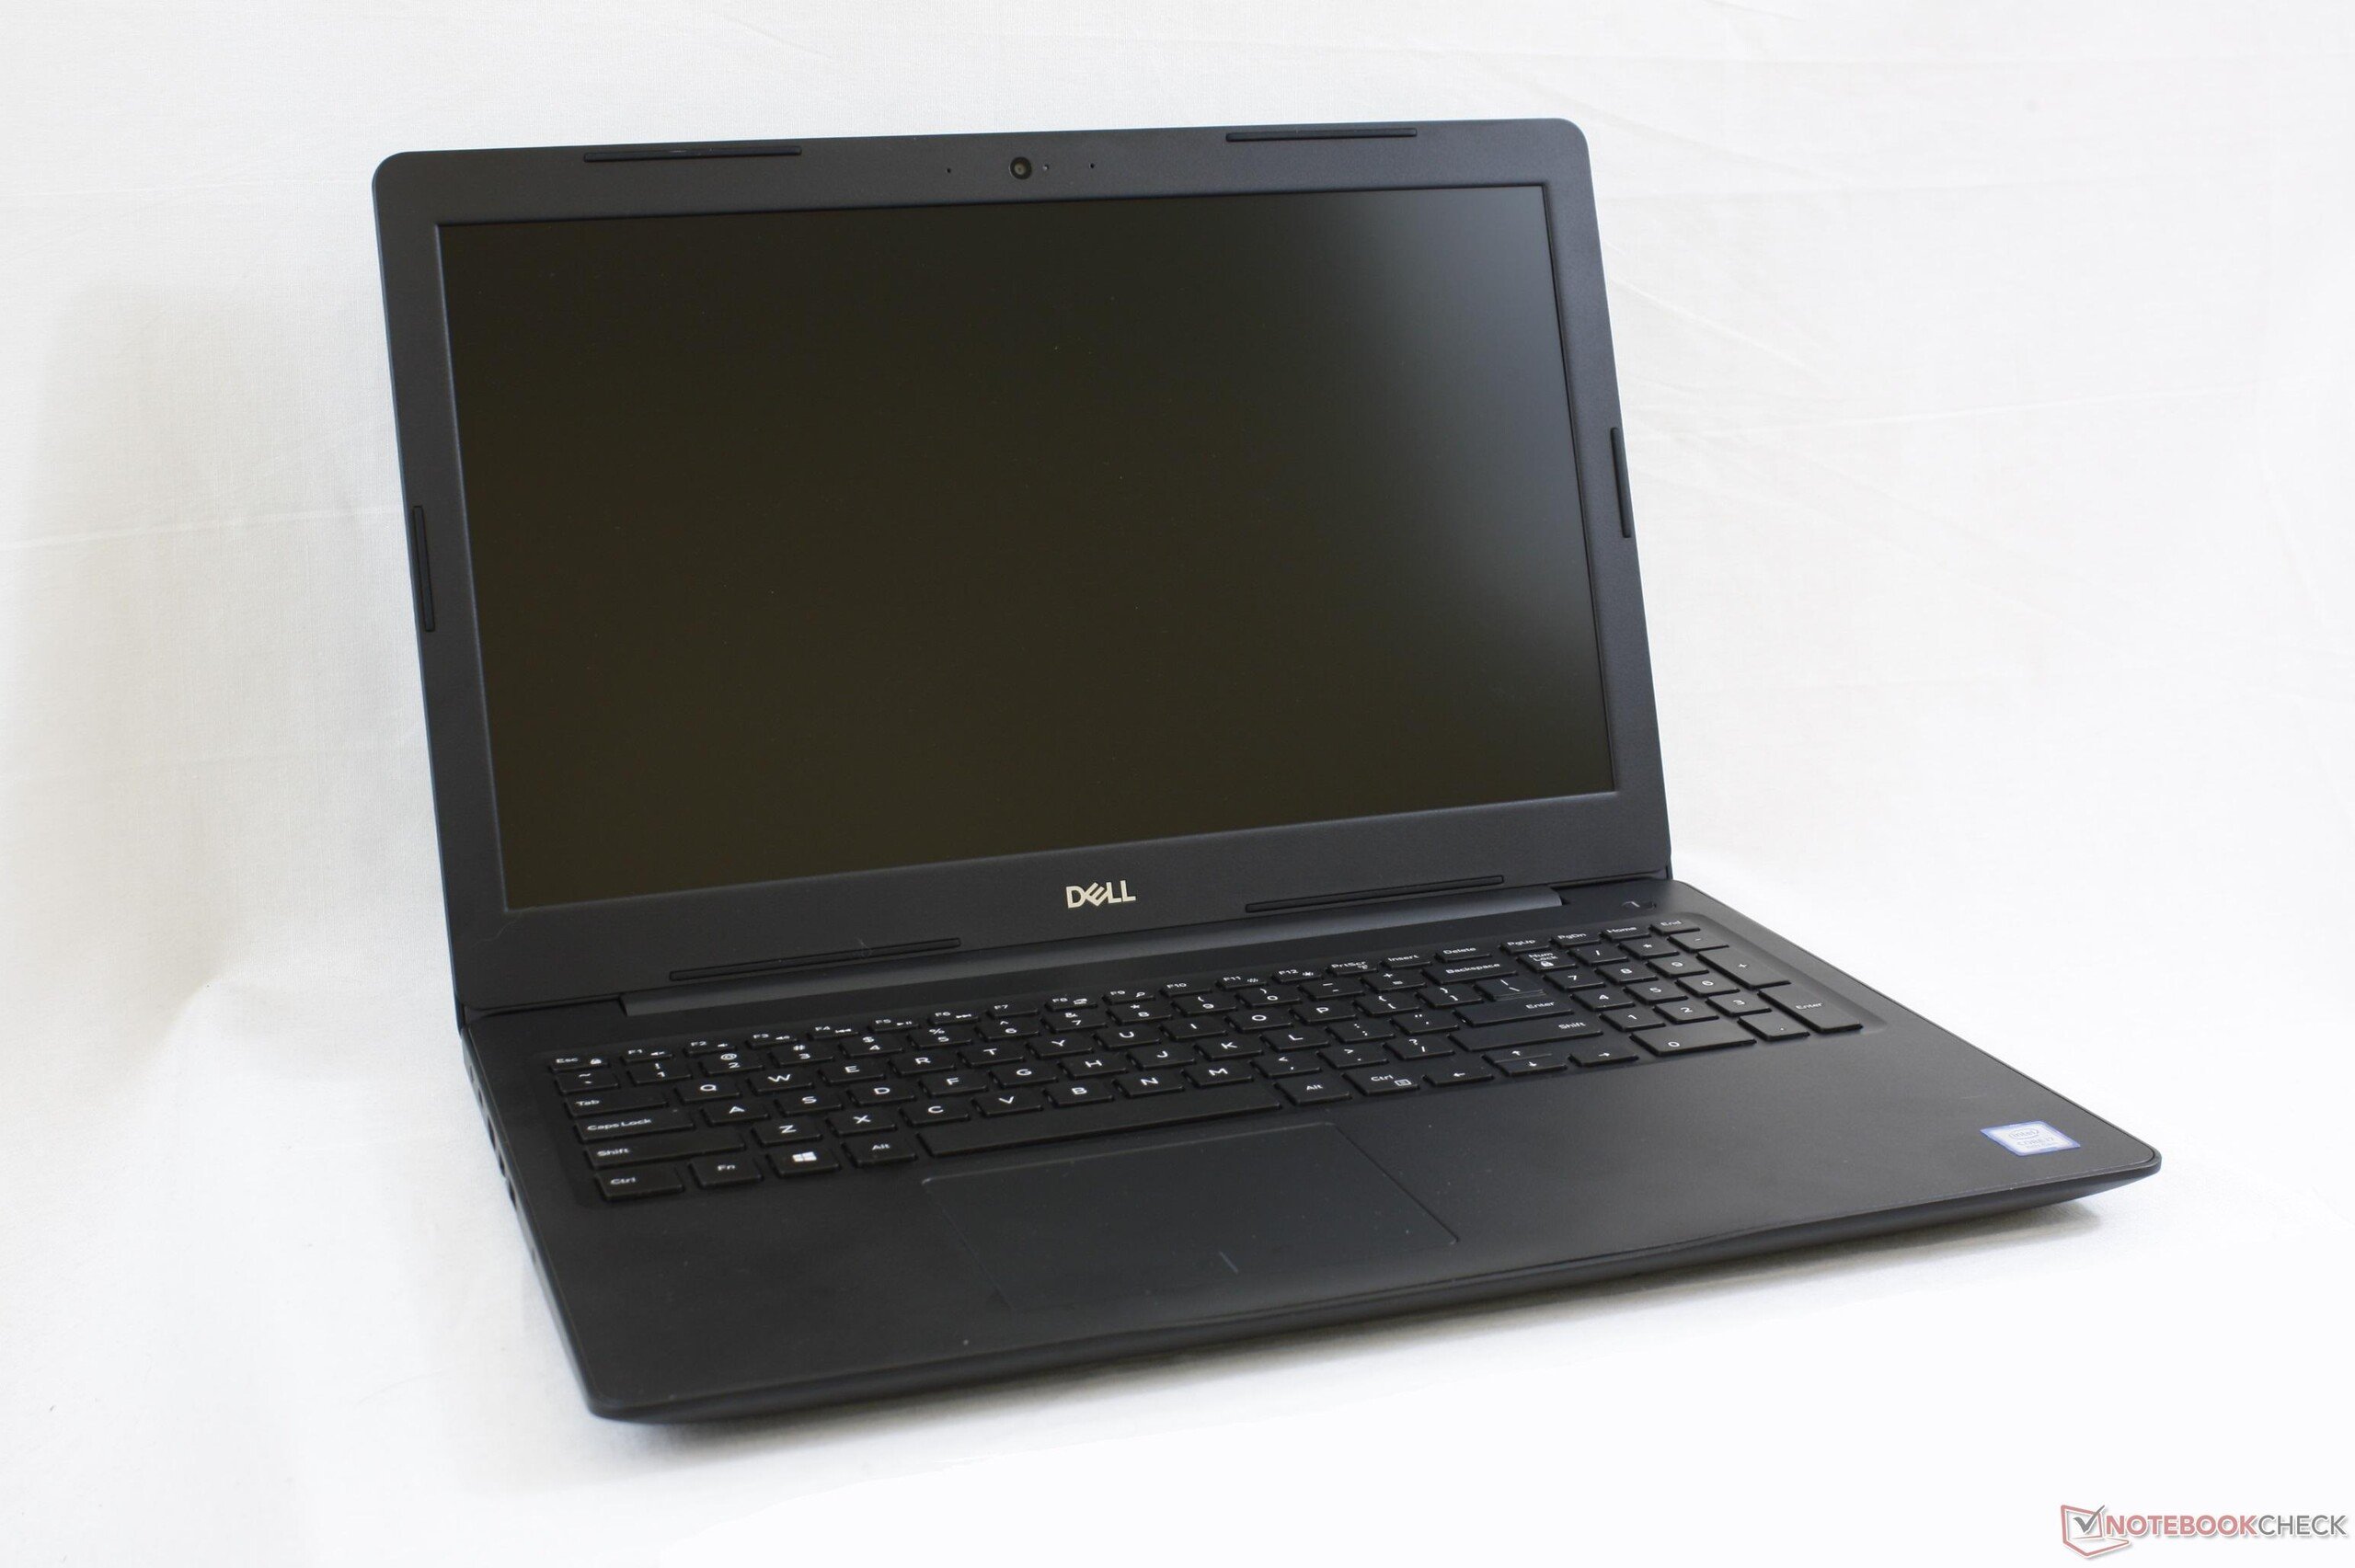
Breve Análise do Portátil Dell Latitude 15 3590 (i7-8550U, Radeon 530)
| SD Card Reader | |
| average JPG Copy Test (av. of 3 runs) | |
| Dell XPS 15 9570 i7 UHD (Toshiba Exceria Pro SDXC 64 GB UHS-II) | |
| HP ProBook 650 G4 3UP57EA (Toshiba Exceria Pro M501 microSDXC 64GB) | |
| Dell Latitude 15 3590-K8JP (Toshiba Exceria Pro SDXC 64 GB UHS-II) | |
| maximum AS SSD Seq Read Test (1GB) | |
| Dell XPS 15 9570 i7 UHD (Toshiba Exceria Pro SDXC 64 GB UHS-II) | |
| HP ProBook 650 G4 3UP57EA (Toshiba Exceria Pro M501 microSDXC 64GB) | |
| Dell Latitude 15 3590-K8JP (Toshiba Exceria Pro SDXC 64 GB UHS-II) | |
| Networking | |
| iperf3 transmit AX12 | |
| Dell XPS 15 9570 i7 UHD | |
| Dell Latitude 15 3590-K8JP | |
| HP ProBook 650 G4 3UP57EA | |
| iperf3 receive AX12 | |
| Dell Latitude 15 3590-K8JP | |
| HP ProBook 650 G4 3UP57EA | |
| Dell XPS 15 9570 i7 UHD | |
| |||||||||||||||||||||||||
iluminação: 85 %
iluminação com acumulador: 229.9 cd/m²
Contraste: 451:1 (Preto: 0.51 cd/m²)
ΔE Color 12.49 | 0.5-29.43 Ø5, calibrated: 4.01
ΔE Greyscale 12.6 | 0.57-98 Ø5.3
56.2% sRGB (Argyll 1.6.3 3D)
35.7% AdobeRGB 1998 (Argyll 1.6.3 3D)
38.68% AdobeRGB 1998 (Argyll 2.2.0 3D)
56.4% sRGB (Argyll 2.2.0 3D)
37.44% Display P3 (Argyll 2.2.0 3D)
Gamma: 1.84
| Dell Latitude 15 3590-K8JP AU Optronics AUO38ED, TN LED, 15.60, 1920x1080 | Dell XPS 15 9570 i7 UHD LQ156D1, IPS, 15.60, 3840x2160 | Acer TravelMate P2510-G2-MG-50WE Chi Mei CMN15D3, IPS, 15.60, 1920x1080 | HP ProBook 650 G4 3UP57EA CMN15D3, IPS LED, 15.60, 1920x1080 | Fujitsu Lifebook E558 E5580MP581DE LG Philips LP156WFB-SPB1, IPS, 15.60, 1920x1080 | |
|---|---|---|---|---|---|
| Display | 97% | 13% | 12% | -6% | |
| Display P3 Coverage | 37.44 | 79.1 111% | 42.27 13% | 41.89 12% | 35.25 -6% |
| sRGB Coverage | 56.4 | 98.8 75% | 63.5 13% | 63 12% | 53 -6% |
| AdobeRGB 1998 Coverage | 38.68 | 79.2 105% | 43.69 13% | 43.28 12% | 36.43 -6% |
| Response Times | -104% | -93% | -47% | -59% | |
| Response Time Grey 50% / Grey 80% * | 29.6 ? | 46.4 ? -57% | 40 ? -35% | 31 ? -5% | 36 ? -22% |
| Response Time Black / White * | 12.8 ? | 32 ? -150% | 32 ? -150% | 24 ? -88% | 25 ? -95% |
| PWM Frequency | 980 ? | 25000 ? | 1000 ? | ||
| Screen | 82% | 50% | 40% | 48% | |
| Brightness middle | 229.9 | 494 115% | 259 13% | 305 33% | 231 0% |
| Brightness | 219 | 457 109% | 230 5% | 270 23% | 227 4% |
| Brightness Distribution | 85 | 88 4% | 82 -4% | 80 -6% | 88 4% |
| Black Level * | 0.51 | 0.34 33% | 0.19 63% | 0.39 24% | 0.16 69% |
| Contrast | 451 | 1453 222% | 1363 202% | 782 73% | 1444 220% |
| Colorchecker dE 2000 * | 12.49 | 5.2 58% | 3.13 75% | 3.26 74% | 4.83 61% |
| Colorchecker dE 2000 max. * | 22.29 | 17.5 21% | 7.81 65% | 6.84 69% | 8.42 62% |
| Colorchecker dE 2000 calibrated * | 4.01 | 3.09 23% | |||
| Greyscale dE 2000 * | 12.6 | 2.7 79% | 1.42 89% | 1.98 84% | 3.49 72% |
| Gamma | 1.84 120% | 2.1 105% | 2.36 93% | 2.38 92% | 2.54 87% |
| CCT | 13565 48% | 7038 92% | 6391 102% | 6540 99% | 6233 104% |
| Color Space (Percent of AdobeRGB 1998) | 35.7 | 71.2 99% | 40 12% | 40 12% | 34 -5% |
| Color Space (Percent of sRGB) | 56.2 | 98.8 76% | 63 12% | 63 12% | 53 -6% |
| Total Average (Program / Settings) | 25% /
60% | -10% /
26% | 2% /
23% | -6% /
23% |
* ... smaller is better
Display Response Times
| ↔ Response Time Black to White | ||
|---|---|---|
| 12.8 ms ... rise ↗ and fall ↘ combined | ↗ 8.4 ms rise |  |
| ↘ 4.4 ms fall | ||
| The screen shows good response rates in our tests, but may be too slow for competitive gamers. In comparison, all tested devices range from 0.1 (minimum) to 240 (maximum) ms. » 28 % of all devices are better. This means that the measured response time is better than the average of all tested devices (21.5 ms). | ||
| ↔ Response Time 50% Grey to 80% Grey | ||
| 29.6 ms ... rise ↗ and fall ↘ combined | ↗ 17.2 ms rise | 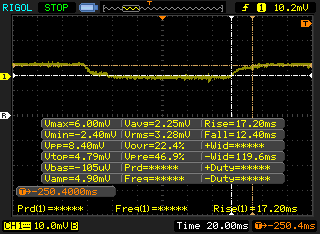 |
| ↘ 12.4 ms fall | ||
| The screen shows relatively slow response rates in our tests and may be too slow for gamers. In comparison, all tested devices range from 0.2 (minimum) to 636 (maximum) ms. » 33 % of all devices are better. This means that the measured response time is better than the average of all tested devices (33.8 ms). | ||
Screen Flickering / PWM (Pulse-Width Modulation)
| Screen flickering / PWM not detected | 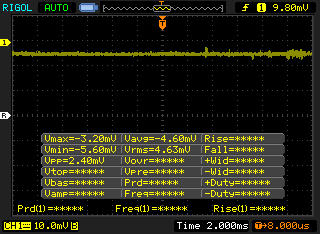 | ||
In comparison: 53 % of all tested devices do not use PWM to dim the display. If PWM was detected, an average of 17933 (minimum: 5 - maximum: 3846000) Hz was measured. | |||

| Cinebench R15 | |
| CPU Single 64Bit | |
| Alienware 17 R5 | |
| Dell G3 15 3579 | |
| Dell Latitude 15 3590-K8JP | |
| Average Intel Core i7-8550U (108 - 172, n=76) | |
| Apple MacBook Pro 13 2018 Touchbar i5 | |
| Lenovo ThinkPad 13 20J1005TPB | |
| Lenovo ThinkPad L580-20LW000VGE | |
| HP EliteBook 755 G5 3UN79EA | |
| Lenovo V330-15IKB | |
| Lenovo IdeaPad Miix 320-10ICR Pro LTE | |
| CPU Multi 64Bit | |
| Alienware 17 R5 | |
| Dell G3 15 3579 | |
| Apple MacBook Pro 13 2018 Touchbar i5 | |
| Apple MacBook Pro 13 2018 Touchbar i5 | |
| HP EliteBook 755 G5 3UN79EA | |
| Lenovo ThinkPad L580-20LW000VGE | |
| Dell Latitude 15 3590-K8JP | |
| Average Intel Core i7-8550U (301 - 761, n=78) | |
| Lenovo ThinkPad 13 20J1005TPB | |
| Lenovo V330-15IKB | |
| Lenovo IdeaPad Miix 320-10ICR Pro LTE | |
| Cinebench R11.5 | |
| CPU Single 64Bit | |
| Alienware 17 R5 | |
| Average Intel Core i7-8550U (1.43 - 1.95, n=32) | |
| Lenovo V330-15IKB | |
| CPU Multi 64Bit | |
| Alienware 17 R5 | |
| Average Intel Core i7-8550U (4.38 - 8.56, n=32) | |
| Lenovo V330-15IKB | |
| Cinebench R10 | |
| Rendering Multiple CPUs 32Bit | |
| Average Intel Core i7-8550U (11694 - 24180, n=31) | |
| Lenovo V330-15IKB | |
| Rendering Single 32Bit | |
| Average Intel Core i7-8550U (4202 - 8211, n=31) | |
| Lenovo V330-15IKB | |
| wPrime 2.10 - 1024m | |
| Lenovo V330-15IKB | |
| Lenovo ThinkPad 13 20J1005TPB | |
| Average Intel Core i7-8550U (258 - 435, n=11) | |
* ... smaller is better
| PCMark 8 | |
| Home Score Accelerated v2 | |
| Average of class Office (2304 - 4830, n=12, last 2 years) | |
| Dell Latitude 15 3590-K8JP | |
| Dell XPS 15 9570 i7 UHD | |
| HP ProBook 650 G4 3UP57EA | |
| Fujitsu Lifebook E558 E5580MP581DE | |
| Acer TravelMate P2510-G2-MG-50WE | |
| Lenovo ThinkPad L580-20LW000VGE | |
| Work Score Accelerated v2 | |
| HP ProBook 650 G4 3UP57EA | |
| Dell Latitude 15 3590-K8JP | |
| Acer TravelMate P2510-G2-MG-50WE | |
| Lenovo ThinkPad L580-20LW000VGE | |
| Fujitsu Lifebook E558 E5580MP581DE | |
| Dell XPS 15 9570 i7 UHD | |
| Average of class Office (1854 - 5610, n=12, last 2 years) | |
| PCMark 10 - Score | |
| Average of class Office (2325 - 7157, n=105, last 2 years) | |
| Dell XPS 15 9570 i7 UHD | |
| HP ProBook 650 G4 3UP57EA | |
| Lenovo ThinkPad L580-20LW000VGE | |
| Dell Latitude 15 3590-K8JP | |
| Fujitsu Lifebook E558 E5580MP581DE | |
| PCMark 8 Home Score Accelerated v2 | 3983 pontos | |
| PCMark 8 Work Score Accelerated v2 | 4781 pontos | |
| PCMark 10 Score | 3455 pontos | |
Ajuda | ||
| Dell Latitude 15 3590-K8JP Toshiba MQ01ACF050 | Asus VivoBook 15 F510UF-ES71 Seagate Mobile HDD 1TB ST1000LM035 | MSI Prestige PS42 8RB-059 Toshiba KSG60ZMV512G | Dell XPS 15 2018 i5 FHD 97Wh Lite-On CA3-8D256-Q11 | Lenovo IdeaPad 330-15ARR-81D2005JGE Seagate Mobile HDD 1TB ST1000LM035 | |
|---|---|---|---|---|---|
| CrystalDiskMark 5.2 / 6 | 15% | 7598% | 9873% | -30% | |
| Write 4K | 1.216 | 1.283 6% | 96.3 7819% | 89.4 7252% | 0.217 -82% |
| Read 4K | 0.451 | 0.493 9% | 25.29 5508% | 44.64 9798% | 0.367 -19% |
| Write Seq | 117.6 | 79.3 -33% | 475.8 305% | 830 606% | 98.8 -16% |
| Read Seq | 120 | 136.7 14% | 464.5 287% | 1774 1378% | 131.1 9% |
| Write 4K Q32T1 | 1.212 | 2.266 87% | 182 14917% | 310.6 25527% | 0.222 -82% |
| Read 4K Q32T1 | 0.844 | 1.068 27% | 264.6 31251% | 266.4 31464% | 0.781 -7% |
| Write Seq Q32T1 | 115.1 | 108.7 -6% | 512 345% | 831 622% | 97 -16% |
| Read Seq Q32T1 | 121.6 | 143.7 18% | 545 348% | 2962 2336% | 93.3 -23% |

| 3DMark 11 | |
| 1280x720 Performance GPU | |
| Dell G3 15 3579 | |
| MSI Prestige PS42 8RB-059 | |
| Apple MacBook Pro 13 2018 Touchbar i5 | |
| Dell Latitude 5591 | |
| HP EliteBook 755 G5 3UN79EA | |
| Dell Latitude 15 3590-K8JP | |
| Asus VivoBook S410UQ-NH74 | |
| Average AMD Radeon 530 (2113 - 2654, n=5) | |
| Lenovo ThinkPad X1 Carbon G6-20KG0025UK | |
| Acer Switch One 10 SW1-011-14UQ | |
| 1280x720 Performance Combined | |
| Dell G3 15 3579 | |
| MSI Prestige PS42 8RB-059 | |
| Dell Latitude 5591 | |
| Dell Latitude 15 3590-K8JP | |
| Apple MacBook Pro 13 2018 Touchbar i5 | |
| Asus VivoBook S410UQ-NH74 | |
| Average AMD Radeon 530 (1549 - 2816, n=5) | |
| HP EliteBook 755 G5 3UN79EA | |
| Lenovo ThinkPad X1 Carbon G6-20KG0025UK | |
| Acer Switch One 10 SW1-011-14UQ | |
| 3DMark 11 Performance | 2935 pontos | |
| 3DMark Cloud Gate Standard Score | 8707 pontos | |
| 3DMark Fire Strike Score | 1810 pontos | |
Ajuda | ||
| baixo | média | alto | ultra | |
| BioShock Infinite (2013) | 108.9 | 59.6 | 49.4 | 15.4 |
| The Witcher 3 (2015) | 32.8 | 19.8 | 11.1 | 6.3 |
| Rise of the Tomb Raider (2016) | 33.3 | 21.3 | 10.6 | 8.5 |
Barulho
| Ocioso |
| 31.6 / 31.8 / 31.8 dB |
| Carga |
| 45.5 / 48.8 dB |
 | ||
30 dB silencioso 40 dB(A) audível 50 dB(A) ruidosamente alto |
||
min: | ||
| Dell Latitude 15 3590-K8JP Radeon 530, i5-8550U, Toshiba MQ01ACF050 | Dell XPS 15 2018 i5 FHD 97Wh GeForce GTX 1050 Mobile, i5-8300H, Lite-On CA3-8D256-Q11 | Acer TravelMate P2510-G2-MG-50WE GeForce MX130, i5-8250U, SK Hynix HFS256G39TND-N210A | HP ProBook 650 G4 3UP57EA UHD Graphics 620, i5-8250U, Toshiba XG5 KXG50ZNV256G | Fujitsu Lifebook E558 E5580MP581DE UHD Graphics 620, i5-8250U, Micron 1100 MTFDDAV256TBN | HP EliteBook 755 G5 3UN79EA Vega 10, R7 2700U, Toshiba XG5 KXG50ZNV512G | Dell Latitude 5591 GeForce MX130, i7-8850H, Toshiba XG5 KXG50ZNV512G | |
|---|---|---|---|---|---|---|---|
| Noise | 7% | 8% | 4% | 11% | 8% | 3% | |
| off / environment * | 28.2 | 30.3 -7% | 30.3 -7% | 30.3 -7% | 30 -6% | 30.5 -8% | 29 -3% |
| Idle Minimum * | 31.6 | 30.3 4% | 30.3 4% | 32 -1% | 30 5% | 30.5 3% | 29 8% |
| Idle Average * | 31.8 | 30.3 5% | 30.3 5% | 33.8 -6% | 30 6% | 30.5 4% | 29 9% |
| Idle Maximum * | 31.8 | 30.3 5% | 31 3% | 34.2 -8% | 30 6% | 30.5 4% | 30.3 5% |
| Load Average * | 45.5 | 37.1 18% | 35.6 22% | 36.2 20% | 34.8 24% | 37.5 18% | 46.5 -2% |
| Witcher 3 ultra * | 49.2 | 43.3 12% | |||||
| Load Maximum * | 48.8 | 43 12% | 38.6 21% | 35.6 27% | 33.5 31% | 35 28% | 48.6 -0% |
* ... smaller is better
(-) The maximum temperature on the upper side is 52.6 °C / 127 F, compared to the average of 34.2 °C / 94 F, ranging from 21.2 to 62.5 °C for the class Office.
(±) The bottom heats up to a maximum of 44.4 °C / 112 F, compared to the average of 36.7 °C / 98 F
(+) In idle usage, the average temperature for the upper side is 28.2 °C / 83 F, compared to the device average of 29.5 °C / 85 F.
(±) Playing The Witcher 3, the average temperature for the upper side is 33.4 °C / 92 F, compared to the device average of 29.5 °C / 85 F.
(+) The palmrests and touchpad are cooler than skin temperature with a maximum of 31.2 °C / 88.2 F and are therefore cool to the touch.
(-) The average temperature of the palmrest area of similar devices was 27.7 °C / 81.9 F (-3.5 °C / -6.3 F).
Dell Latitude 15 3590-K8JP audio analysis
(±) | speaker loudness is average but good (75.3 dB)
Bass 100 - 315 Hz
(-) | nearly no bass - on average 22% lower than median
(±) | linearity of bass is average (12.2% delta to prev. frequency)
Mids 400 - 2000 Hz
(±) | reduced mids - on average 5.5% lower than median
(+) | mids are linear (5.6% delta to prev. frequency)
Highs 2 - 16 kHz
(+) | balanced highs - only 4.9% away from median
(±) | linearity of highs is average (12.5% delta to prev. frequency)
Overall 100 - 16.000 Hz
(±) | linearity of overall sound is average (25.3% difference to median)
Compared to same class
» 74% of all tested devices in this class were better, 7% similar, 19% worse
» The best had a delta of 7%, average was 22%, worst was 53%
Compared to all devices tested
» 74% of all tested devices were better, 6% similar, 21% worse
» The best had a delta of 4%, average was 25%, worst was 134%
Apple MacBook 12 (Early 2016) 1.1 GHz audio analysis
(+) | speakers can play relatively loud (83.6 dB)
Bass 100 - 315 Hz
(±) | reduced bass - on average 11.3% lower than median
(±) | linearity of bass is average (14.2% delta to prev. frequency)
Mids 400 - 2000 Hz
(+) | balanced mids - only 2.4% away from median
(+) | mids are linear (5.5% delta to prev. frequency)
Highs 2 - 16 kHz
(+) | balanced highs - only 2% away from median
(+) | highs are linear (4.5% delta to prev. frequency)
Overall 100 - 16.000 Hz
(+) | overall sound is linear (10.2% difference to median)
Compared to same class
» 5% of all tested devices in this class were better, 2% similar, 93% worse
» The best had a delta of 5%, average was 19%, worst was 53%
Compared to all devices tested
» 3% of all tested devices were better, 1% similar, 96% worse
» The best had a delta of 4%, average was 25%, worst was 134%
| desligado | |
| Ocioso | |
| Carga |
|
| Dell Latitude 15 3590-K8JP i5-8550U, Radeon 530, Toshiba MQ01ACF050, TN LED, 1920x1080, 15.60 | Dell XPS 15 9570 i7 UHD i7-8750H, GeForce GTX 1050 Ti Max-Q, Toshiba XG5 KXG50ZNV512G, IPS, 3840x2160, 15.60 | Acer TravelMate P2510-G2-MG-50WE i5-8250U, GeForce MX130, SK Hynix HFS256G39TND-N210A, IPS, 1920x1080, 15.60 | HP ProBook 650 G4 3UP57EA i5-8250U, UHD Graphics 620, Toshiba XG5 KXG50ZNV256G, IPS LED, 1920x1080, 15.60 | HP EliteBook 755 G5 3UN79EA R7 2700U, Vega 10, Toshiba XG5 KXG50ZNV512G, IPS, 1920x1080, 15.60 | Huawei MateBook D 15-53010BAJ i5-8250U, GeForce MX150, Samsung SSD PM981 MZVLB512HAJQ, IPS, 1920x1080, 15.60 | |
|---|---|---|---|---|---|---|
| Power Consumption | -71% | 24% | 42% | 5% | 8% | |
| Idle Minimum * | 8.2 | 9.48 -16% | 3.3 60% | 3.2 61% | 5 39% | 4.2 49% |
| Idle Average * | 8.4 | 16.1 -92% | 5.6 33% | 6 29% | 10.6 -26% | 7.2 14% |
| Idle Maximum * | 8.4 | 16.9 -101% | 7.8 7% | 6.4 24% | 12.9 -54% | 12.1 -44% |
| Load Average * | 62.6 | 90.8 -45% | 54 14% | 34 46% | 40.6 35% | 51.1 18% |
| Witcher 3 ultra * | 53.6 | 52.7 2% | ||||
| Load Maximum * | 66.8 | 134.4 -101% | 63 6% | 34.4 49% | 46.6 30% | 59.9 10% |
* ... smaller is better
| Dell Latitude 15 3590-K8JP i5-8550U, Radeon 530, 56 Wh | Dell XPS 15 9570 i7 UHD i7-8750H, GeForce GTX 1050 Ti Max-Q, 97 Wh | Acer TravelMate P2510-G2-MG-50WE i5-8250U, GeForce MX130, 48 Wh | HP ProBook 650 G4 3UP57EA i5-8250U, UHD Graphics 620, 48 Wh | Fujitsu Lifebook E558 E5580MP581DE i5-8250U, UHD Graphics 620, 50 Wh | HP EliteBook 755 G5 3UN79EA R7 2700U, Vega 10, 56 Wh | |
|---|---|---|---|---|---|---|
| Battery Runtime | 4% | 14% | 20% | 5% | -3% | |
| Reader / Idle | 857 | 715 -17% | ||||
| WiFi v1.3 | 408 | 576 41% | 505 24% | 491 20% | 429 5% | 499 22% |
| Load | 114 | 76 -33% | 118 4% | 99 -13% | ||
| Witcher 3 ultra | 62 |
Pro
Contra
O Latitude 3590 é voltado para usuários de negócios conscientes do orçamento que não estão procurando a melhor tela ou o design atraente. É um sistema abaixo do esperado que mal faz o trabalho com suas cores mal calibradas, teclas de plástico baratas, ruído do ventilador relativamente alto e trackpad macio. Nada mal para o preço inicial abaixo de $500, mas definitivamente não vale nada perto do preço de $1.000 das configurações de maior gama.
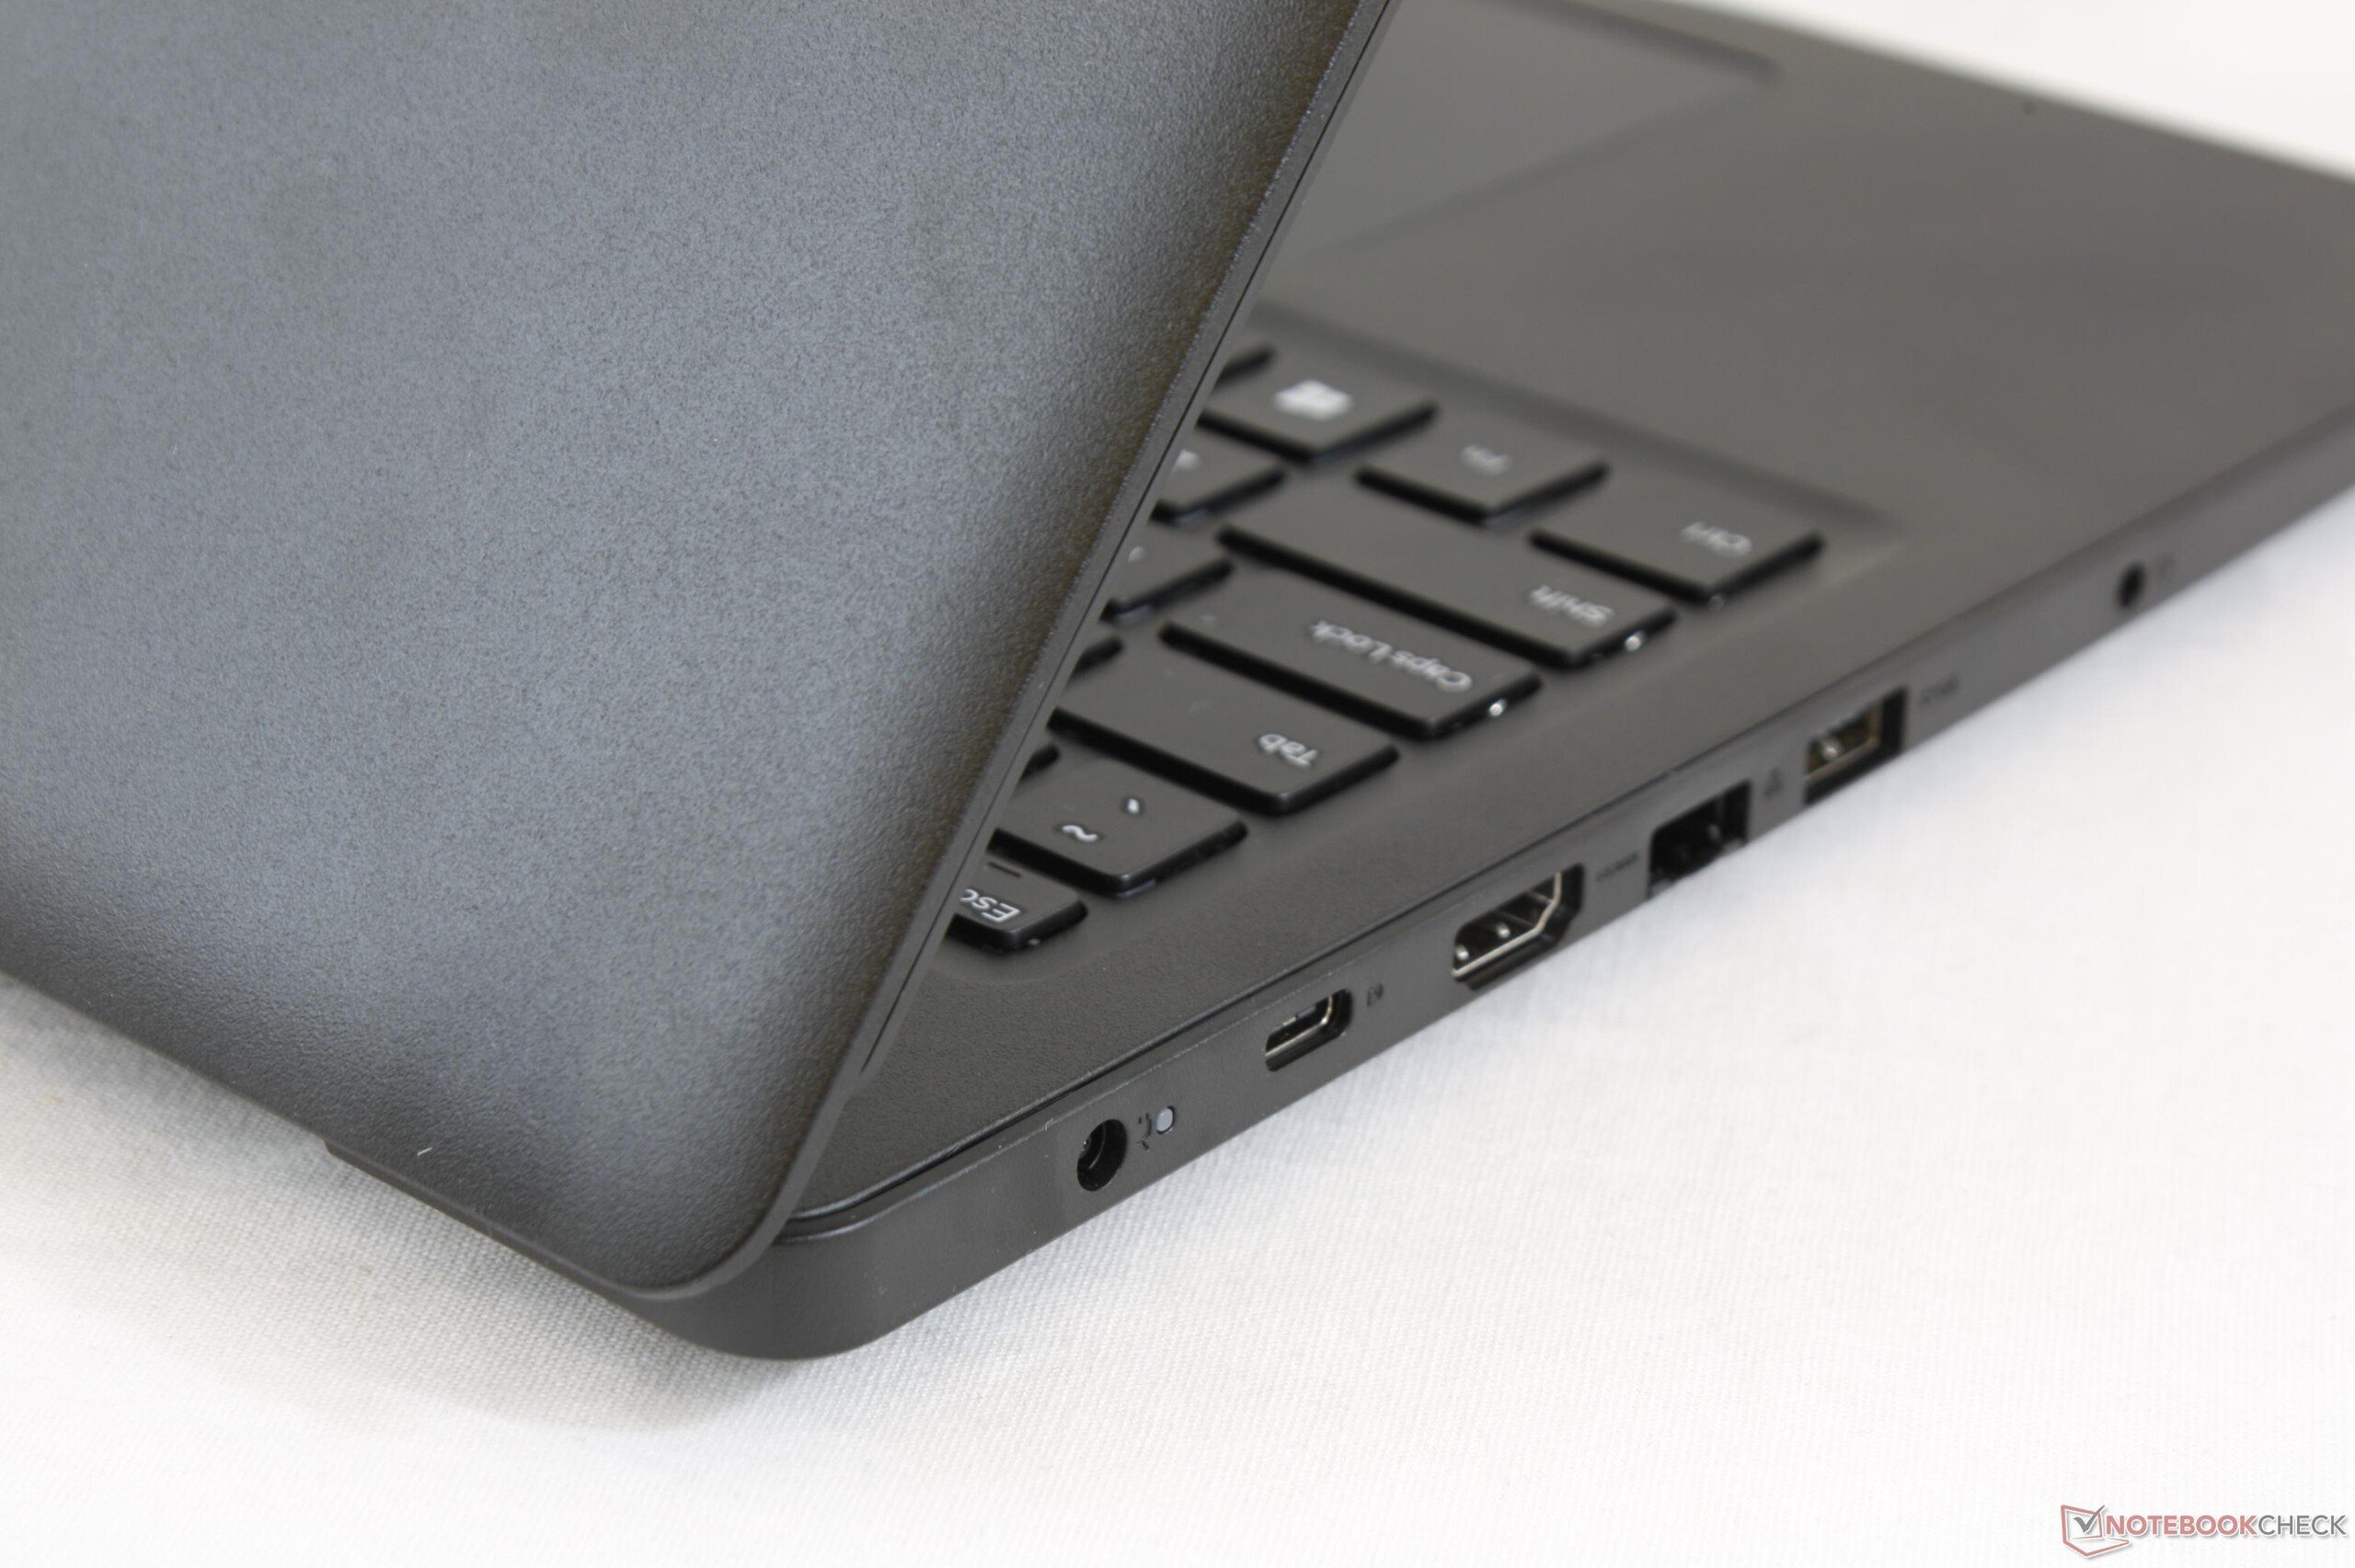
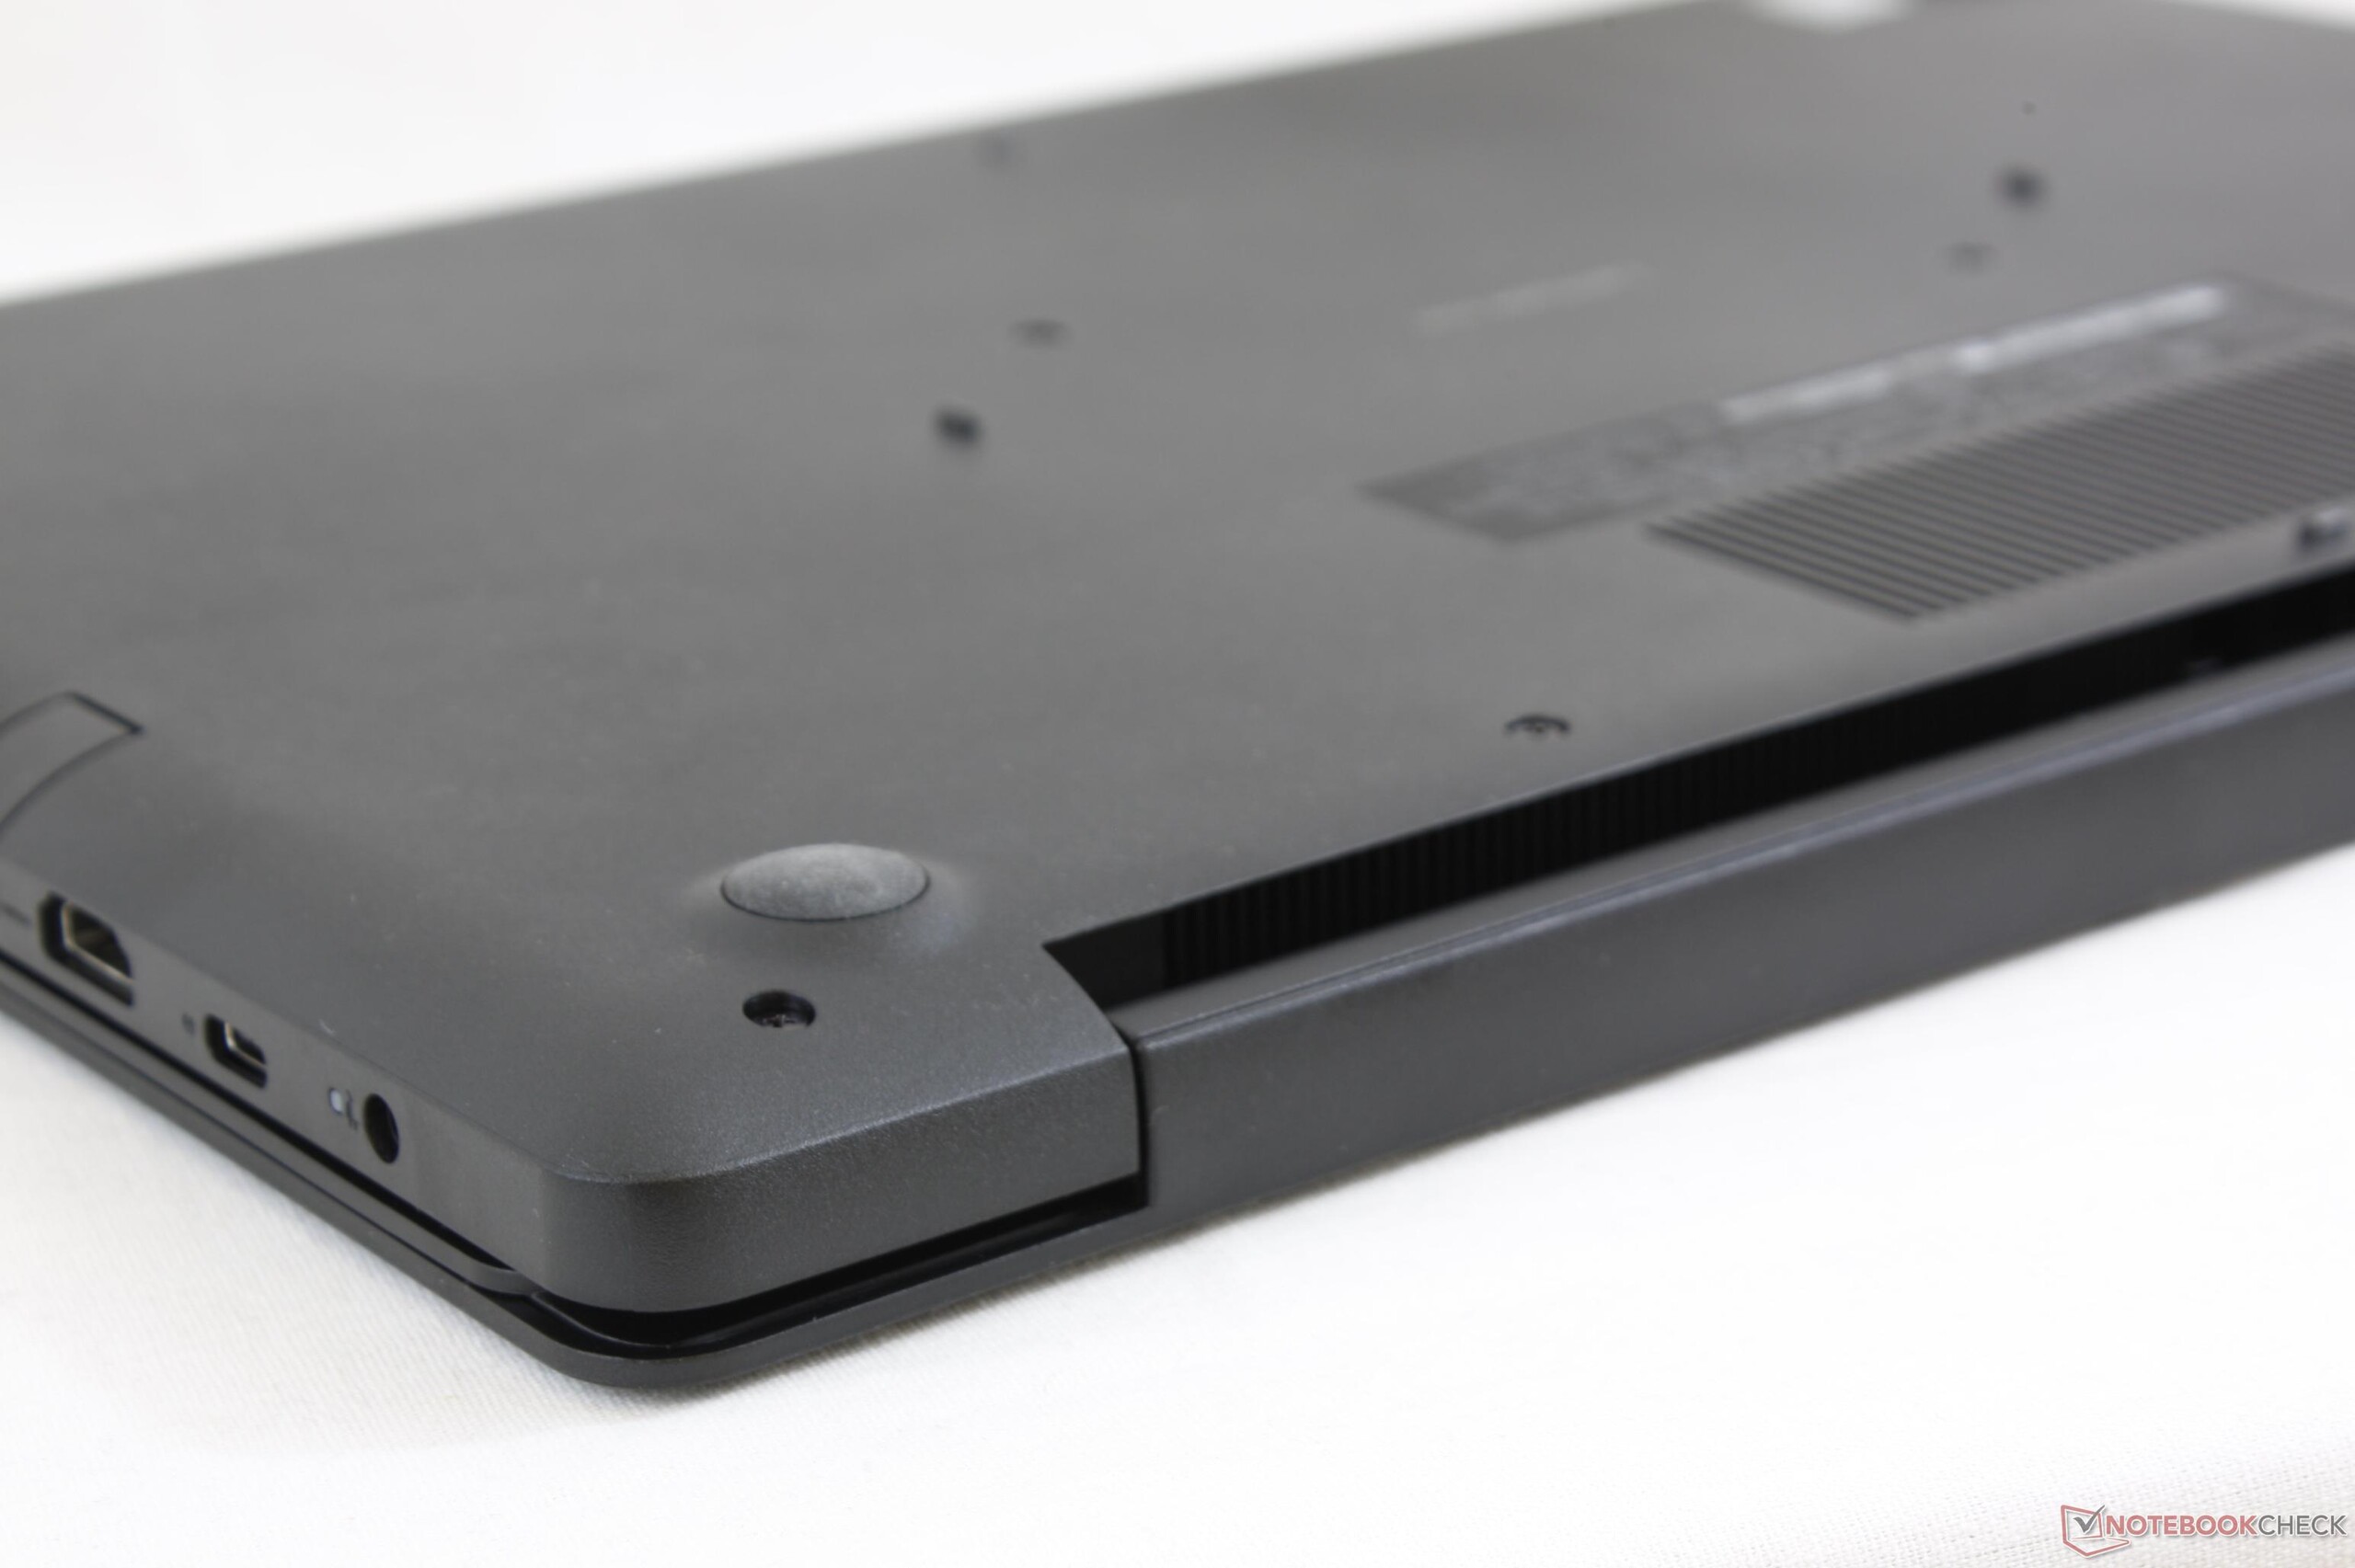
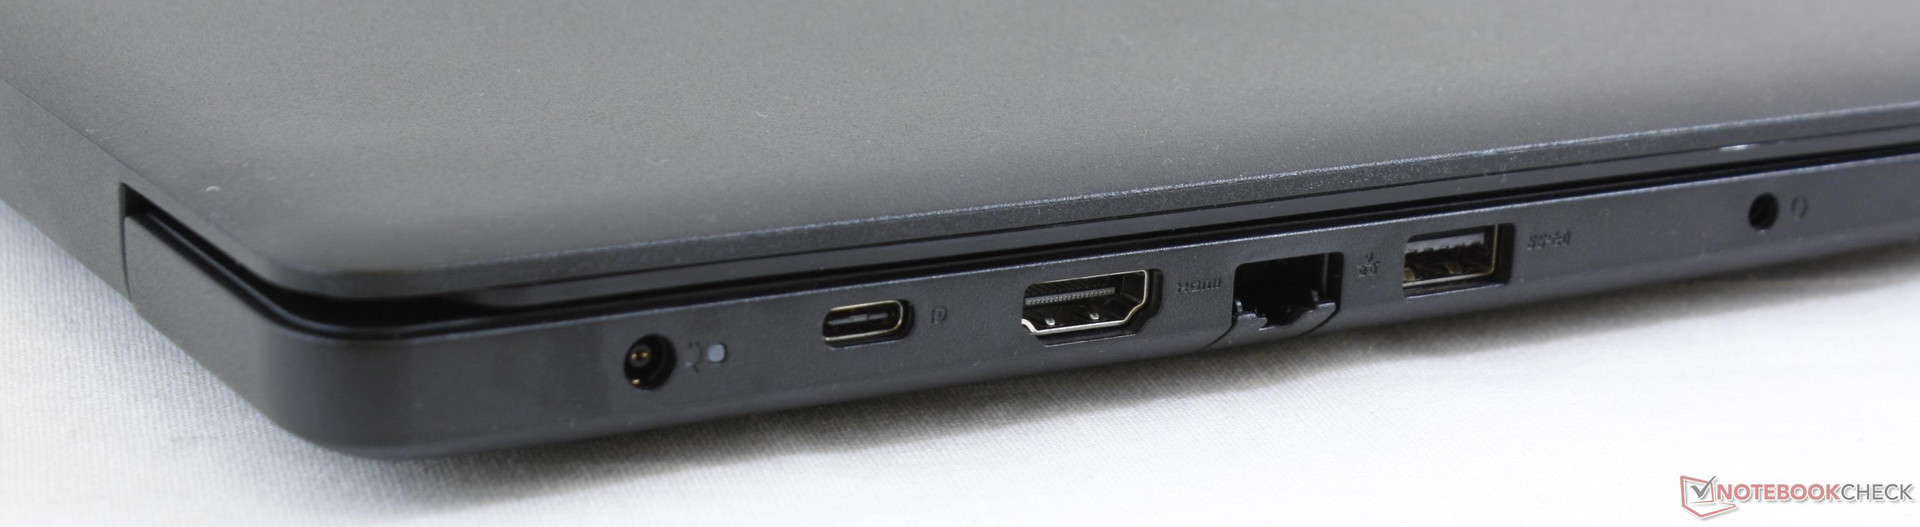
Existem inúmeros aspectos desatualizados do Latitude 3590 que esperamos que sejam abordados em revisões futuras. Em primeiro lugar, o adaptador de CA proprietário é inconveniente e se torna obsoleto quando o USB Type-C de carregamento de até 100 W está prontamente disponível. O concorrente ThinkPad E580, por exemplo, já trocou a porta do adaptador de CA para a porta USB Type-C. Em segundo lugar, o leitor de digitais opcional é apenas isso, em vez de ser combinado com o botão de energia como nos modelos XPS mais recentes. Finalmente, a falta de gráficos GeForce MX Pascal é lamentável, dado que já existe uma opção para a antiga Radeon 530. Esses novos recursos poderiam ter sido implementados sem afetar significativamente o preço do modelo.
As maiores razões para possuir um Latitude 3590 são seu baixo preço de entrada e as extensas opções de garantia disponíveis. De outra maneira, concorrentes como o HP ProBook 650 G, TravelMate P2510, e ThinkPad E580 são mais fáceis de fazer manutenção e oferecem um pouco mais pelo seu dinheiro. Evite as configurações mais caras, porque mesmo o Latitude 5590 mais barato seria uma compra superior.
Dell Latitude 15 3590-K8JP
-
09/20/2018 v6(old)
Allen Ngo
Pricecompare
