 Deutsch
 English
 Español
 Français
 Italiano
 Nederlands
 Polski
 Português
 Русский
 Türkçe
 Svenska
 Chinese
 Magyar
Breve Análise do Portátil Dell Latitude 7280 (7600U, FHD)
| SD Card Reader | |
| average JPG Copy Test (av. of 3 runs) | |
| Dell Latitude 12 E7270 | |
| HP EliteBook 820 G4 Z2V72ET | |
| Dell Latitude 7280 | |
| Lenovo ThinkPad X260-20F6007RGE | |
| maximum AS SSD Seq Read Test (1GB) | |
| Dell Latitude 12 E7270 | |
| Dell Latitude 7280 | |
| HP EliteBook 820 G4 Z2V72ET | |
| Lenovo ThinkPad X260-20F6007RGE | |
| Networking | |
| iperf3 transmit AX12 | |
| Dell Latitude 7280 | |
| HP EliteBook 820 G4 Z2V72ET (jseb) | |
| iperf3 receive AX12 | |
| Dell Latitude 7280 | |
| HP EliteBook 820 G4 Z2V72ET (jseb) | |
| |||||||||||||||||||||||||
iluminação: 88 %
iluminação com acumulador: 310.4 cd/m²
Contraste: 970:1 (Preto: 0.32 cd/m²)
ΔE Color 5.9 | 0.5-29.43 Ø5
ΔE Greyscale 5.1 | 0.57-98 Ø5.3
65% sRGB (Argyll 1.6.3 3D)
42% AdobeRGB 1998 (Argyll 1.6.3 3D)
45.9% AdobeRGB 1998 (Argyll 2.2.0 3D)
65.4% sRGB (Argyll 2.2.0 3D)
44.41% Display P3 (Argyll 2.2.0 3D)
Gamma: 2.33
| Dell Latitude 7280 AUO236D , IPS, 12.50, 1920x1080 | Dell Latitude 12 E7270 LG LP125WF4, IPS LED, 12.50, 1920x1080 | HP EliteBook 820 G4 Z2V72ET Chi Mei, IPS, 12.50, 1920x1080 | Razer Blade Stealth QHD i7-7500U Sharp SHP142F (LQ125T1JW02), , 12.50, 2560x1440 | Lenovo ThinkPad X260-20F6007RGE Lenovo N125HCE-GN1, IPS, 12.50, 1920x1080 | |
|---|---|---|---|---|---|
| Display | -10% | 0% | 51% | 1% | |
| Display P3 Coverage | 44.41 | 39.7 -11% | 44.45 0% | 68.7 55% | 44.71 1% |
| sRGB Coverage | 65.4 | 59.2 -9% | 65.5 0% | 95.8 46% | 66.1 1% |
| AdobeRGB 1998 Coverage | 45.9 | 41.07 -11% | 46.04 0% | 69.9 52% | 46.23 1% |
| Response Times | -6% | 5% | -11% | 6% | |
| Response Time Grey 50% / Grey 80% * | 32.4 ? | 38.4 ? -19% | 35 ? -8% | 37 ? -14% | 32.8 ? -1% |
| Response Time Black / White * | 31.2 ? | 28.8 ? 8% | 26 ? 17% | 33.4 ? -7% | 27.2 ? 13% |
| PWM Frequency | 200 ? | ||||
| Screen | -11% | 2% | 22% | 6% | |
| Brightness middle | 310.4 | 353 14% | 326 5% | 402 30% | 337 9% |
| Brightness | 301 | 334 11% | 304 1% | 382 27% | 322 7% |
| Brightness Distribution | 88 | 91 3% | 81 -8% | 88 0% | 91 3% |
| Black Level * | 0.32 | 0.47 -47% | 0.29 9% | 0.45 -41% | 0.32 -0% |
| Contrast | 970 | 751 -23% | 1124 16% | 893 -8% | 1053 9% |
| Colorchecker dE 2000 * | 5.9 | 7.79 -32% | 6.49 -10% | 3.6 39% | 5.71 3% |
| Colorchecker dE 2000 max. * | 21 | 15.19 28% | 15.95 24% | 7.5 64% | 15.39 27% |
| Greyscale dE 2000 * | 5.1 | 7.38 -45% | 6.16 -21% | 4.3 16% | 5.15 -1% |
| Gamma | 2.33 94% | 2.43 91% | 2.32 95% | 2.1 105% | 2.38 92% |
| CCT | 6816 95% | 6158 106% | 7575 86% | 6572 99% | 6881 94% |
| Color Space (Percent of AdobeRGB 1998) | 42 | 37.72 -10% | 42 0% | 62.3 48% | 42.38 1% |
| Color Space (Percent of sRGB) | 65 | 58.87 -9% | 65 0% | 95.7 47% | 65.62 1% |
| Total Average (Program / Settings) | -9% /
-10% | 2% /
2% | 21% /
24% | 4% /
5% |
* ... smaller is better
Display Response Times
| ↔ Response Time Black to White | ||
|---|---|---|
| 31.2 ms ... rise ↗ and fall ↘ combined | ↗ 9.2 ms rise | 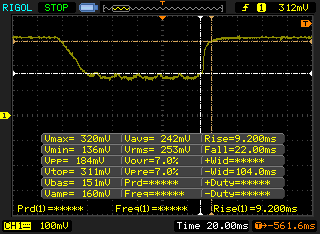 |
| ↘ 22 ms fall | ||
| The screen shows slow response rates in our tests and will be unsatisfactory for gamers. In comparison, all tested devices range from 0.1 (minimum) to 240 (maximum) ms. » 82 % of all devices are better. This means that the measured response time is worse than the average of all tested devices (21.5 ms). | ||
| ↔ Response Time 50% Grey to 80% Grey | ||
| 32.4 ms ... rise ↗ and fall ↘ combined | ↗ 12.4 ms rise | 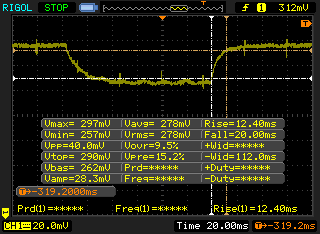 |
| ↘ 20 ms fall | ||
| The screen shows slow response rates in our tests and will be unsatisfactory for gamers. In comparison, all tested devices range from 0.2 (minimum) to 636 (maximum) ms. » 38 % of all devices are better. This means that the measured response time is similar to the average of all tested devices (33.7 ms). | ||
Screen Flickering / PWM (Pulse-Width Modulation)
| Screen flickering / PWM not detected | 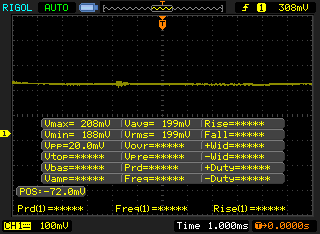 | ||
In comparison: 53 % of all tested devices do not use PWM to dim the display. If PWM was detected, an average of 17900 (minimum: 5 - maximum: 3846000) Hz was measured. | |||
| PCMark 8 | |
| Home Score Accelerated v2 | |
| Dell Latitude 7280 | |
| HP EliteBook 820 G4 Z2V72ET | |
| Dell Latitude 12 E7270 | |
| Razer Blade Stealth QHD i7-7500U | |
| Lenovo ThinkPad X260-20F6007RGE | |
| Work Score Accelerated v2 | |
| Dell Latitude 7280 | |
| HP EliteBook 820 G4 Z2V72ET | |
| Dell Latitude 12 E7270 | |
| Lenovo ThinkPad X260-20F6007RGE | |
| Creative Score Accelerated v2 | |
| Dell Latitude 7280 | |
| HP EliteBook 820 G4 Z2V72ET | |
| Lenovo ThinkPad X260-20F6007RGE | |
| PCMark 8 Home Score Accelerated v2 | 3667 pontos | |
| PCMark 8 Creative Score Accelerated v2 | 4662 pontos | |
| PCMark 8 Work Score Accelerated v2 | 4957 pontos | |
Ajuda | ||
| Dell Latitude 7280 SanDisk X400 M.2 2280 256GB | Dell Latitude 12 E7270 Liteon L8H-256V2G | HP EliteBook 820 G4 Z2V72ET Samsung PM951 NVMe MZVLV512 | Razer Blade Stealth QHD i7-7500U Samsung PM951 NVMe MZVLV256 | Lenovo ThinkPad X260-20F6007RGE Liteonit LCH-512V2S | |
|---|---|---|---|---|---|
| CrystalDiskMark 3.0 | 2% | 100% | 64% | 8% | |
| Read Seq | 470.8 | 498.4 6% | 1315 179% | 1178 150% | 499.6 6% |
| Write Seq | 477.4 | 286.7 -40% | 594 24% | 305.4 -36% | 403 -16% |
| Read 512 | 370.1 | 661 79% | 638 72% | 322.9 -13% | |
| Write 512 | 323.2 | 594 84% | 305.7 -5% | 372.4 15% | |
| Read 4k | 30.23 | 24.89 -18% | 42.87 42% | 38.54 27% | 27.22 -10% |
| Write 4k | 59.5 | 88 48% | 151.6 155% | 153.4 158% | 83.6 41% |
| Read 4k QD32 | 344.4 | 280.5 -19% | 568 65% | 614 78% | 316.5 -8% |
| Write 4k QD32 | 183 | 241.9 32% | 491.7 169% | 302.7 65% | 273.1 49% |

| 3DMark | |
| 1280x720 Cloud Gate Standard Graphics | |
| Razer Blade Stealth QHD i7-7500U | |
| HP EliteBook 820 G4 Z2V72ET | |
| Dell Latitude 7280 | |
| Lenovo ThinkPad X260-20F6007RGE | |
| Dell Latitude 12 E7270 | |
| 1920x1080 Fire Strike Graphics | |
| Razer Blade Stealth QHD i7-7500U | |
| HP EliteBook 820 G4 Z2V72ET | |
| Dell Latitude 7280 | |
| Lenovo ThinkPad X260-20F6007RGE | |
| Dell Latitude 12 E7270 | |
| 1920x1080 Ice Storm Extreme Graphics | |
| HP EliteBook 820 G4 Z2V72ET | |
| 3DMark 06 Standard Score | 8030 pontos | |
| 3DMark 11 Performance | 1538 pontos | |
| 3DMark Ice Storm Standard Score | 54025 pontos | |
| 3DMark Cloud Gate Standard Score | 5940 pontos | |
| 3DMark Fire Strike Score | 772 pontos | |
Ajuda | ||
Barulho
| Ocioso |
| 29.4 / 29.4 / 30 dB |
| Carga |
| 30.6 / 32.7 dB |
 | ||
30 dB silencioso 40 dB(A) audível 50 dB(A) ruidosamente alto |
||
min: | ||
| Dell Latitude 7280 HD Graphics 620, i7-7600U, SanDisk X400 M.2 2280 256GB | Dell Latitude 12 E7270 HD Graphics 520, 6300U, Liteon L8H-256V2G | HP EliteBook 820 G4 Z2V72ET HD Graphics 620, i7-7500U, Samsung PM951 NVMe MZVLV512 | Razer Blade Stealth QHD i7-7500U HD Graphics 620, i7-7500U, Samsung PM951 NVMe MZVLV256 | Lenovo ThinkPad X260-20F6007RGE HD Graphics 520, 6500U, Liteonit LCH-512V2S | |
|---|---|---|---|---|---|
| Noise | -1% | -5% | -9% | -4% | |
| off / environment * | 29.4 | 28.9 2% | 30.7 -4% | 31 -5% | 29 1% |
| Idle Minimum * | 29.4 | 28.9 2% | 30.7 -4% | 31 -5% | 29 1% |
| Idle Average * | 29.4 | 28.9 2% | 30.7 -4% | 31 -5% | 29 1% |
| Idle Maximum * | 30 | 28.9 4% | 30.7 -2% | 31 -3% | 29 3% |
| Load Average * | 30.6 | 31.3 -2% | 35.3 -15% | 35 -14% | 35.1 -15% |
| Load Maximum * | 32.7 | 37.6 -15% | 33.7 -3% | 40.5 -24% | 37.8 -16% |
* ... smaller is better
(±) The maximum temperature on the upper side is 41.2 °C / 106 F, compared to the average of 34.2 °C / 94 F, ranging from 21.2 to 62.5 °C for the class Office.
(-) The bottom heats up to a maximum of 45.4 °C / 114 F, compared to the average of 36.7 °C / 98 F
(+) In idle usage, the average temperature for the upper side is 25.8 °C / 78 F, compared to the device average of 29.5 °C / 85 F.
(+) The palmrests and touchpad are cooler than skin temperature with a maximum of 27.2 °C / 81 F and are therefore cool to the touch.
(±) The average temperature of the palmrest area of similar devices was 27.7 °C / 81.9 F (+0.5 °C / 0.9 F).
Dell Latitude 7280 audio analysis
(-) | not very loud speakers (71.8 dB)
Bass 100 - 315 Hz
(±) | reduced bass - on average 7.9% lower than median
(±) | linearity of bass is average (8.2% delta to prev. frequency)
Mids 400 - 2000 Hz
(±) | higher mids - on average 5.4% higher than median
(±) | linearity of mids is average (10.5% delta to prev. frequency)
Highs 2 - 16 kHz
(+) | balanced highs - only 2.2% away from median
(+) | highs are linear (6.6% delta to prev. frequency)
Overall 100 - 16.000 Hz
(±) | linearity of overall sound is average (22.4% difference to median)
Compared to same class
» 55% of all tested devices in this class were better, 10% similar, 35% worse
» The best had a delta of 7%, average was 22%, worst was 53%
Compared to all devices tested
» 60% of all tested devices were better, 6% similar, 33% worse
» The best had a delta of 4%, average was 25%, worst was 134%
HP EliteBook 820 G4 Z2V72ET audio analysis
(-) | not very loud speakers (66 dB)
Bass 100 - 315 Hz
(±) | reduced bass - on average 14.6% lower than median
(±) | linearity of bass is average (7.6% delta to prev. frequency)
Mids 400 - 2000 Hz
(+) | balanced mids - only 1.1% away from median
(+) | mids are linear (4.7% delta to prev. frequency)
Highs 2 - 16 kHz
(±) | higher highs - on average 5.8% higher than median
(+) | highs are linear (5% delta to prev. frequency)
Overall 100 - 16.000 Hz
(±) | linearity of overall sound is average (17.6% difference to median)
Compared to same class
» 43% of all tested devices in this class were better, 8% similar, 49% worse
» The best had a delta of 5%, average was 19%, worst was 53%
Compared to all devices tested
» 29% of all tested devices were better, 8% similar, 63% worse
» The best had a delta of 4%, average was 25%, worst was 134%
| desligado | |
| Ocioso | |
| Carga |
|
| Dell Latitude 7280 i7-7600U, HD Graphics 620, SanDisk X400 M.2 2280 256GB, IPS, 1920x1080, 12.50 | Dell Latitude 12 E7270 6300U, HD Graphics 520, Liteon L8H-256V2G, IPS LED, 1920x1080, 12.50 | HP EliteBook 820 G4 Z2V72ET i7-7500U, HD Graphics 620, Samsung PM951 NVMe MZVLV512, IPS, 1920x1080, 12.50 | Razer Blade Stealth QHD i7-7500U i7-7500U, HD Graphics 620, Samsung PM951 NVMe MZVLV256, , 2560x1440, 12.50 | Lenovo ThinkPad X260-20F6007RGE 6500U, HD Graphics 520, Liteonit LCH-512V2S, IPS, 1920x1080, 12.50 | |
|---|---|---|---|---|---|
| Power Consumption | -8% | 6% | -33% | -10% | |
| Idle Minimum * | 4.28 | 3.8 11% | 2.7 37% | 4.4 -3% | 3.5 18% |
| Idle Average * | 5.11 | 6.7 -31% | 4.8 6% | 5.8 -14% | 5.5 -8% |
| Idle Maximum * | 5.49 | 7.2 -31% | 6.6 -20% | 8.6 -57% | 6.7 -22% |
| Load Average * | 29.83 | 27.2 9% | 28.5 4% | 35.2 -18% | 28.9 3% |
| Load Maximum * | 30.05 | 30.2 -0% | 29 3% | 52 -73% | 42.1 -40% |
* ... smaller is better
| Dell Latitude 7280 i7-7600U, HD Graphics 620, 60 Wh | Dell Latitude 12 E7270 6300U, HD Graphics 520, 55 Wh | HP EliteBook 820 G4 Z2V72ET i7-7500U, HD Graphics 620, 49 Wh | Razer Blade Stealth QHD i7-7500U i7-7500U, HD Graphics 620, 53.6 Wh | Lenovo ThinkPad X260-20F6007RGE 6500U, HD Graphics 520, 46 Wh | |
|---|---|---|---|---|---|
| Battery Runtime | -21% | -0% | -36% | -36% | |
| Reader / Idle | 1553 | 1050 -32% | 1346 -13% | 817 -47% | 953 -39% |
| WiFi v1.3 | 682 | 508 -26% | 566 -17% | 498 -27% | 501 -27% |
| Load | 159 | 153 -4% | 205 29% | 105 -34% | 92 -42% |
Pro
Contra
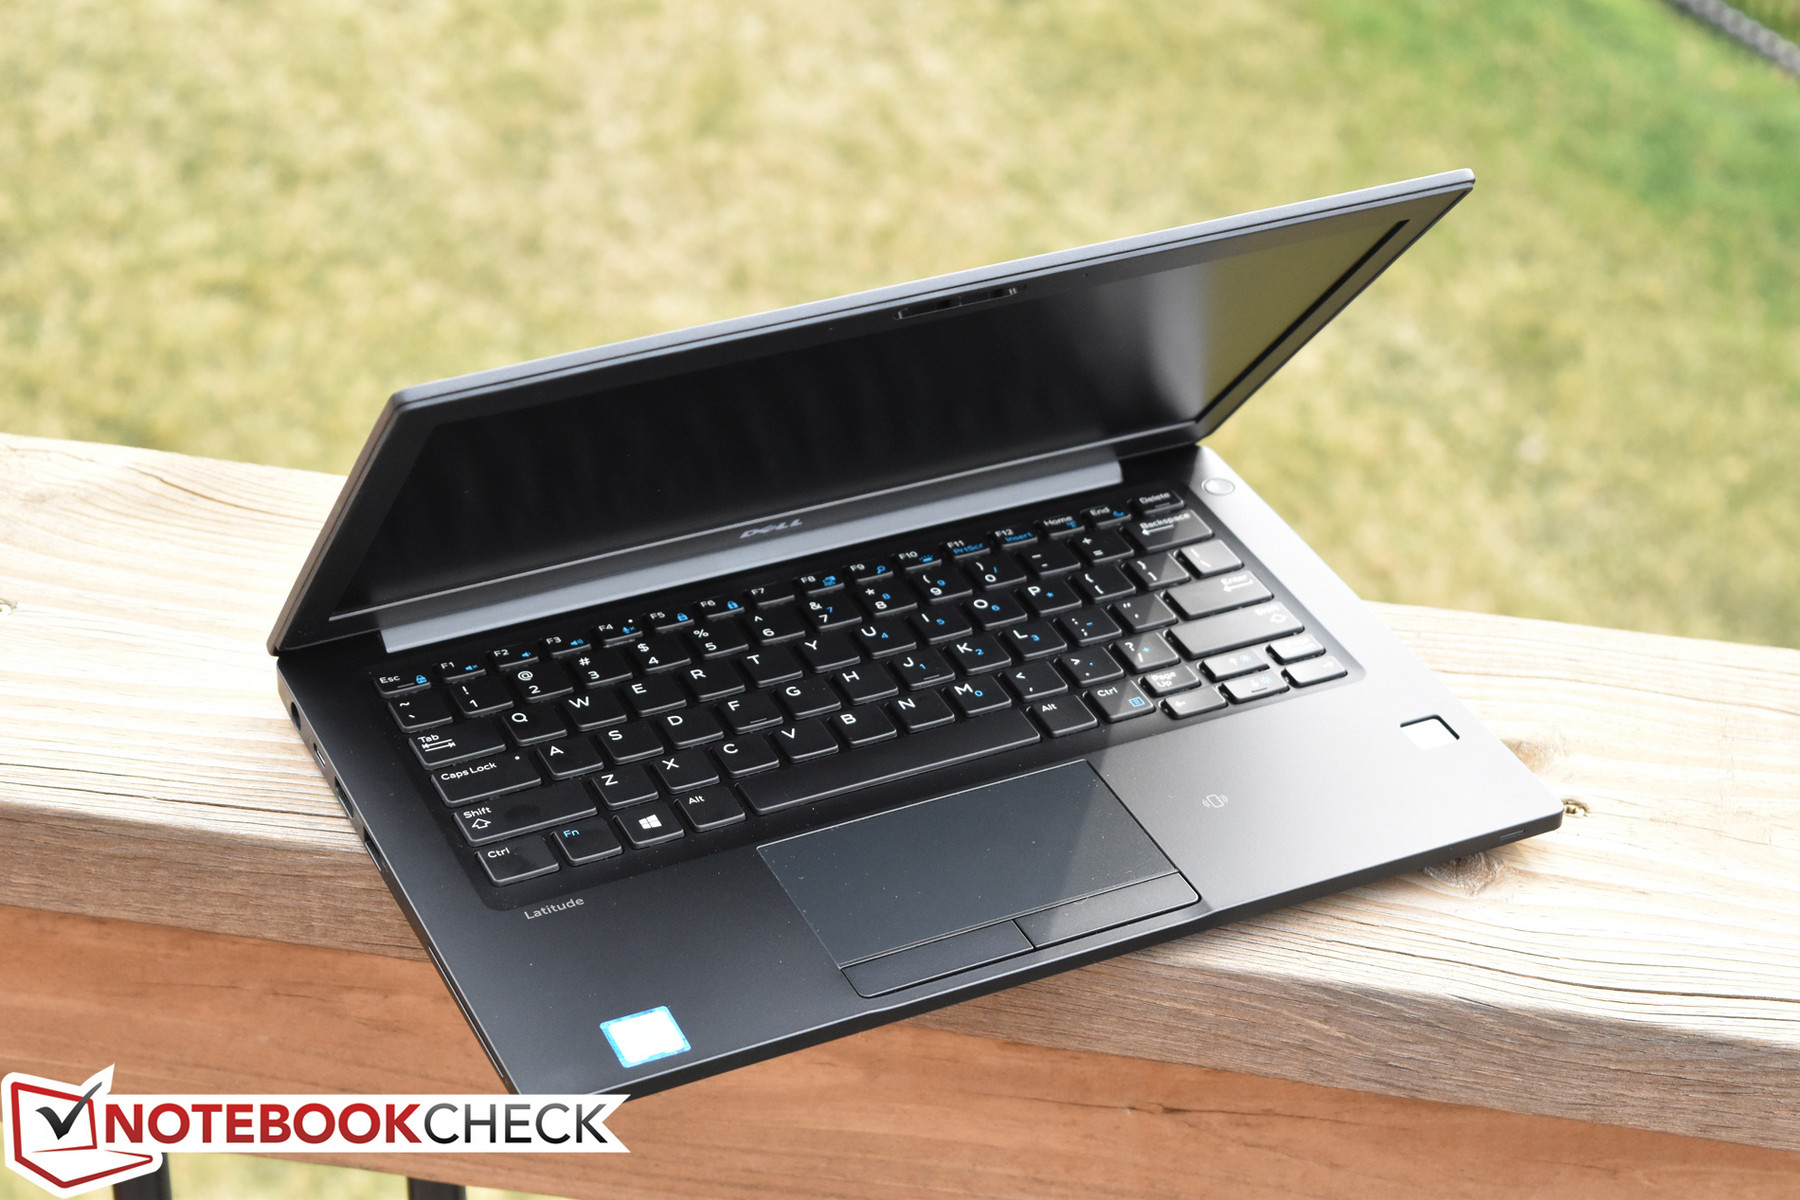
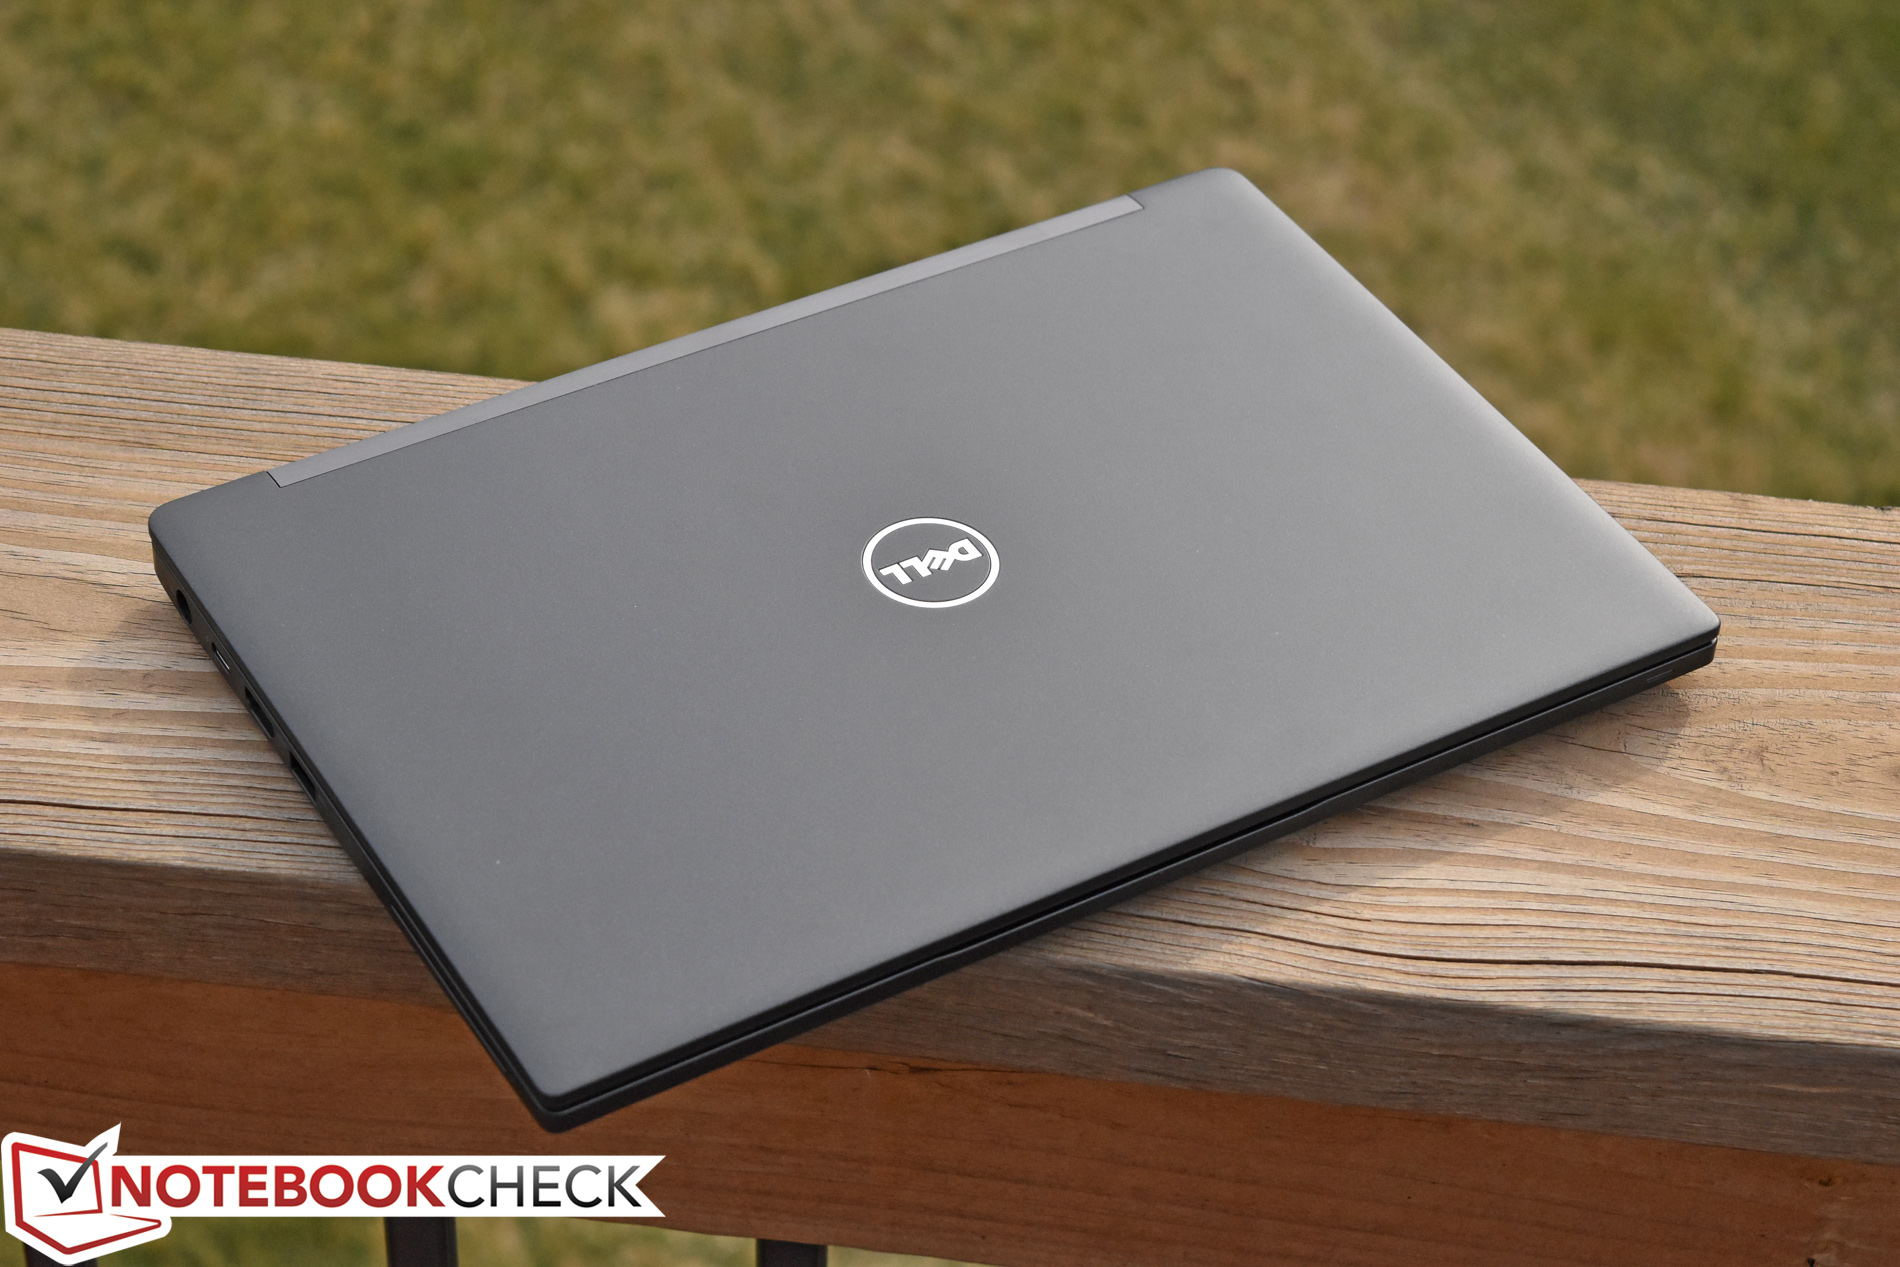
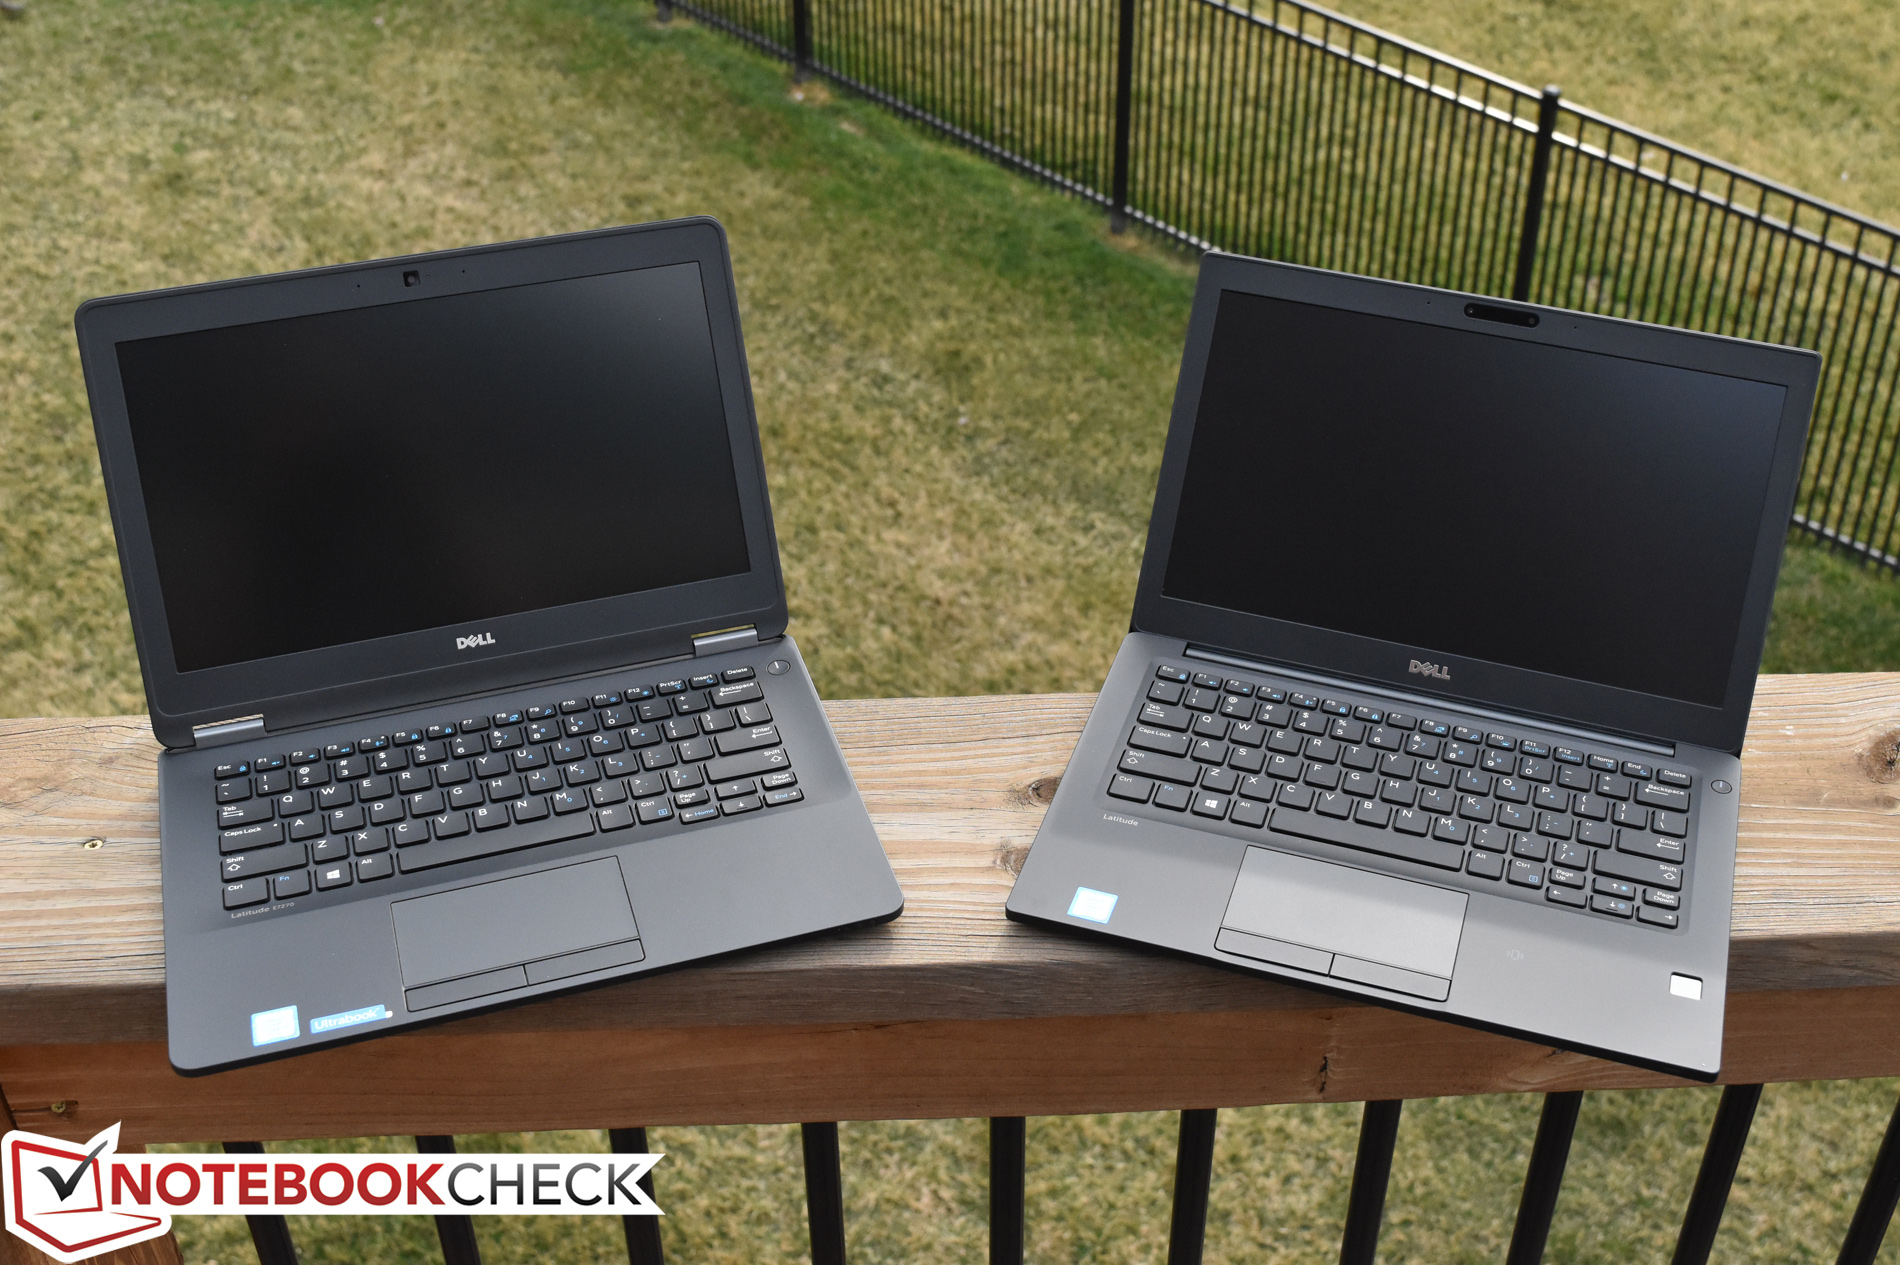
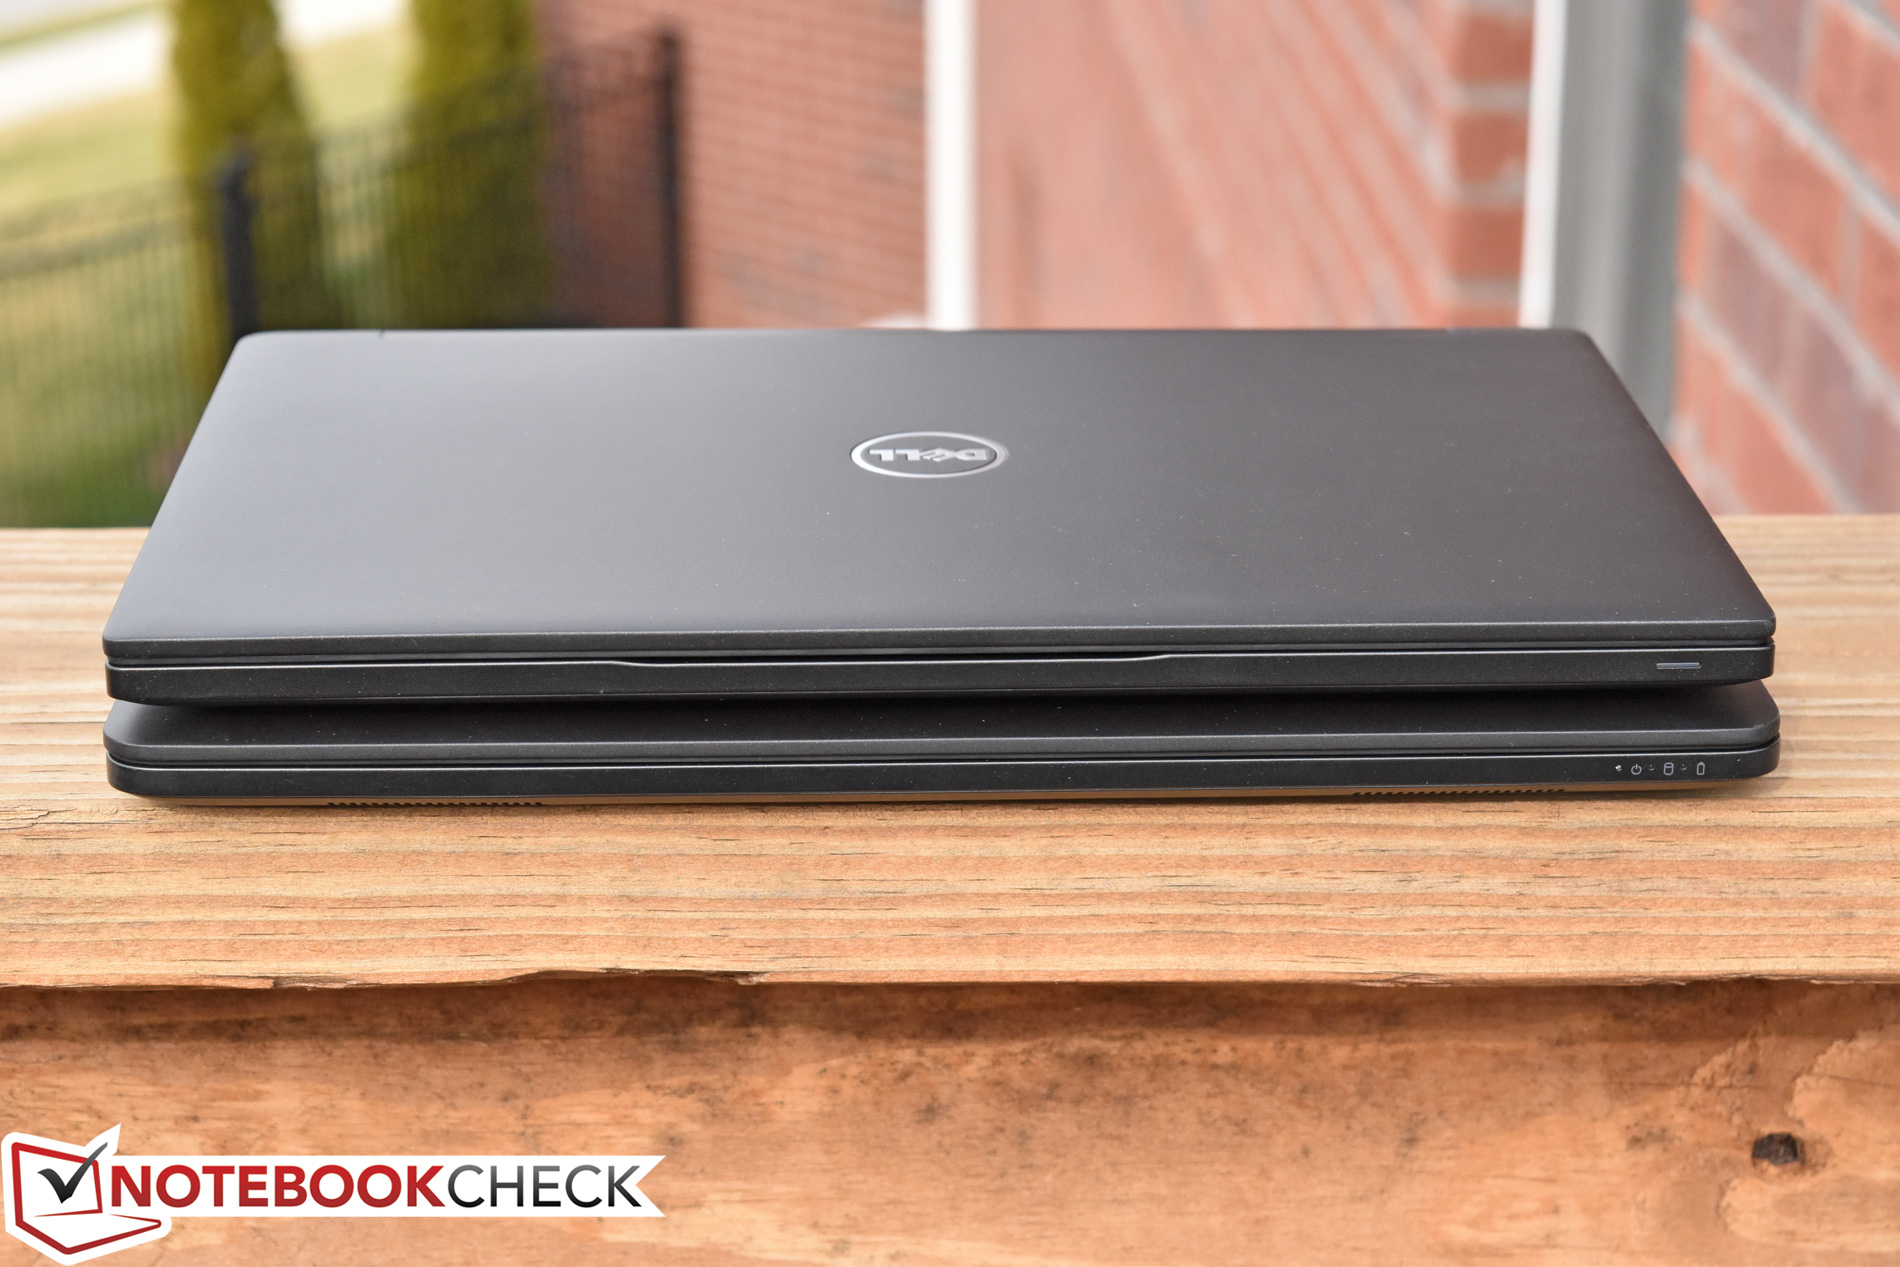
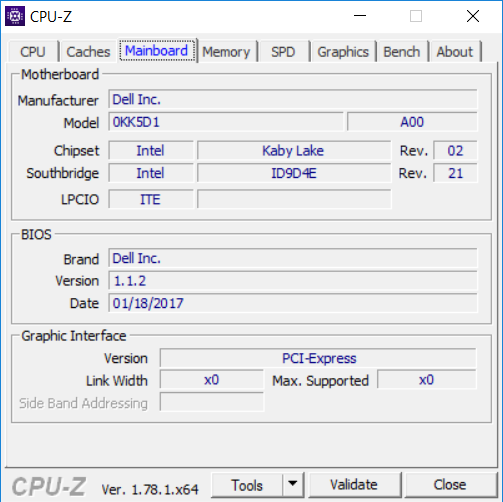
O Latitude 7280 provavelmente é a revisão mais significante na série Latitude 7000 que já vimos desde o seu lançamento há alguns anos. Embora o movimento tem estado em progresso por algum tempo, o 7280 faz mais para incorporar luxos de grau de consumidor no campo de sensibilidades de grau empresarial, para os quais estas máquinas são conhecidas mais do que seus predecessores. O resultado é um produto que ainda tem um visual e sensação profissional, apesar de seu formato mais fino e compacto, mas que vem com alguns compromissos substanciais.
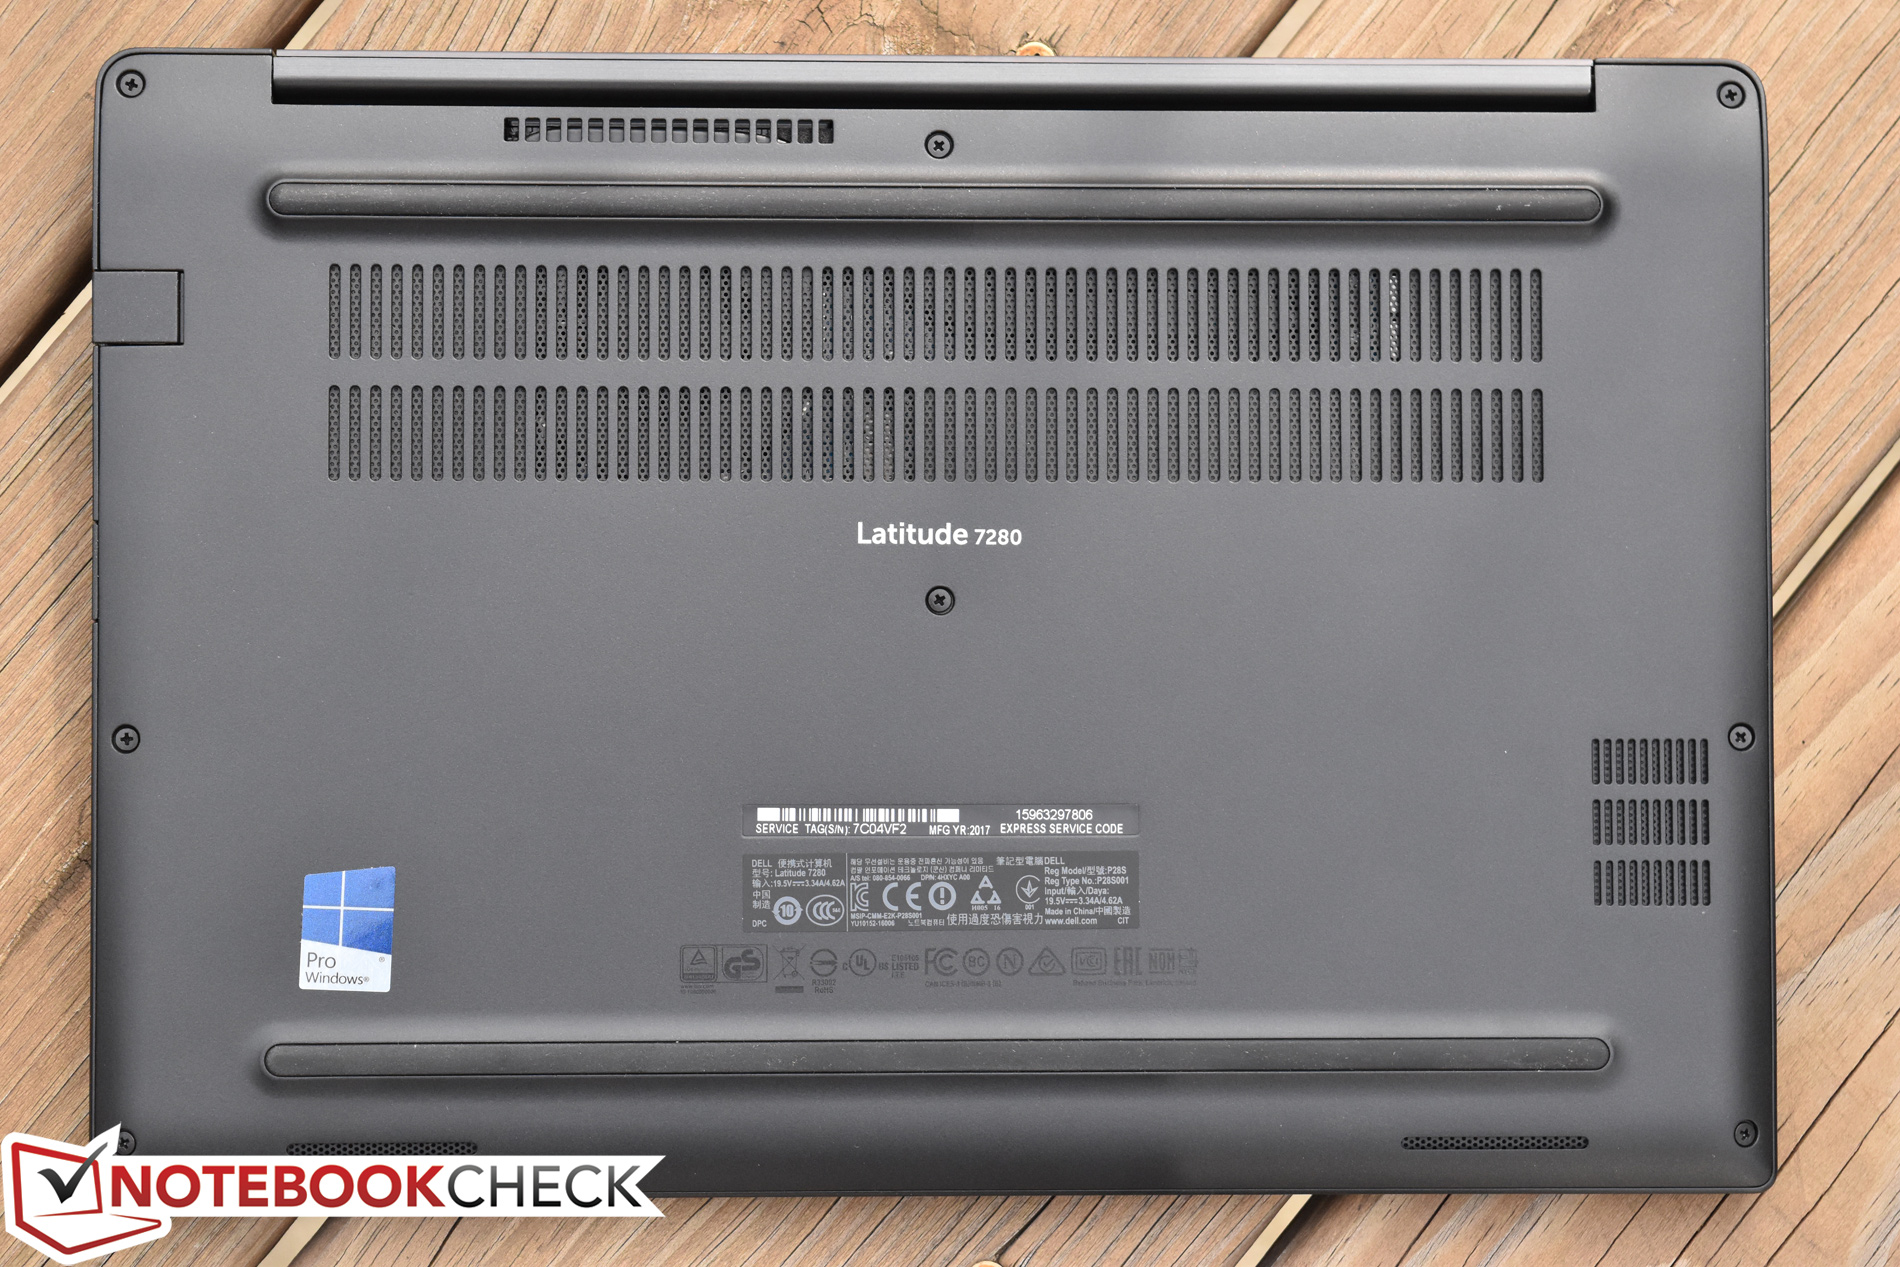
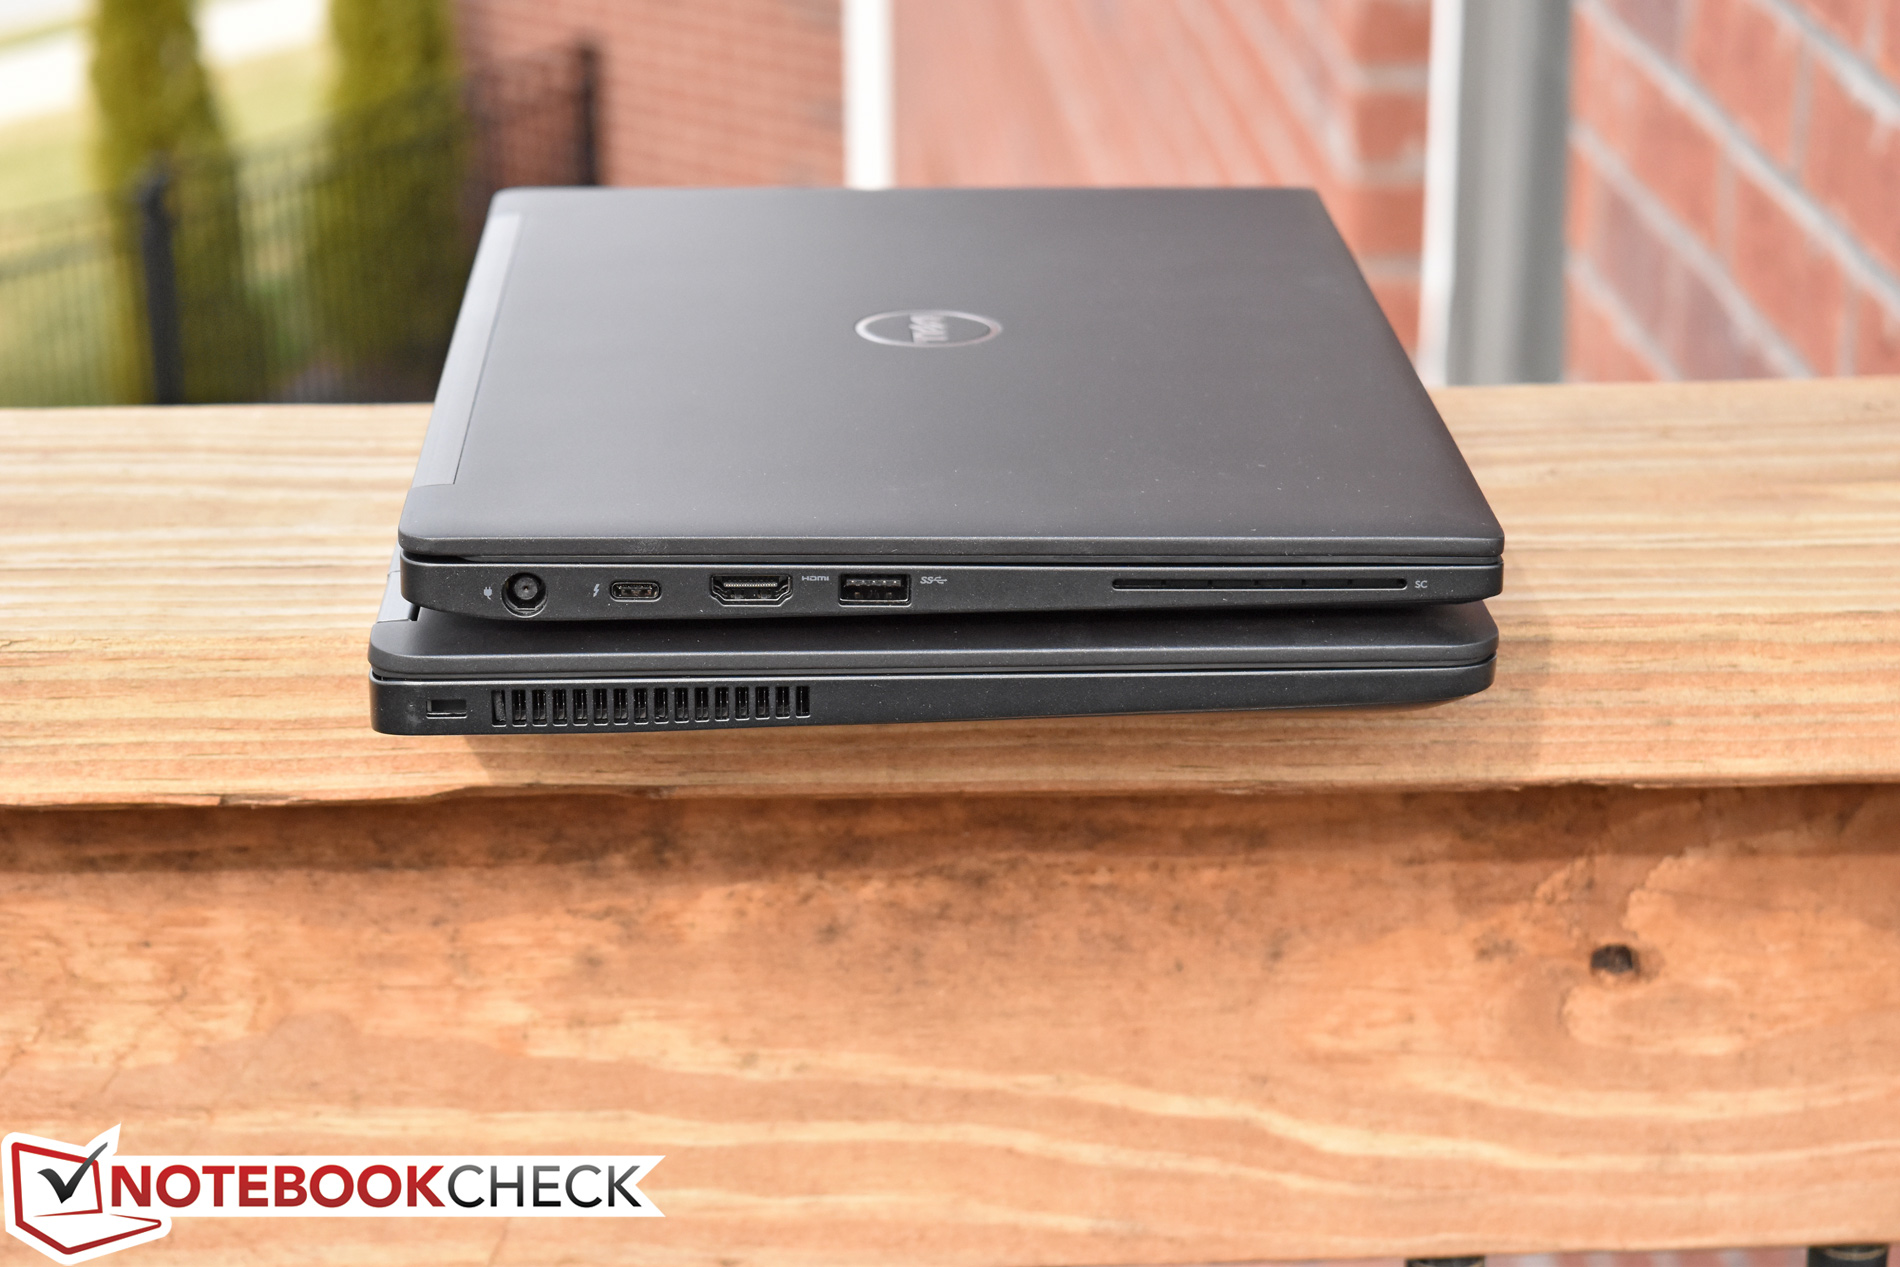
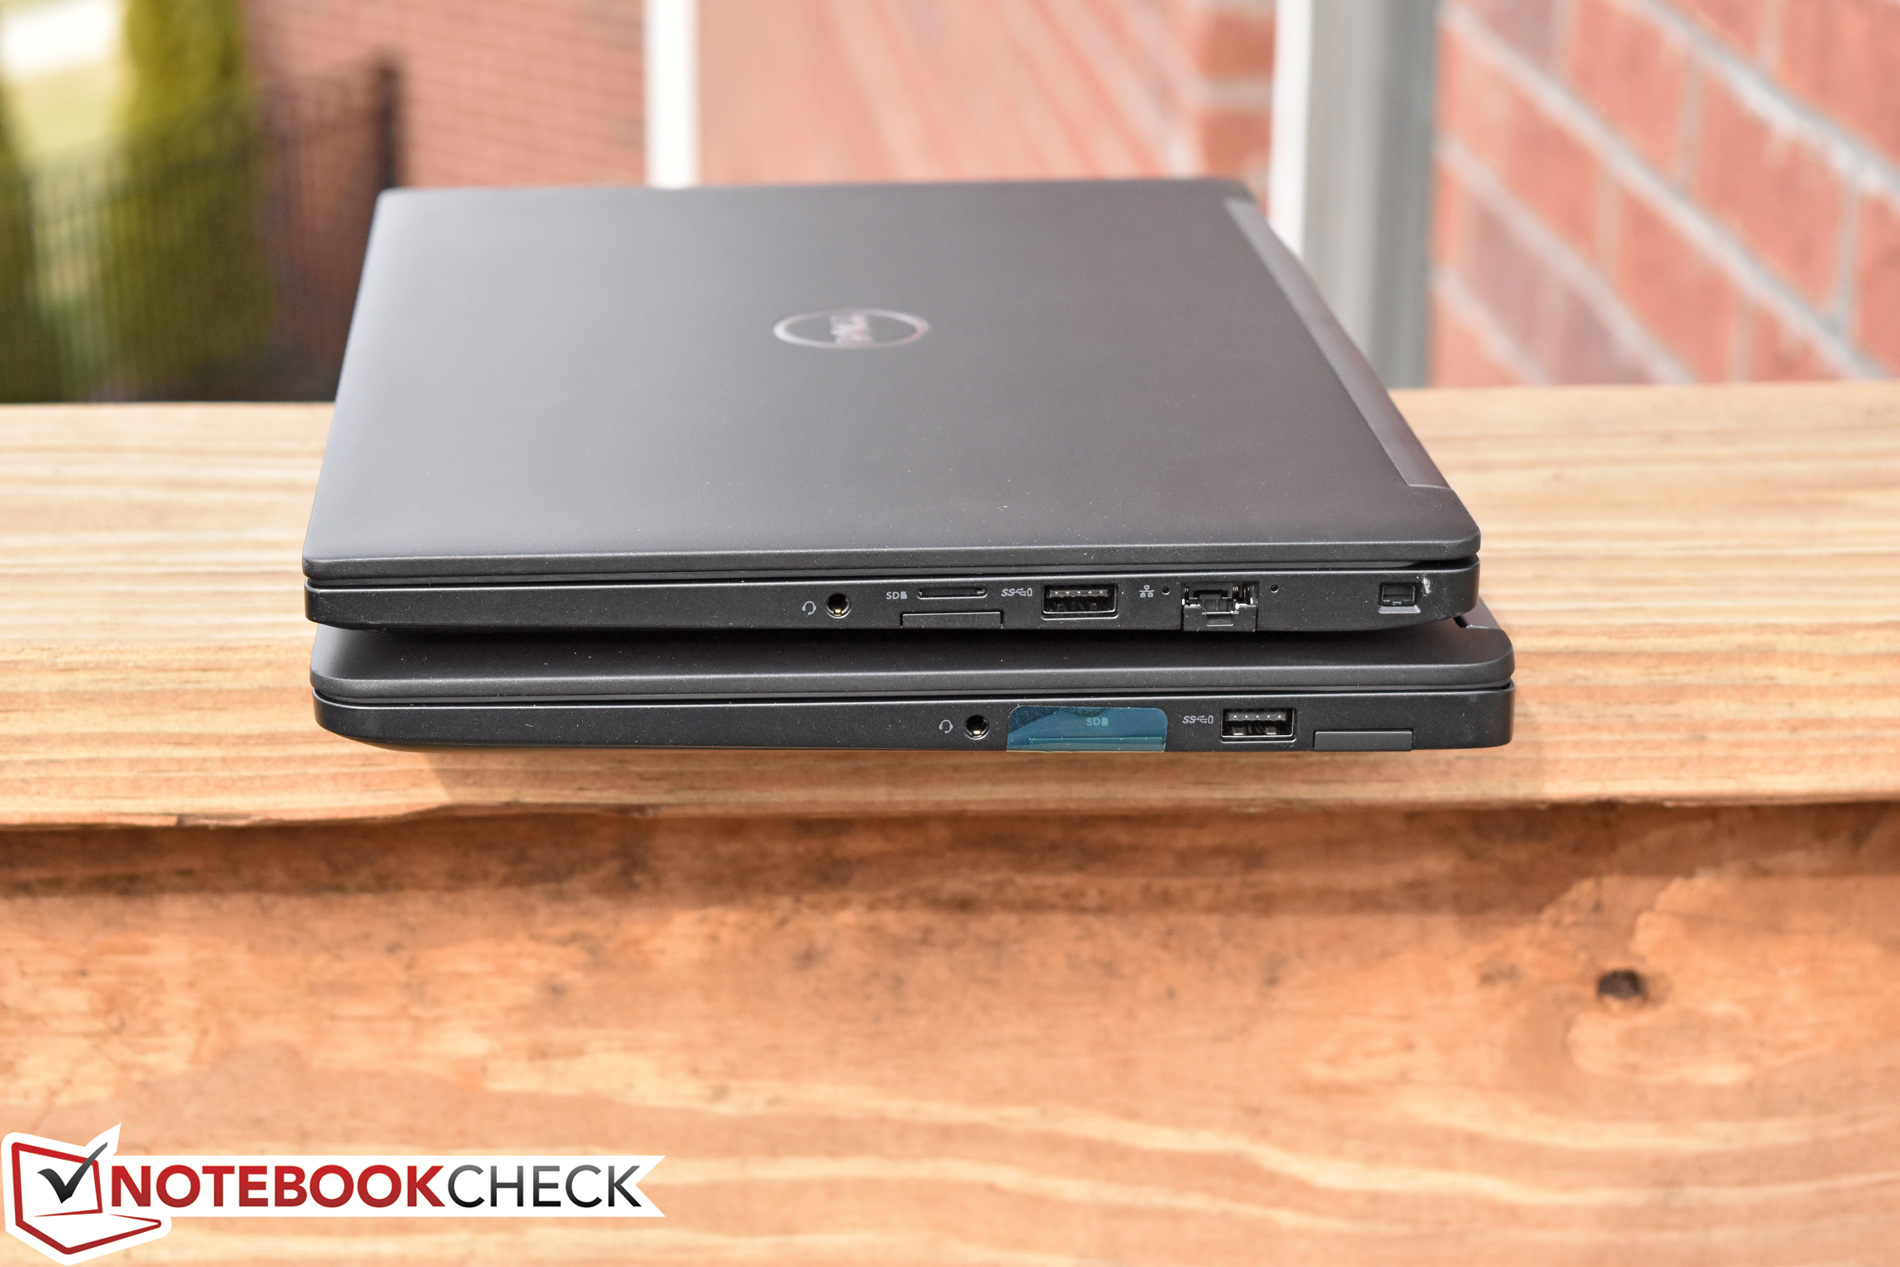
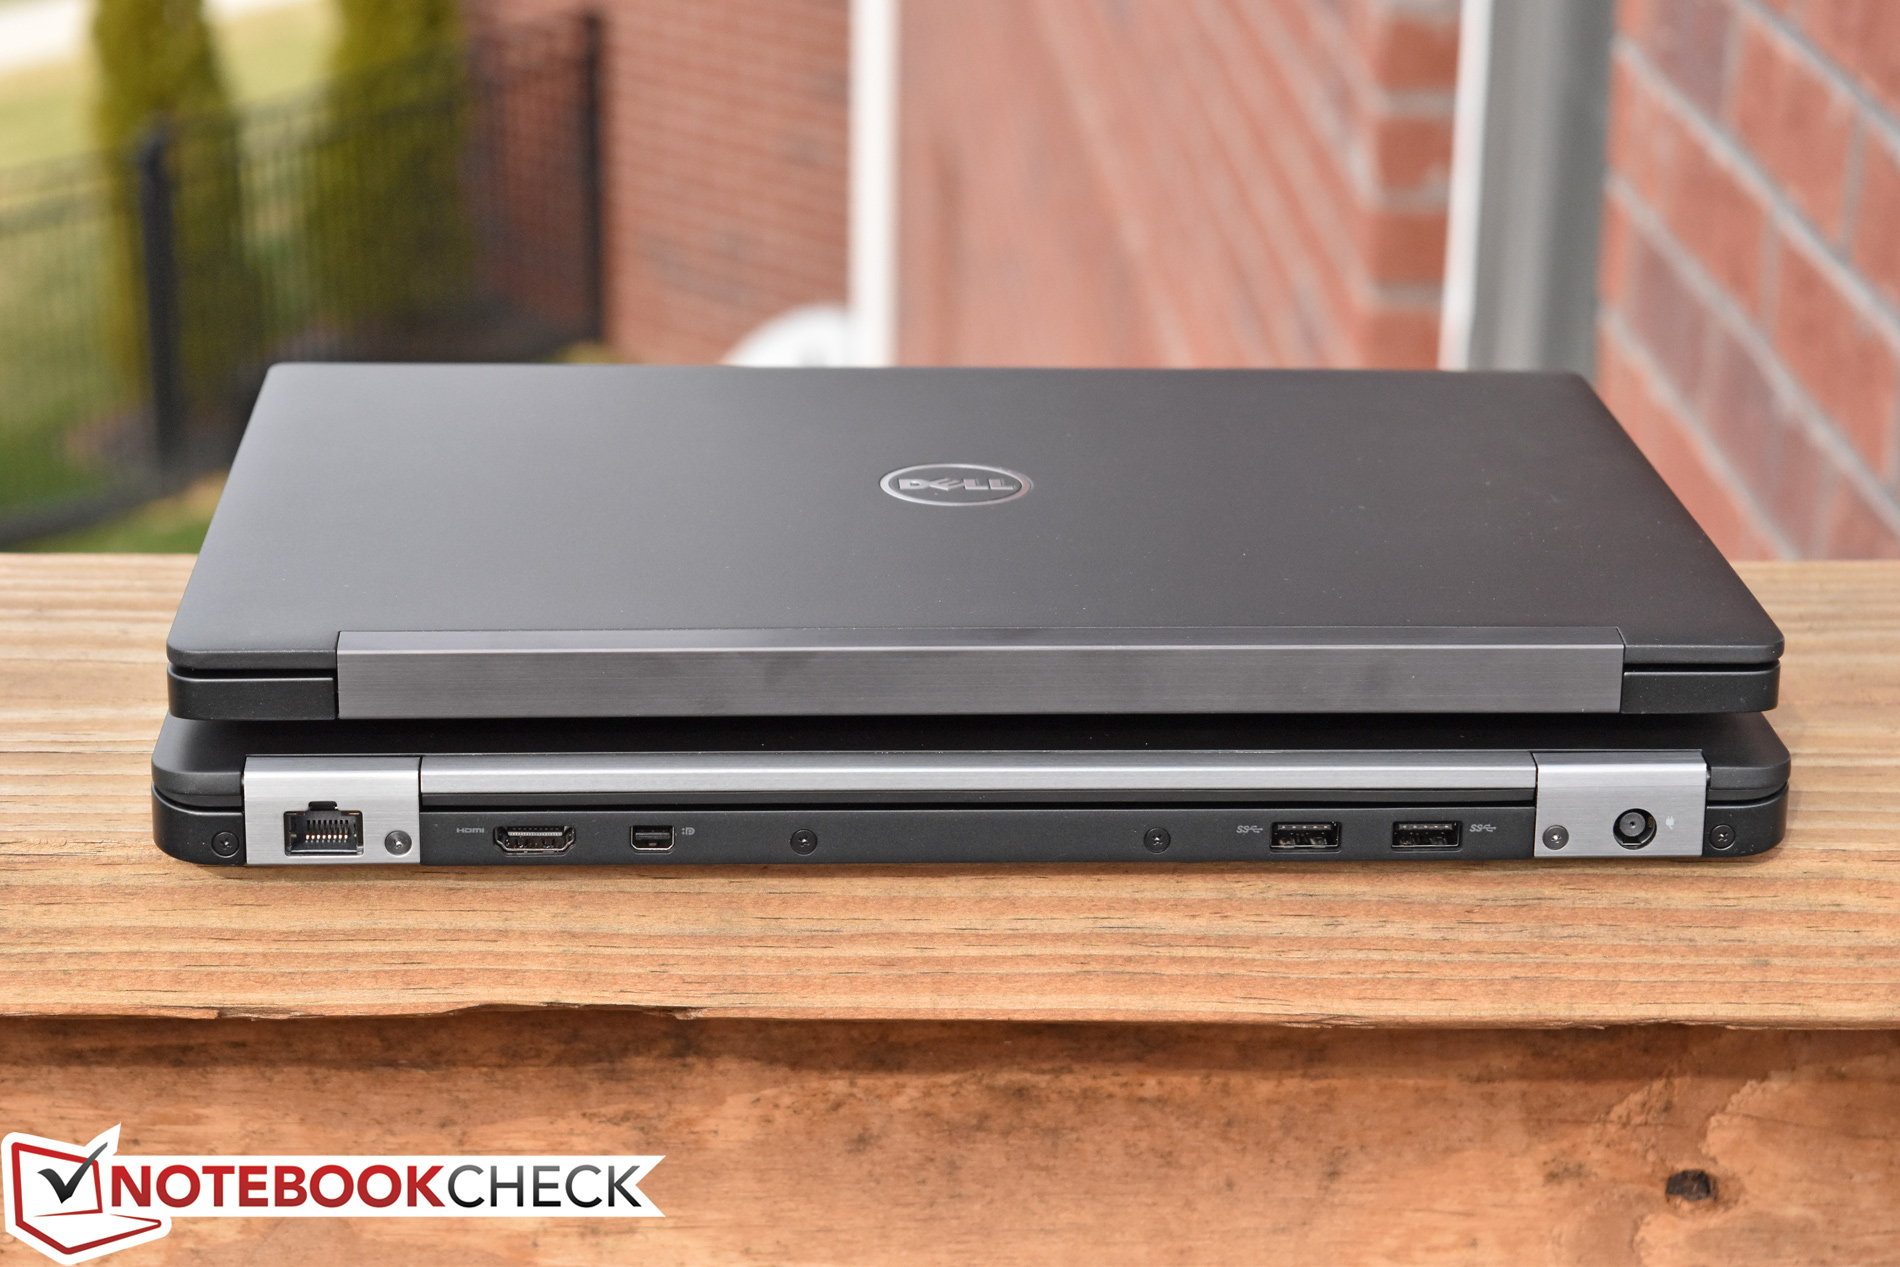
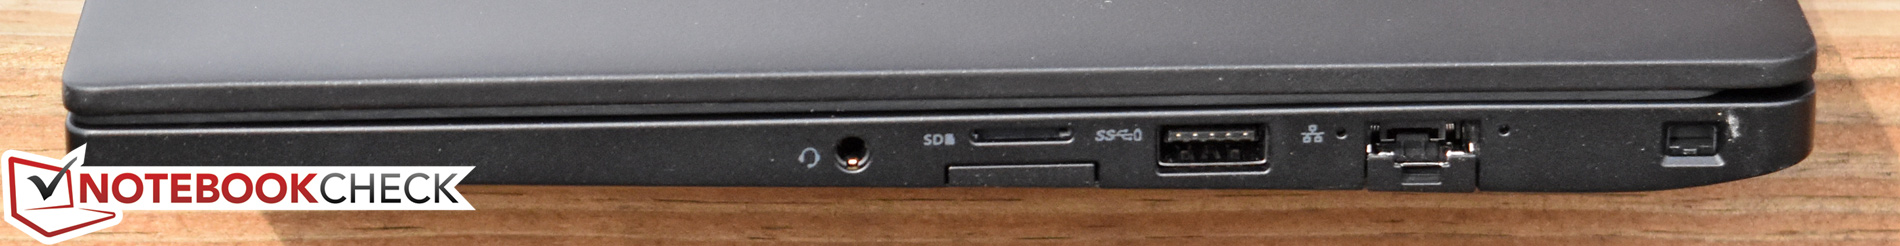
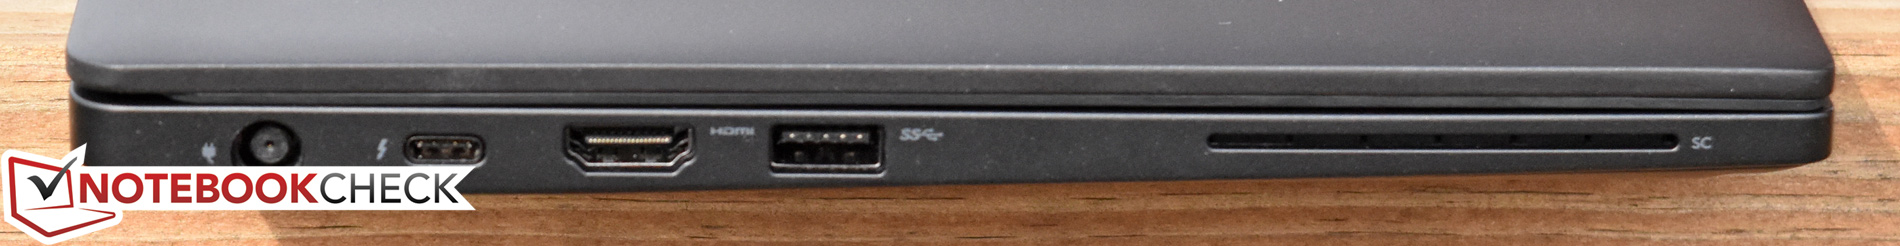
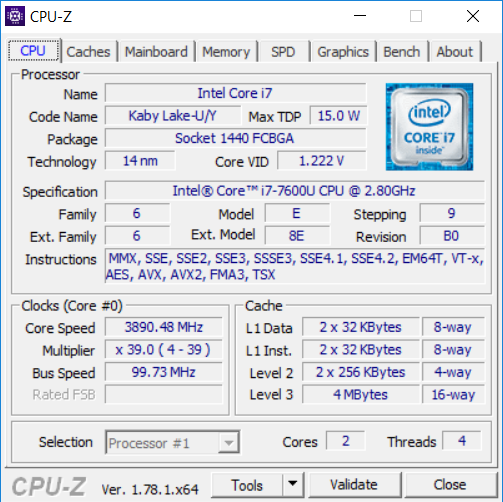
O primeiro destes seria sua capacidade de manutenção, que, embora ainda seja muito boa, não está no nível de seus predecessores. Tais serviços como a substituição de teclado e tela são bastante mais complexos por causa das modificações no design, que provavelmente perturbará alguns departamentos de TI. O seguinte compromisso é o da conectividade; as portas talvez estejam posicionadas de forma mais conveniente no 7280, mas a porta docking dedicada estás ausente, mini-DisplayPort, e uma terceira porta USB Type-A (em vez de trocar as três por um só USB Type-C/Thunderbolt) e eles reduzem o anterior leitor de cartões SD de tamanho normal para um microSD. Também descobrimos que a nossa unidade de análise em particular não pôde lidar com estresse continuo da CPU sem reduzir rapidamente as taxas da velocidades Turbo (em 30 segundos), essencialmente, eliminando a maioria dos ganhos de desempenho que pode se esperar das CPUs dual-core Core i7 topo de gama.
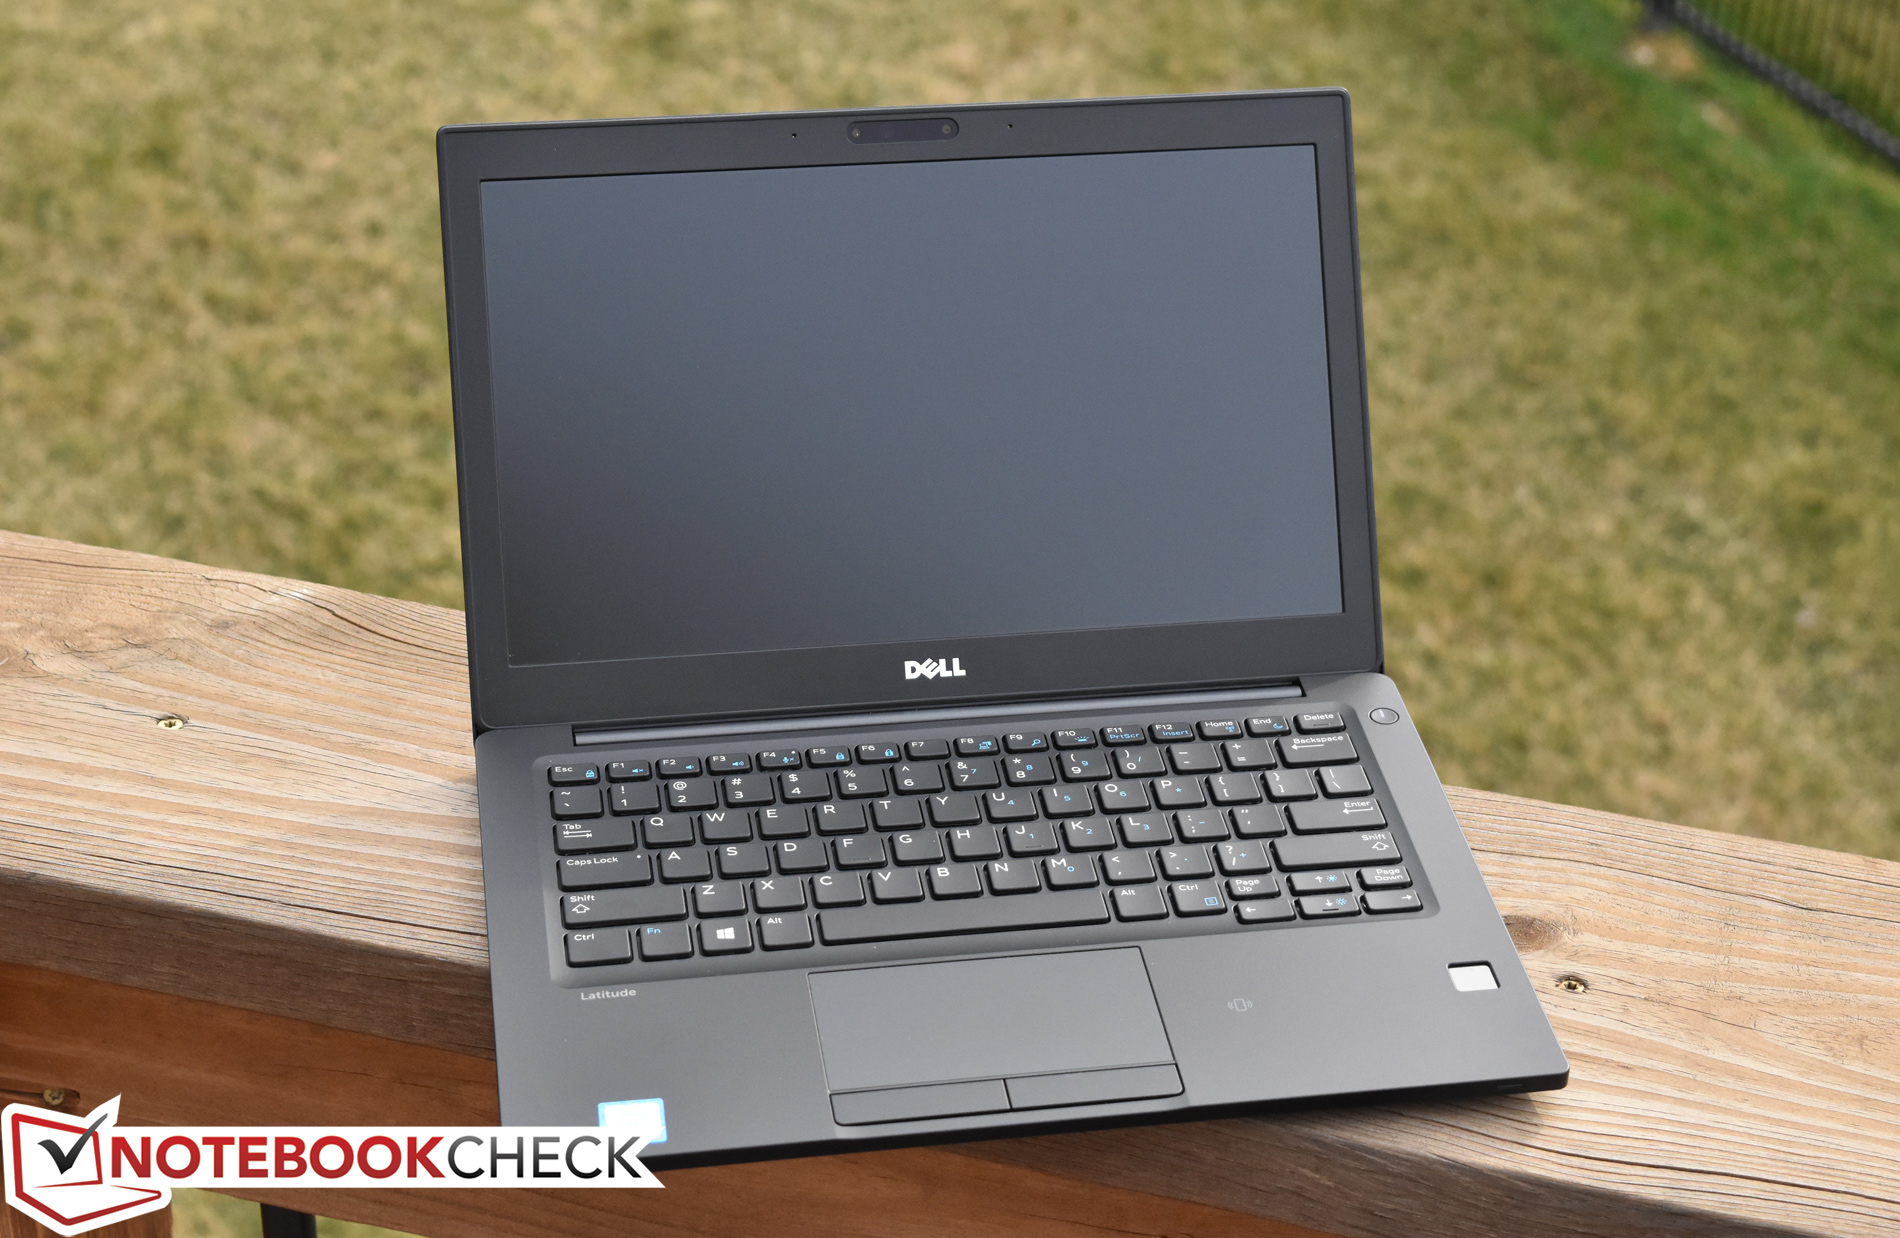
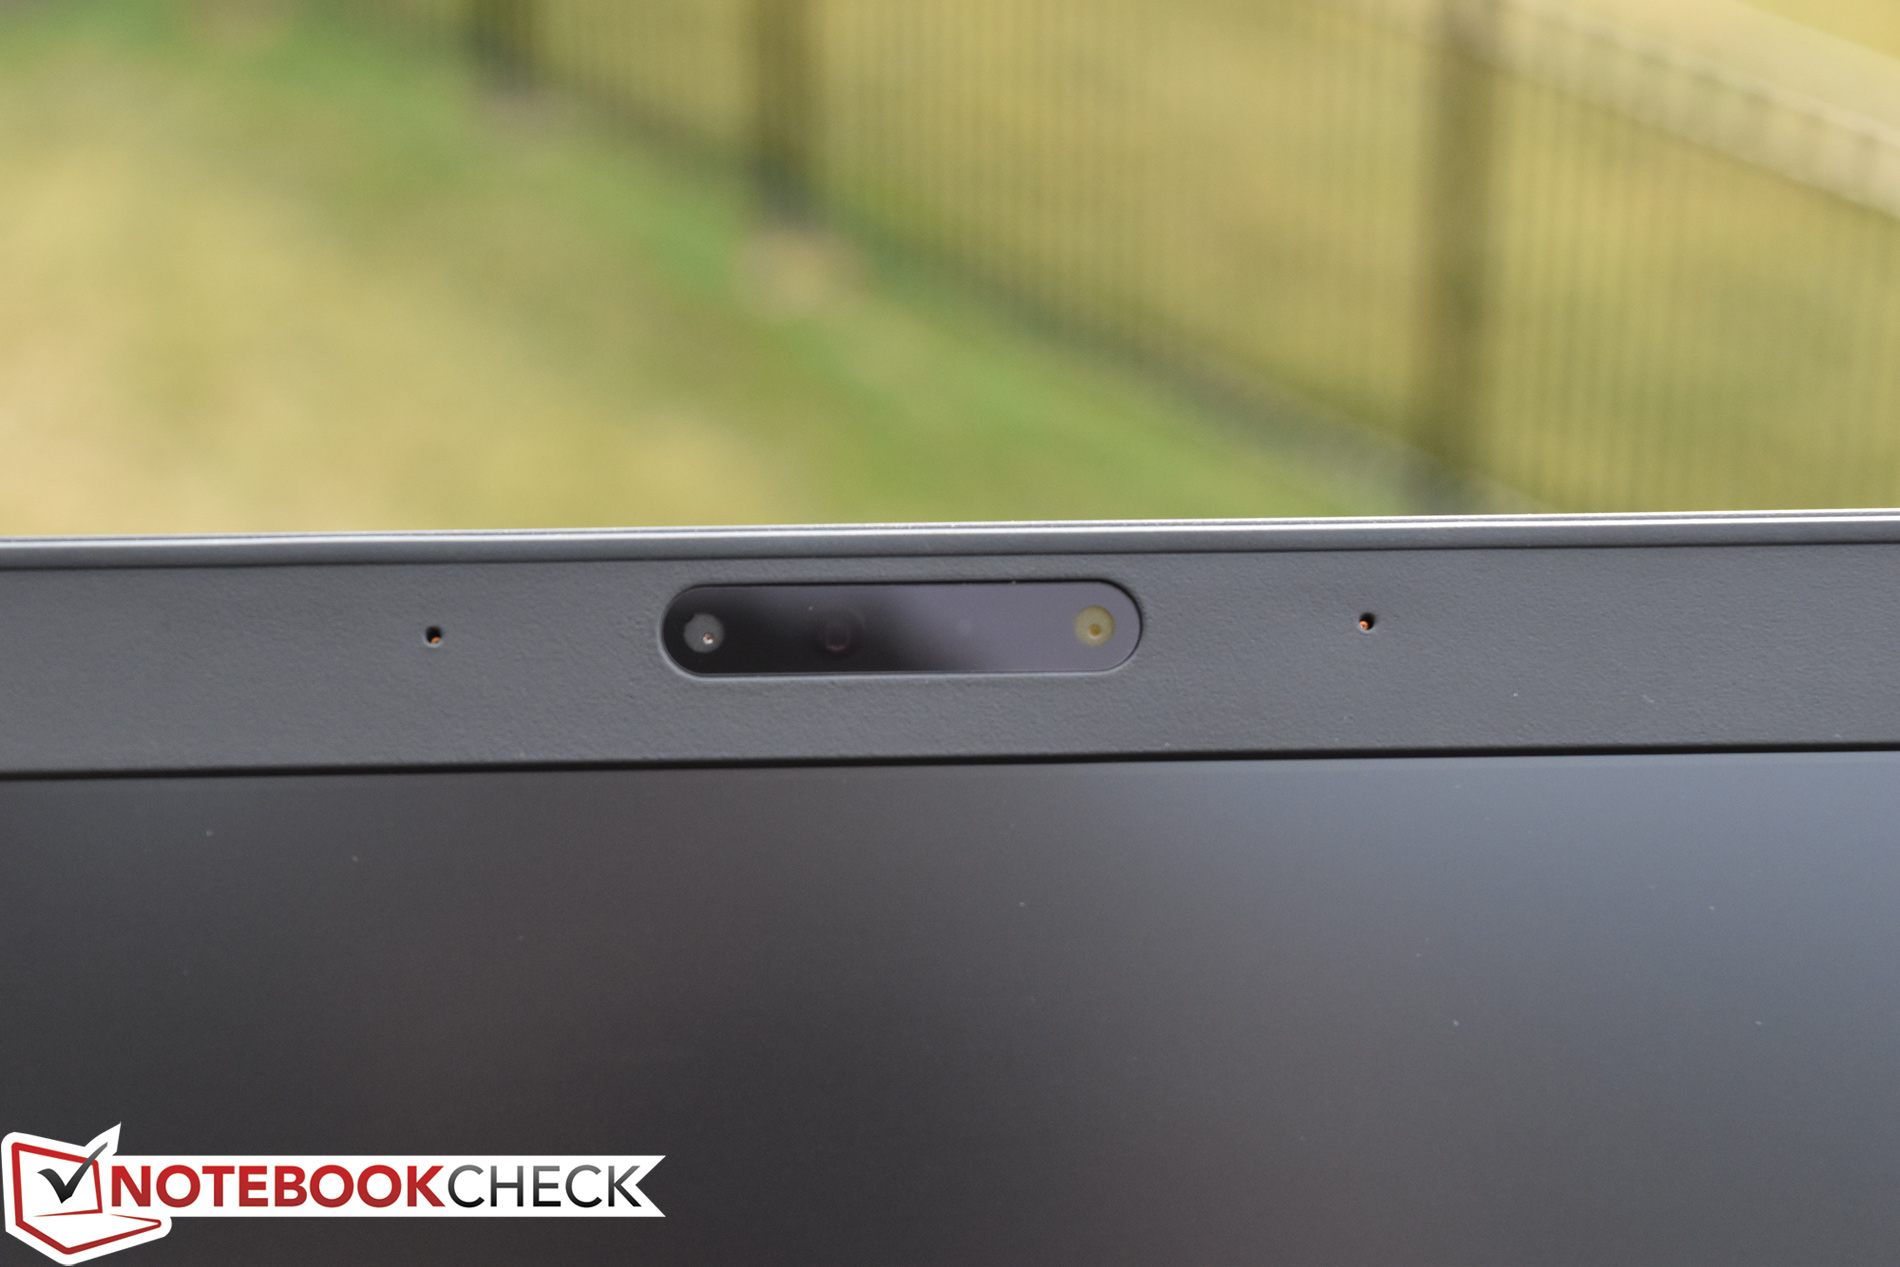
Adicionalmente a estas inadequações (a significância das quais é bastante subjetiva), o 7280 retém um par das falhas (embora relativamente menores) de seu predecessor. A tela, embora seja brilhante e de alta resolução, permanece bastante pálida em termos de cobertura de gama de cores, e o touchpad ainda é bastante médio (embora forneça dois botões físicos). E sentimos o desagrado de relatar que a nossa unidade de teste apresenta os sintomas da CPU barulhenta que muito encontraram em alguns Ultrabooks Dell anteriores.
Embora tenha sua parte de falhas potencialmente significantes (dependendo do comprador e o seu uso), se conseguir tolerá-los, ainda há muito do que gostar no Latitude 7280.
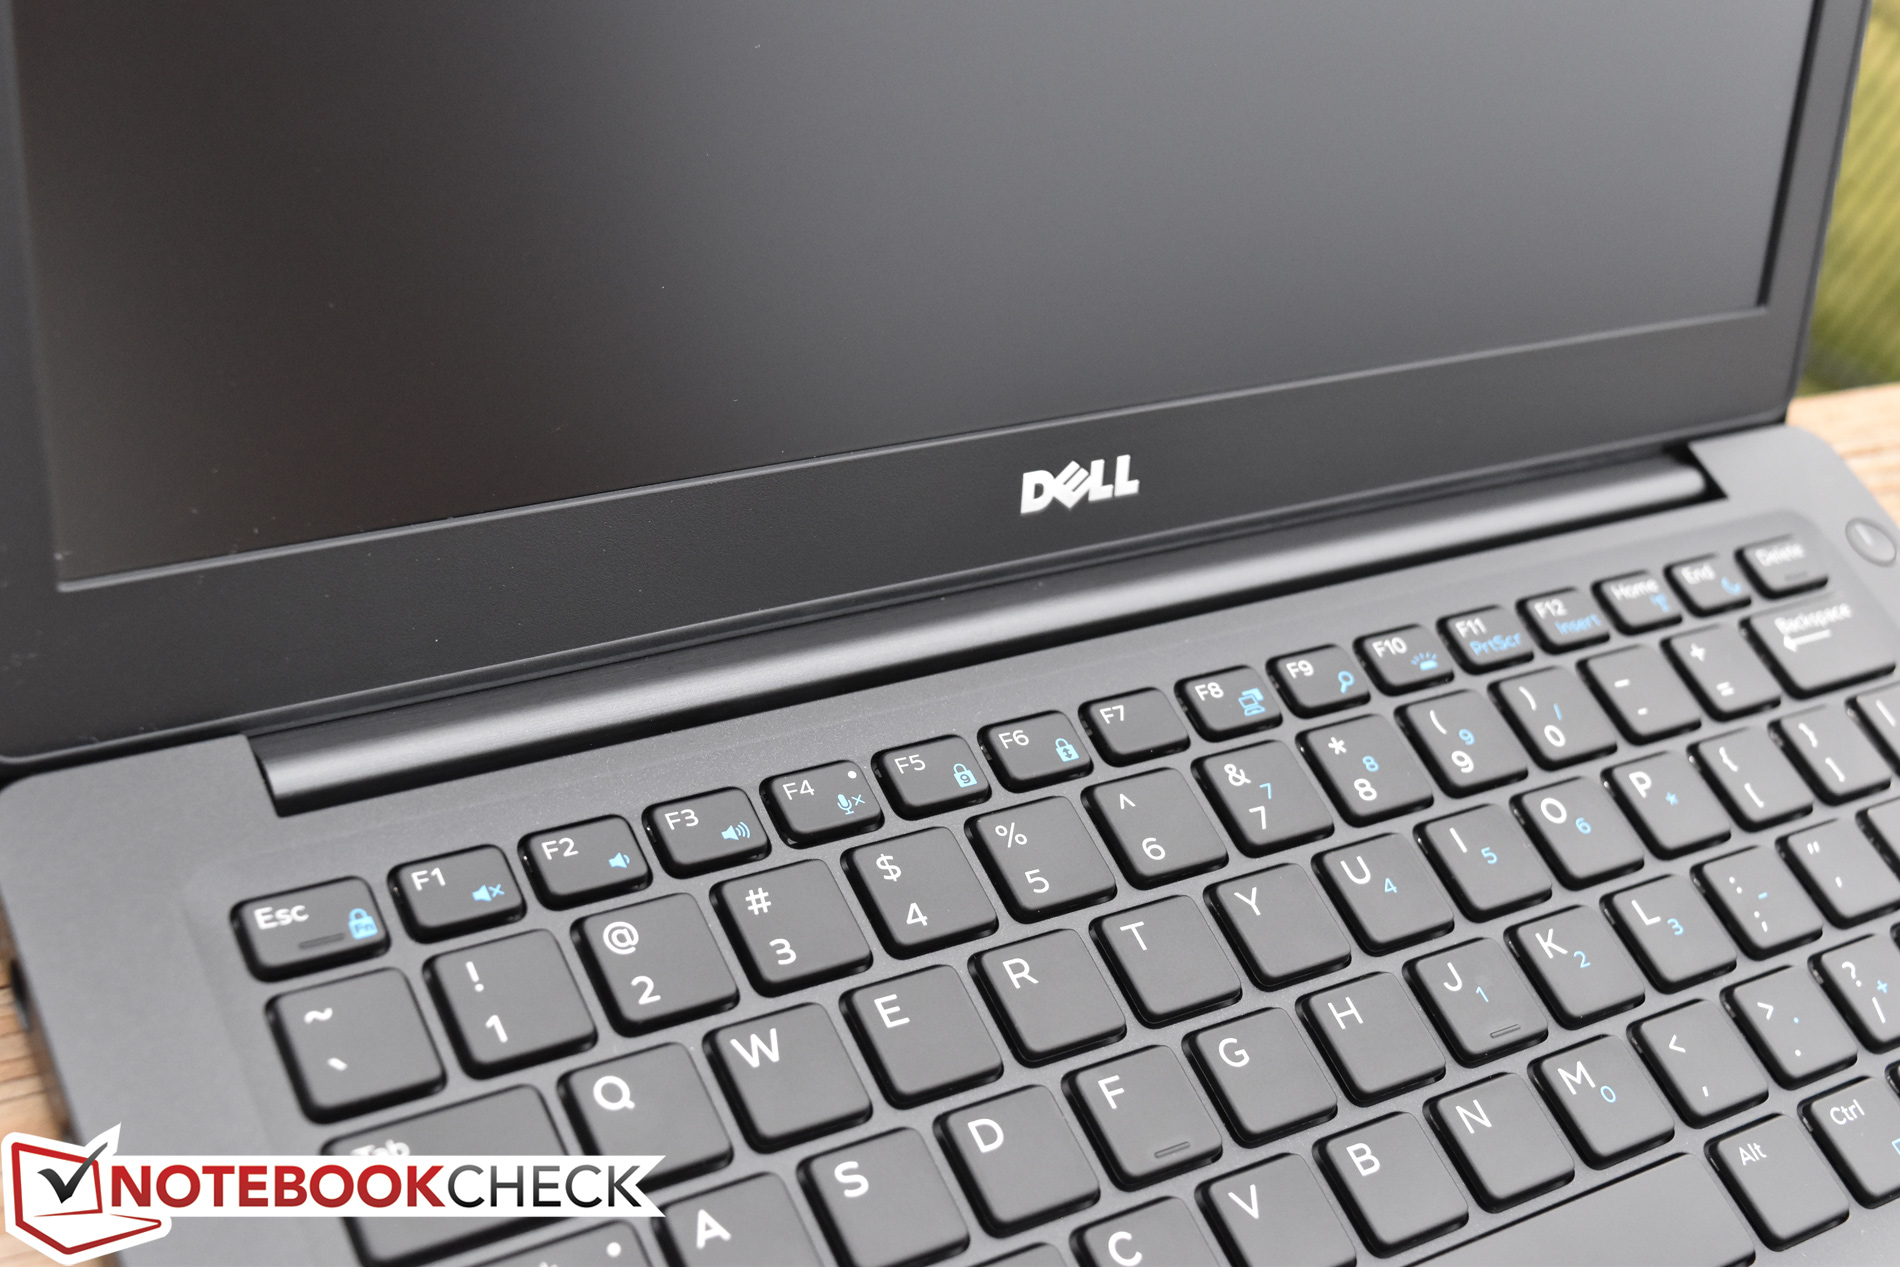
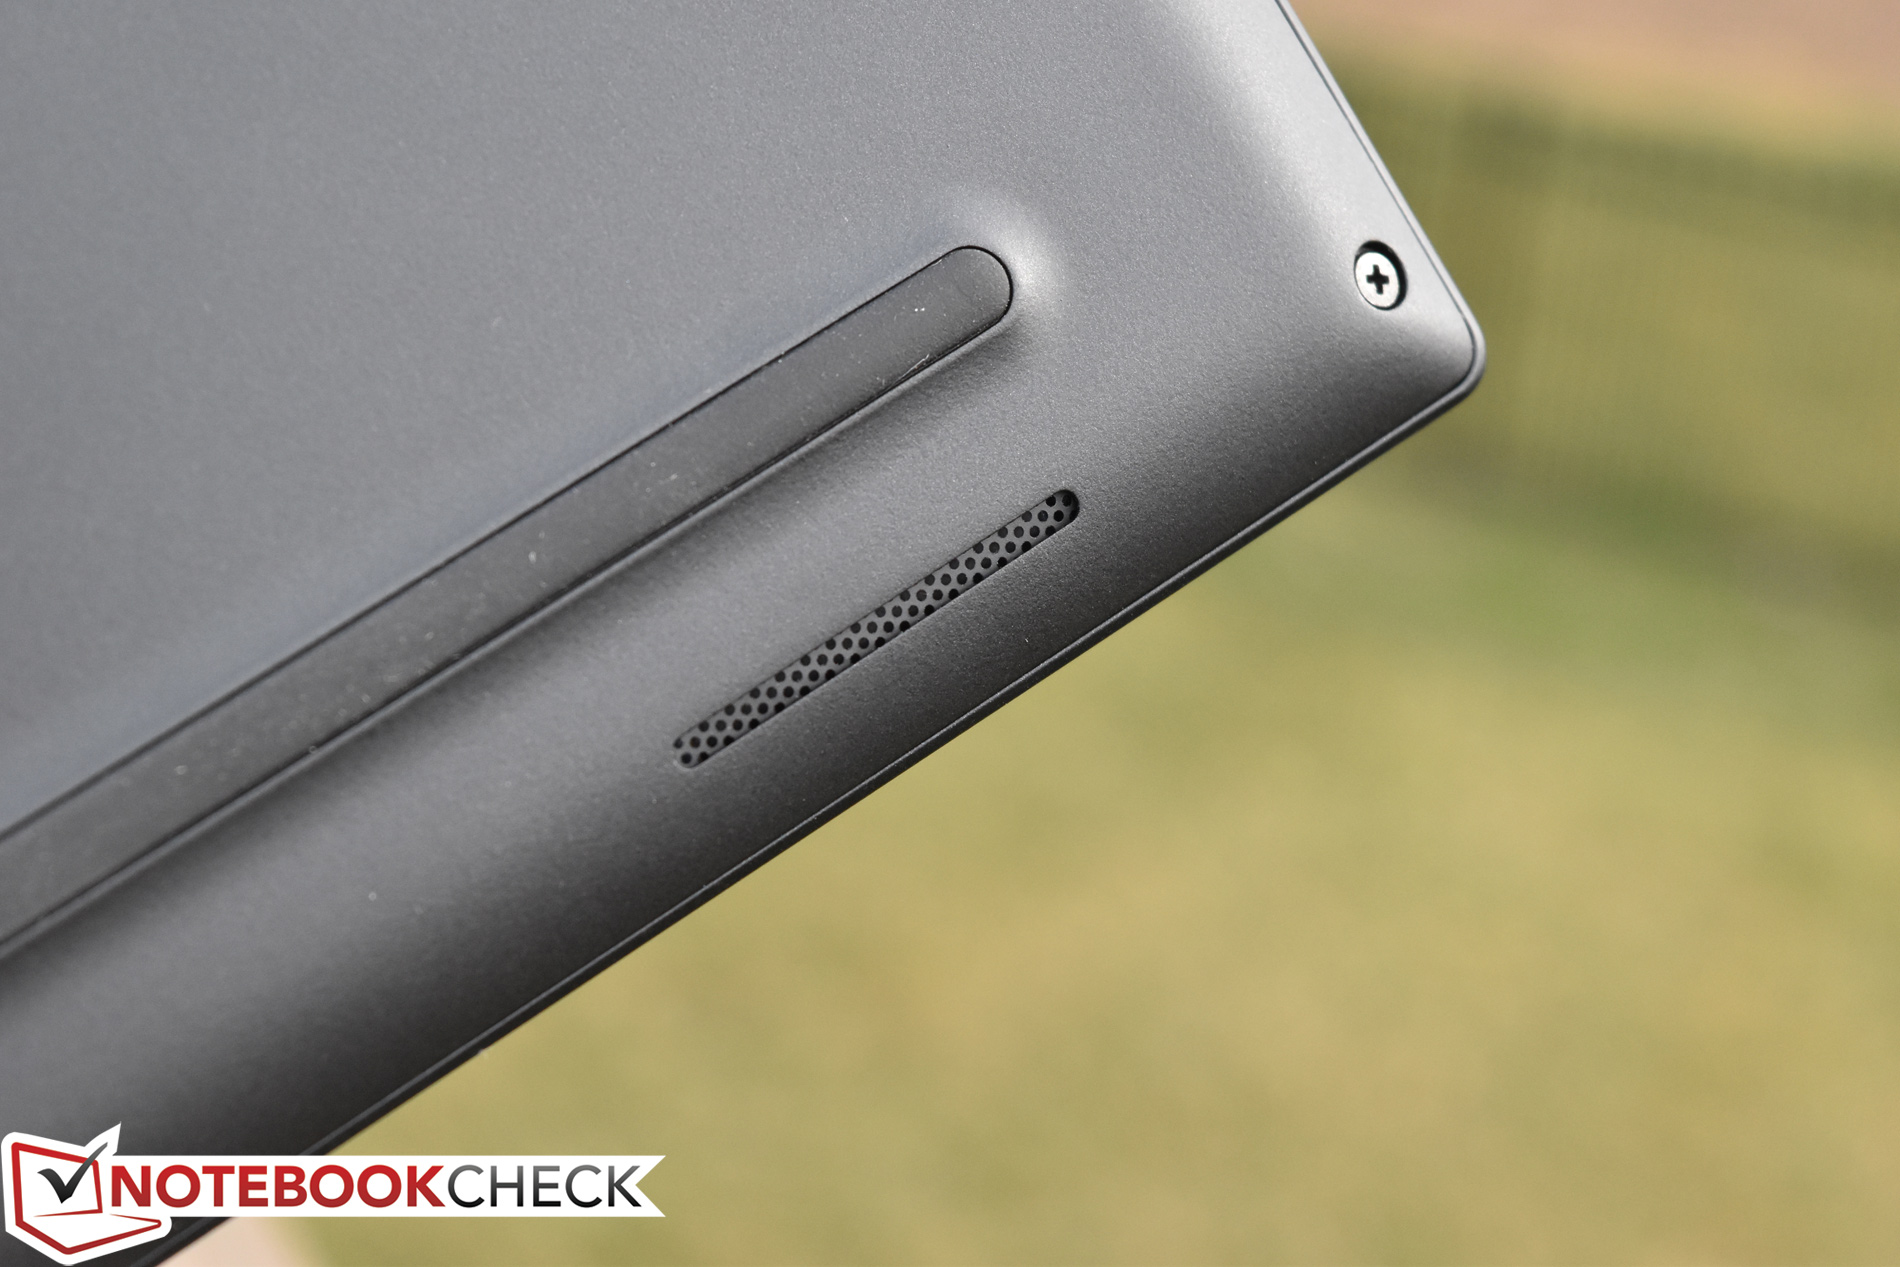
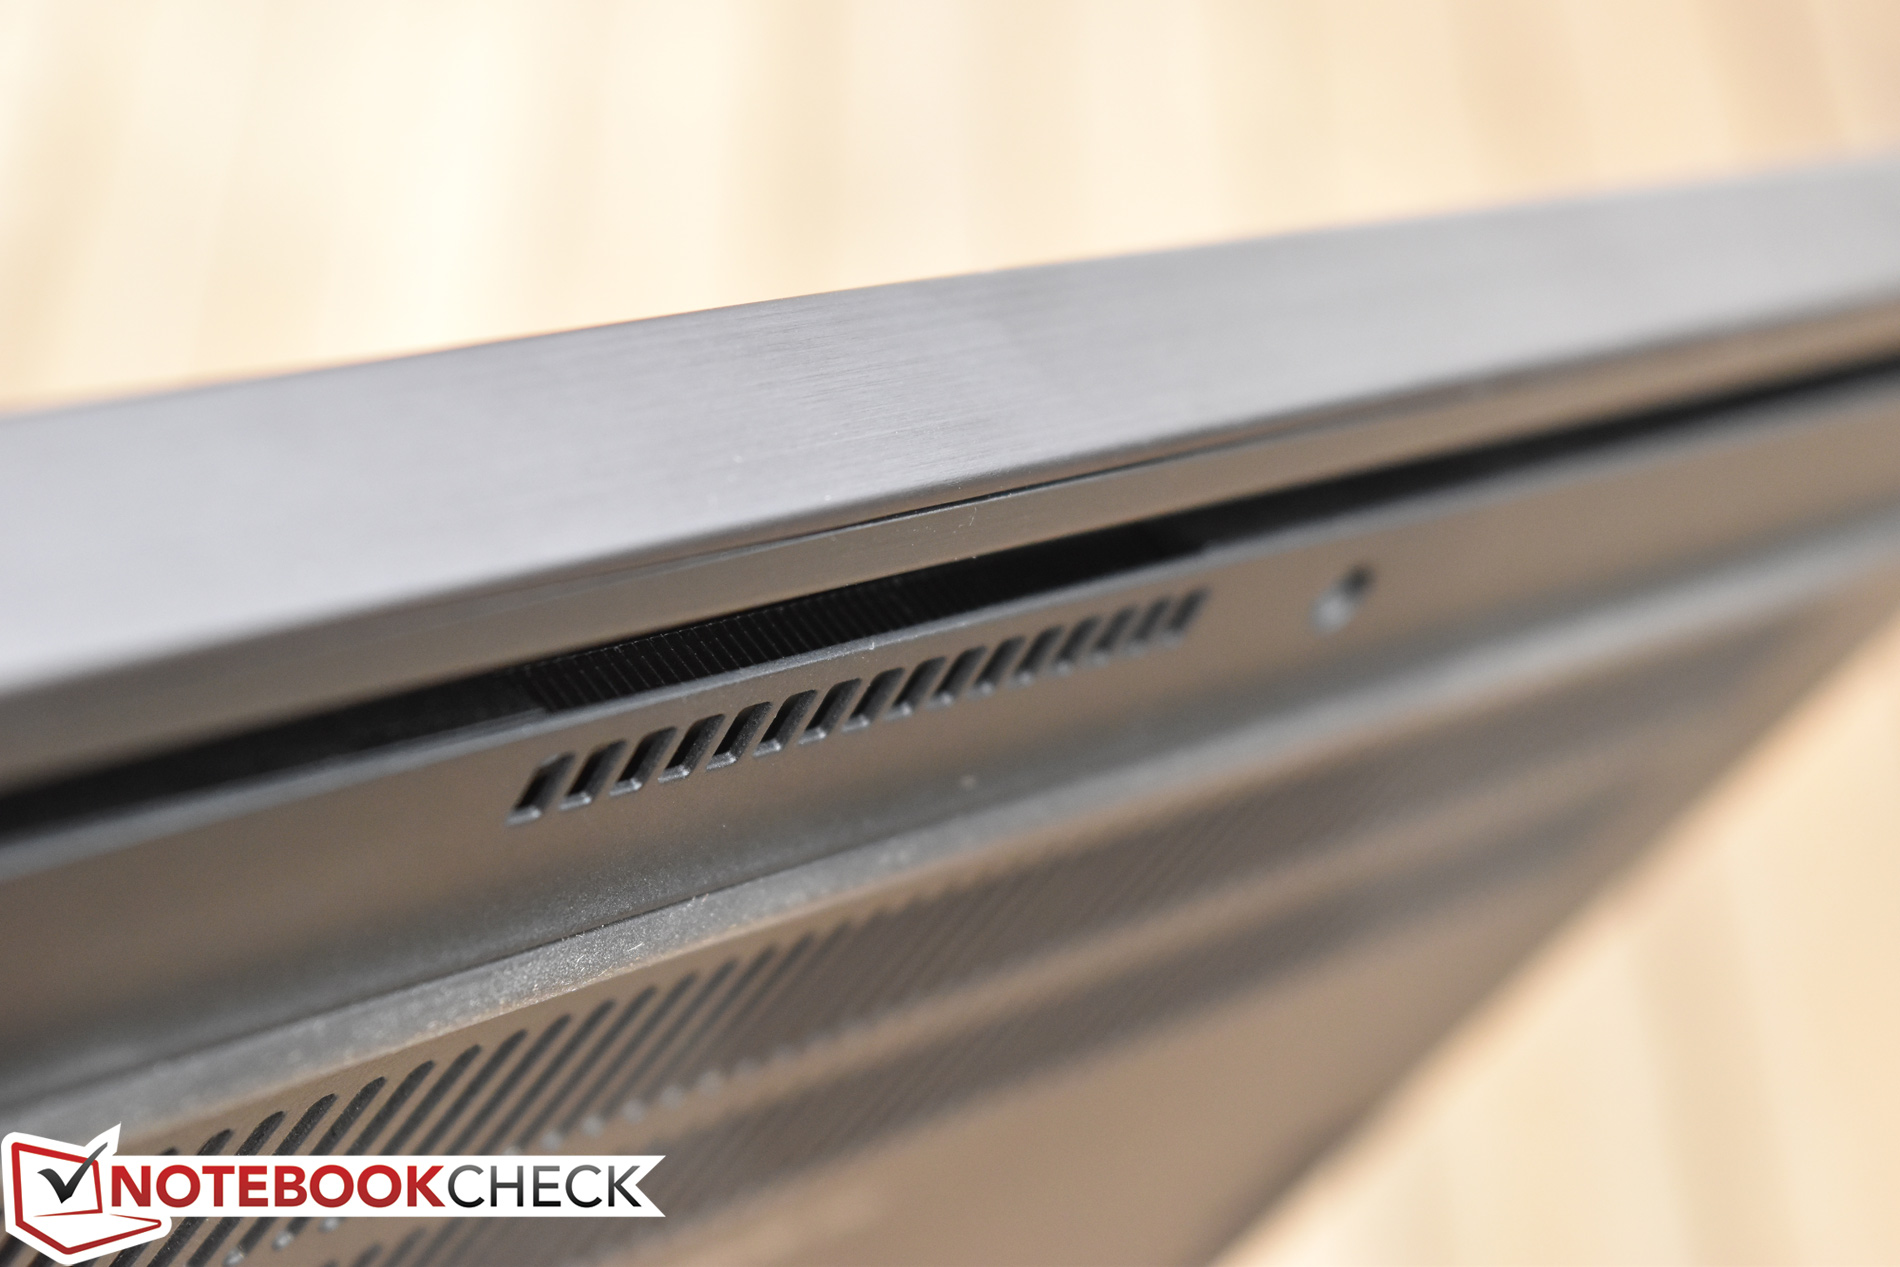
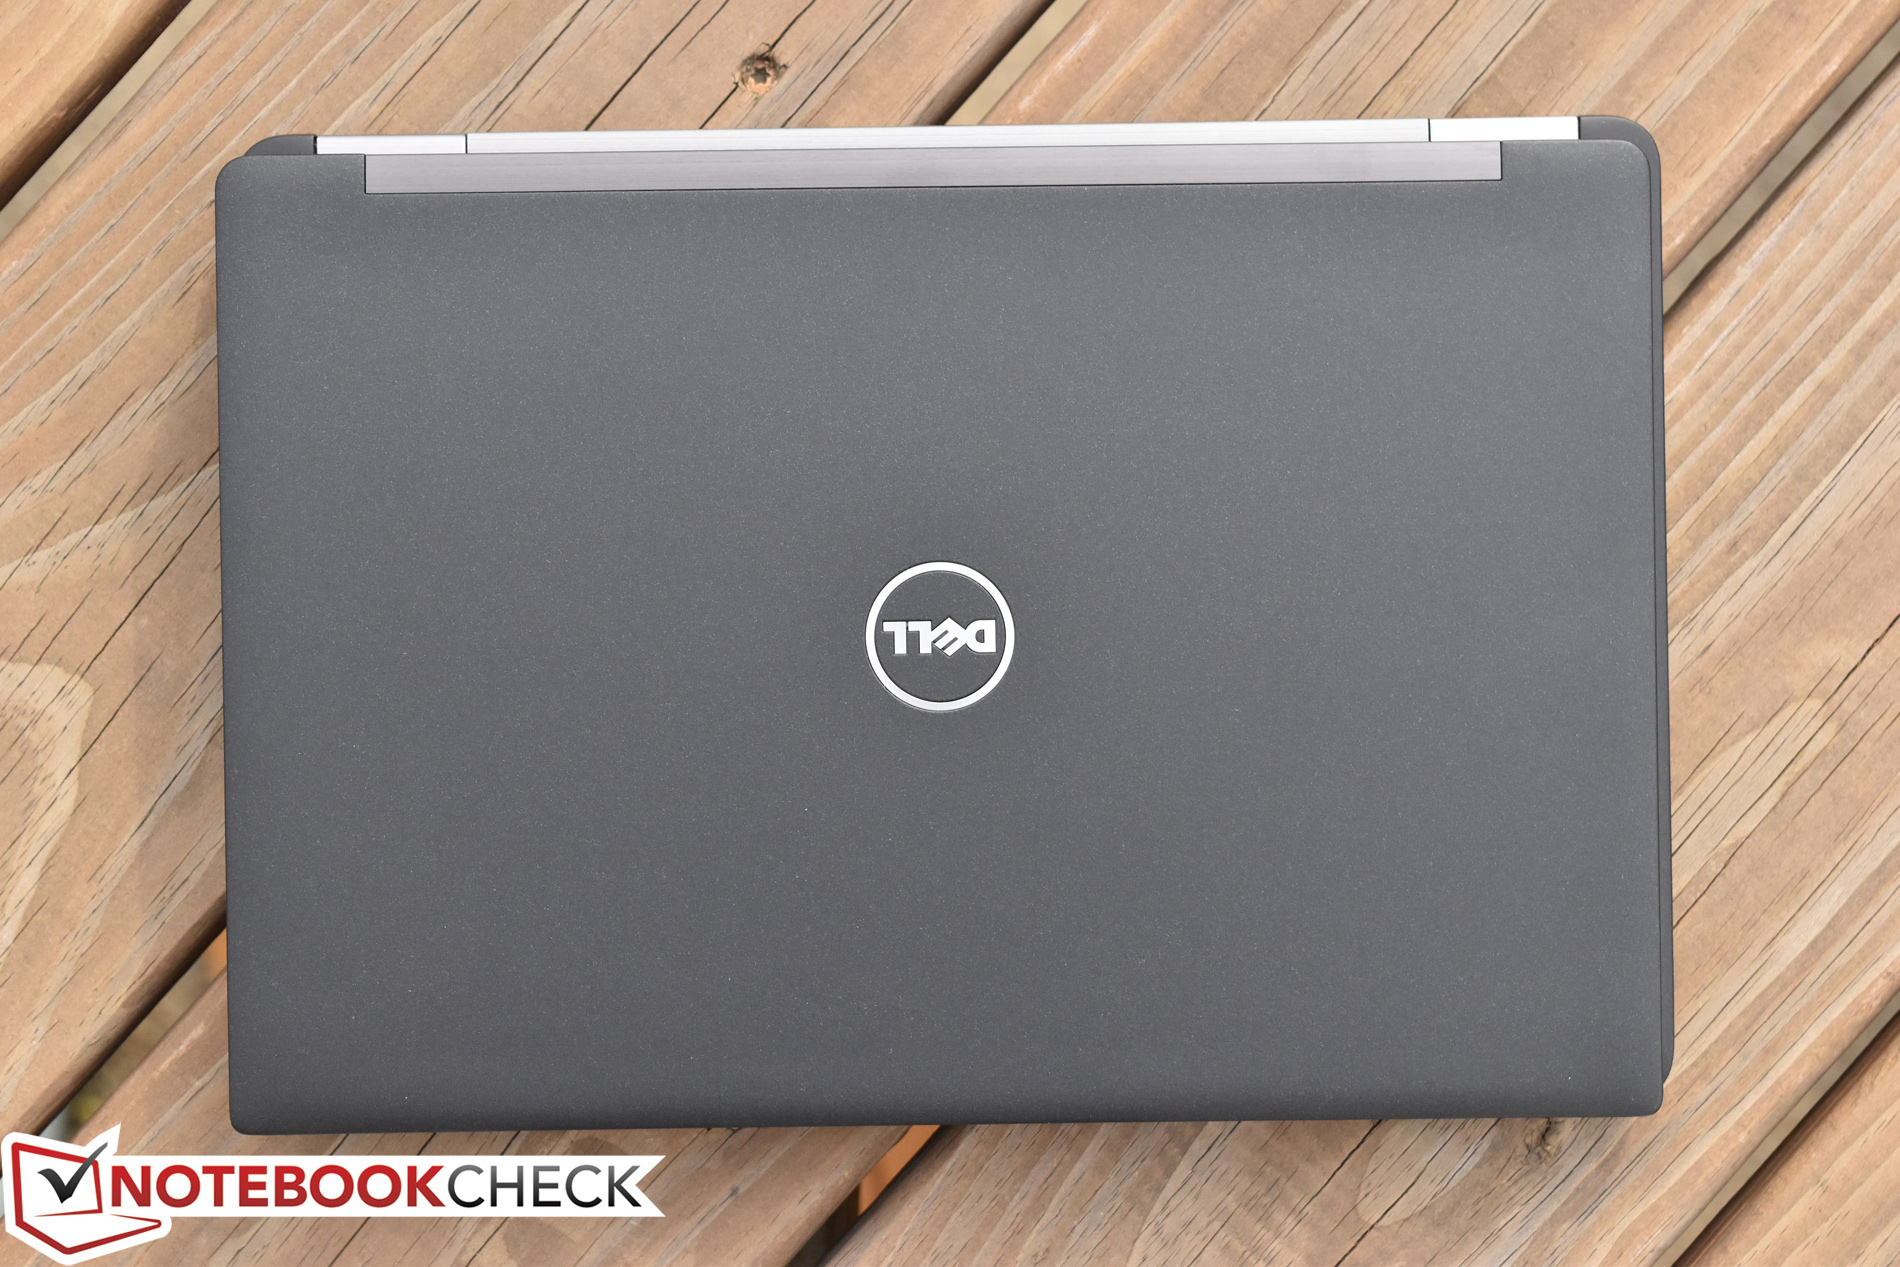
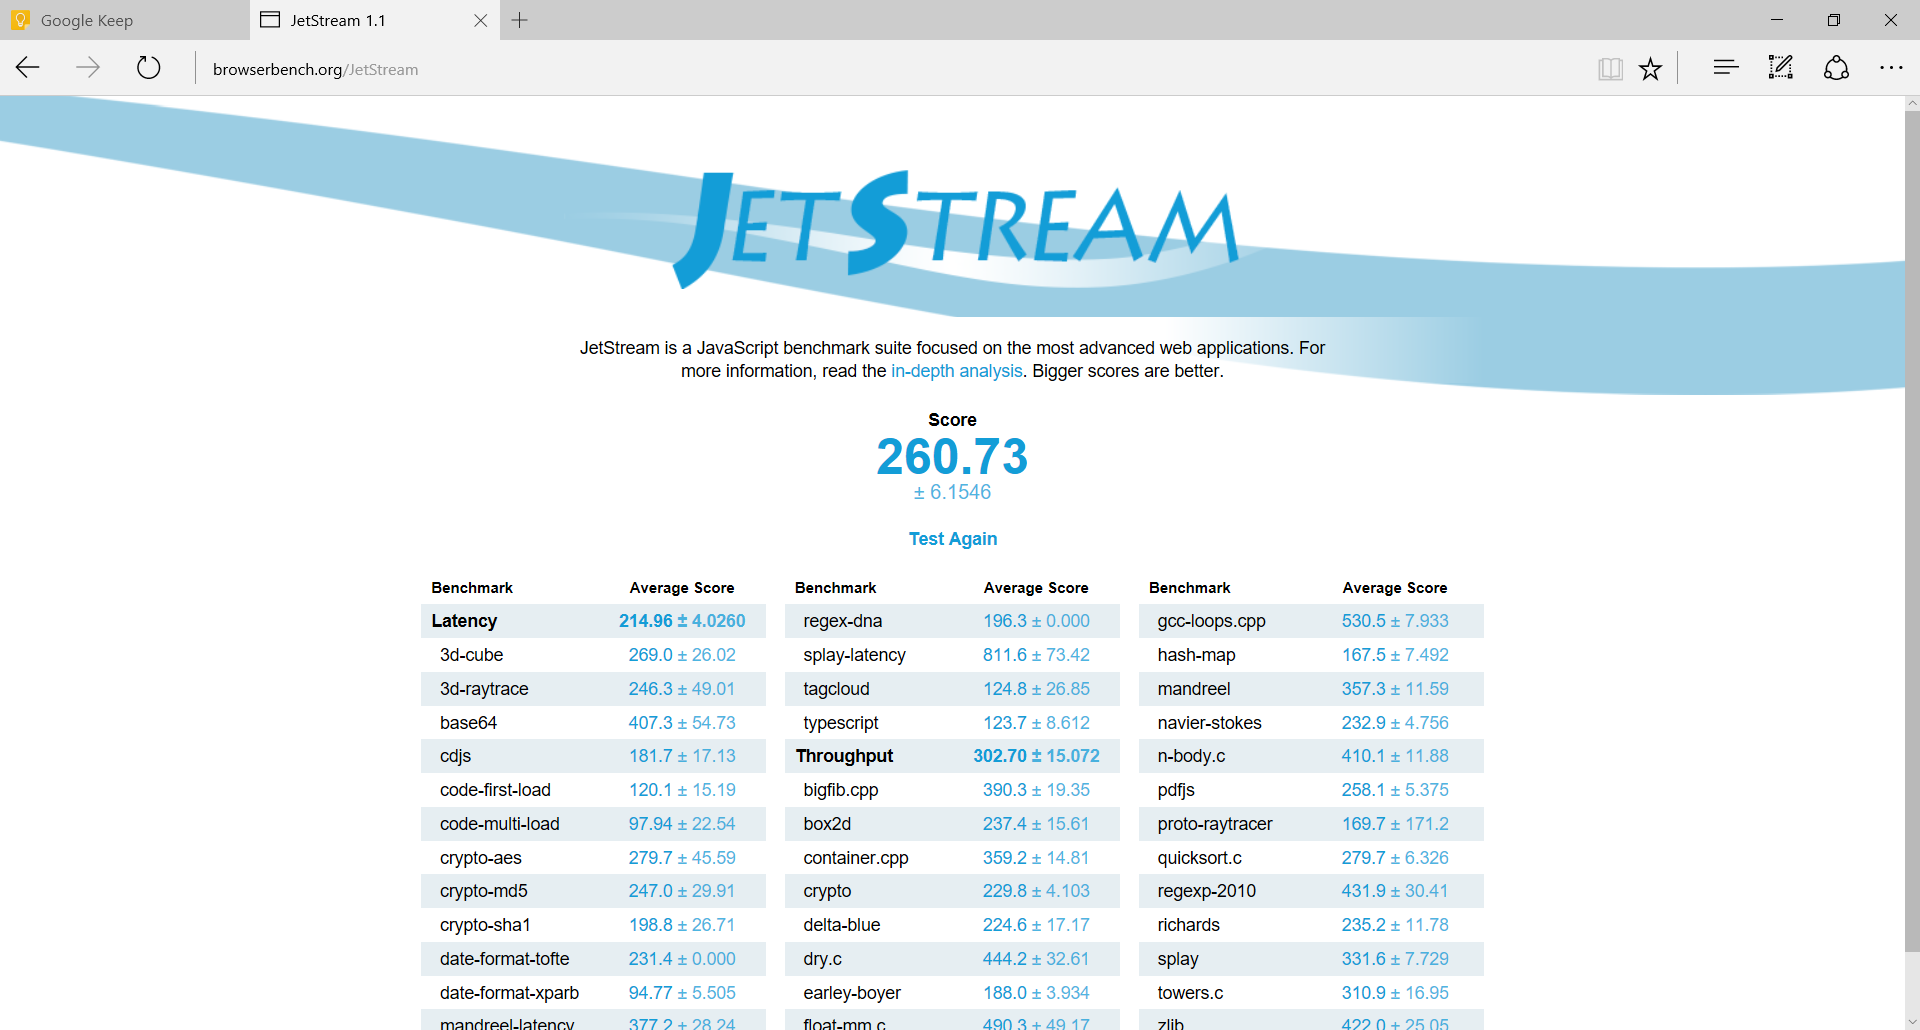
Mas, além destes pontos negativos, existem vários pontos positivos para levar em conta. Para começar, a qualidade de construção do 7280 é impecável, quase sem flexões e uma sensação ergonômica muito agradável, apesar de seu perfil fino e leve. A duração da bateria é positivamente notável. O teclado está entre os melhores de sua classe. A máquina é praticamente silenciosa (fora o ruído da CPU) durante quase qualquer tipo de uso, e ainda consegue manter temperaturas razoáveis. E o desempenho é ultrarrápido na operação geral do sistema, com benchmarks de aplicação sintética, colocando a maioria dos outros em vergonha.
Para aqueles desanimados pelas desvantagens que mencionamos antes, esta é uma máquina empresarial ultra portável extremamente sólida e bem construída. Para outros, o E7270 ainda poderia apresentar um pacote mais atraente, ou o EliteBook 820 G4 ou ThinkPad X260 poderiam ser melhores opções.
Dell Latitude 7280
-
04/05/2017 v6(old)
Steve Schardein
Pricecompare
