 Deutsch
 English
 Español
 Français
 Italiano
 Nederlands
 Polski
 Português
 Русский
 Türkçe
 Svenska
 Chinese
 Magyar
Breve Análise do Portátil Dell XPS 13 2016 (i7, 256 GB, QHD+)
| |||||||||||||||||||||||||
iluminação: 90 %
iluminação com acumulador: 216 cd/m²
Contraste: 1583:1 (Preto: 0.18 cd/m²)
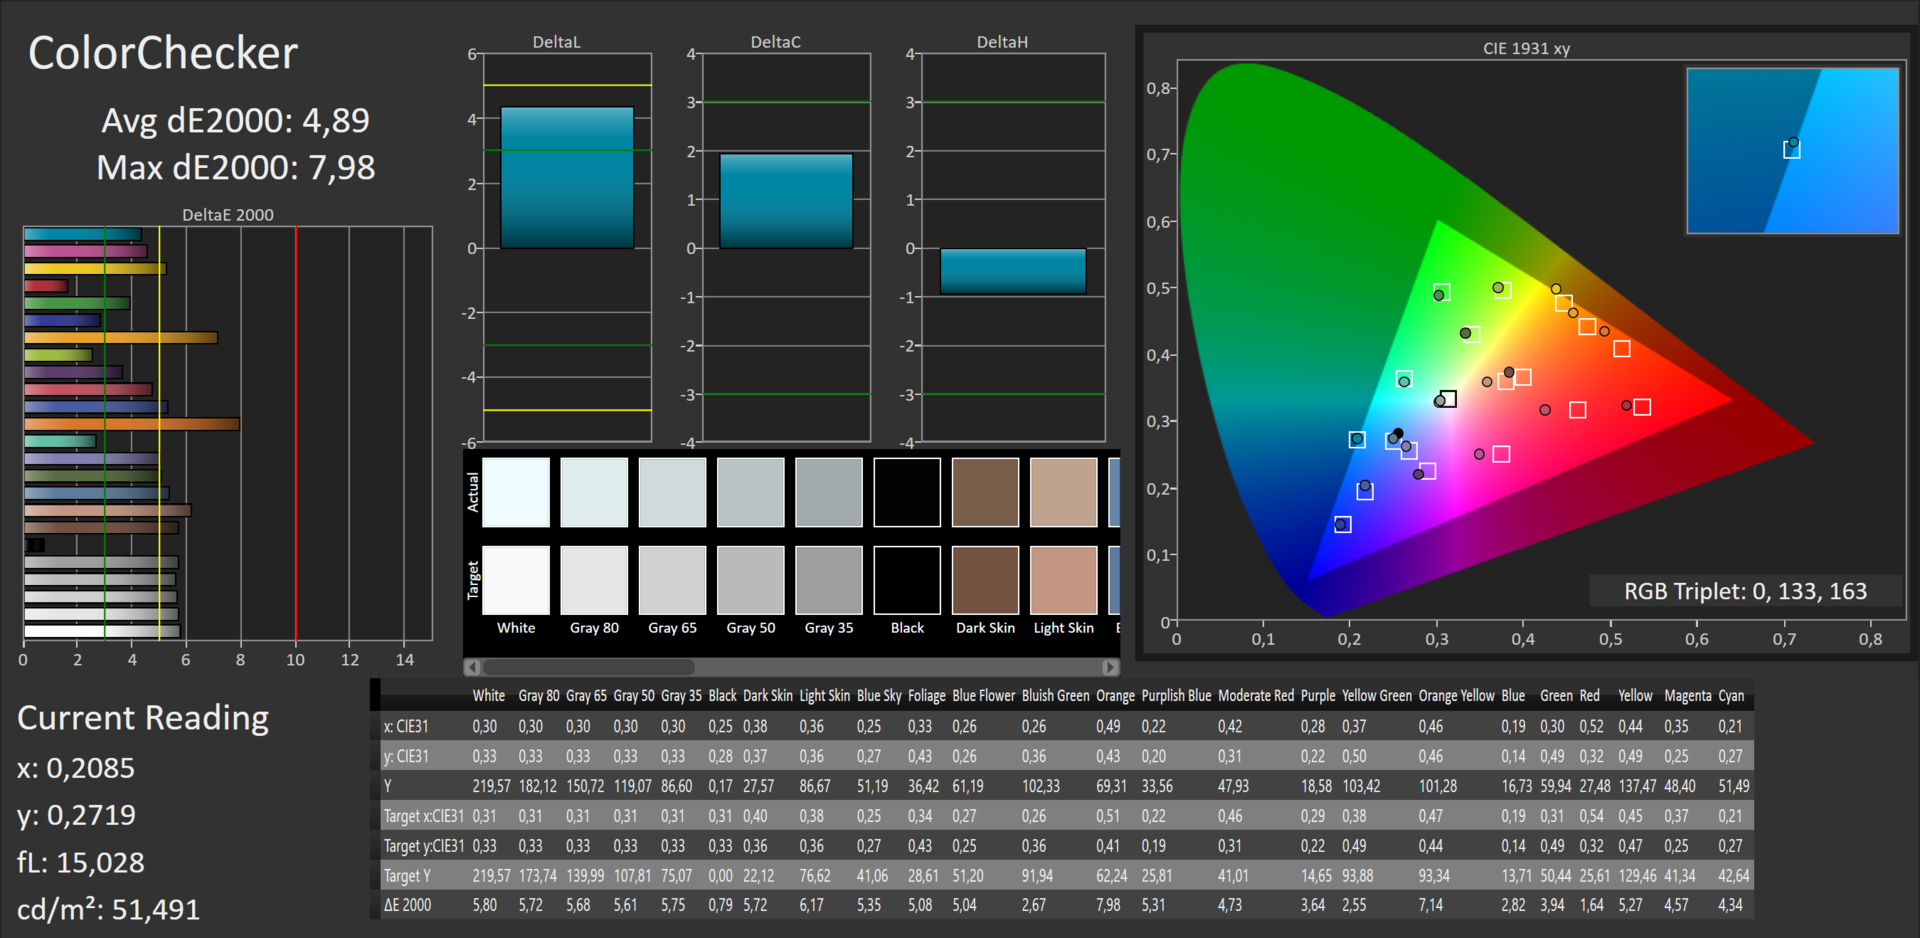
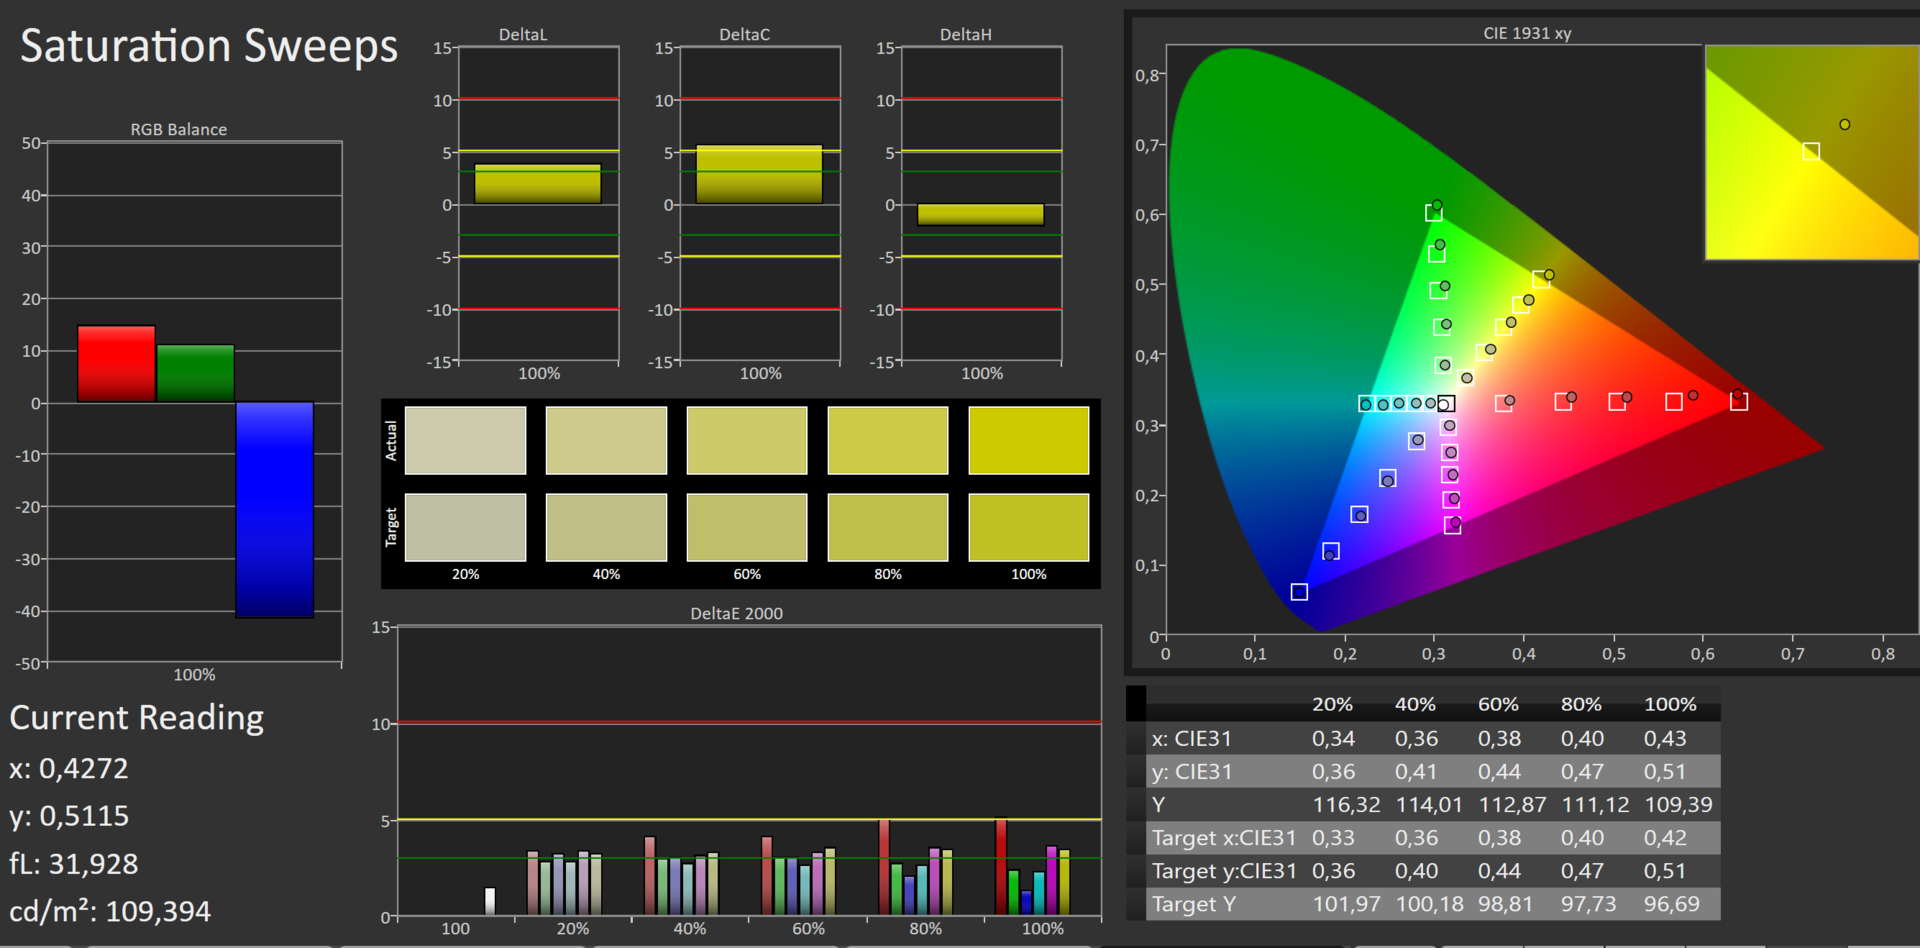
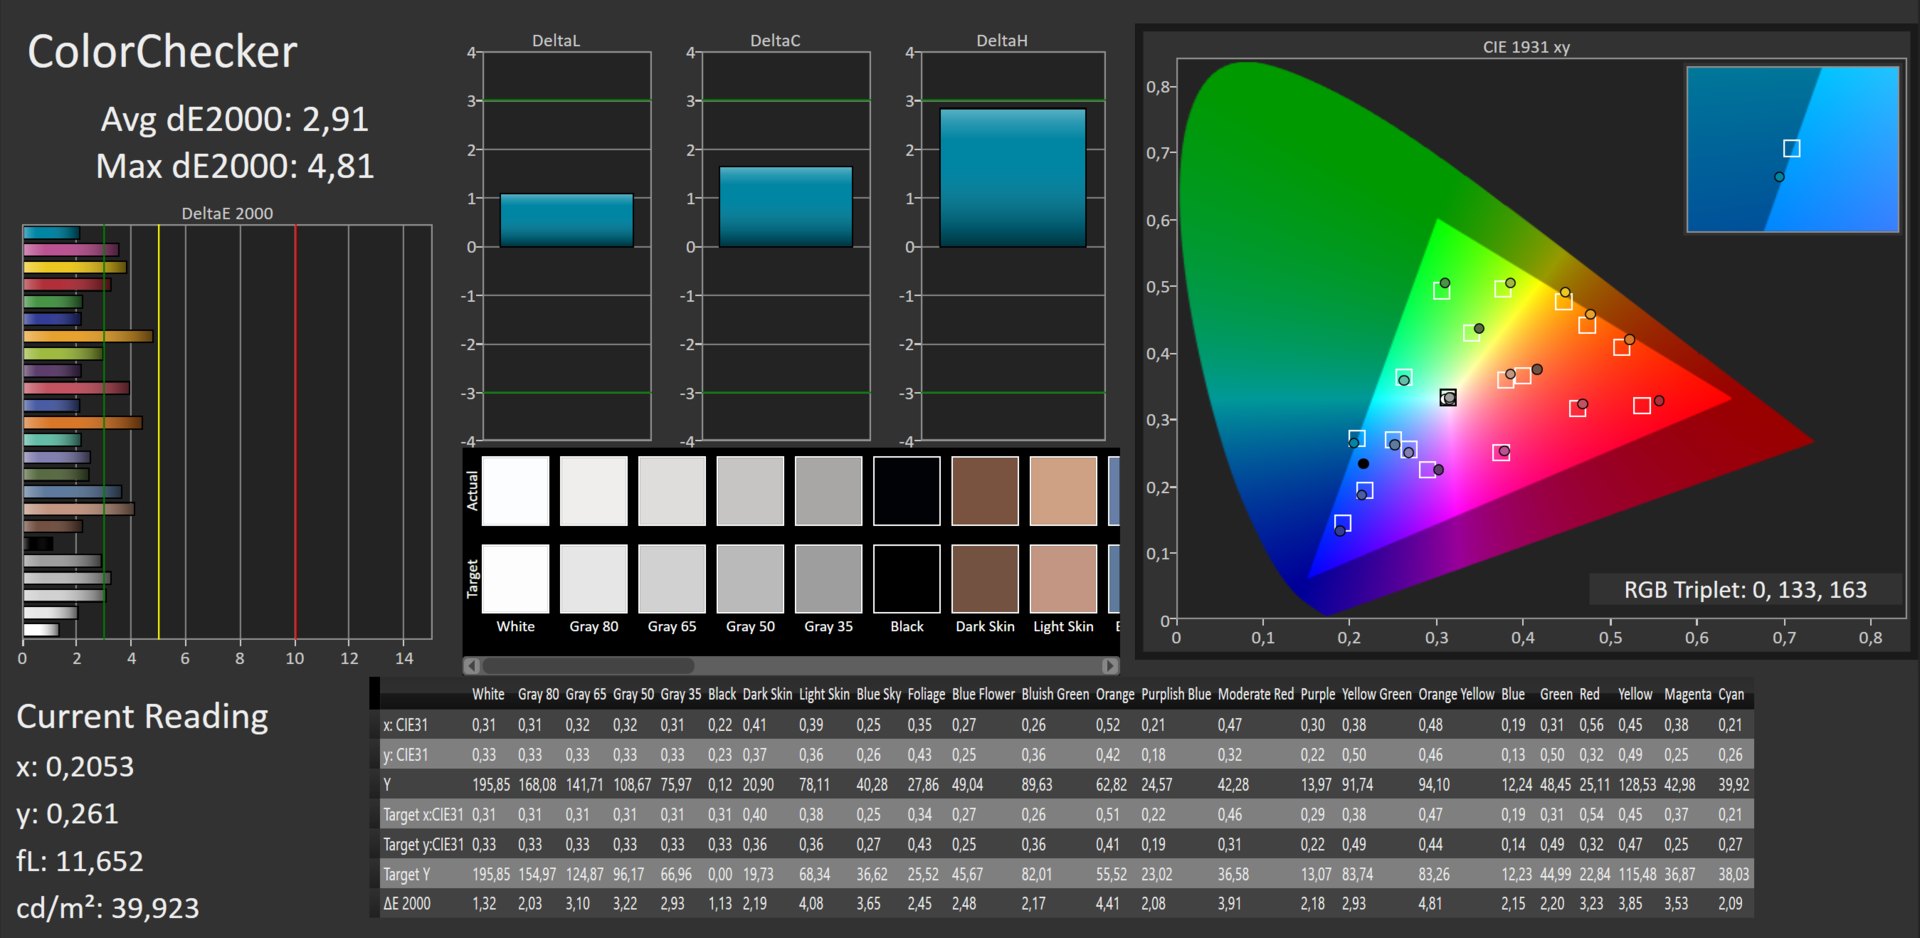
ΔE Color 4.89 | 0.5-29.43 Ø5
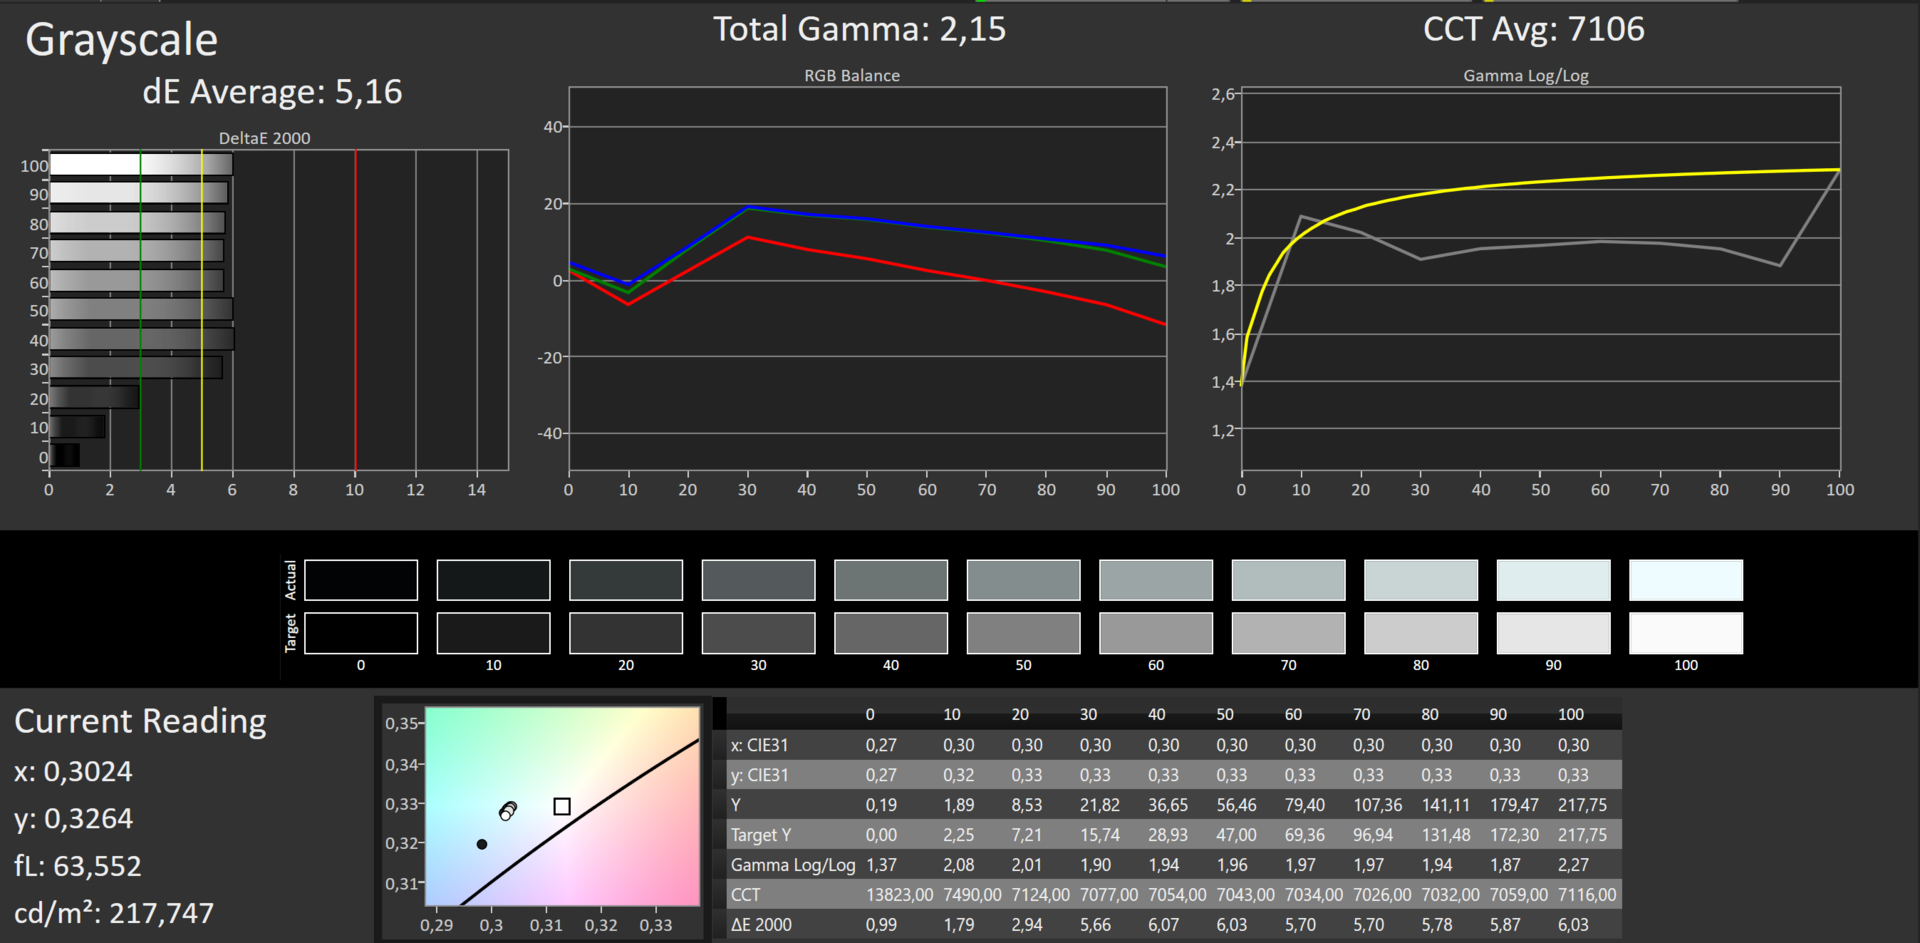
ΔE Greyscale 5.16 | 0.57-98 Ø5.3
93% sRGB (Argyll 1.6.3 3D)
59% AdobeRGB 1998 (Argyll 1.6.3 3D)
65.5% AdobeRGB 1998 (Argyll 2.2.0 3D)
93.6% sRGB (Argyll 2.2.0 3D)
63.6% Display P3 (Argyll 2.2.0 3D)
Gamma: 2.15
| Dell XPS 13-9350 Touch 13.3 3200x1800 IGZO | Dell XPS 13-9350 Non-Touch 13.3 1920x1080 IPS | Dell XPS 13-9343 Touch 13.3 3200x1800 IPS | Dell XPS 13-9343 Non-Touch 13.3 1920x1080 IPS | Apple MB Air 13 2015-03 13.3 1440x900 TN | MS Surface Pro 4 12.3 2736x1824 IPS | MS Surface Book 13.5 3000x2000 IPS | |
|---|---|---|---|---|---|---|---|
| Display | -30% | 8% | 0% | -37% | 2% | 4% | |
| Display P3 Coverage | 63.6 | 44.53 -30% | 72 13% | 65.9 4% | 40.1 -37% | 65 2% | 67 5% |
| sRGB Coverage | 93.6 | 66.8 -29% | 96 3% | 89.6 -4% | 59.8 -36% | 96.5 3% | 95.8 2% |
| AdobeRGB 1998 Coverage | 65.5 | 45.97 -30% | 71.6 9% | 66.2 1% | 41.51 -37% | 67 2% | 68.9 5% |
| Response Times | -39% | -15% | |||||
| Response Time Grey 50% / Grey 80% * | 40 ? | 46 ? -15% | 48.4 ? -21% | ||||
| Response Time Black / White * | 30 ? | 31.2 ? -4% | 32.8 ? -9% | ||||
| PWM Frequency | 4900 ? | 50 ? -99% | |||||
| Screen | -7% | 8% | -11% | -20% | 3% | 21% | |
| Brightness middle | 285 | 277.5 -3% | 367.3 29% | 409.7 44% | 329 15% | 413 45% | 430.9 51% |
| Brightness | 281 | 276 -2% | 372 32% | 405 44% | 310 10% | 396 41% | 410 46% |
| Brightness Distribution | 90 | 88 -2% | 77 -14% | 93 3% | 82 -9% | 87 -3% | 93 3% |
| Black Level * | 0.18 | 0.191 -6% | 0.178 1% | 0.366 -103% | 0.405 -125% | 0.36 -100% | 0.254 -41% |
| Contrast | 1583 | 1453 -8% | 2063 30% | 1119 -29% | 812 -49% | 1147 -28% | 1696 7% |
| Colorchecker dE 2000 * | 4.89 | 4.88 -0% | 5.92 -21% | 7.67 -57% | 3.96 19% | 3.09 37% | 2.06 58% |
| Greyscale dE 2000 * | 5.16 | 4.26 17% | 4.79 7% | 4.66 10% | 3.51 32% | 3.92 24% | 2.22 57% |
| Gamma | 2.15 102% | 2.59 85% | 2.42 91% | 1.65 133% | 3.83 57% | 2.3 96% | 2.13 103% |
| CCT | 7106 91% | 6562 99% | 7013 93% | 6502 100% | 6711 97% | 7333 89% | 6520 100% |
| Color Space (Percent of AdobeRGB 1998) | 59 | 41.6 -29% | 63 7% | 59.65 1% | 38.4 -35% | 61 3% | 64 8% |
| Color Space (Percent of sRGB) | 93 | 65.79 -29% | 96.4 4% | 59.8 -36% | 97 4% | 96 3% | |
| Colorchecker dE 2000 max. * | 7.51 | ||||||
| Total Average (Program / Settings) | -19% /
-13% | 8% /
8% | -6% /
-8% | -29% /
-24% | -11% /
-6% | 3% /
12% |
* ... smaller is better
Display Response Times
| ↔ Response Time Black to White | ||
|---|---|---|
| 30 ms ... rise ↗ and fall ↘ combined | ↗ 7 ms rise | 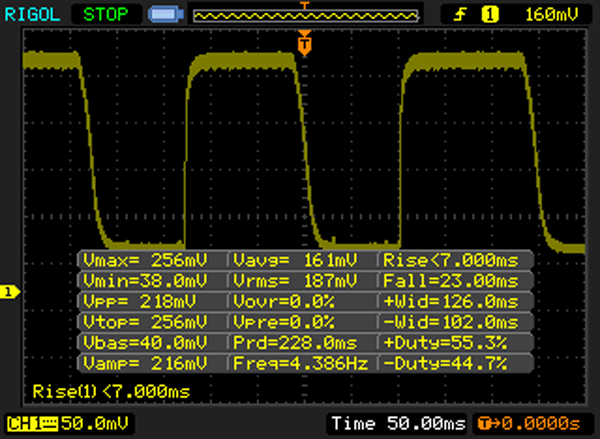 |
| ↘ 23 ms fall | ||
| The screen shows slow response rates in our tests and will be unsatisfactory for gamers. In comparison, all tested devices range from 0.1 (minimum) to 240 (maximum) ms. » 77 % of all devices are better. This means that the measured response time is worse than the average of all tested devices (21.5 ms). | ||
| ↔ Response Time 50% Grey to 80% Grey | ||
| 40 ms ... rise ↗ and fall ↘ combined | ↗ 10 ms rise | 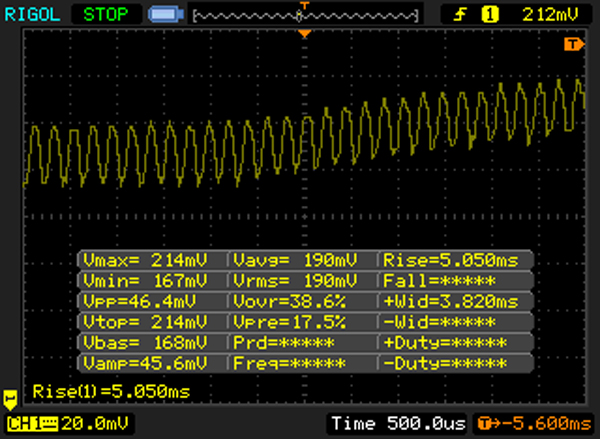 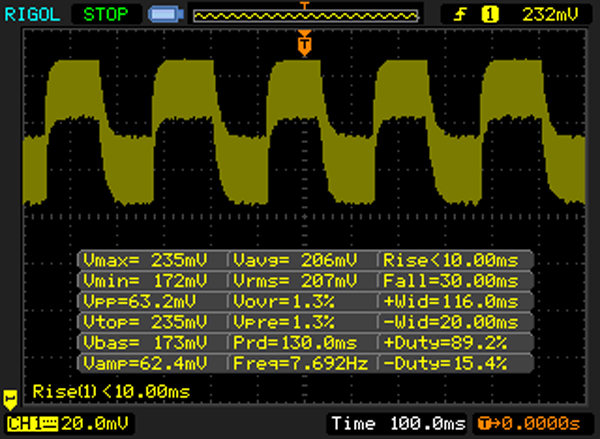 |
| ↘ 30 ms fall | ||
| The screen shows slow response rates in our tests and will be unsatisfactory for gamers. In comparison, all tested devices range from 0.2 (minimum) to 636 (maximum) ms. » 56 % of all devices are better. This means that the measured response time is worse than the average of all tested devices (33.8 ms). | ||
Screen Flickering / PWM (Pulse-Width Modulation)
| Screen flickering / PWM detected | 4900 Hz | ≤ 100 % brightness setting | 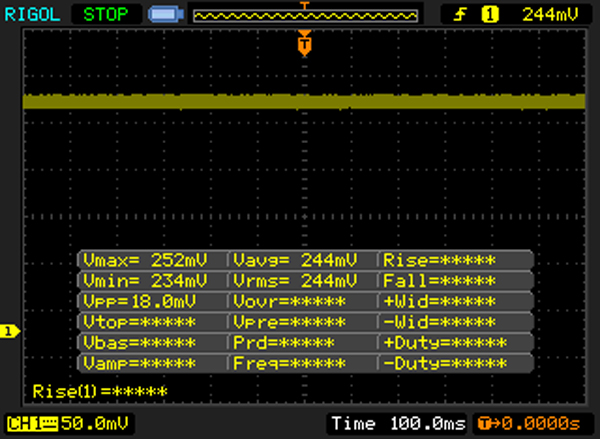 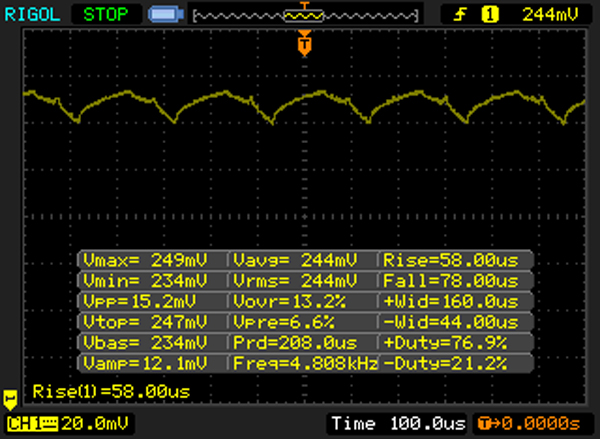 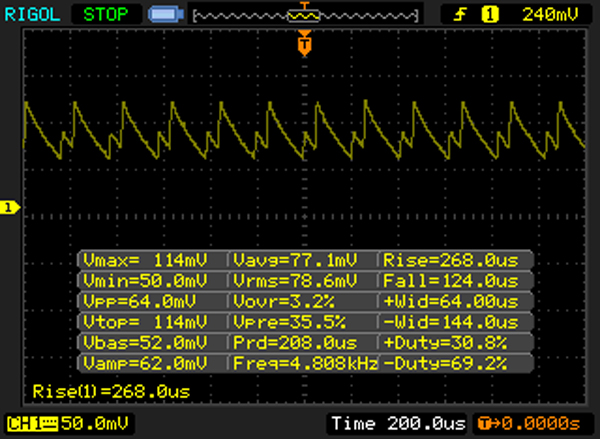 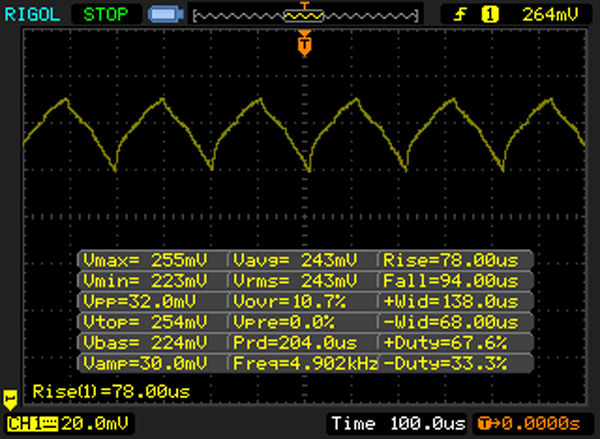 |
The display backlight flickers at 4900 Hz (worst case, e.g., utilizing PWM) Flickering detected at a brightness setting of 100 % and below. There should be no flickering or PWM above this brightness setting. The frequency of 4900 Hz is quite high, so most users sensitive to PWM should not notice any flickering. In comparison: 53 % of all tested devices do not use PWM to dim the display. If PWM was detected, an average of 17942 (minimum: 5 - maximum: 3846000) Hz was measured. | |||
| Cinebench R15 | |
| CPU Single 64Bit (sort by value) | |
| Dell XPS 13-9350 Touch | |
| Dell XPS 13-9350 Non-Touch | |
| Dell XPS 13-9343 Touch | |
| Dell XPS 13-9343 Non-Touch | |
| Apple MB Air 13 2015-03 | |
| MS Surface Pro 4 | |
| MS Surface Book | |
| CPU Multi 64Bit (sort by value) | |
| Dell XPS 13-9350 Touch | |
| Dell XPS 13-9350 Non-Touch | |
| Dell XPS 13-9343 Touch | |
| Dell XPS 13-9343 Non-Touch | |
| Apple MB Air 13 2015-03 | |
| MS Surface Pro 4 | |
| MS Surface Book | |
| Cinebench R11.5 | |
| CPU Single 64Bit (sort by value) | |
| Dell XPS 13-9350 Touch | |
| Dell XPS 13-9350 Non-Touch | |
| Dell XPS 13-9343 Touch | |
| Dell XPS 13-9343 Non-Touch | |
| Apple MB Air 13 2015-03 | |
| MS Surface Pro 4 | |
| MS Surface Book | |
| CPU Multi 64Bit (sort by value) | |
| Dell XPS 13-9350 Touch | |
| Dell XPS 13-9350 Non-Touch | |
| Dell XPS 13-9343 Touch | |
| Dell XPS 13-9343 Non-Touch | |
| Apple MB Air 13 2015-03 | |
| MS Surface Pro 4 | |
| MS Surface Book | |
| PCMark 7 | |
| Score (sort by value) | |
| Dell XPS 13-9350 Touch | |
| Dell XPS 13-9350 Non-Touch | |
| Dell XPS 13-9343 Touch | |
| Dell XPS 13-9343 Non-Touch | |
| Apple MB Air 13 2015-03 | |
| MS Surface Pro 4 | |
| MS Surface Book | |
| Productivity (sort by value) | |
| Dell XPS 13-9350 Touch | |
| Dell XPS 13-9343 Non-Touch | |
| Apple MB Air 13 2015-03 | |
| MS Surface Pro 4 | |
| MS Surface Book | |
| Creativity (sort by value) | |
| Dell XPS 13-9350 Touch | |
| Dell XPS 13-9343 Non-Touch | |
| Apple MB Air 13 2015-03 | |
| MS Surface Pro 4 | |
| MS Surface Book | |
| Computation (sort by value) | |
| Dell XPS 13-9350 Touch | |
| Dell XPS 13-9343 Non-Touch | |
| Apple MB Air 13 2015-03 | |
| MS Surface Pro 4 | |
| MS Surface Book | |
| System Storage (sort by value) | |
| Dell XPS 13-9350 Touch | |
| Dell XPS 13-9343 Non-Touch | |
| Apple MB Air 13 2015-03 | |
| MS Surface Pro 4 | |
| MS Surface Book | |
| Entertainment (sort by value) | |
| Dell XPS 13-9350 Touch | |
| Dell XPS 13-9343 Non-Touch | |
| Apple MB Air 13 2015-03 | |
| MS Surface Pro 4 | |
| MS Surface Book | |
| PCMark 8 | |
| Home Score Accelerated v2 (sort by value) | |
| Dell XPS 13-9350 Touch | |
| Dell XPS 13-9350 Non-Touch | |
| Dell XPS 13-9343 Touch | |
| Dell XPS 13-9343 Non-Touch | |
| Apple MB Air 13 2015-03 | |
| MS Surface Pro 4 | |
| MS Surface Book | |
| Work Score Accelerated v2 (sort by value) | |
| Dell XPS 13-9350 Touch | |
| Dell XPS 13-9350 Non-Touch | |
| Dell XPS 13-9343 Touch | |
| Dell XPS 13-9343 Non-Touch | |
| Apple MB Air 13 2015-03 | |
| MS Surface Pro 4 | |
| MS Surface Book | |
| PCMark 7 Score | 4977 pontos | |
| PCMark 8 Home Score Accelerated v2 | 2822 pontos | |
| PCMark 8 Work Score Accelerated v2 | 3735 pontos | |
Ajuda | ||
| Dell XPS 13-9350 Touch Samsung PM951 NVMe MZ-VLV256D | Dell XPS 13-9350 Non-Touch Samsung PM951 NVMe MZ-VLV256D | Dell XPS 13-9343 Touch Lite-On IT L8T-256L9G | Dell XPS 13-9343 Non-Touch Samsung SSD PM851 M.2 2280 128GB | Apple MB Air 13 2015-03 Apple SSD SD0256F | MS Surface Pro 4 Samsung MZFLV128 NVMe | MS Surface Book Samsung MZFLV256 NVMe | |
|---|---|---|---|---|---|---|---|
| CrystalDiskMark 3.0 | -12% | -11% | -40% | 33% | -31% | ||
| Read Seq | 764 | 1097 44% | 489.6 -36% | 526 -31% | 1352 77% | 666 -13% | |
| Write Seq | 311.4 | 307.7 -1% | 424.2 36% | 124.2 -60% | 1111 257% | 154.2 -50% | |
| Read 4k | 42.16 | 38.52 -9% | 34.76 -18% | 27.82 -34% | 21.93 -48% | 28.51 -32% | |
| Write 4k | 121 | 113 -7% | 79.3 -34% | 95.5 -21% | 30.94 -74% | 101.5 -16% | |
| Read 4k QD32 | 485.7 | 244.7 -50% | 354 -27% | 325.7 -33% | 339.5 -30% | 368.3 -24% | |
| Write 4k QD32 | 293.6 | 151.5 -48% | 326.3 11% | 124.5 -58% | 342.9 17% | 153.6 -48% | |
| AS SSD | -22% | -18% | -39% | 41% | -20% | 22% | |
| Seq Read | 735 | 1243 69% | 484.7 -34% | 497.9 -32% | 1212 65% | 832 13% | 1223 66% |
| Seq Write | 301.2 | 152.6 -49% | 416.8 38% | 119.6 -60% | 1001 232% | 142.5 -53% | 275.2 -9% |
| 4K Read | 38.21 | 34.61 -9% | 30.89 -19% | 25.94 -32% | 19.16 -50% | 34.24 -10% | 34.31 -10% |
| 4K Write | 97.6 | 0.98 -99% | 58.8 -40% | 84 -14% | 23.73 -76% | 86.5 -11% | 85 -13% |
| Score Read | 809 | 1147 42% | 425 -47% | 441 -45% | 1281 58% | 645 -20% | 1566 94% |
| Score Write | 391 | 60 -85% | 369 -6% | 184 -53% | 463 18% | 239 -39% | 394 1% |
| Copy ISO MB/s | 317.8 | 283.1 | 643 | 121.9 | 388.2 | ||
| Copy Program MB/s | 149.1 | 157.5 | 245 | 63.5 | 174.1 | ||
| Total Average (Program / Settings) | -17% /
-17% | -15% /
-15% | -40% /
-39% | 37% /
37% | -26% /
-25% | 22% /
22% |

| 3DMark - 1280x720 Cloud Gate Standard Score (sort by value) | |
| Dell XPS 13-9350 Touch | |
| Dell XPS 13-9350 Non-Touch | |
| Dell XPS 13-9343 Touch | |
| Dell XPS 13-9343 Non-Touch | |
| Apple MB Air 13 2015-03 | |
| MS Surface Pro 4 | |
| MS Surface Book | |
| 3DMark 11 | |
| 1280x720 Performance GPU (sort by value) | |
| Dell XPS 13-9350 Touch | |
| Dell XPS 13-9350 Non-Touch | |
| Dell XPS 13-9343 Non-Touch | |
| Apple MB Air 13 2015-03 | |
| MS Surface Pro 4 | |
| MS Surface Book | |
| 1280x720 Performance (sort by value) | |
| Dell XPS 13-9350 Touch | |
| Dell XPS 13-9350 Non-Touch | |
| Dell XPS 13-9343 Touch | |
| Dell XPS 13-9343 Non-Touch | |
| Apple MB Air 13 2015-03 | |
| MS Surface Pro 4 | |
| MS Surface Book | |
| 3DMark 11 Performance | 1556 pontos | |
| 3DMark Ice Storm Standard Score | 52990 pontos | |
| 3DMark Cloud Gate Standard Score | 5896 pontos | |
| 3DMark Fire Strike Score | 847 pontos | |
Ajuda | ||
| Metro 2033 - 1360x768 Normal DX10 AA:A AF:4x (sort by value) | |
| Dell XPS 13-9350 Non-Touch | |
| Dell XPS 13-9343 Touch | |
| BioShock Infinite - 1366x768 Medium Preset (sort by value) | |
| Dell XPS 13-9350 Touch | |
| Dell XPS 13-9350 Non-Touch | |
| Dell XPS 13-9343 Touch | |
| Apple MB Air 13 2015-03 | |
| MS Surface Pro 4 | |
| MS Surface Book | |
| Tomb Raider - 1366x768 Normal Preset AA:FX AF:4x (sort by value) | |
| Dell XPS 13-9350 Touch | |
| Apple MB Air 13 2015-03 | |
| MS Surface Pro 4 | |
| MS Surface Book | |
| baixo | média | alto | ultra | |
| Tomb Raider (2013) | 71.8 | 36.6 | 24.4 | 11.2 |
| BioShock Infinite (2013) | 51.4 | 27.9 | 24.1 | 7.4 |
| Dirt Rally (2015) | 95 | 23.6 | 12.7 | |
| Metal Gear Solid V (2015) | 43.7 | 28.3 | 11.5 |
| Dell XPS 13-9350 Touch HD Graphics 520, 6500U, Samsung PM951 NVMe MZ-VLV256D | Dell XPS 13-9350 Non-Touch HD Graphics 520, 6200U, Samsung PM951 NVMe MZ-VLV256D | Dell XPS 13-9343 Touch HD Graphics 5500, 5200U, Lite-On IT L8T-256L9G | Dell XPS 13-9343 Non-Touch HD Graphics 5500, 5200U, Samsung SSD PM851 M.2 2280 128GB | Apple MB Air 13 2015-03 HD Graphics 6000, 5650U, Apple SSD SD0256F | MS Surface Pro 4 HD Graphics 520, 6300U, Samsung MZFLV128 NVMe | MS Surface Book Maxwell GPU (940M, GDDR5), 6300U, Samsung MZFLV256 NVMe | |
|---|---|---|---|---|---|---|---|
| Noise | 13% | -3% | 7% | -3% | -4% | 1% | |
| Idle Minimum * | 31.8 | 28.2 11% | 30.2 5% | 29 9% | 29.2 8% | 31.5 1% | 29.5 7% |
| Idle Average * | 31.8 | 28.3 11% | 30.3 5% | 29.1 8% | 29.2 8% | 31.5 1% | 29.6 7% |
| Idle Maximum * | 34.8 | 28.4 18% | 30.4 13% | 29.2 16% | 29.2 16% | 31.5 9% | 29.7 15% |
| Load Average * | 34.8 | 30.2 13% | 34.4 1% | 31.1 11% | 40.2 -16% | 40.5 -16% | 37.5 -8% |
| Load Maximum * | 34.8 | 30.2 13% | 48 -38% | 38.4 -10% | 46.3 -33% | 40.7 -17% | 40.9 -18% |
* ... smaller is better
Barulho
| Ocioso |
| 31.8 / 31.8 / 34.8 dB |
| Carga |
| 34.8 / 34.8 dB |
 | ||
30 dB silencioso 40 dB(A) audível 50 dB(A) ruidosamente alto |
||
min: | ||
| Dell XPS 13-9350 Touch HD Graphics 520, 6500U, Samsung PM951 NVMe MZ-VLV256D | Dell XPS 13-9350 Non-Touch HD Graphics 520, 6200U, Samsung PM951 NVMe MZ-VLV256D | Dell XPS 13-9343 Touch HD Graphics 5500, 5200U, Lite-On IT L8T-256L9G | Dell XPS 13-9343 Non-Touch HD Graphics 5500, 5200U, Samsung SSD PM851 M.2 2280 128GB | Apple MB Air 13 2015-03 HD Graphics 6000, 5650U, Apple SSD SD0256F | MS Surface Pro 4 HD Graphics 520, 6300U, Samsung MZFLV128 NVMe | MS Surface Book Maxwell GPU (940M, GDDR5), 6300U, Samsung MZFLV256 NVMe | |
|---|---|---|---|---|---|---|---|
| Heat | 15% | 19% | 19% | 20% | -4% | 26% | |
| Maximum Upper Side * | 57 | 45.2 21% | 40.6 29% | 44.6 22% | 43.8 23% | 52.3 8% | 44.2 22% |
| Maximum Bottom * | 56 | 45.2 19% | 41.2 26% | 44.8 20% | 42.1 25% | 51.4 8% | 41.2 26% |
| Idle Upper Side * | 34.1 | 30.4 11% | 31.2 9% | 28.8 16% | 28.5 16% | 43.2 -27% | 26 24% |
| Idle Bottom * | 34.3 | 31.2 9% | 30.6 11% | 28.8 16% | 28.9 16% | 36 -5% | 23.8 31% |
* ... smaller is better
(-) The maximum temperature on the upper side is 57 °C / 135 F, compared to the average of 35.9 °C / 97 F, ranging from 21.4 to 59 °C for the class Subnotebook.
(-) The bottom heats up to a maximum of 56 °C / 133 F, compared to the average of 39.4 °C / 103 F
(+) In idle usage, the average temperature for the upper side is 29.9 °C / 86 F, compared to the device average of 30.7 °C / 87 F.
(±) The palmrests and touchpad can get very hot to the touch with a maximum of 37.5 °C / 99.5 F.
(-) The average temperature of the palmrest area of similar devices was 28.3 °C / 82.9 F (-9.2 °C / -16.6 F).
| Dell XPS 13-9350 Touch 6500U | Dell XPS 13-9350 Non-Touch 6200U | Dell XPS 13-9343 Touch 5500U | Dell XPS 13-9343 Non-Touch 5200U | |
|---|---|---|---|---|
| Power Consumption | -0% | 26% | 24% | |
| Idle Minimum * | 6.8 | 6.6 3% | 2.7 60% | 4.4 35% |
| Idle Average * | 10 | 9.3 7% | 5.7 43% | 9 10% |
| Idle Maximum * | 10.5 | 11 -5% | 6 43% | 10.7 -2% |
| Load Average * | 30.2 | 32.2 -7% | 32.1 -6% | 19.6 35% |
| Load Maximum * | 33.6 | 33.2 1% | 36.2 -8% | 19.9 41% |
* ... smaller is better
| desligado | |
| Ocioso | |
| Carga |
|
| Dell XPS 13-9350 Touch 6500U 56Wh | Dell XPS 13-9350 Non-Touch 6200U 56Wh | Dell XPS 13-9343 Touch 5200U 52Wh | Dell XPS 13-9343 Non-Touch 5200U 54Wh | Apple MB Air 13 2015-03 5650U 54Wh | MS Surface Pro 4 6300U 38Wh | MS Surface Book 6300U 69Wh | |
|---|---|---|---|---|---|---|---|
| Battery Runtime | 17% | 26% | 48% | 46% | 7% | 26% | |
| Reader / Idle | 784 | 782 0% | 912 16% | 1295 65% | 1572 101% | 899 15% | 1070 36% |
| WiFi v1.3 | 432 | 451 4% | 598 38% | 620 44% | 427 -1% | 402 -7% | |
| Load | 103 | 150 46% | 140 36% | 145 41% | 97 -6% | 111 8% | 153 49% |
| WiFi | 580 | ||||||
| H.264 | 604 |
Pro
Contra
Há muitos aparelhos para escolher: Será que devo optar pelo elegante XPS 13 Ultrabook com o marco fino, ou o tablet Surface Pro 4? Ou simplesmente: XPS 13 FHD vs. XPS 13 QHD? A decisão não depende do poder de computação; tanto o XPS quanto o Surface se desempenham no mesmo alto nível sem afogamentos. A diferença do desempenho com a versão Core i5 mais econômica, pode ser deixada de lado, em nossa opinião.
A duração mais curta da versão XPS 13 i7/QHD em comparação com o modelo irmão i5/FHD e a comparação no mercado, falam em contra disso. 5:30 horas é simplesmente muito pouco para um Ultrabook da gama premium. Detalhes como o controle do brilho ambiente, utilizados pela PWM, as pobres opções de manutenção, e a pobre webcam, certamente merecem críticas. Vamos manter nossos leitores atualizados com informações sobre o Content Adaptive Brightness Control (CABC) aqui.
Muito argumentos falam pelo XPS 13 - incluindo a versão i5 - como os listados nos Pros. O chassi de alta qualidade com o fino marco é mencionado lá, assim como o relativamente bom desempenho sob carga, o ruído ainda baixo, e o painel de alto contraste com uma resolução alta. O comprador potencial terá que decidir si isso é ou não indispensável. O manuseio mediante touch também funciona de forma impecável, o o mesmo acontece com as teclas e o ClickPad.
Por 1549 Euros (~$1653, bruto, sem custo de envio, e/ou lojas), o cliente recebe um subportátil sofisticado, que deve ser um dos melhores. O modelo antigo de 2015 com um i7-5500U e SSD de 256 GB ainda é forte no mercado, e está a partir de1500 Euros (~$1601). Embora a nova versão não tenha um processador/placa de vídeo extremamente mais veloz, tem Thunderbolt 3 em USB Tipo C combinado com USB 3.1 Gen 2. Por isso, não há muito como defender a compra do modelo antigo de 2015; o usuário estará mais preparado para o futuro com aas novas opções de docking via Thunderbolt 3.
Esta é uma versão reduzida da análise original. Você pode ler a análise completa em inglês aqui.
Dell XPS 13 2016 i7 256GB QHD
-
02/16/2016 v5(old)
Sebastian Jentsch