 Deutsch
 English
 Español
 Français
 Italiano
 Nederlands
 Polski
 Português
 Русский
 Türkçe
 Svenska
 Chinese
 Magyar
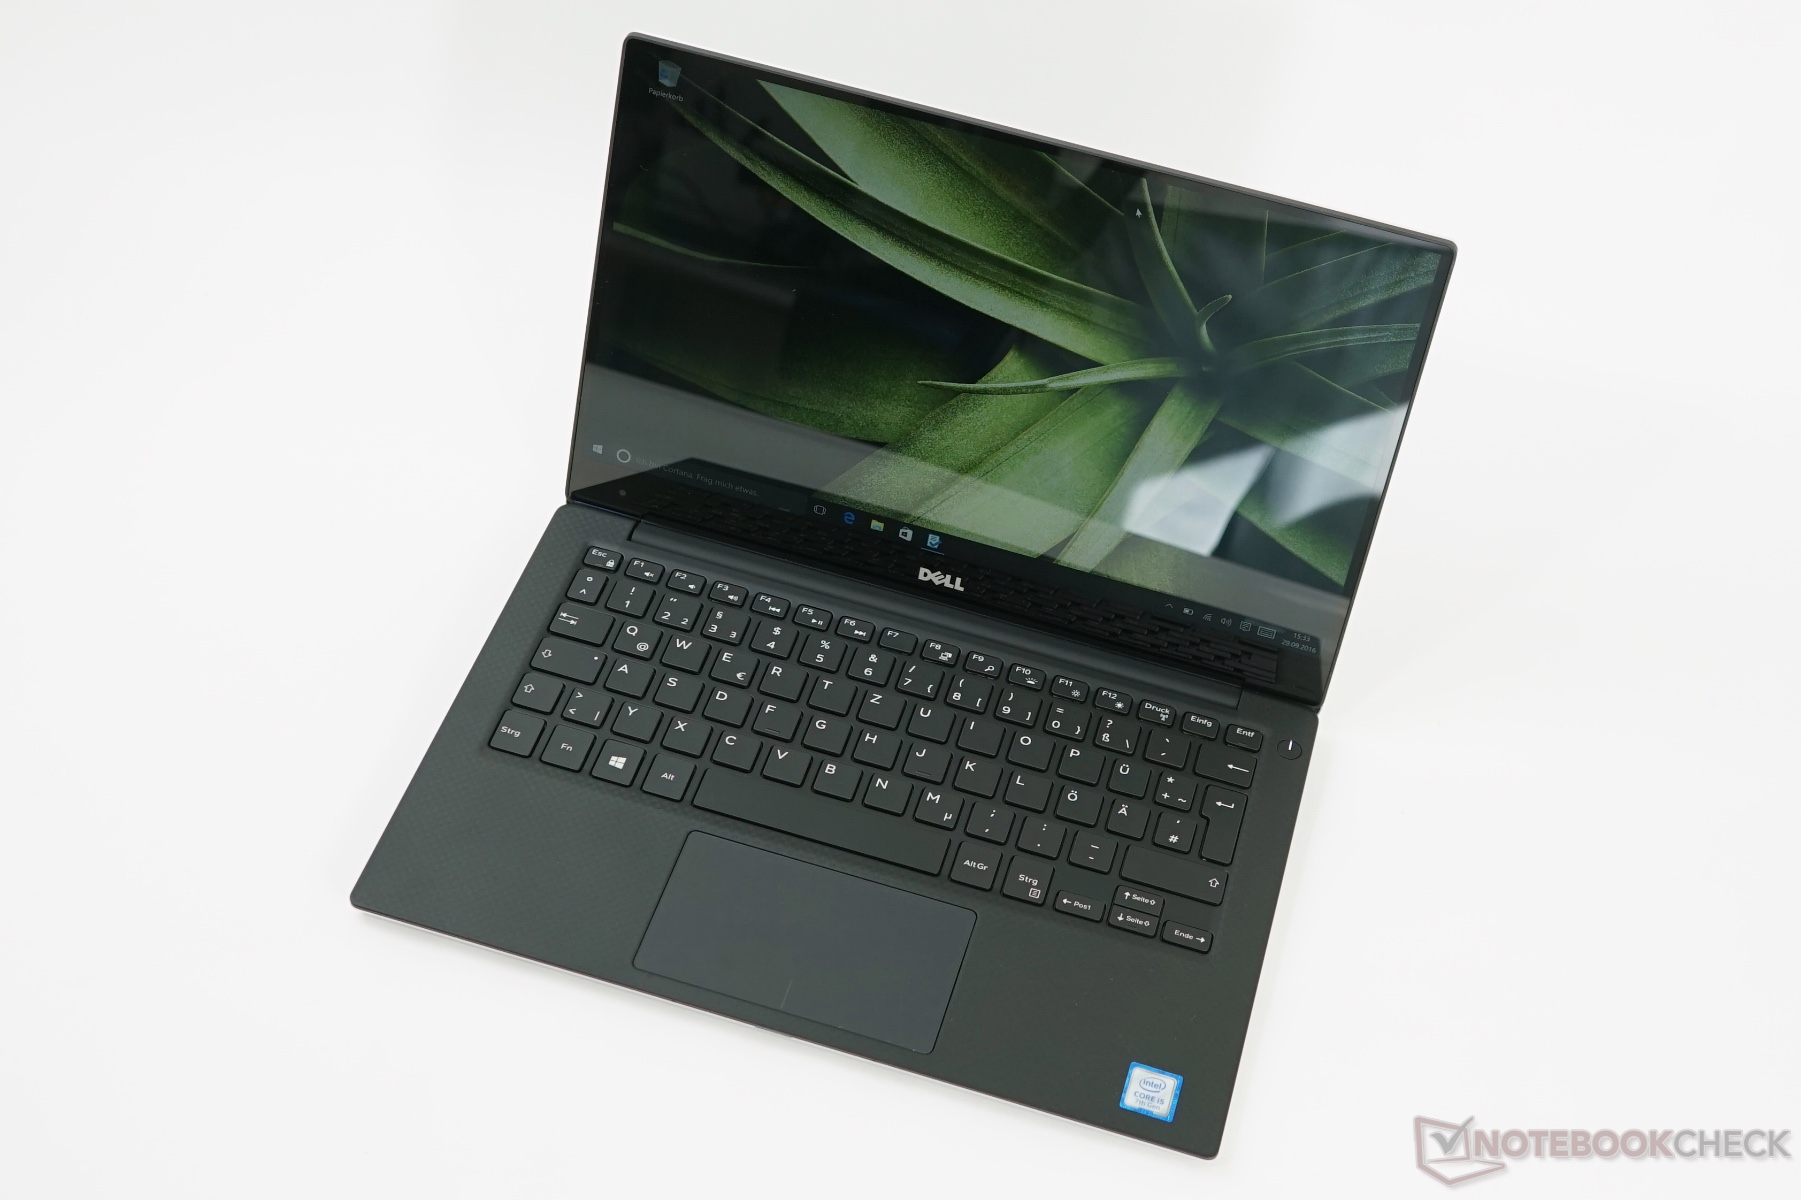
Breve Análise do Portátil Dell XPS 13 9360 (FHD, i7, Iris)
| SD Card Reader | |
| average JPG Copy Test (av. of 3 runs) | |
| Dell XPS 13 9360 FHD i7 Iris | |
| Dell XPS 15 9560 (i7-7700HQ, UHD) | |
| HP Envy 13-ad065nr | |
| maximum AS SSD Seq Read Test (1GB) | |
| Dell XPS 15 9560 (i7-7700HQ, UHD) | |
| Dell XPS 13 9360 FHD i7 Iris | |
| HP Envy 13-ad065nr | |
| Networking | |
| iperf3 transmit AX12 | |
| Huawei MateBook X | |
| Dell XPS 13 9360 FHD i7 Iris | |
| Apple MacBook Pro 13 2017 | |
| HP Envy 13-ad065nr | |
| iperf3 receive AX12 | |
| Apple MacBook Pro 13 2017 | |
| HP Envy 13-ad065nr | |
| Dell XPS 13 9360 FHD i7 Iris | |
| Huawei MateBook X | |
Screen Flickering / PWM (Pulse-Width Modulation)
| Screen flickering / PWM detected | 19530 Hz | ≤ 80 % brightness setting | 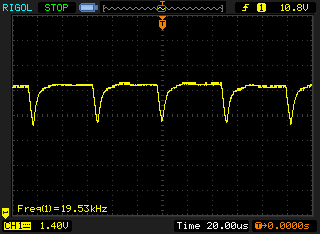 |
The display backlight flickers at 19530 Hz (worst case, e.g., utilizing PWM) Flickering detected at a brightness setting of 80 % and below. There should be no flickering or PWM above this brightness setting. The frequency of 19530 Hz is quite high, so most users sensitive to PWM should not notice any flickering. In comparison: 53 % of all tested devices do not use PWM to dim the display. If PWM was detected, an average of 17900 (minimum: 5 - maximum: 3846000) Hz was measured. | |||
| |||||||||||||||||||||||||
iluminação: 85 %
iluminação com acumulador: 461 cd/m²
Contraste: 2305:1 (Preto: 0.2 cd/m²)
ΔE Color 5.4 | 0.5-29.43 Ø5
ΔE Greyscale 5.4 | 0.57-98 Ø5.3
76.9% sRGB (Argyll 1.6.3 3D)
48.6% AdobeRGB 1998 (Argyll 1.6.3 3D)
53.3% AdobeRGB 1998 (Argyll 2.2.0 3D)
77.4% sRGB (Argyll 2.2.0 3D)
51.6% Display P3 (Argyll 2.2.0 3D)
Gamma: 2.15
| Dell XPS 13 9360 FHD i7 Iris SHP1449, , 1920x1080, 13.30 | Dell XPS 13 i7-8550U ID: Sharp SHP144A, Name: LQ133Z1, , 3200x1800, 13.30 | Apple MacBook Pro 13 2017 APPA033, , 2560x1600, 13.30 | Razer Blade Stealth QHD i7-7500U Sharp SHP1493 (LQ133Z1JW26), , 3200x1800, 13.30 | Huawei MateBook X Chi Mei CMN8201 / P130ZDZ-EF1, , 2160x1440, 13.30 | HP Envy 13-ad065nr LG Philips LGD0576, , 1920x1080, 13.30 | |
|---|---|---|---|---|---|---|
| Display | 22% | 61% | 26% | 26% | 17% | |
| Display P3 Coverage | 51.6 | 63.6 23% | 99.2 92% | 65.6 27% | 65.8 28% | 65.5 27% |
| sRGB Coverage | 77.4 | 93 20% | 99.9 29% | 95.5 23% | 96.2 24% | 83.8 8% |
| AdobeRGB 1998 Coverage | 53.3 | 65.4 23% | 87.1 63% | 67.6 27% | 66.8 25% | 61.3 15% |
| Response Times | 8% | 0% | -6% | 20% | 3% | |
| Response Time Grey 50% / Grey 80% * | 41.2 ? | 35.6 ? 14% | 42.8 ? -4% | 46 ? -12% | 33 ? 20% | 28 ? 32% |
| Response Time Black / White * | 30 ? | 27.2 ? 9% | 28.8 ? 4% | 31.2 ? -4% | 24 ? 20% | 22.4 ? 25% |
| PWM Frequency | 19530 ? | 19690 ? 1% | 19380 ? -1% | 10200 ? -48% | ||
| Screen | -5% | 20% | 3% | 7% | -11% | |
| Brightness middle | 461 | 386.1 -16% | 588 28% | 406 -12% | 408 -11% | 290 -37% |
| Brightness | 418 | 357 -15% | 561 34% | 373 -11% | 395 -6% | 270 -35% |
| Brightness Distribution | 85 | 83 -2% | 92 8% | 84 -1% | 88 4% | 78 -8% |
| Black Level * | 0.2 | 0.33 -65% | 0.45 -125% | 0.25 -25% | 0.45 -125% | 0.32 -60% |
| Contrast | 2305 | 1170 -49% | 1307 -43% | 1624 -30% | 907 -61% | 906 -61% |
| Colorchecker dE 2000 * | 5.4 | 4.2 22% | 1.7 69% | 4.5 17% | 1.55 71% | 4.8 11% |
| Colorchecker dE 2000 max. * | 12.2 | 7.6 38% | 3.5 71% | 8.2 33% | 2.19 82% | 11.2 8% |
| Greyscale dE 2000 * | 5.4 | 5.7 -6% | 1.9 65% | 5.2 4% | 1.91 65% | 2.8 48% |
| Gamma | 2.15 102% | 2.28 96% | 2.33 94% | 2.11 104% | 2.34 94% | 2.19 100% |
| CCT | 7258 90% | 7336 89% | 6738 96% | 7709 84% | 6491 100% | 6382 102% |
| Color Space (Percent of AdobeRGB 1998) | 48.6 | 59 21% | 77.92 60% | 61.3 26% | 61 26% | 54.9 13% |
| Color Space (Percent of sRGB) | 76.9 | 92.2 20% | 99.94 30% | 95.4 24% | 96 25% | 83.5 9% |
| Total Average (Program / Settings) | 8% /
2% | 27% /
25% | 8% /
5% | 18% /
12% | 3% /
-3% |
* ... smaller is better
Display Response Times
| ↔ Response Time Black to White | ||
|---|---|---|
| 30 ms ... rise ↗ and fall ↘ combined | ↗ 17.6 ms rise | 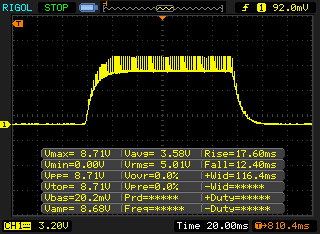 |
| ↘ 12.4 ms fall | ||
| The screen shows slow response rates in our tests and will be unsatisfactory for gamers. In comparison, all tested devices range from 0.1 (minimum) to 240 (maximum) ms. » 77 % of all devices are better. This means that the measured response time is worse than the average of all tested devices (21.5 ms). | ||
| ↔ Response Time 50% Grey to 80% Grey | ||
| 41.2 ms ... rise ↗ and fall ↘ combined | ↗ 22.8 ms rise | 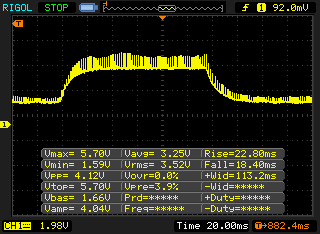 |
| ↘ 18.4 ms fall | ||
| The screen shows slow response rates in our tests and will be unsatisfactory for gamers. In comparison, all tested devices range from 0.2 (minimum) to 636 (maximum) ms. » 62 % of all devices are better. This means that the measured response time is worse than the average of all tested devices (33.7 ms). | ||
| PCMark 8 Home Score Accelerated v2 | 3902 pontos | |
| PCMark 8 Creative Score Accelerated v2 | 5083 pontos | |
| PCMark 8 Work Score Accelerated v2 | 4890 pontos | |
Ajuda | ||
| Dell XPS 13 9360 FHD i7 Iris Toshiba XG4 NVMe (THNSN5512GPUK) | Dell XPS 13 i7-8550U Toshiba XG5 KXG50ZNV256G | Huawei MateBook X LITEON CB1-SD256 | Lenovo Yoga 920-13IKB-80Y7 Samsung PM961 MZVLW256HEHP | |
|---|---|---|---|---|
| CrystalDiskMark 5.2 / 6 | -28% | -35% | 28% | |
| Write 4K | 131.9 | 121.5 -8% | 68.1 -48% | 142.1 8% |
| Read 4K | 46.72 | 24.92 -47% | 28.95 -38% | 44.19 -5% |
| Write Seq | 1036 | 345 -67% | 529 -49% | 1112 7% |
| Read Seq | 1352 | 1313 -3% | 711 -47% | 1884 39% |
| Write 4K Q32T1 | 487.7 | 346.1 -29% | 306.4 -37% | 747 53% |
| Read 4K Q32T1 | 443.9 | 389.4 -12% | 501 13% | 446.8 1% |
| Write Seq Q32T1 | 1048 | 334.7 -68% | 496.9 -53% | 1255 20% |
| Read Seq Q32T1 | 1699 | 1840 8% | 1297 -24% | 3400 100% |

| 3DMark 11 Performance | 2275 pontos | |
| 3DMark Cloud Gate Standard Score | 7685 pontos | |
| 3DMark Fire Strike Score | 1265 pontos | |
| 3DMark Fire Strike Extreme Score | 577 pontos | |
| 3DMark Time Spy Score | 467 pontos | |
Ajuda | ||
| Tomb Raider | |
| 1920x1080 Ultra Preset AA:FX AF:16x | |
| Apple MacBook Pro 13 2017 | |
| Dell XPS 13 9360 FHD i7 Iris | |
| Dell XPS 13 9360 FHD i5 | |
| 1366x768 High Preset AA:FX AF:8x | |
| Apple MacBook Pro 13 2017 | |
| Dell XPS 13 9360 FHD i7 Iris | |
| Dell XPS 13 9360 FHD i5 | |
| 1366x768 Normal Preset AA:FX AF:4x | |
| Apple MacBook Pro 13 2017 | |
| Dell XPS 13 9360 FHD i7 Iris | |
| Dell XPS 13 9360 FHD i5 | |
| 1024x768 Low Preset | |
| Apple MacBook Pro 13 2017 | |
| Dell XPS 13 9360 FHD i7 Iris | |
| Dell XPS 13 9360 FHD i5 | |
| Overwatch | |
| 1920x1080 Epic (Render Scale 100 %) AA:SM AF:16x | |
| Apple MacBook Pro 13 2017 | |
| 1920x1080 High (Render Scale 100 %) AA:SM AF:4x | |
| Apple MacBook Pro 13 2017 | |
| Dell XPS 13 9360 FHD i7 Iris | |
| Dell XPS 13 9360 QHD+ i7 | |
| Dell XPS 13 i7-8550U | |
| Acer Spin 5 SP513-52N-566U | |
| 1366x768 Medium (Render Scale 100 %) AA:FX AF:2x | |
| Apple MacBook Pro 13 2017 | |
| Dell XPS 13 9360 FHD i7 Iris | |
| Dell XPS 13 9360 QHD+ i7 | |
| Dell XPS 13 i7-8550U | |
| Acer Spin 5 SP513-52N-566U | |
| HP Envy 13-ad065nr | |
| 1280x720 Low (Render Scale 100 %) AA:FX AF:1x | |
| Apple MacBook Pro 13 2017 | |
| Dell XPS 13 9360 FHD i7 Iris | |
| Dell XPS 13 9360 QHD+ i7 | |
| Dell XPS 13 i7-8550U | |
| Acer Spin 5 SP513-52N-566U | |
| HP Envy 13-ad065nr | |
| Rocket League | |
| 1920x1080 High Quality AA:High FX | |
| Apple MacBook Pro 13 2017 | |
| Dell XPS 13 9360 FHD i7 Iris | |
| 1920x1080 Quality AA:Medium FX | |
| Apple MacBook Pro 13 2017 | |
| Dell XPS 13 9360 FHD i7 Iris | |
| Acer Spin 5 SP513-52N-566U | |
| 1280x720 Performance | |
| Apple MacBook Pro 13 2017 | |
| Acer Spin 5 SP513-52N-566U | |
| Dell XPS 13 9360 FHD i7 Iris | |
| baixo | média | alto | ultra | |
| Tomb Raider (2013) | 103 | 54.1 | 37 | 17.2 |
| BioShock Infinite (2013) | 61 | 40.2 | 33.5 | 10.7 |
| Battlefield 4 (2013) | 43.1 | 29.7 | 23.2 | 8.2 |
| The Witcher 3 (2015) | 17.5 | |||
| Rainbow Six Siege (2015) | 50.5 | 29 | 16.4 | |
| Overwatch (2016) | 56.1 | 36.5 | 29.9 | |
| Rocket League (2017) | 69.3 | 35.8 | 25.3 | |
| F1 2017 (2017) | 33 | 15 |
Barulho
| Ocioso |
| 29.9 / 29.9 / 30.3 dB |
| Carga |
| 33.9 / 34.9 dB |
 | ||
30 dB silencioso 40 dB(A) audível 50 dB(A) ruidosamente alto |
||
min: | ||
(-) The maximum temperature on the upper side is 46.2 °C / 115 F, compared to the average of 35.9 °C / 97 F, ranging from 21.4 to 59 °C for the class Subnotebook.
(-) The bottom heats up to a maximum of 48.8 °C / 120 F, compared to the average of 39.4 °C / 103 F
(+) In idle usage, the average temperature for the upper side is 26.7 °C / 80 F, compared to the device average of 30.7 °C / 87 F.
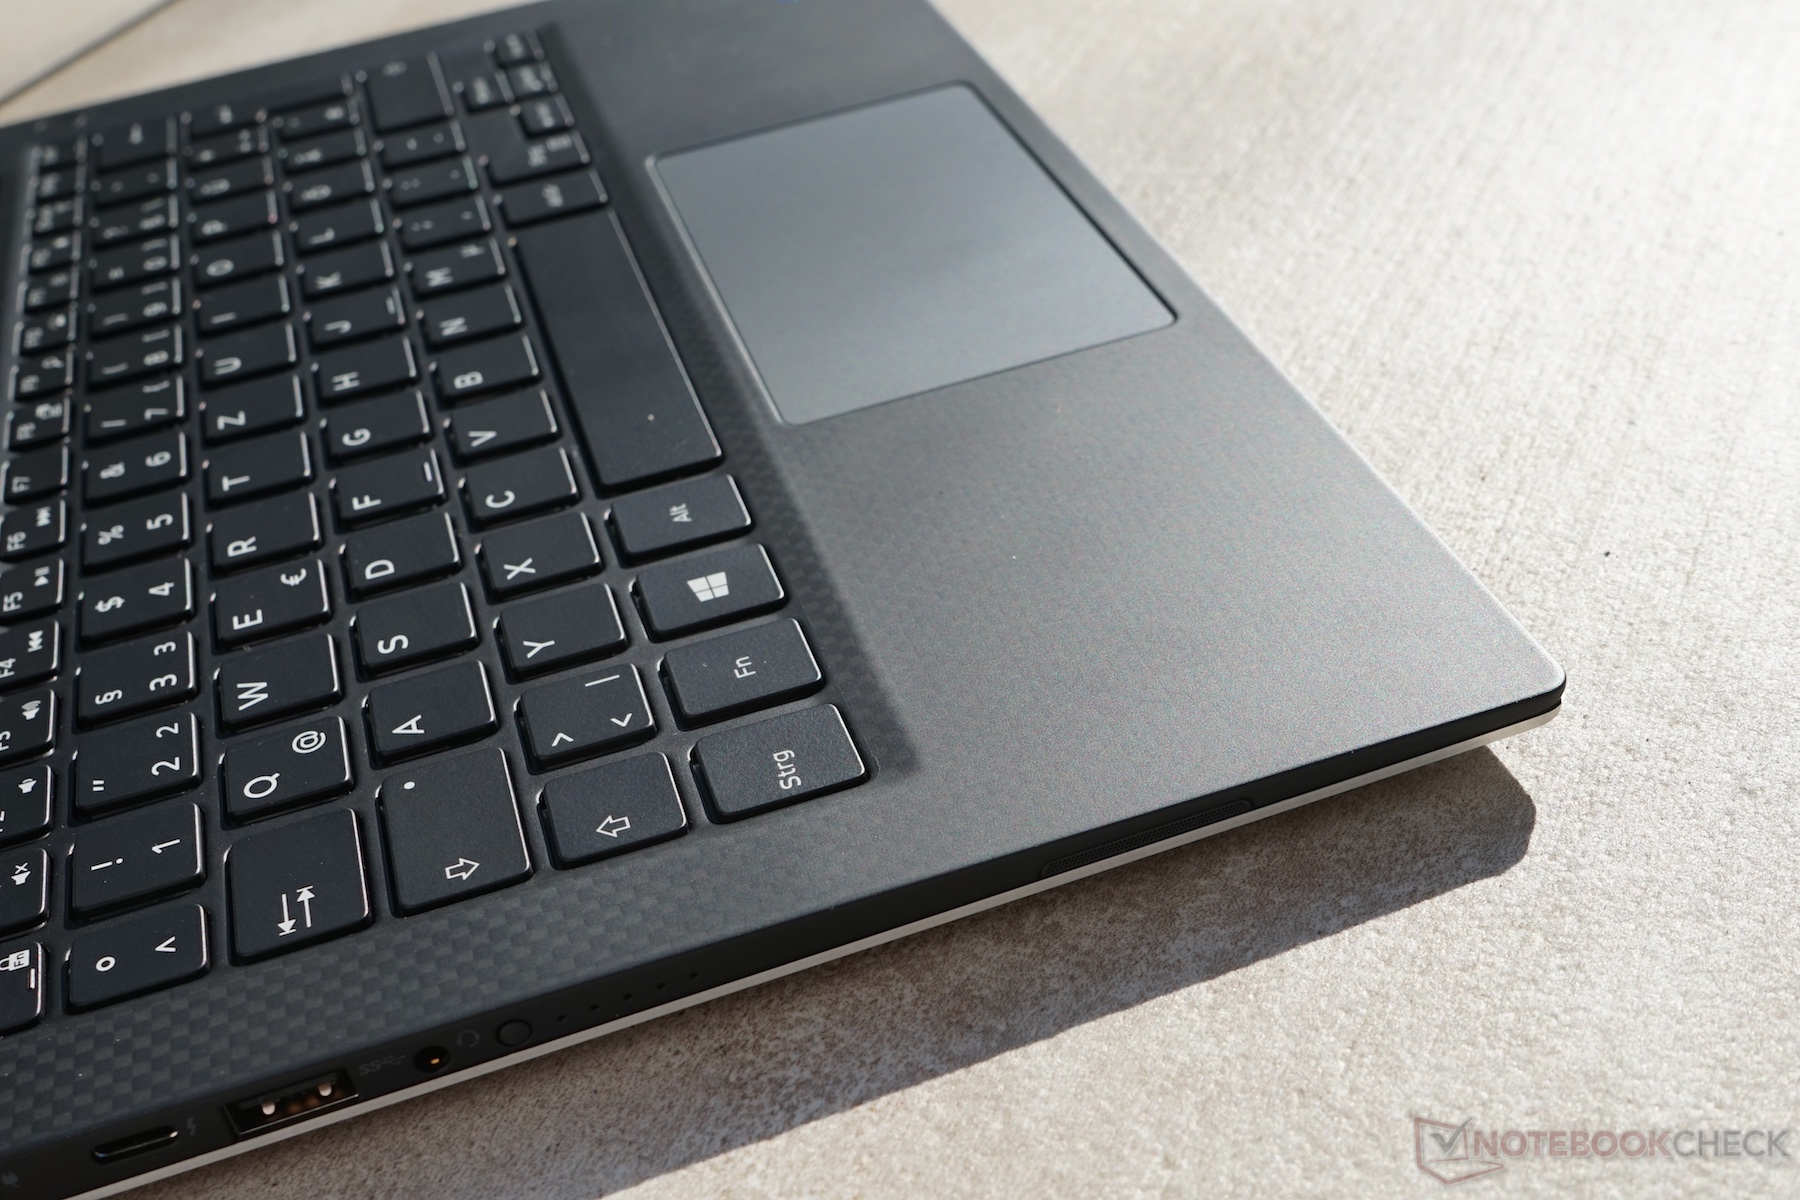
(+) The palmrests and touchpad are reaching skin temperature as a maximum (33.6 °C / 92.5 F) and are therefore not hot.
(-) The average temperature of the palmrest area of similar devices was 28.3 °C / 82.9 F (-5.3 °C / -9.6 F).
| desligado | |
| Ocioso | |
| Carga |
|
| Dell XPS 13 9360 FHD i7 Iris i7-7560U, Iris Plus Graphics 640, IPS, 1920x1080, 13.30 | Dell XPS 13 i7-8550U i5-8550U, UHD Graphics 620, IGZO IPS, 3200x1800, 13.30 | Dell XPS 13 9360 FHD i5 i5-7200U, HD Graphics 620, IPS, 1920x1080, 13.30 | Dell XPS 13 9360 QHD+ i7 i7-7500U, HD Graphics 620, IPS, 3200x1800, 13.30 | Huawei MateBook X i5-7200U, HD Graphics 620, , 2160x1440, 13.30 | HP Envy 13-ad065nr i5-7200U, HD Graphics 620, IPS, 1920x1080, 13.30 | Apple MacBook Pro 13 2017 i5-7360U, Iris Plus Graphics 640, IPS, 2560x1600, 13.30 | |
|---|---|---|---|---|---|---|---|
| Power Consumption | -10% | 17% | -17% | -47% | 8% | -14% | |
| Idle Minimum * | 3.32 | 4.1 -23% | 4.1 -23% | 6.4 -93% | 4.6 -39% | 2.8 16% | 3.7 -11% |
| Idle Average * | 5.27 | 5.8 -10% | 4.2 20% | 6.6 -25% | 11 -109% | 5.8 -10% | 5.2 1% |
| Idle Maximum * | 6.32 | 6 5% | 5.1 19% | 6.8 -8% | 12 -90% | 6.4 -1% | 7.6 -20% |
| Load Average * | 32 | 42.5 -33% | 22.1 31% | 27.5 14% | 39.5 -23% | 31.3 2% | 41.6 -30% |
| Load Maximum * | 45.9 | 41.4 10% | 29.4 36% | 32.4 29% | 34.6 25% | 31.7 31% | 50.5 -10% |
* ... smaller is better
| Dell XPS 13 9360 FHD i7 Iris i7-7560U, Iris Plus Graphics 640, 60 Wh | Dell XPS 13 i7-8550U i5-8550U, UHD Graphics 620, 60 Wh | Razer Blade Stealth QHD i7-7500U i7-7500U, HD Graphics 620, 53.6 Wh | Huawei MateBook X i5-7200U, HD Graphics 620, 40 Wh | HP Envy 13-ad065nr i5-7200U, HD Graphics 620, 53.6 Wh | Dell XPS 13 9360 FHD i5 i5-7200U, HD Graphics 620, 60 Wh | Dell XPS 13 9360 QHD+ i7 i7-7500U, HD Graphics 620, 60 Wh | Apple MacBook Pro 13 2017 i5-7360U, Iris Plus Graphics 640, 54.5 Wh | |
|---|---|---|---|---|---|---|---|---|
| Battery Runtime | -15% | -41% | -37% | -11% | -3% | -23% | -23% | |
| Reader / Idle | 1521 | 1108 -27% | 512 -66% | 1487 -2% | 1295 -15% | 1053 -31% | ||
| H.264 | 899 | 683 -24% | ||||||
| WiFi v1.3 | 655 | 589 -10% | 386 -41% | 337 -49% | 570 -13% | 677 3% | 516 -21% | 681 4% |
| Load | 154 | 143 -7% | 162 5% | 127 -18% | 157 2% | 129 -16% | 78 -49% |
Pro
Contra
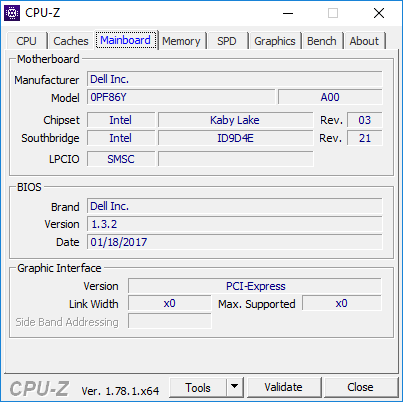
Os potenciais compradores do Dell XPS 13 estão enfrentando uma decisão interessante agora. Os novos processadores Kaby Lake-R oferecem muito mais desempenho da CPU, enquanto a GPU Iris em combinação com as "antigas" CPUs Kaby Lake promete mais desempenho. Pelo menos em teoria, porque a decisão é realmente muito fácil após a análise.
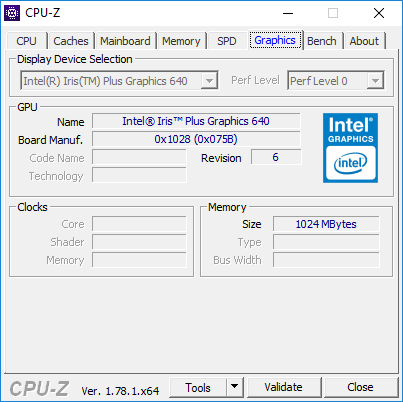
O novo quad-core ULV é superior aos núcleos duplos antigos se você pode utilizar os núcleos/threads adicionais. O desempenho da GPU também é um pouco mais alto. Outro fator decisivo é a utilização limitada do desempenho do i7-7560U no XPS 13. Não resta muito das vantagens de desempenho devido à limitação usual em 15 W. Nossa recomendação é, portanto, fácil: Se você planeja comprar o XPS 13, escolha-o com um dos novos chips Kaby Lake-R.
O Kaby Lake em combinação com a GPU Iris mais poderosa não faz muito sentido para o XPS 13, porque você não pode utilizar todo o seu potencial. Os novos processadores de 8va geração (Atualização Kaby Lake) são superiores em termos de desempenho da CPU e a GPU também não é significativamente mais lenta.
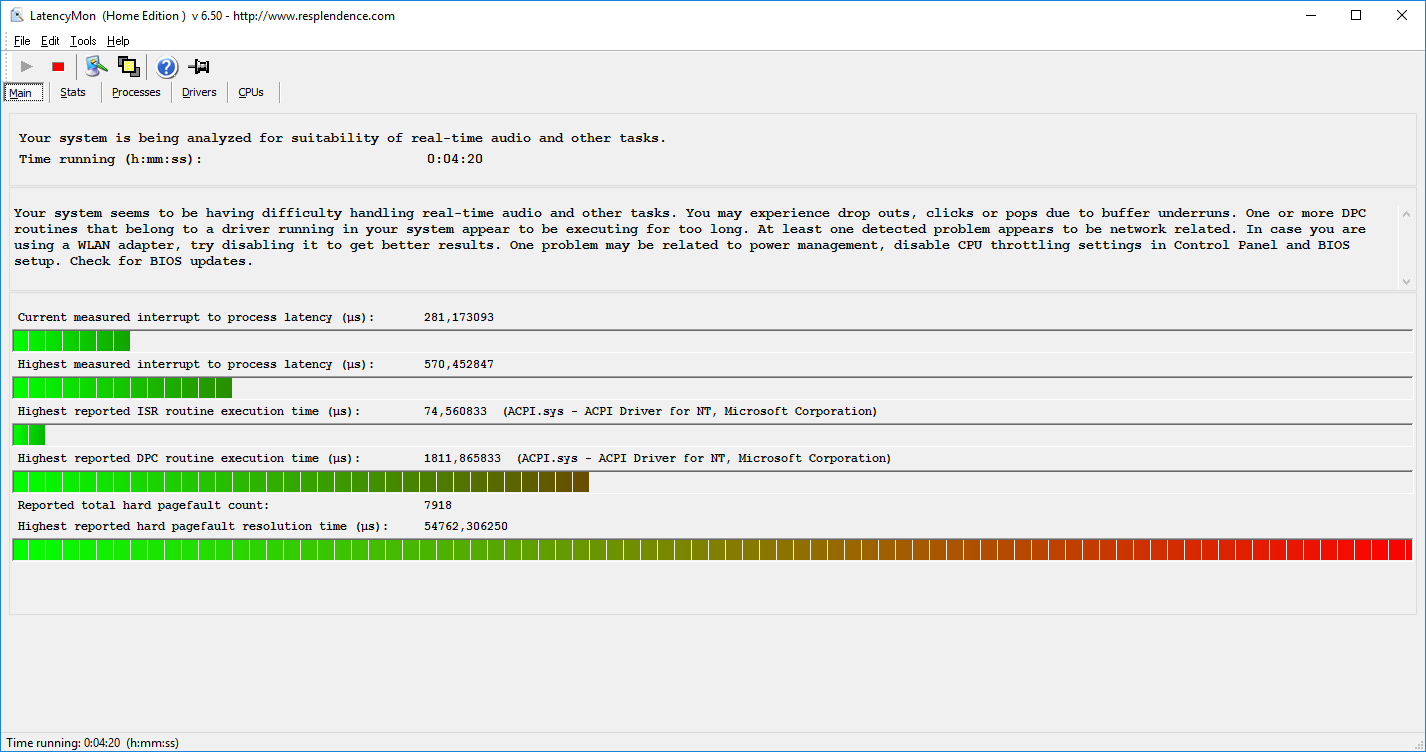
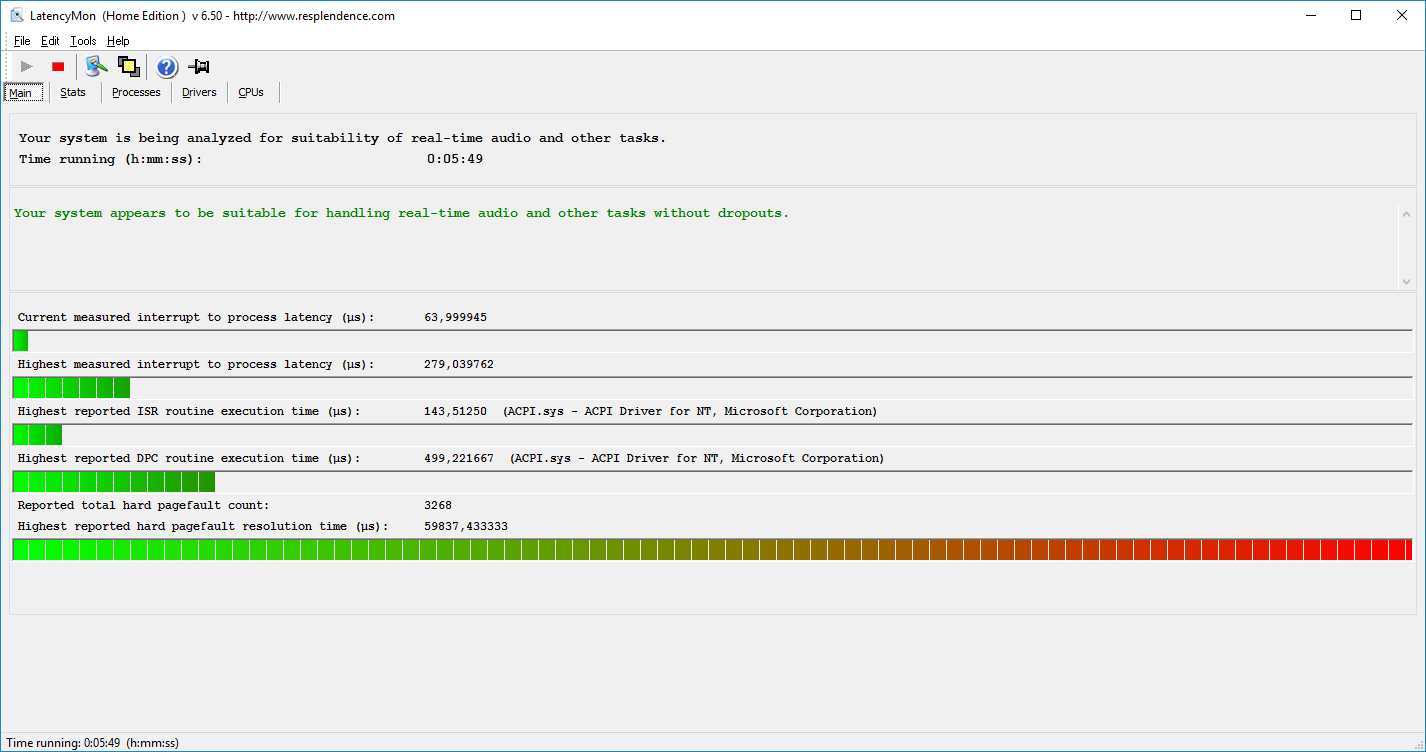
Caso contrário, não há muito a dizer sobre o XPS 13. Infelizmente, a Dell ainda não resolveu os problemas com a bobina barulhenta, e é mais perturbadora nesta unidade em particular.
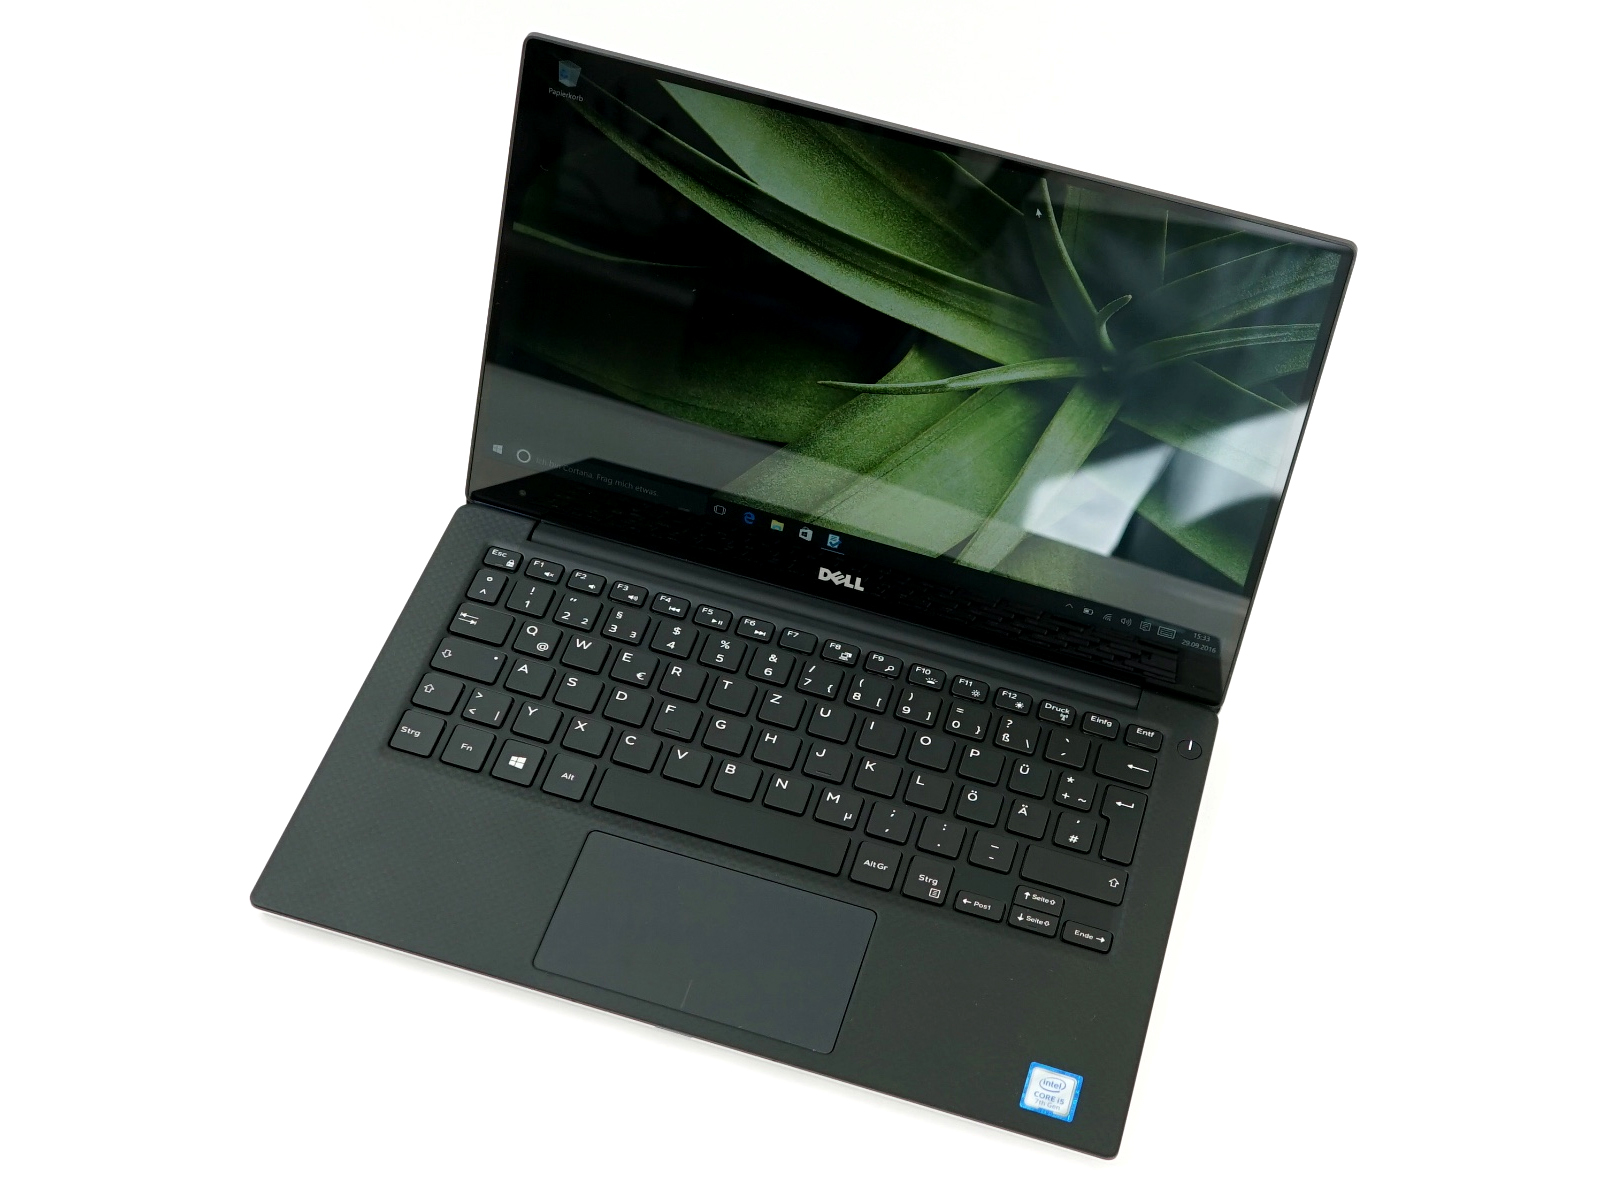
Dell XPS 13 9360 FHD i7 Iris
-
11/06/2017 v6(old)
Andreas Osthoff
Pricecompare
