 Deutsch
 English
 Español
 Français
 Italiano
 Nederlands
 Polski
 Português
 Русский
 Türkçe
 Svenska
 Chinese
 Magyar
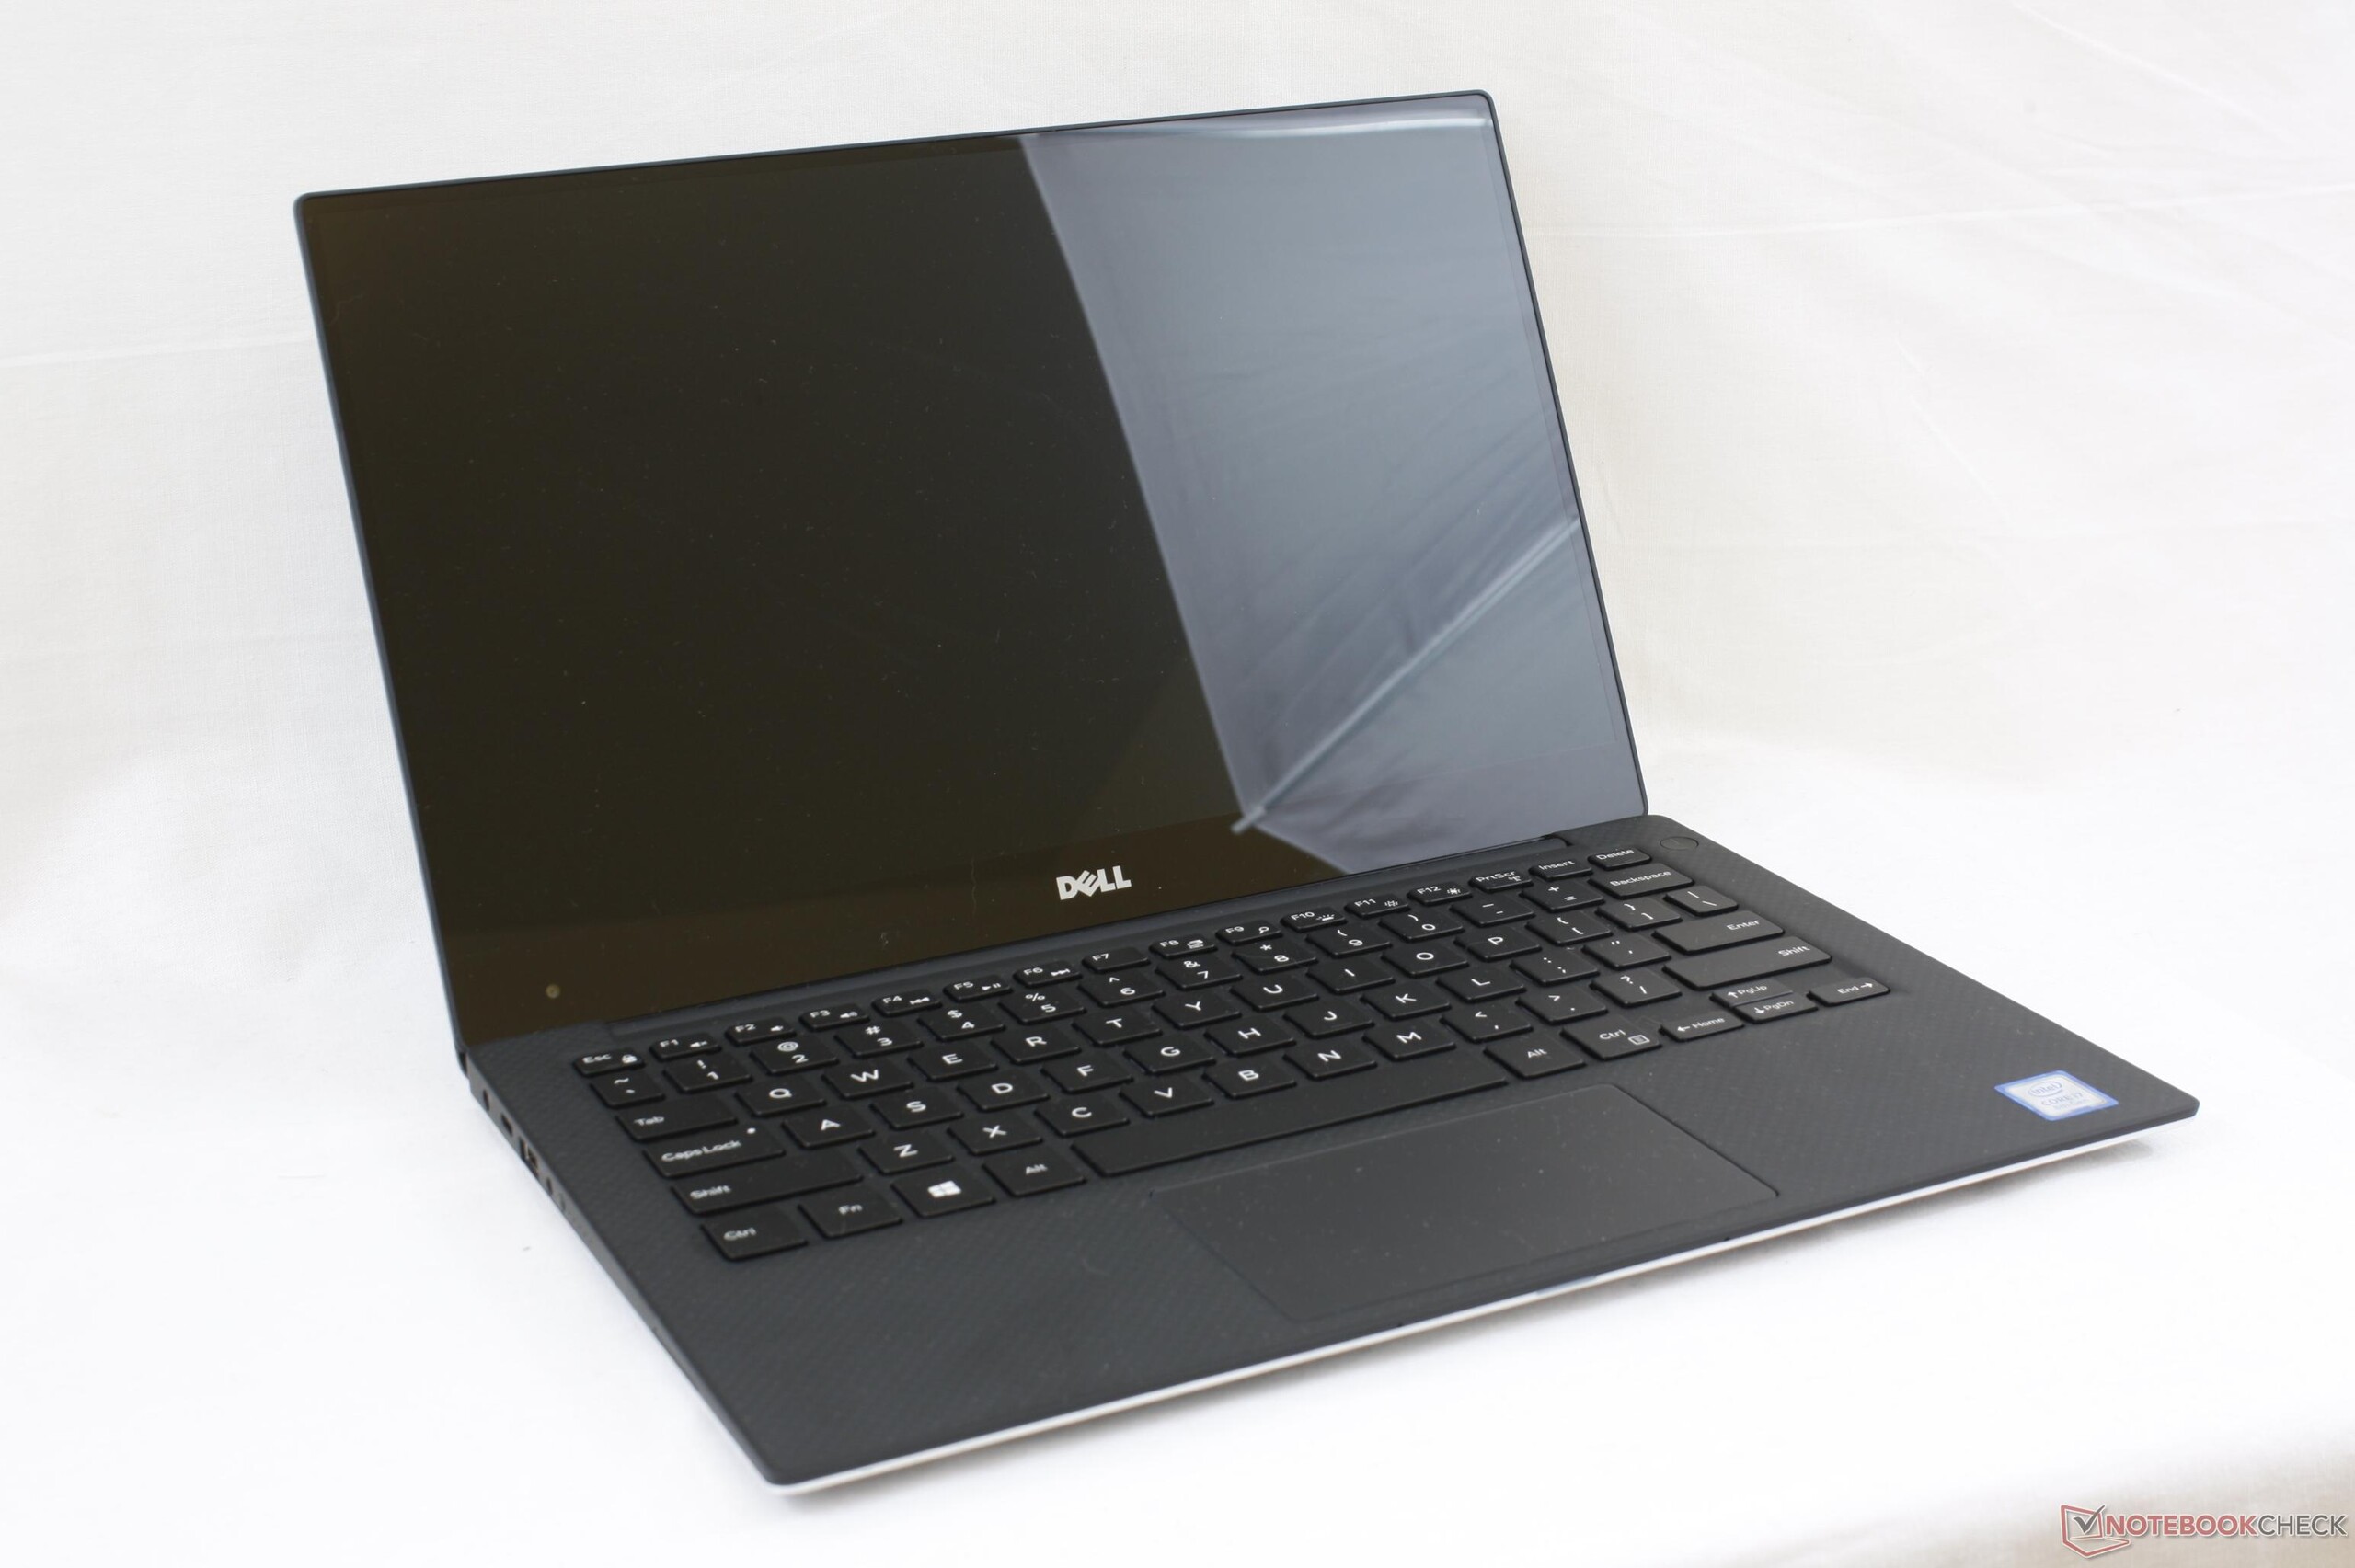
Breve Análise do Portátil Dell XPS 13 (i7-8550U, QHD)
| SD Card Reader | |
| average JPG Copy Test (av. of 3 runs) | |
| Dell XPS 13 i7-8550U | |
| Dell XPS 15 9560 (i7-7700HQ, UHD) | |
| Acer Swift 3 SF315-51G-57E5 | |
| maximum AS SSD Seq Read Test (1GB) | |
| Dell XPS 15 9560 (i7-7700HQ, UHD) | |
| Dell XPS 13 i7-8550U | |
| Acer Swift 3 SF315-51G-57E5 | |
| Networking | |
| iperf3 transmit AX12 | |
| Dell XPS 13 i7-8550U | |
| Samsung Notebook 9 NP900X3N-K01US | |
| HP Spectre x360 13-ac033dx | |
| iperf3 receive AX12 | |
| Samsung Notebook 9 NP900X3N-K01US | |
| HP Spectre x360 13-ac033dx | |
| Dell XPS 13 i7-8550U | |
| |||||||||||||||||||||||||
iluminação: 83 %
iluminação com acumulador: 386.1 cd/m²
Contraste: 1170:1 (Preto: 0.33 cd/m²)
ΔE Color 4.2 | 0.5-29.43 Ø5
ΔE Greyscale 5.7 | 0.57-98 Ø5.3
92.2% sRGB (Argyll 1.6.3 3D)
59% AdobeRGB 1998 (Argyll 1.6.3 3D)
65.4% AdobeRGB 1998 (Argyll 2.2.0 3D)
93% sRGB (Argyll 2.2.0 3D)
63.6% Display P3 (Argyll 2.2.0 3D)
Gamma: 2.28
| Dell XPS 13 i7-8550U ID: Sharp SHP144A, Name: LQ133Z1, IGZO IPS, 13.30, 3200x1800 | Samsung Notebook 9 NP900X3N-K01US ID: BOE06E1, Name: NV133FHB-N31, IPS, 13.30, 1920x1080 | Huawei MateBook X Chi Mei CMN8201 / P130ZDZ-EF1, , 13.30, 2160x1440 | Asus ZenBook Flip S UX370 AUO B133HAN04.2, a-Si TFT-LCD, WLED, 13.30, 1920x1080 | Razer Blade Stealth QHD i7-7500U Sharp SHP142F (LQ125T1JW02), , 12.50, 2560x1440 | Dell XPS 13 9360 QHD+ i7 Sharp SHP144A, IPS, 13.30, 3200x1800 | |
|---|---|---|---|---|---|---|
| Display | -2% | 3% | -1% | 6% | -2% | |
| Display P3 Coverage | 63.6 | 63.4 0% | 65.8 3% | 64 1% | 68.7 8% | 62.8 -1% |
| sRGB Coverage | 93 | 88.6 -5% | 96.2 3% | 90 -3% | 95.8 3% | 89.4 -4% |
| AdobeRGB 1998 Coverage | 65.4 | 64 -2% | 66.8 2% | 64.9 -1% | 69.9 7% | 64.6 -1% |
| Response Times | -47% | 10% | -16% | -42% | -15% | |
| Response Time Grey 50% / Grey 80% * | 35.6 ? | 41.6 ? -17% | 33 ? 7% | 44 ? -24% | 37 ? -4% | 43.6 ? -22% |
| Response Time Black / White * | 27.2 ? | 34 ? -25% | 24 ? 12% | 29 ? -7% | 33.4 ? -23% | 29.2 ? -7% |
| PWM Frequency | 19690 ? | 210.1 ? -99% | 200 ? -99% | |||
| Screen | 4% | 17% | 7% | 1% | 8% | |
| Brightness middle | 386.1 | 510.7 32% | 408 6% | 334 -13% | 402 4% | 396.2 3% |
| Brightness | 357 | 481 35% | 395 11% | 321 -10% | 382 7% | 357 0% |
| Brightness Distribution | 83 | 90 8% | 88 6% | 86 4% | 88 6% | 84 1% |
| Black Level * | 0.33 | 0.66 -100% | 0.45 -36% | 0.25 24% | 0.45 -36% | 0.266 19% |
| Contrast | 1170 | 774 -34% | 907 -22% | 1336 14% | 893 -24% | 1489 27% |
| Colorchecker dE 2000 * | 4.2 | 2.4 43% | 1.55 63% | 4.24 -1% | 3.6 14% | 3.9 7% |
| Colorchecker dE 2000 max. * | 7.6 | 7.3 4% | 2.19 71% | 6.03 21% | 7.5 1% | 7.58 -0% |
| Greyscale dE 2000 * | 5.7 | 2.4 58% | 1.91 66% | 3.92 31% | 4.3 25% | 4.16 27% |
| Gamma | 2.28 96% | 2.23 99% | 2.34 94% | 2.68 82% | 2.1 105% | 2.31 95% |
| CCT | 7336 89% | 6747 96% | 6491 100% | 6758 96% | 6572 99% | 6514 100% |
| Color Space (Percent of AdobeRGB 1998) | 59 | 57 -3% | 61 3% | 58 -2% | 62.3 6% | 57.5 -3% |
| Color Space (Percent of sRGB) | 92.2 | 88.1 -4% | 96 4% | 90 -2% | 95.7 4% | 88.7 -4% |
| Total Average (Program / Settings) | -15% /
-7% | 10% /
13% | -3% /
2% | -12% /
-6% | -3% /
3% |
* ... smaller is better
Display Response Times
| ↔ Response Time Black to White | ||
|---|---|---|
| 27.2 ms ... rise ↗ and fall ↘ combined | ↗ 16 ms rise | 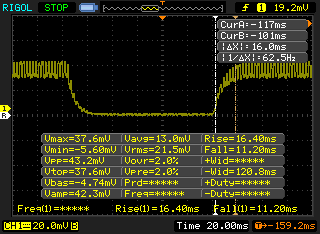 |
| ↘ 11.2 ms fall | ||
| The screen shows relatively slow response rates in our tests and may be too slow for gamers. In comparison, all tested devices range from 0.1 (minimum) to 240 (maximum) ms. » 65 % of all devices are better. This means that the measured response time is worse than the average of all tested devices (21.5 ms). | ||
| ↔ Response Time 50% Grey to 80% Grey | ||
| 35.6 ms ... rise ↗ and fall ↘ combined | ↗ 18.4 ms rise | 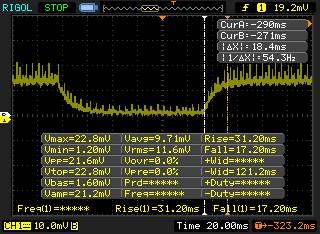 |
| ↘ 17.2 ms fall | ||
| The screen shows slow response rates in our tests and will be unsatisfactory for gamers. In comparison, all tested devices range from 0.2 (minimum) to 636 (maximum) ms. » 44 % of all devices are better. This means that the measured response time is similar to the average of all tested devices (33.7 ms). | ||
Screen Flickering / PWM (Pulse-Width Modulation)
| Screen flickering / PWM detected | 19690 Hz | ≤ 100 % brightness setting | 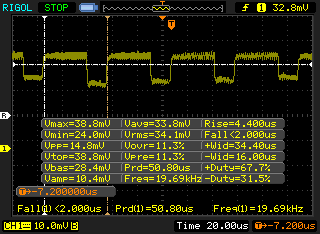 |
The display backlight flickers at 19690 Hz (worst case, e.g., utilizing PWM) Flickering detected at a brightness setting of 100 % and below. There should be no flickering or PWM above this brightness setting. The frequency of 19690 Hz is quite high, so most users sensitive to PWM should not notice any flickering. In comparison: 53 % of all tested devices do not use PWM to dim the display. If PWM was detected, an average of 17900 (minimum: 5 - maximum: 3846000) Hz was measured. | |||

| Cinebench R15 | |
| CPU Single 64Bit | |
| Eurocom Tornado F5 | |
| Dell XPS 13 i7-8550U | |
| MSI WS63VR 7RL-023US | |
| Tuxedo InfinityBook Pro 13 2017 | |
| Dell XPS 13 9360 FHD i7 Iris | |
| Acer Spin 5 SP513-52N-566U | |
| Dell XPS 13 9360-4764 | |
| Dell XPS 13 2016 9350 (FHD, i7-6560U) | |
| Dell XPS 13 2016 i7 256GB QHD | |
| Dell XPS 13 9360 FHD i5 | |
| Dell XPS 13-9343 Non-Touch | |
| CPU Multi 64Bit | |
| Eurocom Tornado F5 | |
| MSI WS63VR 7RL-023US | |
| Dell XPS 13 i7-8550U | |
| Tuxedo InfinityBook Pro 13 2017 | |
| Acer Spin 5 SP513-52N-566U | |
| Acer Spin 5 SP513-52N-566U | |
| Dell XPS 13 9360-4764 | |
| Dell XPS 13 9360 FHD i7 Iris | |
| Dell XPS 13 9360 FHD i5 | |
| Dell XPS 13 2016 9350 (FHD, i7-6560U) | |
| Dell XPS 13 2016 i7 256GB QHD | |
| Dell XPS 13-9343 Non-Touch | |
| Cinebench R11.5 | |
| CPU Single 64Bit | |
| Eurocom Tornado F5 | |
| Tuxedo InfinityBook Pro 13 2017 | |
| MSI WS63VR 7RL-023US | |
| Dell XPS 13 i7-8550U | |
| Acer Spin 5 SP513-52N-566U | |
| Dell XPS 13 2016 i7 256GB QHD | |
| Dell XPS 13 9360 FHD i5 | |
| Dell XPS 13-9343 Non-Touch | |
| CPU Multi 64Bit | |
| Eurocom Tornado F5 | |
| MSI WS63VR 7RL-023US | |
| Dell XPS 13 i7-8550U | |
| Acer Spin 5 SP513-52N-566U | |
| Tuxedo InfinityBook Pro 13 2017 | |
| Dell XPS 13 9360 FHD i5 | |
| Dell XPS 13 2016 i7 256GB QHD | |
| Dell XPS 13-9343 Non-Touch | |
| Cinebench R10 | |
| Rendering Multiple CPUs 32Bit | |
| MSI WS63VR 7RL-023US | |
| Eurocom Tornado F5 | |
| Tuxedo InfinityBook Pro 13 2017 | |
| Dell XPS 13 i7-8550U | |
| Acer Spin 5 SP513-52N-566U | |
| Dell XPS 13 2016 i7 256GB QHD | |
| Dell XPS 13 9360 FHD i5 | |
| Rendering Single 32Bit | |
| Eurocom Tornado F5 | |
| Tuxedo InfinityBook Pro 13 2017 | |
| Dell XPS 13 i7-8550U | |
| Acer Spin 5 SP513-52N-566U | |
| Dell XPS 13 9360 FHD i5 | |
| Dell XPS 13 2016 i7 256GB QHD | |
| wPrime 2.10 - 1024m | |
| Dell XPS 13-9343 Non-Touch | |
| Dell XPS 13 9360-4764 | |
| Tuxedo InfinityBook Pro 13 2017 | |
| Acer Spin 5 SP513-52N-566U | |
| MSI WS63VR 7RL-023US | |
| Eurocom Tornado F5 | |
* ... smaller is better
| PCMark 8 | |
| Home Score Accelerated v2 | |
| Dell XPS 13 9360 FHD i7 Iris | |
| Dell XPS 13 9360 FHD i5 | |
| Dell XPS 13 i7-8550U | |
| Dell XPS 13 9360 QHD+ i7 | |
| Work Score Accelerated v2 | |
| Dell XPS 13 9360 FHD i7 Iris | |
| Dell XPS 13 9360 FHD i5 | |
| Dell XPS 13 i7-8550U | |
| Dell XPS 13 9360 QHD+ i7 | |
| Creative Score Accelerated v2 | |
| Dell XPS 13 9360 FHD i7 Iris | |
| Dell XPS 13 i7-8550U | |
| Dell XPS 13 9360 FHD i5 | |
| Dell XPS 13 9360 QHD+ i7 | |
| PCMark 8 Home Score Accelerated v2 | 3432 pontos | |
| PCMark 8 Creative Score Accelerated v2 | 4604 pontos | |
| PCMark 8 Work Score Accelerated v2 | 4436 pontos | |
Ajuda | ||
| Dell XPS 13 i7-8550U Toshiba XG5 KXG50ZNV256G | Dell XPS 13 9365-4537 2-in-1 Toshiba NVMe THNSN5256GPUK | Dell XPS 13-9365 2-in-1 Toshiba NVMe THNSN5256GPUK | Dell XPS 13 9360 FHD i5 Toshiba NVMe THNSN5256GPUK | Dell XPS 13 2016 9350 (FHD, i7-6560U) Samsung SSD SM951 512 GB MZHPV512HDGL | |
|---|---|---|---|---|---|
| AS SSD | 23% | 52% | 16% | 86% | |
| Copy Game MB/s | 285.3 | 457.8 60% | 726 154% | 390 37% | 618 117% |
| Copy Program MB/s | 172 | 264.7 54% | 263.8 53% | 188 9% | 333.8 94% |
| Copy ISO MB/s | 329.7 | 714 117% | 950 188% | 283.3 -14% | 830 152% |
| Score Total | 1284 | 1388 8% | 1495 16% | 1607 25% | 1992 55% |
| Score Write | 452 | 389 -14% | 375 -17% | 327 -28% | 606 34% |
| Score Read | 580 | 681 17% | 752 30% | 870 50% | 911 57% |
| Access Time Write * | 0.051 | 0.041 20% | 0.037 27% | 0.035 31% | 0.031 39% |
| Access Time Read * | 0.102 | 0.169 -66% | 0.045 56% | 0.055 46% | 0.048 53% |
| 4K-64 Write | 325.1 | 249.4 -23% | 204.7 -37% | 197.7 -39% | 363.4 12% |
| 4K-64 Read | 423.6 | 512 21% | 586 38% | 723 71% | 722 70% |
| 4K Write | 101.7 | 85.8 -16% | 96.9 -5% | 92 -10% | 107.4 6% |
| 4K Read | 28.17 | 34.77 23% | 37.69 34% | 29.52 5% | 46.9 66% |
| Seq Write | 249.2 | 543 118% | 735 195% | 372.8 50% | 1348 441% |
| Seq Read | 1277 | 1342 5% | 1283 0% | 1179 -8% | 1413 11% |
* ... smaller is better

| 3DMark 11 Performance | 2032 pontos | |
| 3DMark Ice Storm Standard Score | 67042 pontos | |
| 3DMark Cloud Gate Standard Score | 8459 pontos | |
| 3DMark Fire Strike Score | 1071 pontos | |
| 3DMark Fire Strike Extreme Score | 490 pontos | |
Ajuda | ||
| Rise of the Tomb Raider | |
| 1366x768 Medium Preset AF:2x | |
| HP Envy 13-ad006ng | |
| Apple MacBook Pro 13 2016 | |
| Microsoft Surface Pro (2017) i7 | |
| Dell XPS 13 i7-8550U | |
| Dell XPS 13 9360 QHD+ i7 | |
| 1920x1080 High Preset AA:FX AF:4x | |
| HP Envy 13-ad006ng | |
| Microsoft Surface Pro (2017) i7 | |
| Dell XPS 13 i7-8550U | |
| Dell XPS 13 9360 QHD+ i7 | |
| baixo | média | alto | ultra | |
| BioShock Infinite (2013) | 72.8 | 37.6 | 31.1 | 10 |
| Rise of the Tomb Raider (2016) | 24.9 | 14.6 | 7.4 | |
| Overwatch (2016) | 49.6 | 30.7 | 14.9 |
Barulho
| Ocioso |
| 27.9 / 27.9 / 27.9 dB |
| Carga |
| 30.8 / 33.1 dB |
 | ||
30 dB silencioso 40 dB(A) audível 50 dB(A) ruidosamente alto |
||
min: | ||
| Dell XPS 13 i7-8550U UHD Graphics 620, i5-8550U, Toshiba XG5 KXG50ZNV256G | Samsung Notebook 9 NP900X3N-K01US HD Graphics 620, i5-7200U, Samsung CM871a MZNTY256HDHP | Huawei MateBook X HD Graphics 620, i5-7200U, LITEON CB1-SD256 | Asus ZenBook Flip S UX370 HD Graphics 620, i5-7200U, SanDisk SD8SN8U256G1002 | Dell XPS 13 9360 FHD i7 Iris Iris Plus Graphics 640, i7-7560U, Toshiba XG4 NVMe (THNSN5512GPUK) | Dell XPS 13 9360 FHD i5 HD Graphics 620, i5-7200U, Toshiba NVMe THNSN5256GPUK | |
|---|---|---|---|---|---|---|
| Noise | -4% | -8% | -8% | -3% | ||
| off / environment * | 27.9 | 28.4 -2% | 30.5 -9% | 29.9 -7% | ||
| Idle Minimum * | 27.9 | 28.4 -2% | 30.5 -9% | 29.9 -7% | 28.9 -4% | |
| Idle Average * | 27.9 | 28.4 -2% | 30.5 -9% | 29.9 -7% | 28.9 -4% | |
| Idle Maximum * | 27.9 | 28.4 -2% | 30.5 -9% | 30.3 -9% | 28.9 -4% | |
| Load Average * | 30.8 | 33.2 -8% | 34.2 -11% | 33.9 -10% | 30.9 -0% | |
| Load Maximum * | 33.1 | 35.2 -6% | 32.5 2% | 34.9 -5% | 33.5 -1% |
* ... smaller is better
(-) The maximum temperature on the upper side is 49 °C / 120 F, compared to the average of 35.9 °C / 97 F, ranging from 21.4 to 59 °C for the class Subnotebook.
(-) The bottom heats up to a maximum of 54 °C / 129 F, compared to the average of 39.4 °C / 103 F
(+) In idle usage, the average temperature for the upper side is 25.7 °C / 78 F, compared to the device average of 30.7 °C / 87 F.
(+) The palmrests and touchpad are reaching skin temperature as a maximum (32.2 °C / 90 F) and are therefore not hot.
(-) The average temperature of the palmrest area of similar devices was 28.3 °C / 82.9 F (-3.9 °C / -7.1 F).
Dell XPS 13 i7-8550U audio analysis
(-) | not very loud speakers (66.8 dB)
Bass 100 - 315 Hz
(+) | good bass - only 4.5% away from median
(±) | linearity of bass is average (8.2% delta to prev. frequency)
Mids 400 - 2000 Hz
(±) | higher mids - on average 5% higher than median
(+) | mids are linear (5.8% delta to prev. frequency)
Highs 2 - 16 kHz
(+) | balanced highs - only 3% away from median
(±) | linearity of highs is average (14.5% delta to prev. frequency)
Overall 100 - 16.000 Hz
(±) | linearity of overall sound is average (17.2% difference to median)
Compared to same class
» 38% of all tested devices in this class were better, 10% similar, 52% worse
» The best had a delta of 5%, average was 19%, worst was 53%
Compared to all devices tested
» 26% of all tested devices were better, 8% similar, 66% worse
» The best had a delta of 4%, average was 25%, worst was 134%
Apple MacBook 12 (Early 2016) 1.1 GHz audio analysis
(+) | speakers can play relatively loud (83.6 dB)
Bass 100 - 315 Hz
(±) | reduced bass - on average 11.3% lower than median
(±) | linearity of bass is average (14.2% delta to prev. frequency)
Mids 400 - 2000 Hz
(+) | balanced mids - only 2.4% away from median
(+) | mids are linear (5.5% delta to prev. frequency)
Highs 2 - 16 kHz
(+) | balanced highs - only 2% away from median
(+) | highs are linear (4.5% delta to prev. frequency)
Overall 100 - 16.000 Hz
(+) | overall sound is linear (10.2% difference to median)
Compared to same class
» 5% of all tested devices in this class were better, 2% similar, 93% worse
» The best had a delta of 5%, average was 19%, worst was 53%
Compared to all devices tested
» 3% of all tested devices were better, 1% similar, 96% worse
» The best had a delta of 4%, average was 25%, worst was 134%
| desligado | |
| Ocioso | |
| Carga |
|
| Dell XPS 13 i7-8550U i5-8550U, UHD Graphics 620, Toshiba XG5 KXG50ZNV256G, IGZO IPS, 3200x1800, 13.30 | Samsung Notebook 9 NP900X3N-K01US i5-7200U, HD Graphics 620, Samsung CM871a MZNTY256HDHP, IPS, 1920x1080, 13.30 | Asus ZenBook Flip S UX370 i5-7200U, HD Graphics 620, SanDisk SD8SN8U256G1002, a-Si TFT-LCD, WLED, 1920x1080, 13.30 | Dell XPS 13 9360 FHD i7 Iris i7-7560U, Iris Plus Graphics 640, Toshiba XG4 NVMe (THNSN5512GPUK), IPS, 1920x1080, 13.30 | Dell XPS 13 9360 QHD+ i7 i7-7500U, HD Graphics 620, Toshiba NVMe THNSN5256GPUK, IPS, 3200x1800, 13.30 | HP Spectre 13-v131ng i7-7500U, HD Graphics 620, Samsung PM961 NVMe MZVLW512HMJP, IPS UWVA, 1920x1080, 13.30 | |
|---|---|---|---|---|---|---|
| Power Consumption | -29% | 14% | 7% | -5% | -3% | |
| Idle Minimum * | 4.1 | 3.8 7% | 2.6 37% | 3.32 19% | 6.4 -56% | 3.6 12% |
| Idle Average * | 5.8 | 11 -90% | 5.3 9% | 5.27 9% | 6.6 -14% | 6.4 -10% |
| Idle Maximum * | 6 | 11.3 -88% | 8.5 -42% | 6.32 -5% | 6.8 -13% | 9.2 -53% |
| Load Average * | 42.5 | 35.6 16% | 29 32% | 32 25% | 27.5 35% | 34 20% |
| Load Maximum * | 41.4 | 37.2 10% | 27 35% | 45.9 -11% | 32.4 22% | 34.4 17% |
* ... smaller is better
| Dell XPS 13 i7-8550U i5-8550U, UHD Graphics 620, 60 Wh | Samsung Notebook 9 NP900X3N-K01US i5-7200U, HD Graphics 620, 30 Wh | Huawei MateBook X i5-7200U, HD Graphics 620, 40 Wh | Asus ZenBook Flip S UX370 i5-7200U, HD Graphics 620, 39 Wh | Dell XPS 13 9360 FHD i7 Iris i7-7560U, Iris Plus Graphics 640, 60 Wh | Dell XPS 13 9360 FHD i5 i5-7200U, HD Graphics 620, 60 Wh | |
|---|---|---|---|---|---|---|
| Battery Runtime | -49% | -28% | -10% | 19% | 14% | |
| Reader / Idle | 1108 | 695 -37% | 512 -54% | 937 -15% | 1521 37% | 1295 17% |
| WiFi v1.3 | 589 | 279 -53% | 337 -43% | 483 -18% | 655 11% | 677 15% |
| Load | 143 | 60 -58% | 162 13% | 147 3% | 154 8% | 157 10% |
Pro
Contra
A principal intenção da Dell com o XPS 13 Kaby Lake-R de 8va geração foi impulsionar o desempenho da CPU através de um melhor monitoramento de temperatura. Assim, esta última iteração foi projetada para funcionar em temperaturas de núcleo mais altas do que as SKUs anteriores, sem impactar negativamente a experiência do usuário ou aumentar a temperatura da superfície em níveis desconfortáveis. Nossos testes mais ou menos ecoam essas afirmações, pois as temperaturas podem passar mais de 90 C quando está sob carga pesada sem afetar a necessidade de aumentar as velocidades máximas da ventoinha As temperaturas da superfície serão ligeiramente mais quentes em certas partes do teclado, mas o pousa palmas e o trackpad nunca ficam desconfortáveis.
Além do salto significativo no desempenho da CPU e uma leve melhoria no desempenho da GPU, não há surpresas para esta geração XPS 13. Os mesmos prós e contras das nossas análises anteriores permanecem. Há um caso para comprar o XPS 13 i7-7560U SKU em vez do i7-8550U SKU dado que os gráficos Iris se desempenham 18% mais rápido que o UHD Graphics 620, mas o desempenho da CPU é muito mais lento em cerca de 40%. Aplicativos exigentes que aproveitam a maior contagem do núcleos adorarão a Kaby Lake-R e o novo XPS 13. Ainda há espaço para melhorias, uma vez que a velocidade constante de 2,5 GHz está muito longe dos 3,7 GHz. Assim, será interessante ver como outros Ultrabooks ostentando essa mesma CPU funcionarão nas próximas semanas.
O XPS 13 é mais uma vez um concorrente muito forte no espaço dos subportáteis para esta temporada de férias. O impulso de desempenho é como anunciado, embora tenhamos esperado uma melhor sustentabilidade do Turbo Boost por longos períodos.
Dell XPS 13 i7-8550U
-
10/12/2017 v6(old)
Allen Ngo
Pricecompare
