 Deutsch
 English
 Español
 Français
 Italiano
 Nederlands
 Polski
 Português
 Русский
 Türkçe
 Svenska
 Chinese
 Magyar
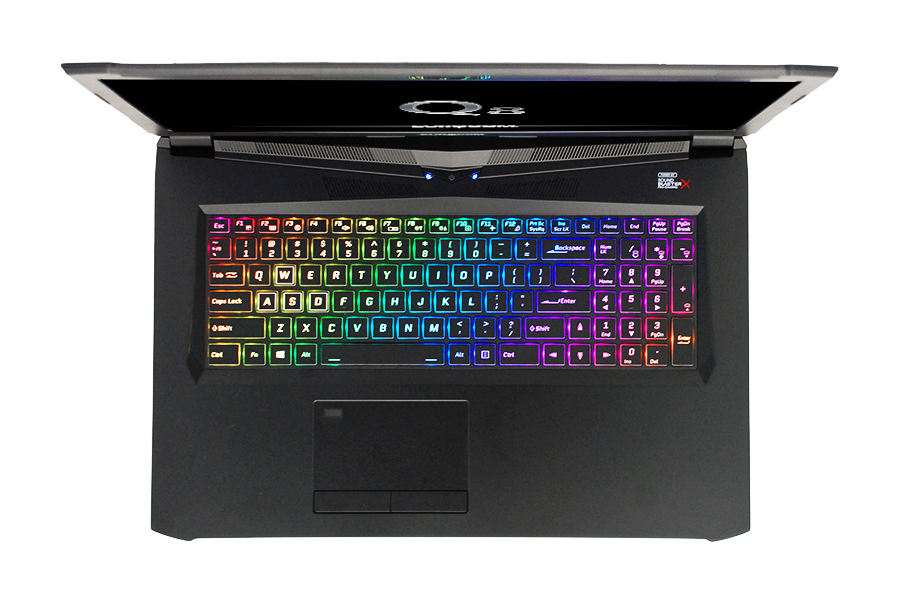
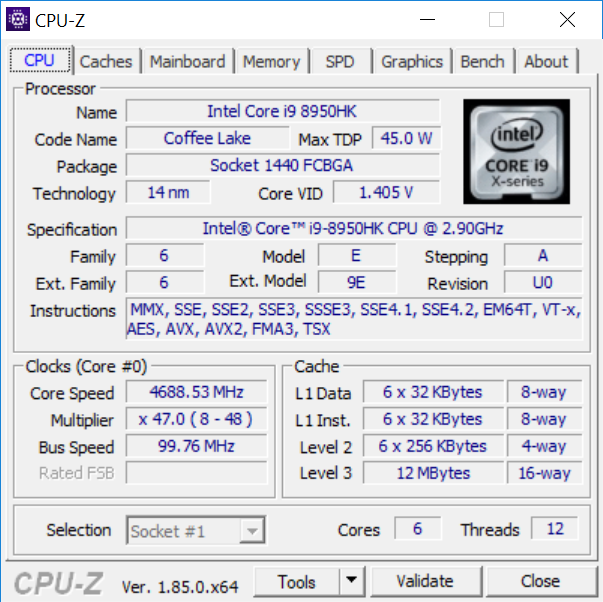
Breve Análise do Portátil Eurocom Q8 (i9-8950HK, GTX 1070, QHD)
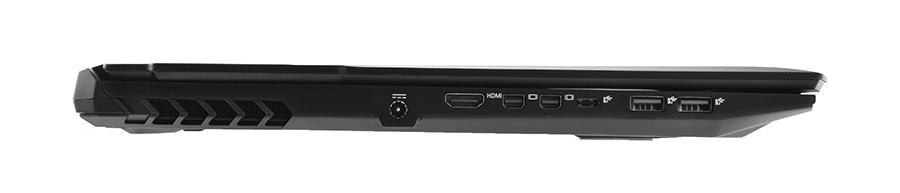
| SD Card Reader | |
| average JPG Copy Test (av. of 3 runs) | |
| Aorus X7 v7 (Toshiba Exceria Pro SDXC 64 GB UHS-II) | |
| Eurocom Q8 (Toshiba Exceria Pro SDXC 64 GB UHS-II) | |
| MSI GS73VR 7RG (Toshiba Exceria Pro SDXC 64 GB UHS-II) | |
| Asus GL703GE-ES73 (Toshiba Exceria Pro SDXC 64 GB UHS-II) | |
| maximum AS SSD Seq Read Test (1GB) | |
| Aorus X7 v7 (Toshiba Exceria Pro SDXC 64 GB UHS-II) | |
| MSI GS73VR 7RG (Toshiba Exceria Pro SDXC 64 GB UHS-II) | |
| Eurocom Q8 (Toshiba Exceria Pro SDXC 64 GB UHS-II) | |
| Asus GL703GE-ES73 (Toshiba Exceria Pro SDXC 64 GB UHS-II) | |
| Networking | |
| iperf3 transmit AX12 | |
| Eurocom Q8 | |
| Asus Zephyrus M GM501 | |
| Aorus X7 v7 | |
| MSI GS73VR 7RG | |
| iperf3 receive AX12 | |
| Asus Zephyrus M GM501 | |
| Eurocom Q8 | |
| MSI GS73VR 7RG | |
| Aorus X7 v7 | |
| |||||||||||||||||||||||||
iluminação: 84 %
iluminação com acumulador: 367.9 cd/m²
Contraste: 669:1 (Preto: 0.55 cd/m²)
ΔE Color 9.86 | 0.5-29.43 Ø5, calibrated: 4.43
ΔE Greyscale 12.4 | 0.57-98 Ø5.3
80.5% sRGB (Argyll 1.6.3 3D)
52.5% AdobeRGB 1998 (Argyll 1.6.3 3D)
58.9% AdobeRGB 1998 (Argyll 2.2.0 3D)
81% sRGB (Argyll 2.2.0 3D)
58.7% Display P3 (Argyll 2.2.0 3D)
Gamma: 2.09
| Eurocom Q8 AU Optronics B173QTN01.0, Dell P/N WJGD4, TN LED, 17.30, 2560x1440 | MSI GS73VR 7RG ID: CMN1747, Name: Chi Mei N173HHE-G32, TN LED, 17.30, 1920x1080 | Asus GL703GE-ES73 Chi Mei CMN1747, TN, 17.30, 1920x1080 | Razer Blade Pro RZ09-0220 ID: AUO169D, Name: AU Optronics B173HAN01.6, IPS, 17.30, 1920x1080 | Alienware 17 R4 TN LED, 17.30, 2560x1440 | Aorus X7 v7 AU Optronics B173QTN01.4 (AUO1496), TN LED, 17.30, 2560x1440 | |
|---|---|---|---|---|---|---|
| Display | 41% | 39% | 10% | 3% | 8% | |
| Display P3 Coverage | 58.7 | 89.6 53% | 90.1 53% | 64 9% | 61.2 4% | 63 7% |
| sRGB Coverage | 81 | 100 23% | 99.8 23% | 89.7 11% | 82.9 2% | 87.1 8% |
| AdobeRGB 1998 Coverage | 58.9 | 86.9 48% | 83.1 41% | 64.9 10% | 60.5 3% | 63.7 8% |
| Response Times | -1% | 24% | -192% | -41% | 11% | |
| Response Time Grey 50% / Grey 80% * | 21.6 ? | 23.6 ? -9% | 11.6 ? 46% | 36.8 ? -70% | 30 ? -39% | 24 ? -11% |
| Response Time Black / White * | 9 ? | 8.4 ? 7% | 8.8 ? 2% | 37.2 ? -313% | 12.8 ? -42% | 6 ? 33% |
| PWM Frequency | 26040 ? | 26040 ? | ||||
| Screen | 20% | 36% | 32% | 16% | 15% | |
| Brightness middle | 367.9 | 350.9 -5% | 331.1 -10% | 367.4 0% | 402.3 9% | 375 2% |
| Brightness | 346 | 311 -10% | 312 -10% | 363 5% | 372 8% | 353 2% |
| Brightness Distribution | 84 | 79 -6% | 86 2% | 86 2% | 86 2% | 85 1% |
| Black Level * | 0.55 | 0.33 40% | 0.31 44% | 0.32 42% | 0.62 -13% | 0.58 -5% |
| Contrast | 669 | 1063 59% | 1068 60% | 1148 72% | 649 -3% | 647 -3% |
| Colorchecker dE 2000 * | 9.86 | 7.7 22% | 2.86 71% | 3.8 61% | 5.6 43% | 6.06 39% |
| Colorchecker dE 2000 max. * | 17.56 | 14.4 18% | 6.35 64% | 10.4 41% | 9.8 44% | 10.54 40% |
| Colorchecker dE 2000 calibrated * | 4.43 | 2.66 40% | ||||
| Greyscale dE 2000 * | 12.4 | 11.1 10% | 4.3 65% | 3.5 72% | 4.7 62% | 5.68 54% |
| Gamma | 2.09 105% | 2.11 104% | 2.268 97% | 2.18 101% | 2.14 103% | 2.3 96% |
| CCT | 11064 59% | 11813 55% | 7034 92% | 6467 101% | 7519 86% | 7998 81% |
| Color Space (Percent of AdobeRGB 1998) | 52.5 | 77.74 48% | 75 43% | 58.1 11% | 53.7 2% | 57 9% |
| Color Space (Percent of sRGB) | 80.5 | 100 24% | 100 24% | 89.3 11% | 82.2 2% | 87 8% |
| Total Average (Program / Settings) | 20% /
21% | 33% /
35% | -50% /
-2% | -7% /
6% | 11% /
13% |
* ... smaller is better
Display Response Times
| ↔ Response Time Black to White | ||
|---|---|---|
| 9 ms ... rise ↗ and fall ↘ combined | ↗ 6.8 ms rise | 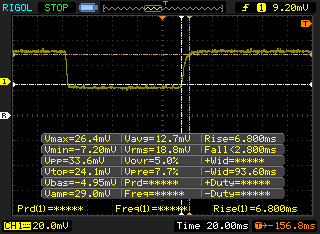 |
| ↘ 2.2 ms fall | ||
| The screen shows fast response rates in our tests and should be suited for gaming. In comparison, all tested devices range from 0.1 (minimum) to 240 (maximum) ms. » 19 % of all devices are better. This means that the measured response time is better than the average of all tested devices (21.5 ms). | ||
| ↔ Response Time 50% Grey to 80% Grey | ||
| 21.6 ms ... rise ↗ and fall ↘ combined | ↗ 12.4 ms rise | 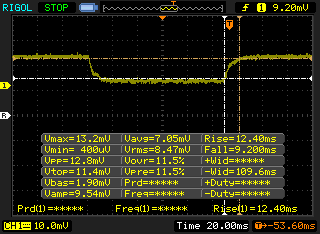 |
| ↘ 9.2 ms fall | ||
| The screen shows good response rates in our tests, but may be too slow for competitive gamers. In comparison, all tested devices range from 0.2 (minimum) to 636 (maximum) ms. » 28 % of all devices are better. This means that the measured response time is better than the average of all tested devices (33.8 ms). | ||
Screen Flickering / PWM (Pulse-Width Modulation)
| Screen flickering / PWM not detected | 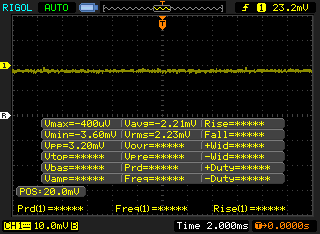 | ||
In comparison: 53 % of all tested devices do not use PWM to dim the display. If PWM was detected, an average of 17942 (minimum: 5 - maximum: 3846000) Hz was measured. | |||
| Cinebench R15 | |
| CPU Single 64Bit | |
| Eurocom Q8 | |
| Average Intel Core i9-8950HK (185 - 206, n=14) | |
| Eurocom Sky X4C | |
| Intel Hades Canyon NUC8i7HVK | |
| Eurocom Q6 | |
| Eurocom Sky X7E2 | |
| Eurocom Sky MX5 R3 | |
| Eurocom Q5 | |
| Asus GL702ZC-GC104T | |
| Apple MacBook Pro 15 2016 (2.6 GHz, 450) | |
| CPU Multi 64Bit | |
| Asus GL702ZC-GC104T | |
| Eurocom Sky X4C | |
| Average Intel Core i9-8950HK (1051 - 1391, n=14) | |
| Eurocom Q8 | |
| Eurocom Q6 | |
| Eurocom Sky X7E2 | |
| Intel Hades Canyon NUC8i7HVK | |
| Eurocom Sky MX5 R3 | |
| Eurocom Q5 | |
| Apple MacBook Pro 15 2016 (2.6 GHz, 450) | |
| PCMark 10 - Score | |
| Eurocom Sky X4C | |
| Eurocom Q8 | |
| Aorus X7 v7 | |
| HP Omen X 17-ap0xx | |
| MSI GS73VR 7RG | |
| Razer Blade Pro RZ09-0220 | |
| Apple MacBook Pro 15 2017 (2.9 GHz, 560) | |
| PCMark 8 - Home Score Accelerated v2 | |
| Eurocom Sky X4C | |
| HP Omen X 17-ap0xx | |
| Eurocom Q8 | |
| Aorus X7 v7 | |
| Alienware 17 R4 | |
| MSI GS73VR 7RG | |
| Razer Blade Pro RZ09-0220 | |
| Apple MacBook Pro 15 2017 (2.9 GHz, 560) | |
| PCMark 8 Home Score Accelerated v2 | 5111 pontos | |
| PCMark 10 Score | 6331 pontos | |
Ajuda | ||
| Eurocom Q8 Samsung SSD 960 Pro 512 GB m.2 | MSI GS73VR 7RG Samsung SSD PM871 MZNLN512HMJP | Razer Blade Pro RZ09-0220 Samsung SSD PM951 MZVLV256HCHP | Alienware 17 R4 SK Hynix PC300 NVMe 512 GB | Aorus X7 v7 Samsung SM961 MZVPW256HEGL | |
|---|---|---|---|---|---|
| AS SSD | -52% | -36% | -44% | -7% | |
| Copy Game MB/s | 958 | 381.5 -60% | 724 -24% | 574 -40% | 758 -21% |
| Copy Program MB/s | 406.7 | 229.8 -43% | 228.3 -44% | 446.1 10% | 327.2 -20% |
| Copy ISO MB/s | 1596 | 423.5 -73% | 1193 -25% | 1227 -23% | 1504 -6% |
| Score Total | 3840 | 1064 -72% | 1951 -49% | 2072 -46% | 3668 -4% |
| Score Write | 1579 | 417 -74% | 406 -74% | 858 -46% | 1021 -35% |
| Score Read | 1515 | 421 -72% | 1056 -30% | 831 -45% | 1803 19% |
| Access Time Write * | 0.035 | 0.032 9% | 0.034 3% | 0.123 -251% | 0.031 11% |
| Access Time Read * | 0.043 | 0.051 -19% | 0.06 -40% | 0.042 2% | 0.059 -37% |
| 4K-64 Write | 1285 | 273.6 -79% | 267.2 -79% | 671 -48% | 791 -38% |
| 4K-64 Read | 1232 | 337.7 -73% | 871 -29% | 620 -50% | 1485 21% |
| 4K Write | 107.9 | 96.8 -10% | 109.9 2% | 113.4 5% | 123.3 14% |
| 4K Read | 35.57 | 33.69 -5% | 38.31 8% | 35.61 0% | 48.35 36% |
| Seq Write | 1869 | 465.1 -75% | 291.8 -84% | 735 -61% | 1067 -43% |
| Seq Read | 2481 | 497.9 -80% | 1464 -41% | 1752 -29% | 2690 8% |
* ... smaller is better

| 3DMark 11 Performance | 18243 pontos | |
Ajuda | ||
| baixo | média | alto | ultra | |
| BioShock Infinite (2013) | 384.1 | 316.2 | 291.1 | 154.2 |
| The Witcher 3 (2015) | 48.2 |
Barulho
| Ocioso |
| 28.2 / 31.8 / 36.3 dB |
| Carga |
| 46.7 / 49.7 dB |
 | ||
30 dB silencioso 40 dB(A) audível 50 dB(A) ruidosamente alto |
||
min: | ||
| Eurocom Q8 GeForce GTX 1070 Mobile, i9-8950HK, Samsung SSD 960 Pro 512 GB m.2 | Eurocom Sky X4C GeForce GTX 1080 Mobile, i7-8700K, Samsung SSD 960 Pro 1TB m.2 NVMe | Razer Blade Pro RZ09-0220 GeForce GTX 1060 Mobile, i7-7700HQ, Samsung SSD PM951 MZVLV256HCHP | Alienware 17 R4 GeForce GTX 1080 Mobile, i7-7820HK, SK Hynix PC300 NVMe 512 GB | Aorus X7 v7 GeForce GTX 1070 Mobile, i7-7820HK, Samsung SM961 MZVPW256HEGL | MSI GS73VR 7RG GeForce GTX 1070 Max-Q, i7-7700HQ, Samsung SSD PM871 MZNLN512HMJP | |
|---|---|---|---|---|---|---|
| Noise | 2% | 7% | -7% | -6% | 4% | |
| off / environment * | 28 | 28.6 -2% | 28.1 -0% | 28.2 -1% | 30 -7% | 28 -0% |
| Idle Minimum * | 28.2 | 28.6 -1% | 29.5 -5% | 35.6 -26% | 33 -17% | 29.4 -4% |
| Idle Average * | 31.8 | 28.6 10% | 29.6 7% | 35.6 -12% | 36 -13% | 30.7 3% |
| Idle Maximum * | 36.3 | 31.1 14% | 29.6 18% | 35.7 2% | 41 -13% | 34 6% |
| Load Average * | 46.7 | 42.2 10% | 31.6 32% | 50.2 -7% | 41 12% | 42 10% |
| Witcher 3 ultra * | 46.9 | 53.8 -15% | 46 2% | 50.2 -7% | 45 4% | 45.8 2% |
| Load Maximum * | 49.7 | 50 -1% | 51.8 -4% | 50.2 -1% | 52 -5% | 45.8 8% |
* ... smaller is better
(±) The maximum temperature on the upper side is 43.4 °C / 110 F, compared to the average of 40.4 °C / 105 F, ranging from 21.2 to 68.8 °C for the class Gaming.
(±) The bottom heats up to a maximum of 44 °C / 111 F, compared to the average of 43.2 °C / 110 F
(+) In idle usage, the average temperature for the upper side is 29.3 °C / 85 F, compared to the device average of 33.8 °C / 93 F.
(±) Playing The Witcher 3, the average temperature for the upper side is 34.7 °C / 94 F, compared to the device average of 33.8 °C / 93 F.
(+) The palmrests and touchpad are cooler than skin temperature with a maximum of 31 °C / 87.8 F and are therefore cool to the touch.
(-) The average temperature of the palmrest area of similar devices was 28.9 °C / 84 F (-2.1 °C / -3.8 F).
Eurocom Q8 audio analysis
(-) | not very loud speakers (66.6 dB)
Bass 100 - 315 Hz
(±) | reduced bass - on average 13.4% lower than median
(±) | linearity of bass is average (12.1% delta to prev. frequency)
Mids 400 - 2000 Hz
(±) | higher mids - on average 5.4% higher than median
(±) | linearity of mids is average (12.1% delta to prev. frequency)
Highs 2 - 16 kHz
(+) | balanced highs - only 4.3% away from median
(±) | linearity of highs is average (11.5% delta to prev. frequency)
Overall 100 - 16.000 Hz
(-) | overall sound is not linear (30.3% difference to median)
Compared to same class
» 95% of all tested devices in this class were better, 2% similar, 3% worse
» The best had a delta of 6%, average was 18%, worst was 132%
Compared to all devices tested
» 86% of all tested devices were better, 3% similar, 10% worse
» The best had a delta of 4%, average was 25%, worst was 134%
Apple MacBook 12 (Early 2016) 1.1 GHz audio analysis
(+) | speakers can play relatively loud (83.6 dB)
Bass 100 - 315 Hz
(±) | reduced bass - on average 11.3% lower than median
(±) | linearity of bass is average (14.2% delta to prev. frequency)
Mids 400 - 2000 Hz
(+) | balanced mids - only 2.4% away from median
(+) | mids are linear (5.5% delta to prev. frequency)
Highs 2 - 16 kHz
(+) | balanced highs - only 2% away from median
(+) | highs are linear (4.5% delta to prev. frequency)
Overall 100 - 16.000 Hz
(+) | overall sound is linear (10.2% difference to median)
Compared to same class
» 5% of all tested devices in this class were better, 2% similar, 93% worse
» The best had a delta of 5%, average was 19%, worst was 53%
Compared to all devices tested
» 3% of all tested devices were better, 1% similar, 96% worse
» The best had a delta of 4%, average was 25%, worst was 134%
| desligado | |
| Ocioso | |
| Carga |
|
| Eurocom Q8 i9-8950HK, GeForce GTX 1070 Mobile, Samsung SSD 960 Pro 512 GB m.2, TN LED, 2560x1440, 17.30 | Razer Blade Pro RZ09-0220 i7-7700HQ, GeForce GTX 1060 Mobile, Samsung SSD PM951 MZVLV256HCHP, IPS, 1920x1080, 17.30 | Alienware 17 R4 i7-7820HK, GeForce GTX 1080 Mobile, SK Hynix PC300 NVMe 512 GB, TN LED, 2560x1440, 17.30 | Aorus X7 v7 i7-7820HK, GeForce GTX 1070 Mobile, Samsung SM961 MZVPW256HEGL, TN LED, 2560x1440, 17.30 | Asus Strix GL703GM-DS74 i7-8750H, GeForce GTX 1060 Mobile, Samsung PM961 MZVLW256HEHP, TN LED, 1920x1080, 17.30 | |
|---|---|---|---|---|---|
| Power Consumption | 35% | -33% | -20% | 8% | |
| Idle Minimum * | 26.3 | 10.6 60% | 37.5 -43% | 27 -3% | 18.88 28% |
| Idle Average * | 29 | 16 45% | 37.6 -30% | 33 -14% | 24.36 16% |
| Idle Maximum * | 32.3 | 16.4 49% | 37.6 -16% | 40 -24% | 32.27 -0% |
| Load Average * | 82.4 | 75.9 8% | 122.4 -49% | 107 -30% | 107.74 -31% |
| Witcher 3 ultra * | 192 | 111.2 42% | 180.3 6% | 190 1% | 142 26% |
| Load Maximum * | 170.2 | 163.8 4% | 277.4 -63% | 259 -52% | 160.28 6% |
* ... smaller is better
| Eurocom Q8 i9-8950HK, GeForce GTX 1070 Mobile, 66 Wh | MSI GS73VR 7RG i7-7700HQ, GeForce GTX 1070 Max-Q, 51 Wh | Razer Blade Pro RZ09-0220 i7-7700HQ, GeForce GTX 1060 Mobile, 70 Wh | Alienware 17 R4 i7-7820HK, GeForce GTX 1080 Mobile, 99 Wh | Aorus X7 v7 i7-7820HK, GeForce GTX 1070 Mobile, 94 Wh | Asus Zephyrus M GM501 i7-8750H, GeForce GTX 1070 Mobile, 55 Wh | |
|---|---|---|---|---|---|---|
| Battery Runtime | 25% | 174% | 18% | 18% | 7% | |
| WiFi v1.3 | 153 | 191 25% | 419 174% | 181 18% | 180 18% | 164 7% |
| Reader / Idle | 349 | 721 | 276 | 221 | 237 | |
| Load | 57 | 72 | 69 | 81 | 70 |
Pro
Contra
O Eurocom Q8 custa a partir de $2.300 USD pelo i9-8950HK e GPU GTX 1070. Para os jogos, a 8ª geração Coffee Lake-H da Intel oferece apenas aumentos marginais nas taxas de quadros em relação às opções da 7ª geração do Kaby Lake. Os usuários podem potencialmente economizar dinheiro considerando portáteis mais antigos com o Core i7-7700HQ e GTX 1070 e ainda obtêm quase o mesmo desempenho do Eurocom Q8 quando jogam.
O estranho comportamento de afogamento do Q8 durante jogos, faz com que seja difícil recomendar o sistema por enquanto. É possível que isso afete apenas nossa unidade de teste específica. Mesmo assim, o Core i9 não está rodando em seu potencial máximo aqui, e mesmo que pudesse, suas pequenas vantagens de jogo em relação ao menos caro i7-8750H ou mesmo i7-7700HQ não refletem o preço pedido muito maior.
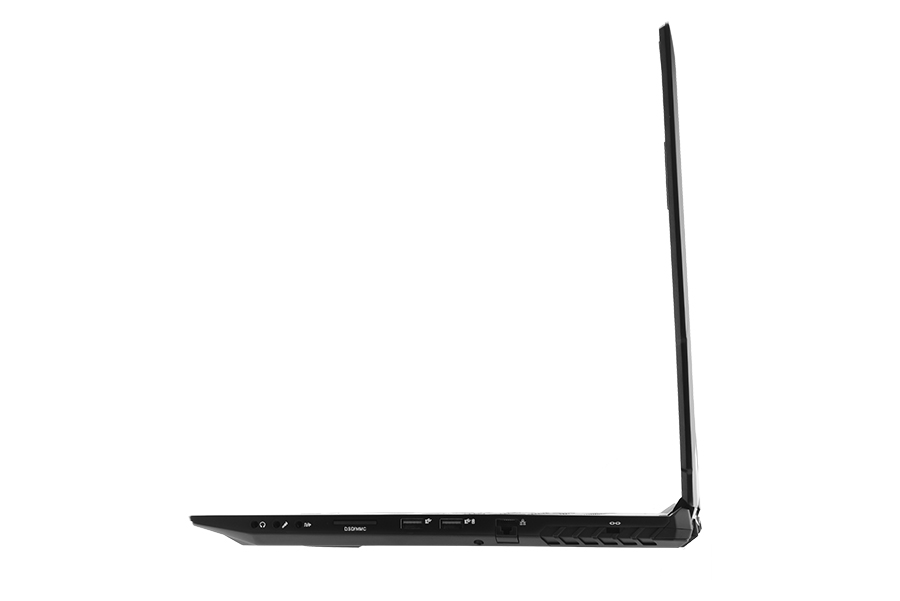
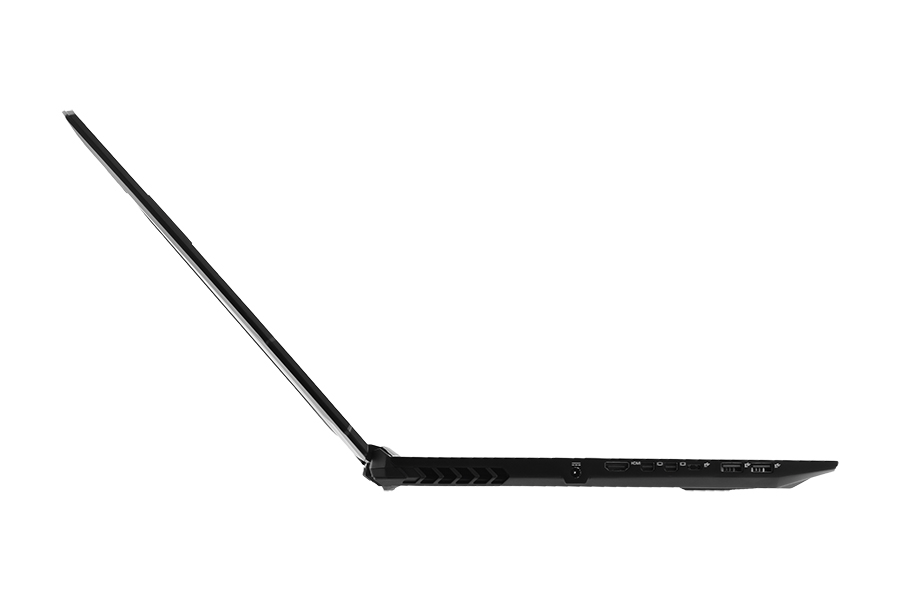
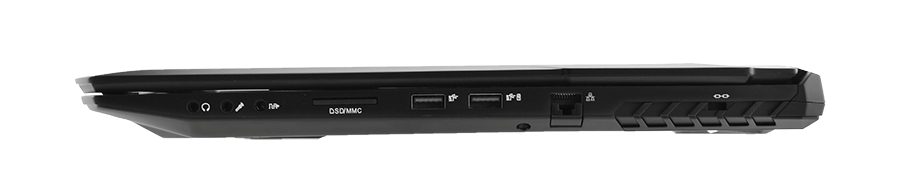
O Eurocom Q8 deixa uma boa primeira impressão no que diz respeito à capacidade de manutenção e conectividade. O desempenho é instável e com um desempenho por dólar mais baixo do que uma oferta tradicional do Core i7.
Eurocom Q8
-
07/03/2018 v6(old)
Allen Ngo
Pricecompare
