 Deutsch
 English
 Español
 Français
 Italiano
 Nederlands
 Polski
 Português
 Русский
 Türkçe
 Svenska
 Chinese
 Magyar
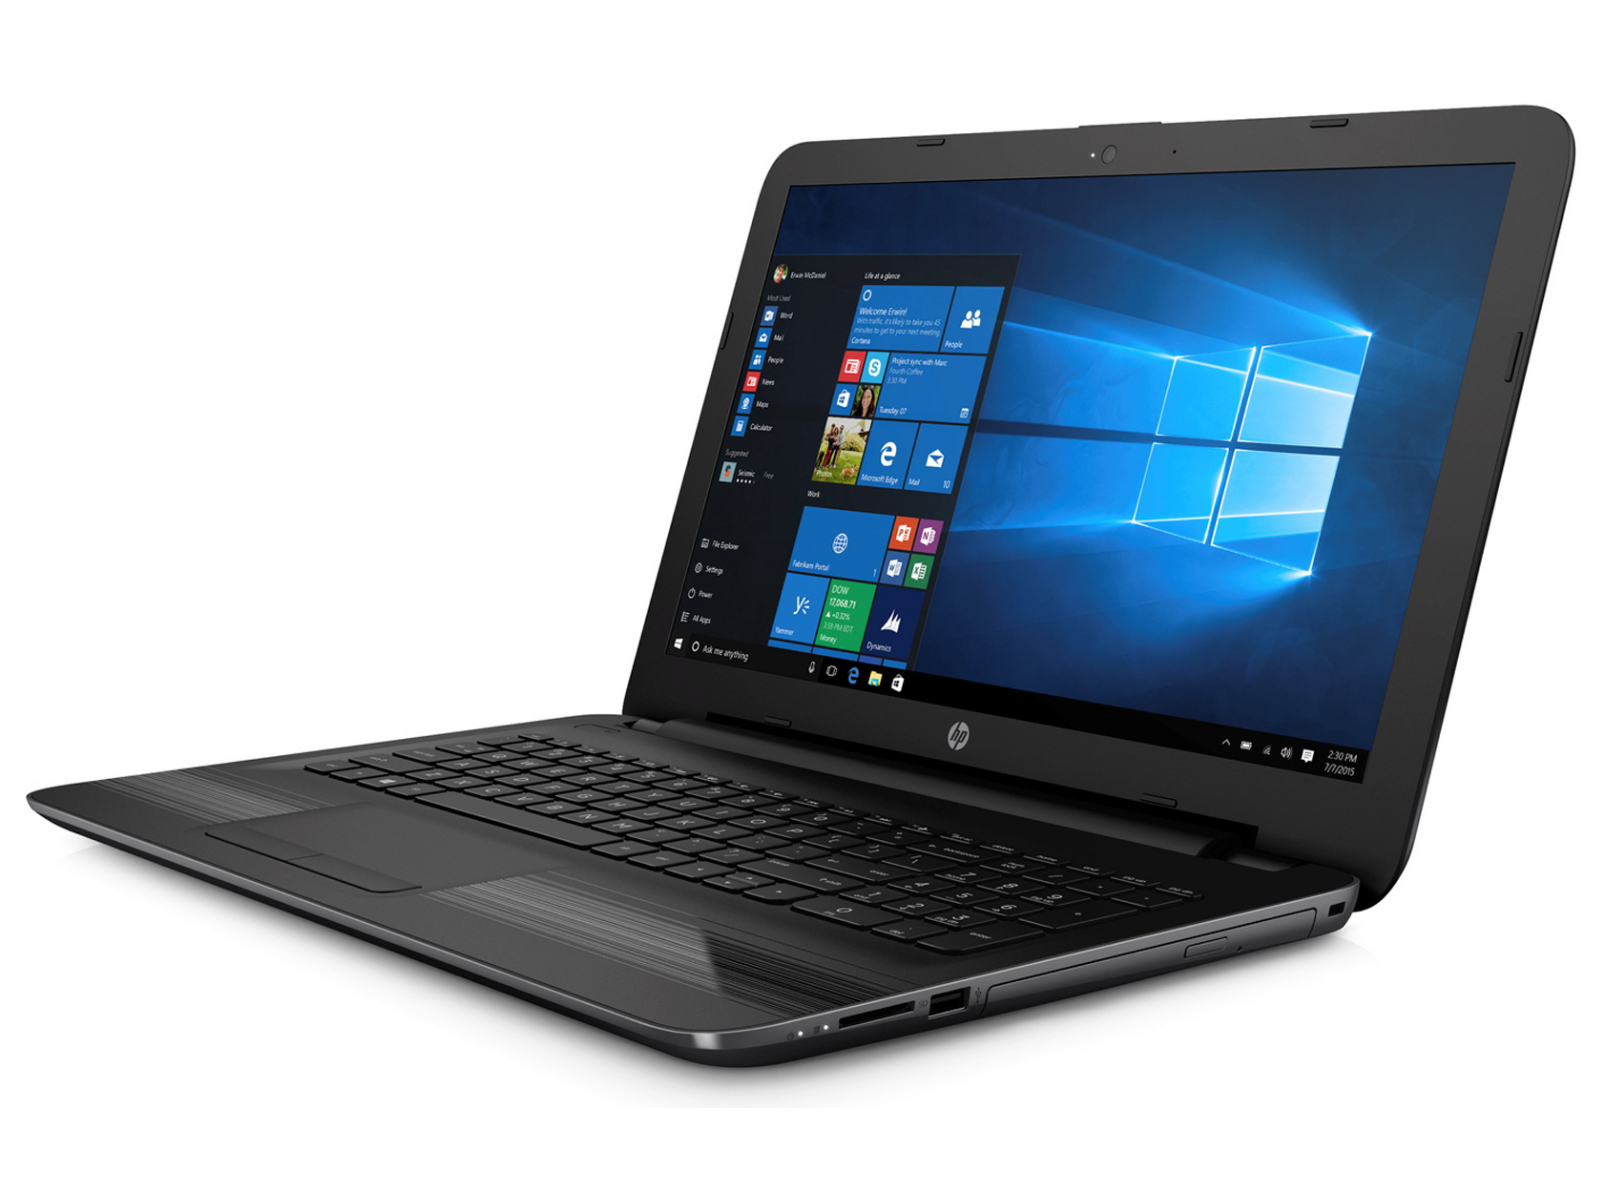
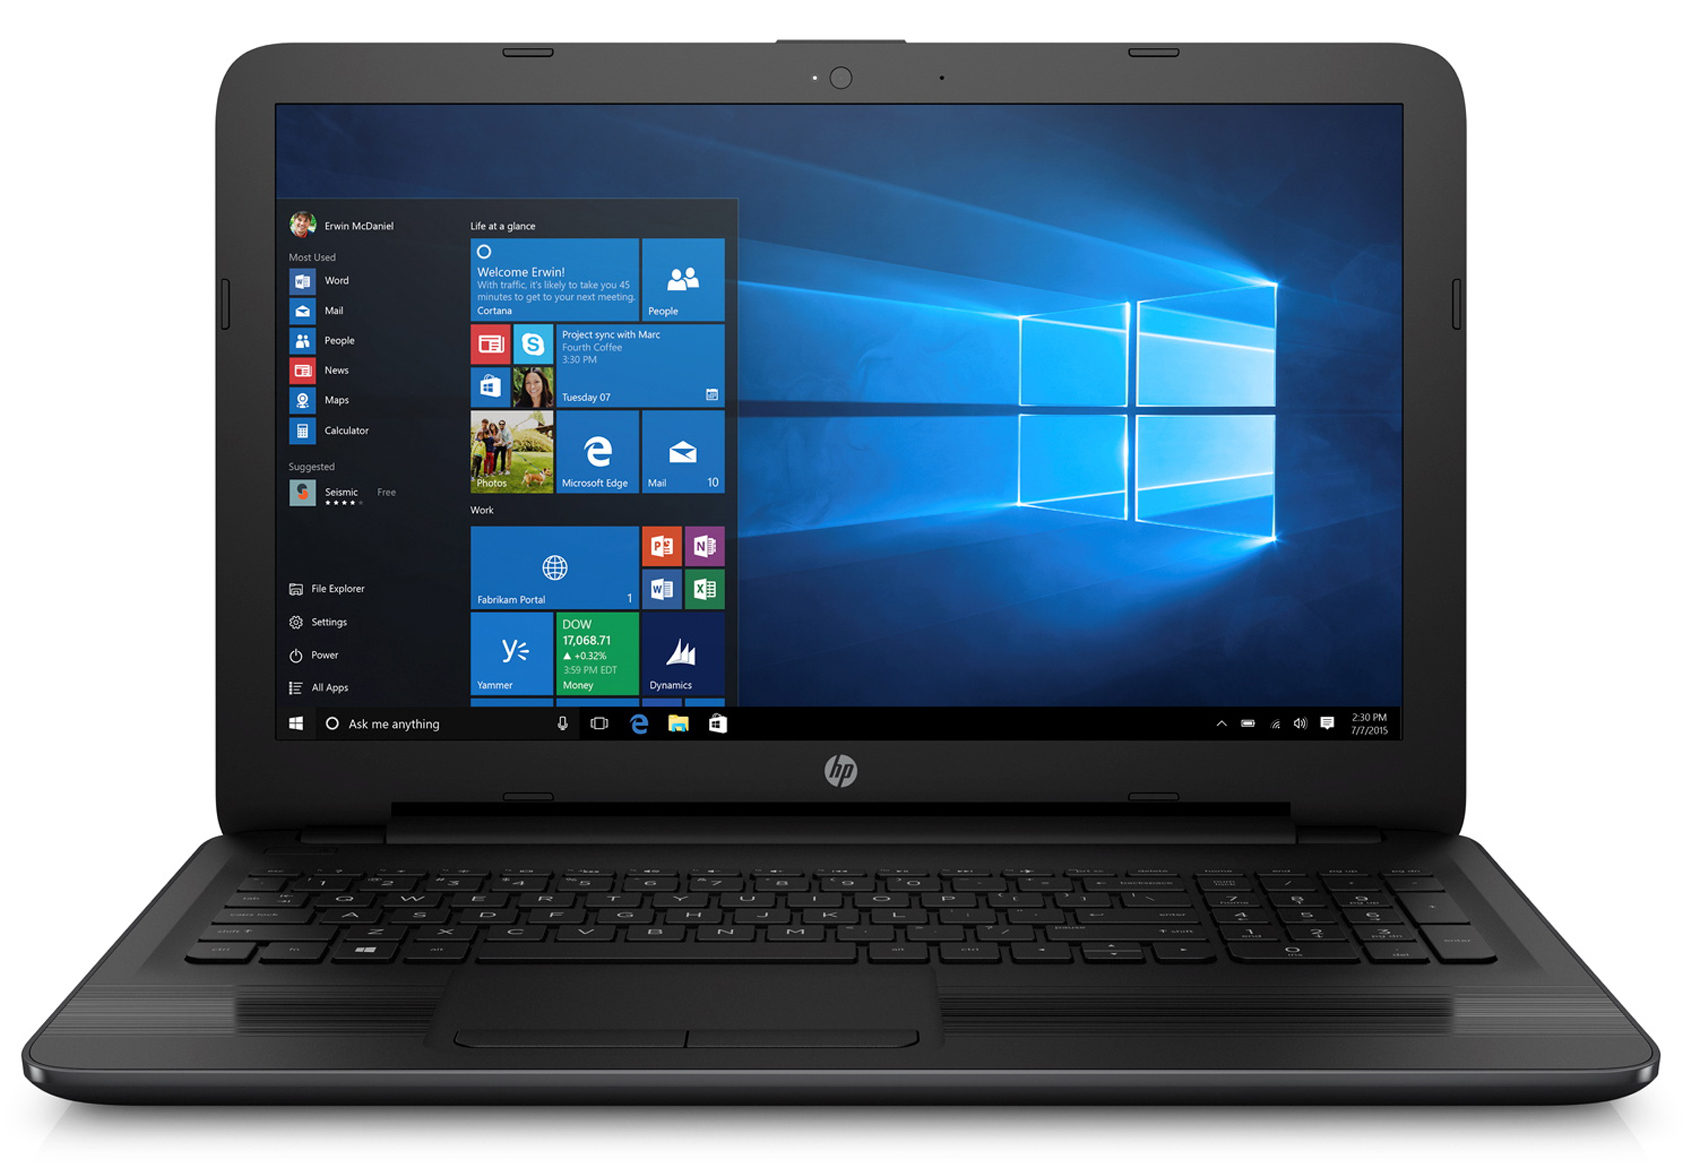
Breve Análise do Portátil HP 15-ba077ng

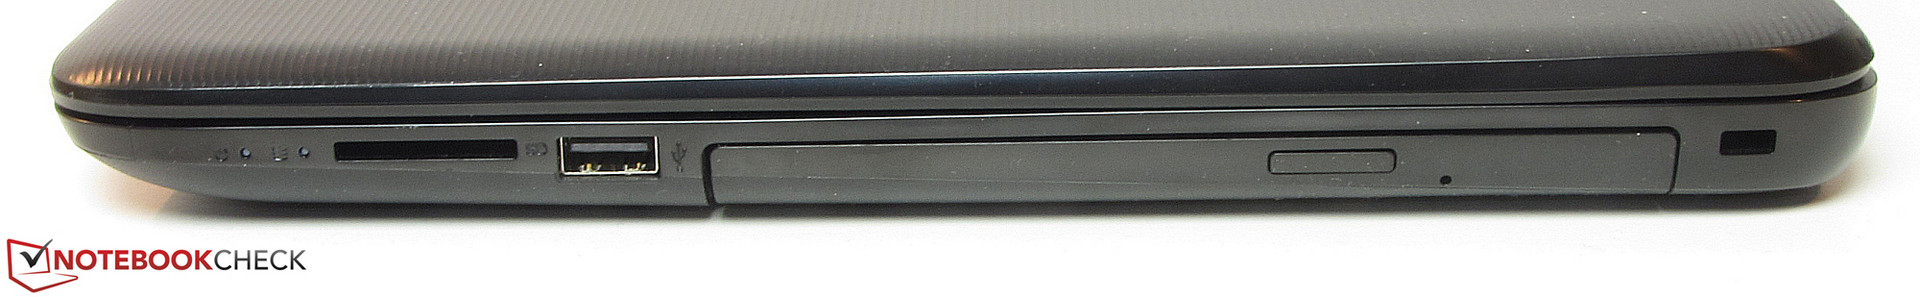
| SD Card Reader | |
| average JPG Copy Test (av. of 3 runs) | |
| HP Pavilion 15-aw004ng W8Y60EA | |
| Acer Aspire E15 E5-553G-109A | |
| HP 15-ba077ng | |
| HP 250 G5 SP X0N33EA | |
| Lenovo Ideapad 310-15IKB | |
| Dell Latitude 15-3570 | |
| HP 15-ay116ng | |
| Acer Aspire ES1-533-P7WA | |
| Asus F555UB-XO043T | |
| maximum AS SSD Seq Read Test (1GB) | |
| HP Pavilion 15-aw004ng W8Y60EA | |
| Acer Aspire E15 E5-553G-109A | |
| HP 15-ba077ng | |
| Acer Aspire ES1-533-P7WA | |
| HP 15-ay116ng | |
| Asus F555UB-XO043T | |
| Lenovo Ideapad 310-15IKB | |
| Dell Latitude 15-3570 | |
| Networking | |
| iperf3 transmit AX12 | |
| Acer Aspire E15 E5-553G-109A | |
| Acer Aspire ES1-533-P7WA | |
| HP 15-ba077ng | |
| iperf3 receive AX12 | |
| Acer Aspire E15 E5-553G-109A | |
| Acer Aspire ES1-533-P7WA | |
| HP 15-ba077ng | |
| iperf Server (receive) TCP 1 m | |
| Lenovo Ideapad 310-15IKB | |
| HP 250 G5 SP X0N33EA (jseb) | |
| HP Pavilion 15-aw004ng W8Y60EA | |
| HP 15-ay116ng (jseb) | |
| iperf Client (transmit) TCP 1 m | |
| Lenovo Ideapad 310-15IKB | |
| HP Pavilion 15-aw004ng W8Y60EA | |
| HP 250 G5 SP X0N33EA (jseb) | |
| HP 15-ay116ng (jseb) | |
| |||||||||||||||||||||||||
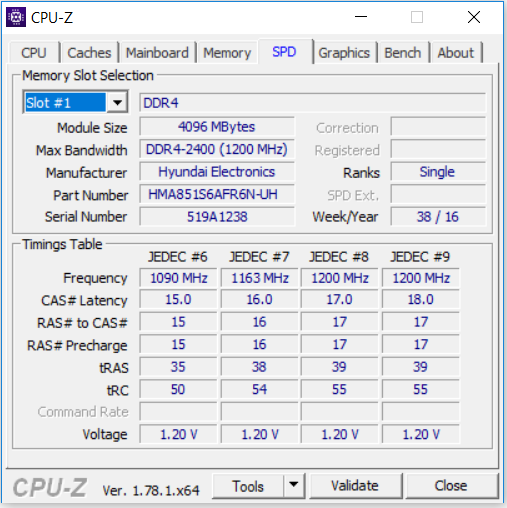
iluminação: 88 %
iluminação com acumulador: 209 cd/m²
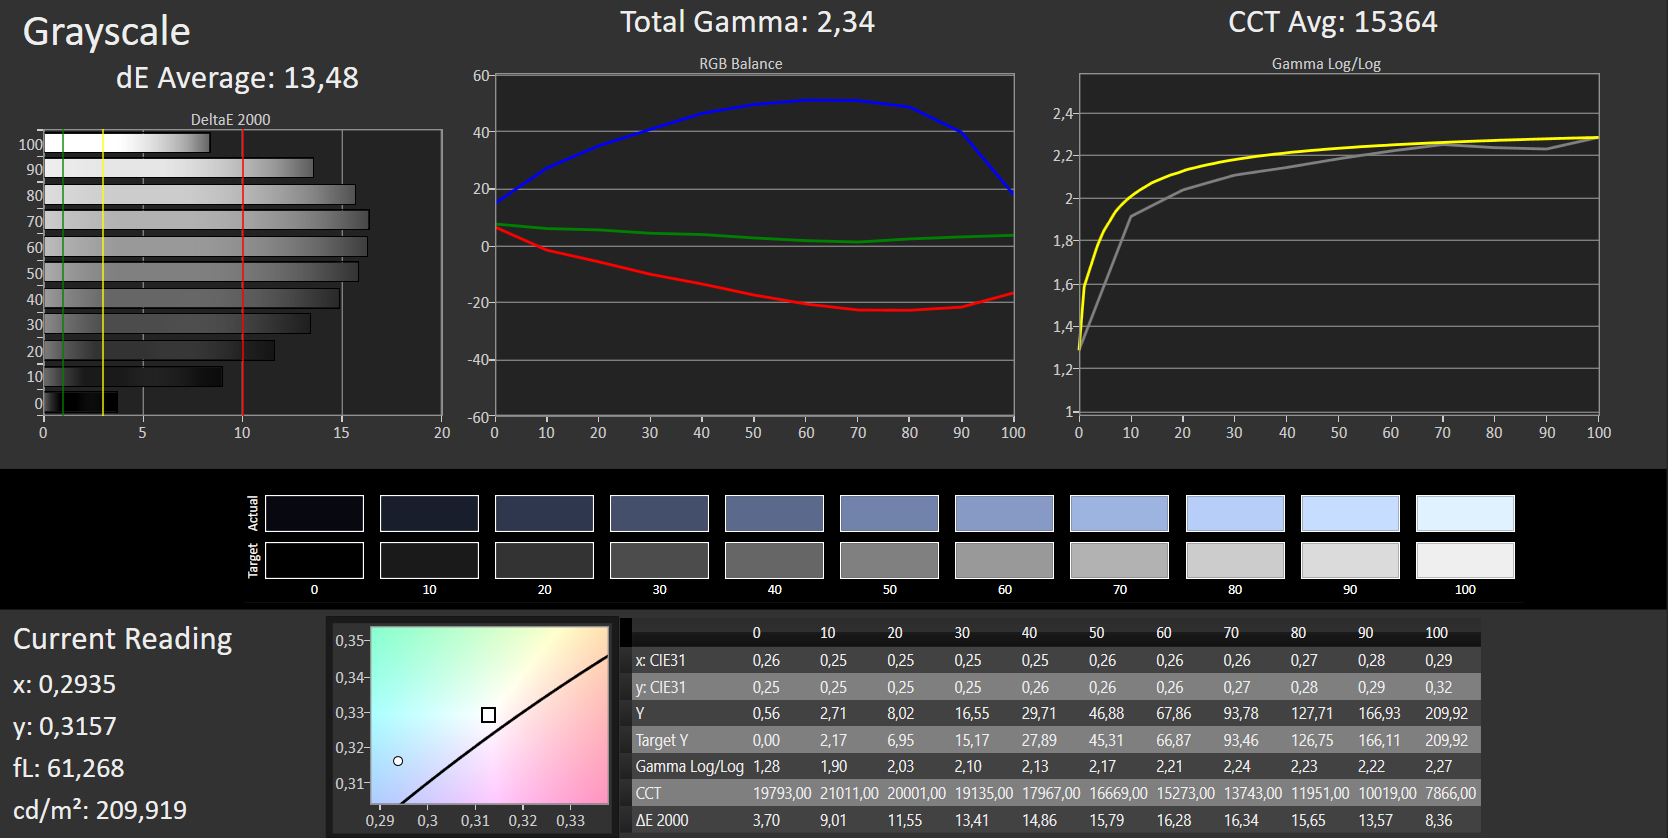
Contraste: 373:1 (Preto: 0.56 cd/m²)
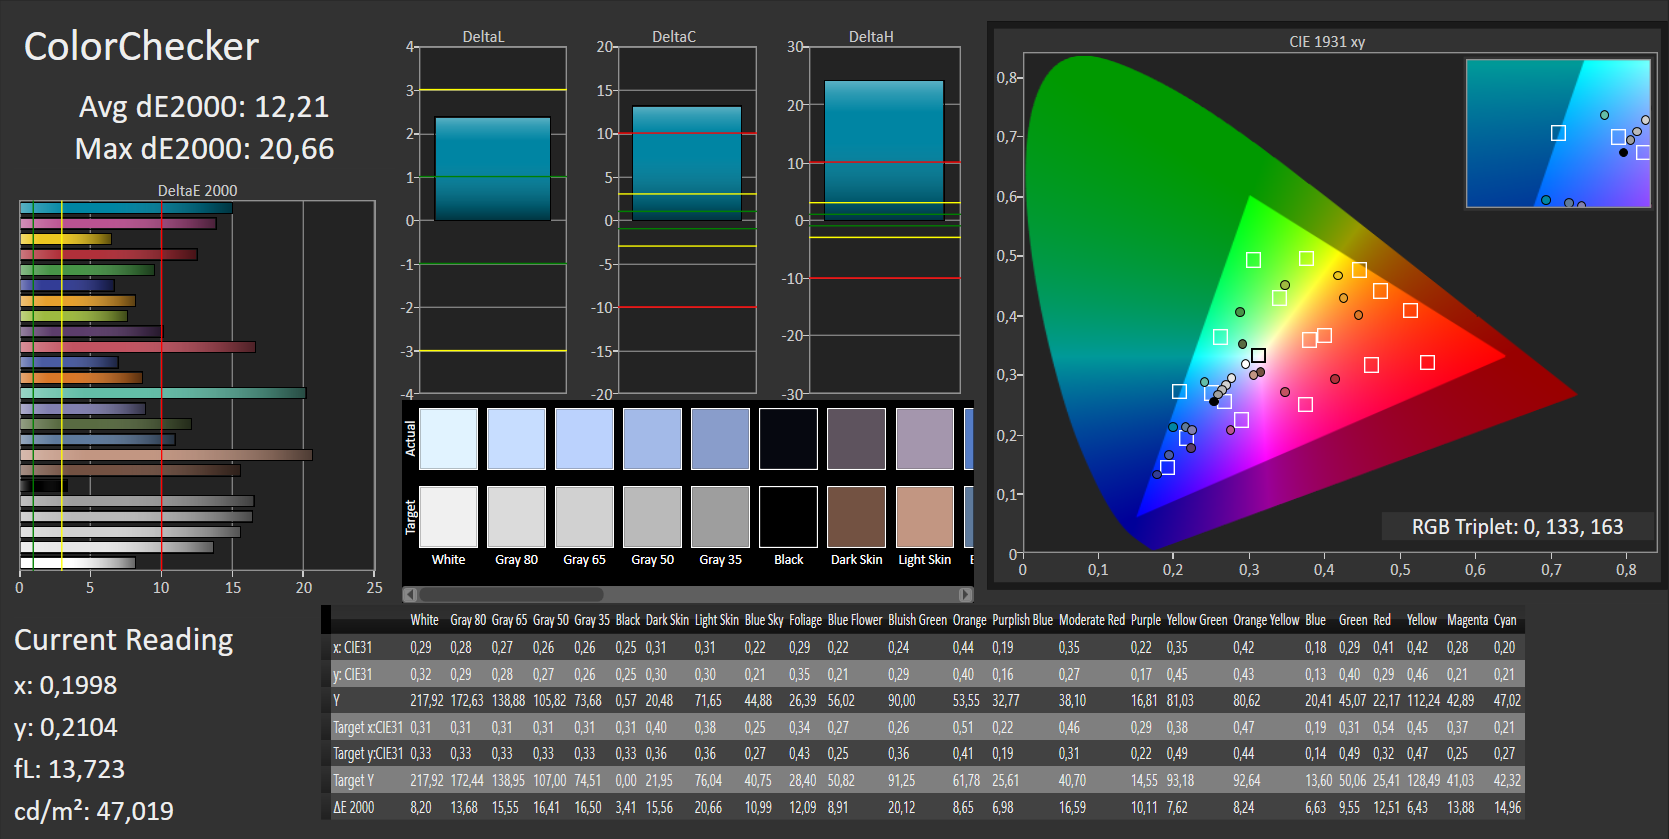
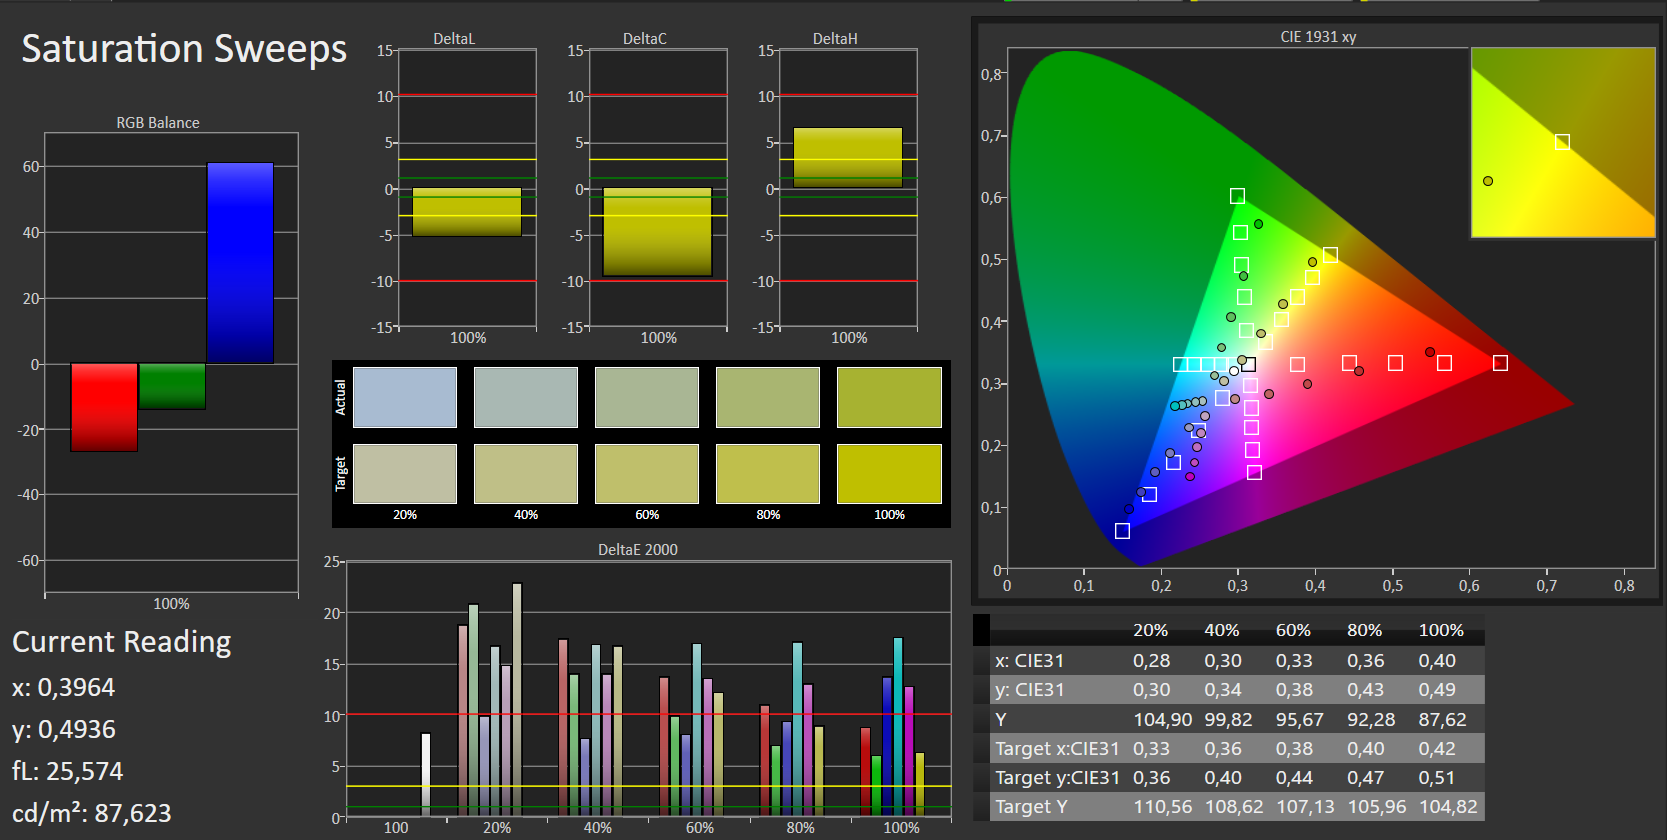
ΔE Color 12.21 | 0.5-29.43 Ø5
ΔE Greyscale 13.48 | 0.57-98 Ø5.3
60% sRGB (Argyll 1.6.3 3D)
38% AdobeRGB 1998 (Argyll 1.6.3 3D)
41.31% AdobeRGB 1998 (Argyll 2.2.0 3D)
60.2% sRGB (Argyll 2.2.0 3D)
39.98% Display P3 (Argyll 2.2.0 3D)
Gamma: 2.34
| HP 15-ba077ng TN LED, 1920x1080, 15.60 | Lenovo Ideapad 310-15IKB TN LED, 1920x1080, 15.60 | HP 15-ay116ng TN LED, 1920x1080, 15.60 | Asus F555UB-XO043T TN LED, 1366x768, 15.60 | Acer Aspire ES1-533-P7WA TN LED, 1920x1080, 15.60 | Acer Aspire E15 E5-553G-109A TN LED, 1920x1080, 15.60 | Dell Latitude 15-3570 TN LED, 1366x768, 15.60 | |
|---|---|---|---|---|---|---|---|
| Display | -5% | -7% | -4% | -5% | -1% | 2% | |
| Display P3 Coverage | 39.98 | 38.07 -5% | 37.34 -7% | 38.22 -4% | 38.04 -5% | 39.72 -1% | 40.61 2% |
| sRGB Coverage | 60.2 | 57.3 -5% | 56.2 -7% | 57.5 -4% | 57.2 -5% | 59.2 -2% | 61.1 1% |
| AdobeRGB 1998 Coverage | 41.31 | 39.34 -5% | 38.58 -7% | 39.49 -4% | 39.3 -5% | 41.07 -1% | 41.96 2% |
| Response Times | 2% | 0% | -11% | -4% | 19138% | -28% | |
| Response Time Grey 50% / Grey 80% * | 42 ? | 43 ? -2% | 40 ? 5% | 46 ? -10% | 43 ? -2% | 42.4 ? -1% | 37 ? 12% |
| Response Time Black / White * | 22 ? | 21 ? 5% | 23 ? -5% | 27 ? -23% | 23 ? -5% | 14.6 ? 34% | 37 ? -68% |
| PWM Frequency | 50 ? | 50 ? 0% | 28740 57380% | ||||
| Screen | 20% | 11% | 18% | -1% | 9% | -1% | |
| Brightness middle | 209 | 185 -11% | 249 19% | 214 2% | 201 -4% | 224 7% | 202 -3% |
| Brightness | 200 | 184 -8% | 234 17% | 205 3% | 202 1% | 201 1% | 211 6% |
| Brightness Distribution | 88 | 95 8% | 89 1% | 82 -7% | 92 5% | 75 -15% | 88 0% |
| Black Level * | 0.56 | 0.28 50% | 0.44 21% | 0.46 18% | 0.67 -20% | 0.46 18% | 0.62 -11% |
| Contrast | 373 | 661 77% | 566 52% | 465 25% | 300 -20% | 487 31% | 326 -13% |
| Colorchecker dE 2000 * | 12.21 | 8.07 34% | 11.71 4% | 6.52 47% | 10.36 15% | 10.5 14% | 12.35 -1% |
| Colorchecker dE 2000 max. * | 20.66 | 14.83 28% | 19.51 6% | 9.1 56% | 18.88 9% | 16.8 19% | 19.9 4% |
| Greyscale dE 2000 * | 13.48 | 8.83 34% | 13.13 3% | 7.05 48% | 11.06 18% | 11.23 17% | 13.46 -0% |
| Gamma | 2.34 94% | 2.47 89% | 2.57 86% | 2.41 91% | 2.56 86% | 2.12 104% | 2.44 90% |
| CCT | 15364 42% | 10628 61% | 15273 43% | 8623 75% | 11368 57% | 11096 59% | 15217 43% |
| Color Space (Percent of AdobeRGB 1998) | 38 | 36.2 -5% | 36 -5% | 36.6 -4% | 36 -5% | 38 0% | 39 3% |
| Color Space (Percent of sRGB) | 60 | 57 -5% | 56 -7% | 57.8 -4% | 57 -5% | 59 -2% | 61 2% |
| Total Average (Program / Settings) | 6% /
13% | 1% /
6% | 1% /
9% | -3% /
-2% | 6382% /
3594% | -9% /
-4% |
* ... smaller is better
Screen Flickering / PWM (Pulse-Width Modulation)
| Screen flickering / PWM detected | 50 Hz | ≤ 70 % brightness setting | 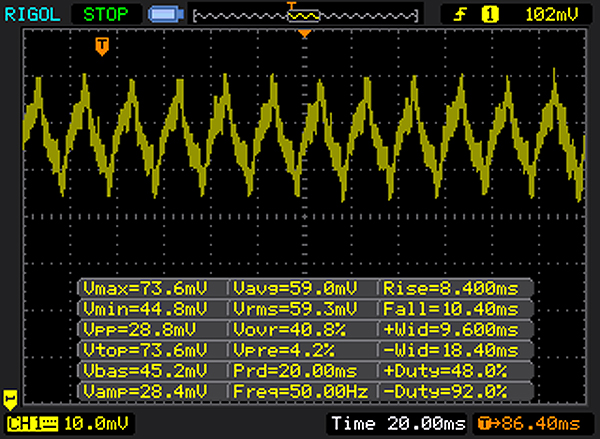 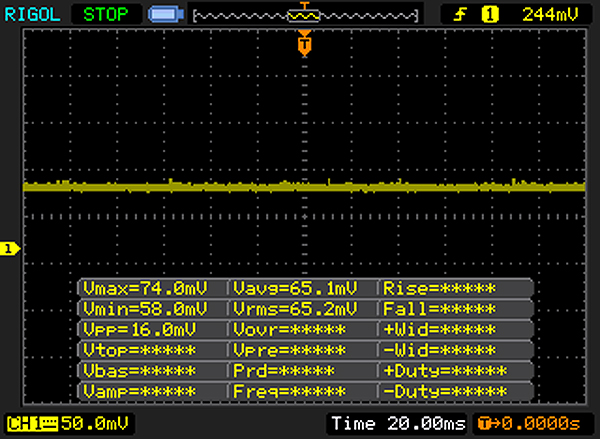 |
The display backlight flickers at 50 Hz (worst case, e.g., utilizing PWM) Flickering detected at a brightness setting of 70 % and below. There should be no flickering or PWM above this brightness setting. The frequency of 50 Hz is very low, so the flickering may cause eyestrain and headaches after extended use. In comparison: 53 % of all tested devices do not use PWM to dim the display. If PWM was detected, an average of 17915 (minimum: 5 - maximum: 3846000) Hz was measured. | |||
Display Response Times
| ↔ Response Time Black to White | ||
|---|---|---|
| 22 ms ... rise ↗ and fall ↘ combined | ↗ 6 ms rise | 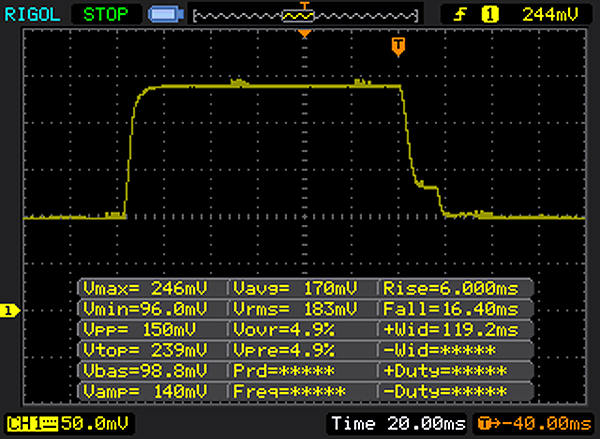 |
| ↘ 16 ms fall | ||
| The screen shows good response rates in our tests, but may be too slow for competitive gamers. In comparison, all tested devices range from 0.1 (minimum) to 240 (maximum) ms. » 42 % of all devices are better. This means that the measured response time is similar to the average of all tested devices (21.5 ms). | ||
| ↔ Response Time 50% Grey to 80% Grey | ||
| 42 ms ... rise ↗ and fall ↘ combined | ↗ 21 ms rise | 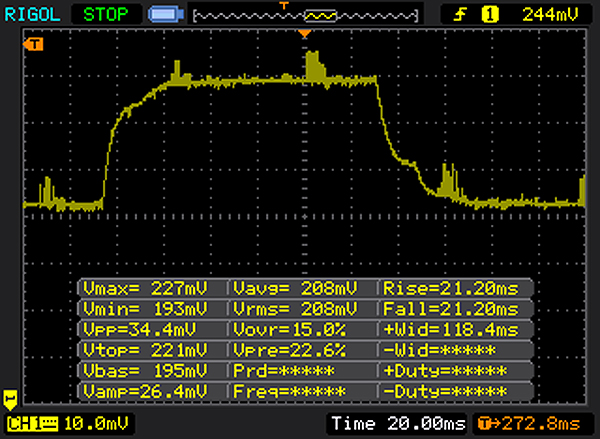 |
| ↘ 21 ms fall | ||
| The screen shows slow response rates in our tests and will be unsatisfactory for gamers. In comparison, all tested devices range from 0.2 (minimum) to 636 (maximum) ms. » 63 % of all devices are better. This means that the measured response time is worse than the average of all tested devices (33.7 ms). | ||
| Cinebench R15 | |
| CPU Single 64Bit | |
| Lenovo Ideapad 310-15IKB | |
| HP 15-ay116ng | |
| Dell Latitude 15-3570 | |
| Asus F555UB-XO043T | |
| Lenovo ThinkPad E560 20EV000MGE | |
| Asus F555LJ-XX110H | |
| HP 15-ba077ng | |
| Acer Aspire E15 E5-553G-109A | |
| Lenovo Ideapad 500-15ACZ | |
| Lenovo B50-70 MCC2GGE | |
| Acer Aspire ES1-533-P7WA | |
| CPU Multi 64Bit | |
| HP 15-ay116ng | |
| Lenovo Ideapad 310-15IKB | |
| Dell Latitude 15-3570 | |
| Asus F555UB-XO043T | |
| Lenovo ThinkPad E560 20EV000MGE | |
| Acer Aspire E15 E5-553G-109A | |
| HP 15-ba077ng | |
| Asus F555LJ-XX110H | |
| Lenovo Ideapad 500-15ACZ | |
| Lenovo B50-70 MCC2GGE | |
| Acer Aspire ES1-533-P7WA | |
| Cinebench R10 | |
| Rendering Multiple CPUs 32Bit | |
| HP 15-ay116ng | |
| Asus F555UB-XO043T | |
| Lenovo ThinkPad E560 20EV000MGE | |
| Asus F555LJ-XX110H | |
| HP 15-ba077ng | |
| Lenovo Ideapad 500-15ACZ | |
| Lenovo B50-70 MCC2GGE | |
| Acer Aspire ES1-533-P7WA | |
| Acer Aspire E15 E5-553G-109A | |
| Rendering Single 32Bit | |
| HP 15-ay116ng | |
| Asus F555UB-XO043T | |
| Lenovo ThinkPad E560 20EV000MGE | |
| Asus F555LJ-XX110H | |
| Lenovo B50-70 MCC2GGE | |
| HP 15-ba077ng | |
| Lenovo Ideapad 500-15ACZ | |
| Acer Aspire E15 E5-553G-109A | |
| Acer Aspire ES1-533-P7WA | |
| Geekbench 3 | |
| 32 Bit Single-Core Score | |
| HP 15-ay116ng | |
| Asus F555UB-XO043T | |
| Lenovo ThinkPad E560 20EV000MGE | |
| Asus F555LJ-XX110H | |
| Acer Aspire E15 E5-553G-109A | |
| HP 15-ba077ng | |
| Lenovo Ideapad 500-15ACZ | |
| Lenovo B50-70 MCC2GGE | |
| Acer Aspire ES1-533-P7WA | |
| 32 Bit Multi-Core Score | |
| HP 15-ay116ng | |
| Asus F555UB-XO043T | |
| Acer Aspire E15 E5-553G-109A | |
| HP 15-ba077ng | |
| Lenovo ThinkPad E560 20EV000MGE | |
| Acer Aspire ES1-533-P7WA | |
| Lenovo Ideapad 500-15ACZ | |
| Asus F555LJ-XX110H | |
| Lenovo B50-70 MCC2GGE | |
| Geekbench 4.0 | |
| 64 Bit Single-Core Score | |
| HP 15-ay116ng | |
| HP 15-ba077ng | |
| Acer Aspire ES1-533-P7WA | |
| 64 Bit Multi-Core Score | |
| HP 15-ay116ng | |
| HP 15-ba077ng | |
| Acer Aspire ES1-533-P7WA | |
| JetStream 1.1 - Total Score | |
| HP 15-ay116ng | |
| Lenovo Ideapad 310-15IKB | |
| Asus F555UB-XO043T | |
| HP 15-ba077ng | |
| Lenovo B50-70 MCC2GGE | |
| Lenovo Ideapad 500-15ACZ | |
| Lenovo ThinkPad E560 20EV000MGE | |
| Acer Aspire ES1-533-P7WA | |
| PCMark 7 Score | 4258 pontos | |
| PCMark 8 Home Score Accelerated v2 | 2777 pontos | |
| PCMark 8 Creative Score Accelerated v2 | 2413 pontos | |
| PCMark 8 Work Score Accelerated v2 | 2773 pontos | |
Ajuda | ||
| PCMark 8 | |
| Home Score Accelerated v2 | |
| Lenovo Ideapad 310-15IKB | |
| Dell Latitude 15-3570 | |
| HP 250 G5 SP X0N33EA | |
| HP 15-ay116ng | |
| Asus F555UB-XO043T | |
| Asus F555LJ-XX110H | |
| Lenovo ThinkPad E560 20EV000MGE | |
| HP Pavilion 15-aw004ng W8Y60EA | |
| Acer Aspire E15 E5-553G-109A | |
| Acer Aspire E5-552G-F62G | |
| HP 15-ba077ng | |
| Lenovo B50-70 MCC2GGE | |
| Acer Aspire ES1-533-P7WA | |
| Work Score Accelerated v2 | |
| HP 15-ay116ng | |
| Dell Latitude 15-3570 | |
| HP 250 G5 SP X0N33EA | |
| Asus F555UB-XO043T | |
| Lenovo ThinkPad E560 20EV000MGE | |
| HP Pavilion 15-aw004ng W8Y60EA | |
| Acer Aspire E15 E5-553G-109A | |
| Asus F555LJ-XX110H | |
| Acer Aspire E5-552G-F62G | |
| Lenovo B50-70 MCC2GGE | |
| HP 15-ba077ng | |

| HP 15-ba077ng SanDisk Z400s SD8SNAT-256G | HP 15-ay116ng Samsung CM871a MZNTY256HDHP | Asus F555UB-XO043T Seagate Momentus SpinPoint M8 ST1000LM024 | Acer Aspire ES1-533-P7WA Toshiba MQ01ABD100 | Acer Aspire E15 E5-553G-109A Liteonit CV3-8D128 | Dell Latitude 15-3570 Samsung CM871 MZNLF128HCHP | |
|---|---|---|---|---|---|---|
| CrystalDiskMark 3.0 | 62% | -88% | -89% | -4% | -37% | |
| Read Seq | 447.4 | 501 12% | 108.5 -76% | 107.6 -76% | 348.6 -22% | 453.2 1% |
| Write Seq | 243.3 | 483.9 99% | 106.2 -56% | 96.6 -60% | 311.8 28% | 137.7 -43% |
| Read 512 | 333.4 | 413.8 24% | 34.52 -90% | 22.5 -93% | 295.9 -11% | 308.5 -7% |
| Write 512 | 283.1 | 294.9 4% | 42.45 -85% | 24.23 -91% | 185.8 -34% | 134.1 -53% |
| Read 4k | 20.99 | 34.91 66% | 0.391 -98% | 0.474 -98% | 23.76 13% | 19.06 -9% |
| Write 4k | 62.7 | 95.7 53% | 0.855 -99% | 1.089 -98% | 44.94 -28% | 21.31 -66% |
| Read 4k QD32 | 143.1 | 370.9 159% | 0.774 -99% | 0.861 -99% | 171.6 20% | 93.5 -35% |
| Write 4k QD32 | 138 | 243.6 77% | 0.852 -99% | 0.991 -99% | 143.2 4% | 23.3 -83% |
| 3DMark 06 Standard Score | 7654 pontos | |
| 3DMark Vantage P Result | 5568 pontos | |
| 3DMark 11 Performance | 1881 pontos | |
| 3DMark Ice Storm Standard Score | 43345 pontos | |
| 3DMark Cloud Gate Standard Score | 5173 pontos | |
| 3DMark Fire Strike Score | 1096 pontos | |
| 3DMark Fire Strike Extreme Score | 521 pontos | |
| 3DMark Time Spy Score | 398 pontos | |
Ajuda | ||
| 3DMark 11 - 1280x720 Performance GPU | |
| Acer Aspire E5-552G-F62G | |
| Acer Aspire E15 E5-553G-109A | |
| HP Pavilion 15-aw004ng W8Y60EA | |
| Asus F555UB-XO043T | |
| HP 15-ba077ng | |
| MSI CX72-7QL | |
| Razer Blade Stealth QHD i7-7500U | |
| Acer Aspire E5-774-54HJ | |
| Lenovo Ideapad 310-15IKB | |
| HP 15-ay116ng | |
| Dell Latitude 15-3570 | |
| HP 250 G5 SP X0N33EA | |
| Acer Aspire ES1-533-P7WA | |
| 3DMark | |
| 1280x720 Cloud Gate Standard Graphics | |
| HP Pavilion 15-aw004ng W8Y60EA | |
| Acer Aspire E15 E5-553G-109A | |
| Acer Aspire E5-552G-F62G | |
| MSI CX72-7QL | |
| Asus F555UB-XO043T | |
| Razer Blade Stealth QHD i7-7500U | |
| HP 15-ba077ng | |
| Lenovo Ideapad 310-15IKB | |
| HP 15-ay116ng | |
| HP 250 G5 SP X0N33EA | |
| Dell Latitude 15-3570 | |
| 1920x1080 Fire Strike Graphics | |
| HP Pavilion 15-aw004ng W8Y60EA | |
| Acer Aspire E15 E5-553G-109A | |
| Asus F555UB-XO043T | |
| HP 15-ba077ng | |
| MSI CX72-7QL | |
| Razer Blade Stealth QHD i7-7500U | |
| Lenovo Ideapad 310-15IKB | |
| HP 15-ay116ng | |
| GFXBench | |
| on screen Car Chase Onscreen | |
| HP Pavilion 15-aw004ng W8Y60EA | |
| HP 15-ba077ng | |
| 1920x1080 Car Chase Offscreen | |
| HP Pavilion 15-aw004ng W8Y60EA | |
| HP 15-ba077ng | |
| GFXBench 3.1 | |
| on screen Manhattan ES 3.1 Onscreen | |
| HP 15-ba077ng | |
| HP Pavilion 15-aw004ng W8Y60EA | |
| 1920x1080 Manhattan ES 3.1 Offscreen | |
| HP Pavilion 15-aw004ng W8Y60EA | |
| HP 15-ba077ng | |
| GFXBench 3.0 | |
| on screen Manhattan Onscreen OGL | |
| HP 15-ba077ng | |
| HP Pavilion 15-aw004ng W8Y60EA | |
| 1920x1080 1080p Manhattan Offscreen | |
| HP Pavilion 15-aw004ng W8Y60EA | |
| HP 15-ba077ng | |
| GFXBench (DX / GLBenchmark) 2.7 | |
| T-Rex Onscreen | |
| HP Pavilion 15-aw004ng W8Y60EA | |
| HP 15-ba077ng | |
| 1920x1080 T-Rex Offscreen | |
| HP Pavilion 15-aw004ng W8Y60EA | |
| HP 15-ba077ng | |
| Geekbench 4.0 - Compute OpenCL Score | |
| HP 15-ba077ng | |
| HP 15-ay116ng | |
| Acer Aspire ES1-533-P7WA | |
| LuxMark v2.0 64Bit | |
| Sala GPUs-only | |
| HP Pavilion 15-aw004ng W8Y60EA | |
| MSI CX72-7QL | |
| HP 15-ba077ng | |
| Room GPUs-only | |
| HP Pavilion 15-aw004ng W8Y60EA | |
| MSI CX72-7QL | |
| HP 15-ba077ng | |
| baixo | média | alto | ultra | |
| Diablo III (2012) | 70 | 54.6 | 45.5 | 41.3 |
| Tomb Raider (2013) | 74.1 | 36.9 | 28.1 | 12.7 |
| BioShock Infinite (2013) | 60.9 | 37.8 | 32.6 | 10.7 |
| Battlefield 4 (2013) | 44.1 | 29.6 | 20.4 | 7.7 |
| Thief (2014) | 15.3 | 12.6 | 12.3 | |
| GRID: Autosport (2014) | 91.3 | 40.6 | 21.6 | |
| Sims 4 (2014) | 122.3 | 44.8 | 23.2 | |
| F1 2014 (2014) | 62 | 41 | 31 | |
| Dragon Age: Inquisition (2014) | 29.9 | 27.3 | 16.7 | |
| Battlefield Hardline (2015) | 37.7 | 32.1 | 12.9 | |
| GTA V (2015) | 41.5 | 38.1 | 10 | |
| Dirt Rally (2015) | 79 | 27.3 | 15.2 | |
| Metal Gear Solid V (2015) | 45.5 | 36.4 | 14.3 | |
| World of Warships (2015) | 47.1 | 35.4 | 20.9 | |
| Anno 2205 (2015) | 26.1 | 14.4 | 6.7 | |
| Star Wars Battlefront (2015) | 22.9 | 21.2 | 10.5 | |
| Rainbow Six Siege (2015) | 47.1 | 20.8 | 14.7 | |
| Rise of the Tomb Raider (2016) | 22.5 | 14.2 | 7.1 | |
| XCOM 2 (2016) | 18.4 | 6.9 | 4.9 | |
| Far Cry Primal (2016) | 15 | 9 | 8 | |
| Deus Ex Mankind Divided (2016) | 15.5 | 11.6 | 6.4 | |
| Battlefield 1 (2016) | 23.3 | 16.7 | 8.3 | |
| Civilization VI (2016) | 30.5 | 14.6 | 7.6 | |
| Farming Simulator 17 (2016) | 63.2 | 47.5 | 22 | |
| Titanfall 2 (2016) | 34 | 30.3 | 10.5 |
| BioShock Infinite - 1280x720 Very Low Preset | |
| Asus F555UB-XO043T | |
| HP Pavilion 15-aw004ng W8Y60EA | |
| MSI CX72-7QL | |
| HP 15-ba077ng | |
| Lenovo Ideapad 310-15IKB | |
| Acer Aspire E5-774-54HJ | |
| HP 15-ay116ng | |
| HP 250 G5 SP X0N33EA | |
| Acer Aspire ES1-533-P7WA | |
| Tomb Raider - 1024x768 Low Preset | |
| HP Pavilion 15-aw004ng W8Y60EA | |
| HP 15-ba077ng | |
| HP 15-ay116ng | |
| Battlefield 4 - 1024x768 Low Preset | |
| MSI CX72-7QL | |
| HP Pavilion 15-aw004ng W8Y60EA | |
| HP 15-ba077ng | |
| Acer Aspire E5-552G-F62G | |
| HP 15-ay116ng | |
| HP 250 G5 SP X0N33EA | |
| Sims 4 - 1024x768 Low Preset | |
| MSI CX72-7QL | |
| Razer Blade Stealth QHD i7-7500U | |
| HP 15-ba077ng | |
| Diablo III - 1366x768 Medium / low | |
| MSI CX72-7QL | |
| HP 15-ba077ng | |
| Titanfall 2 - 1280x720 Low / Disabled AF:Trilinear | |
| Acer Aspire E5-774-54HJ | |
| HP 15-ba077ng | |
| Battlefield 1 - 1280x720 Low Preset | |
| Acer Aspire E15 E5-553G-109A | |
| Acer Aspire E5-774-54HJ | |
| HP 15-ba077ng | |
| World of Warships - 1366x768 Low Preset AF:Trilinear | |
| MSI CX72-7QL | |
| Razer Blade Stealth QHD i7-7500U | |
| HP 15-ba077ng | |
Barulho
| Ocioso |
| 31.5 / 31.8 / 31.8 dB |
| DVD |
| 37.2 / dB |
| Carga |
| 31.4 / 33.4 dB |
 | ||
30 dB silencioso 40 dB(A) audível 50 dB(A) ruidosamente alto |
||
min: | ||
| HP 15-ba077ng A12-9700P, Radeon R7 (Bristol Ridge) | Lenovo Ideapad 310-15IKB i5-7200U, HD Graphics 620 | HP 15-ay116ng i5-7200U, HD Graphics 620 | Acer Aspire E15 E5-553G-109A A12-9700P, Radeon R8 M445DX | HP Pavilion 15-aw004ng W8Y60EA A10-9600P, Radeon R8 M445DX | Asus F555UB-XO043T 6200U, GeForce 940M | Dell Latitude 15-3570 6200U, HD Graphics 520 | |
|---|---|---|---|---|---|---|---|
| Noise | -3% | -3% | -1% | -10% | -16% | -1% | |
| off / environment * | 30.6 | 29 5% | 30.5 -0% | 30.5 -0% | 31.2 -2% | 31 -1% | |
| Idle Minimum * | 31.5 | 30.6 3% | 31.3 1% | 31.4 -0% | 31.7 -1% | 34 -8% | 31 2% |
| Idle Average * | 31.8 | 30.6 4% | 31.3 2% | 31.4 1% | 31.9 -0% | 34 -7% | 31 3% |
| Idle Maximum * | 31.8 | 30.6 4% | 31.3 2% | 31.9 -0% | 31.9 -0% | 34.2 -8% | 31 3% |
| Load Average * | 31.4 | 36.8 -17% | 35.6 -13% | 33.7 -7% | 41 -31% | 38.9 -24% | 34.2 -9% |
| Load Maximum * | 33.4 | 38.2 -14% | 36.15 -8% | 33.8 -1% | 42.7 -28% | 43.6 -31% | 34.3 -3% |
| Witcher 3 ultra * | 40.6 |
* ... smaller is better
(+) The maximum temperature on the upper side is 34.8 °C / 95 F, compared to the average of 34.2 °C / 94 F, ranging from 21.2 to 62.5 °C for the class Office.
(+) The bottom heats up to a maximum of 38.3 °C / 101 F, compared to the average of 36.7 °C / 98 F
(+) In idle usage, the average temperature for the upper side is 22.4 °C / 72 F, compared to the device average of 29.5 °C / 85 F.
(+) The palmrests and touchpad are reaching skin temperature as a maximum (34 °C / 93.2 F) and are therefore not hot.
(-) The average temperature of the palmrest area of similar devices was 27.7 °C / 81.9 F (-6.3 °C / -11.3 F).
| HP 15-ba077ng A12-9700P, Radeon R7 (Bristol Ridge) | Lenovo Ideapad 310-15IKB i5-7200U, HD Graphics 620 | HP 15-ay116ng i5-7200U, HD Graphics 620 | Acer Aspire E15 E5-553G-109A A12-9700P, Radeon R8 M445DX | HP Pavilion 15-aw004ng W8Y60EA A10-9600P, Radeon R8 M445DX | Asus F555UB-XO043T 6200U, GeForce 940M | Acer Aspire ES1-533-P7WA Pentium N4200, HD Graphics 505 | Dell Latitude 15-3570 6200U, HD Graphics 520 | |
|---|---|---|---|---|---|---|---|---|
| Heat | -6% | 1% | -25% | -7% | -13% | -11% | -26% | |
| Maximum Upper Side * | 34.8 | 34.1 2% | 33.8 3% | 36.8 -6% | 33.4 4% | 33.2 5% | 33.3 4% | 36.1 -4% |
| Maximum Bottom * | 38.3 | 35.6 7% | 36.6 4% | 56.5 -48% | 32.9 14% | 44 -15% | 39.4 -3% | 47 -23% |
| Idle Upper Side * | 23.2 | 26.7 -15% | 23.6 -2% | 27.1 -17% | 27.7 -19% | 28.2 -22% | 27.3 -18% | 31.7 -37% |
| Idle Bottom * | 23.3 | 27 -16% | 23.8 -2% | 29.8 -28% | 29.4 -26% | 28.1 -21% | 29.2 -25% | 32.9 -41% |
* ... smaller is better
HP 15-ba077ng audio analysis
(±) | speaker loudness is average but good (74 dB)
Bass 100 - 315 Hz
(-) | nearly no bass - on average 28.4% lower than median
(±) | linearity of bass is average (12.3% delta to prev. frequency)
Mids 400 - 2000 Hz
(+) | balanced mids - only 2.7% away from median
(±) | linearity of mids is average (8.1% delta to prev. frequency)
Highs 2 - 16 kHz
(+) | balanced highs - only 3.8% away from median
(+) | highs are linear (6.6% delta to prev. frequency)
Overall 100 - 16.000 Hz
(±) | linearity of overall sound is average (22.4% difference to median)
Compared to same class
» 55% of all tested devices in this class were better, 10% similar, 35% worse
» The best had a delta of 7%, average was 22%, worst was 53%
Compared to all devices tested
» 60% of all tested devices were better, 6% similar, 33% worse
» The best had a delta of 4%, average was 25%, worst was 134%
Apple MacBook 12 (Early 2016) 1.1 GHz audio analysis
(+) | speakers can play relatively loud (83.6 dB)
Bass 100 - 315 Hz
(±) | reduced bass - on average 11.3% lower than median
(±) | linearity of bass is average (14.2% delta to prev. frequency)
Mids 400 - 2000 Hz
(+) | balanced mids - only 2.4% away from median
(+) | mids are linear (5.5% delta to prev. frequency)
Highs 2 - 16 kHz
(+) | balanced highs - only 2% away from median
(+) | highs are linear (4.5% delta to prev. frequency)
Overall 100 - 16.000 Hz
(+) | overall sound is linear (10.2% difference to median)
Compared to same class
» 5% of all tested devices in this class were better, 2% similar, 93% worse
» The best had a delta of 5%, average was 19%, worst was 53%
Compared to all devices tested
» 3% of all tested devices were better, 1% similar, 96% worse
» The best had a delta of 4%, average was 25%, worst was 134%
| desligado | |
| Ocioso | |
| Carga |
|
| HP 15-ba077ng A12-9700P, Radeon R7 (Bristol Ridge) | Lenovo Ideapad 310-15IKB i5-7200U, HD Graphics 620 | HP 15-ay116ng i5-7200U, HD Graphics 620 | Acer Aspire E15 E5-553G-109A A12-9700P, Radeon R8 M445DX | HP Pavilion 15-aw004ng W8Y60EA A10-9600P, Radeon R8 M445DX | Asus F555UB-XO043T 6200U, GeForce 940M | Acer Aspire ES1-533-P7WA Pentium N4200, HD Graphics 505 | Dell Latitude 15-3570 6200U, HD Graphics 520 | |
|---|---|---|---|---|---|---|---|---|
| Power Consumption | 2% | 16% | -62% | -37% | -21% | 5% | 5% | |
| Idle Minimum * | 4.4 | 3.5 20% | 3.2 27% | 7.2 -64% | 5.5 -25% | 4.7 -7% | 5.3 -20% | 4.9 -11% |
| Idle Average * | 6.8 | 6.1 10% | 6.3 7% | 10.3 -51% | 8.2 -21% | 6.5 4% | 8.8 -29% | 7.2 -6% |
| Idle Maximum * | 8.9 | 7 21% | 7.4 17% | 11.9 -34% | 9.5 -7% | 6.8 24% | 9.7 -9% | 7.5 16% |
| Load Average * | 30.9 | 31.2 -1% | 24 22% | 48.2 -56% | 44.5 -44% | 42.7 -38% | 18 42% | 25.4 18% |
| Load Maximum * | 31 | 42.9 -38% | 29 6% | 63 -103% | 58 -87% | 59 -90% | 18.2 41% | 28 10% |
| Witcher 3 ultra * | 51.8 |
* ... smaller is better
| HP 15-ba077ng A12-9700P, Radeon R7 (Bristol Ridge), 41 Wh | Lenovo Ideapad 310-15IKB i5-7200U, HD Graphics 620, 30 Wh | HP 15-ay116ng i5-7200U, HD Graphics 620, 41 Wh | Acer Aspire E15 E5-553G-109A A12-9700P, Radeon R8 M445DX, 40 Wh | HP 250 G5 SP X0N33EA 6200U, HD Graphics 520, 41 Wh | HP Pavilion 15-aw004ng W8Y60EA A10-9600P, Radeon R8 M445DX, 41 Wh | Asus F555UB-XO043T 6200U, GeForce 940M, 37 Wh | Acer Aspire ES1-533-P7WA Pentium N4200, HD Graphics 505, 36 Wh | Dell Latitude 15-3570 6200U, HD Graphics 520, 65 Wh | |
|---|---|---|---|---|---|---|---|---|---|
| Battery Runtime | -20% | 24% | -37% | 5% | -19% | 20% | 8% | 58% | |
| Reader / Idle | 742 | 612 -18% | 869 17% | 358 -52% | 634 -15% | 560 -25% | 1024 38% | ||
| H.264 | 278 | 430 55% | 313 13% | 194 -30% | |||||
| WiFi v1.3 | 296 | 230 -22% | 412 39% | 257 -13% | 347 17% | 260 -12% | 355 20% | 321 8% | 542 83% |
| Load | 103 | 81 -21% | 87 -16% | 55 -47% | 109 6% | 95 -8% | 157 52% |
Pro
Contra
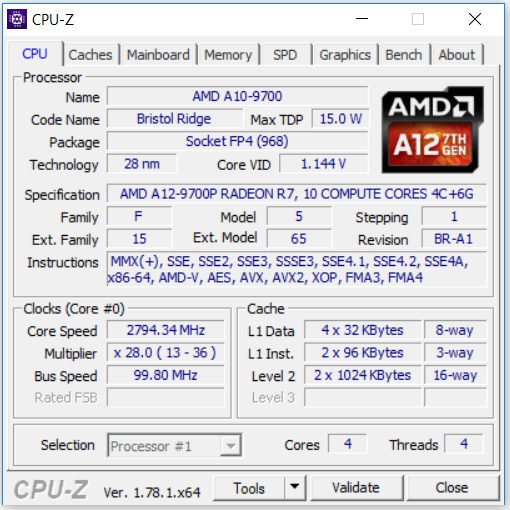
A APU instalada da AMD fornece poder de computação mais do que suficiente para aplicativos de escritório e Internet. Além disso, ela permite jogar condicionalmente jogos de computador que não são muito exigentes com o hardware ou que são um pouco mais antigos no mercado. O portátil não produz muito ruído durante todo o uso intenso e quase não esquenta.
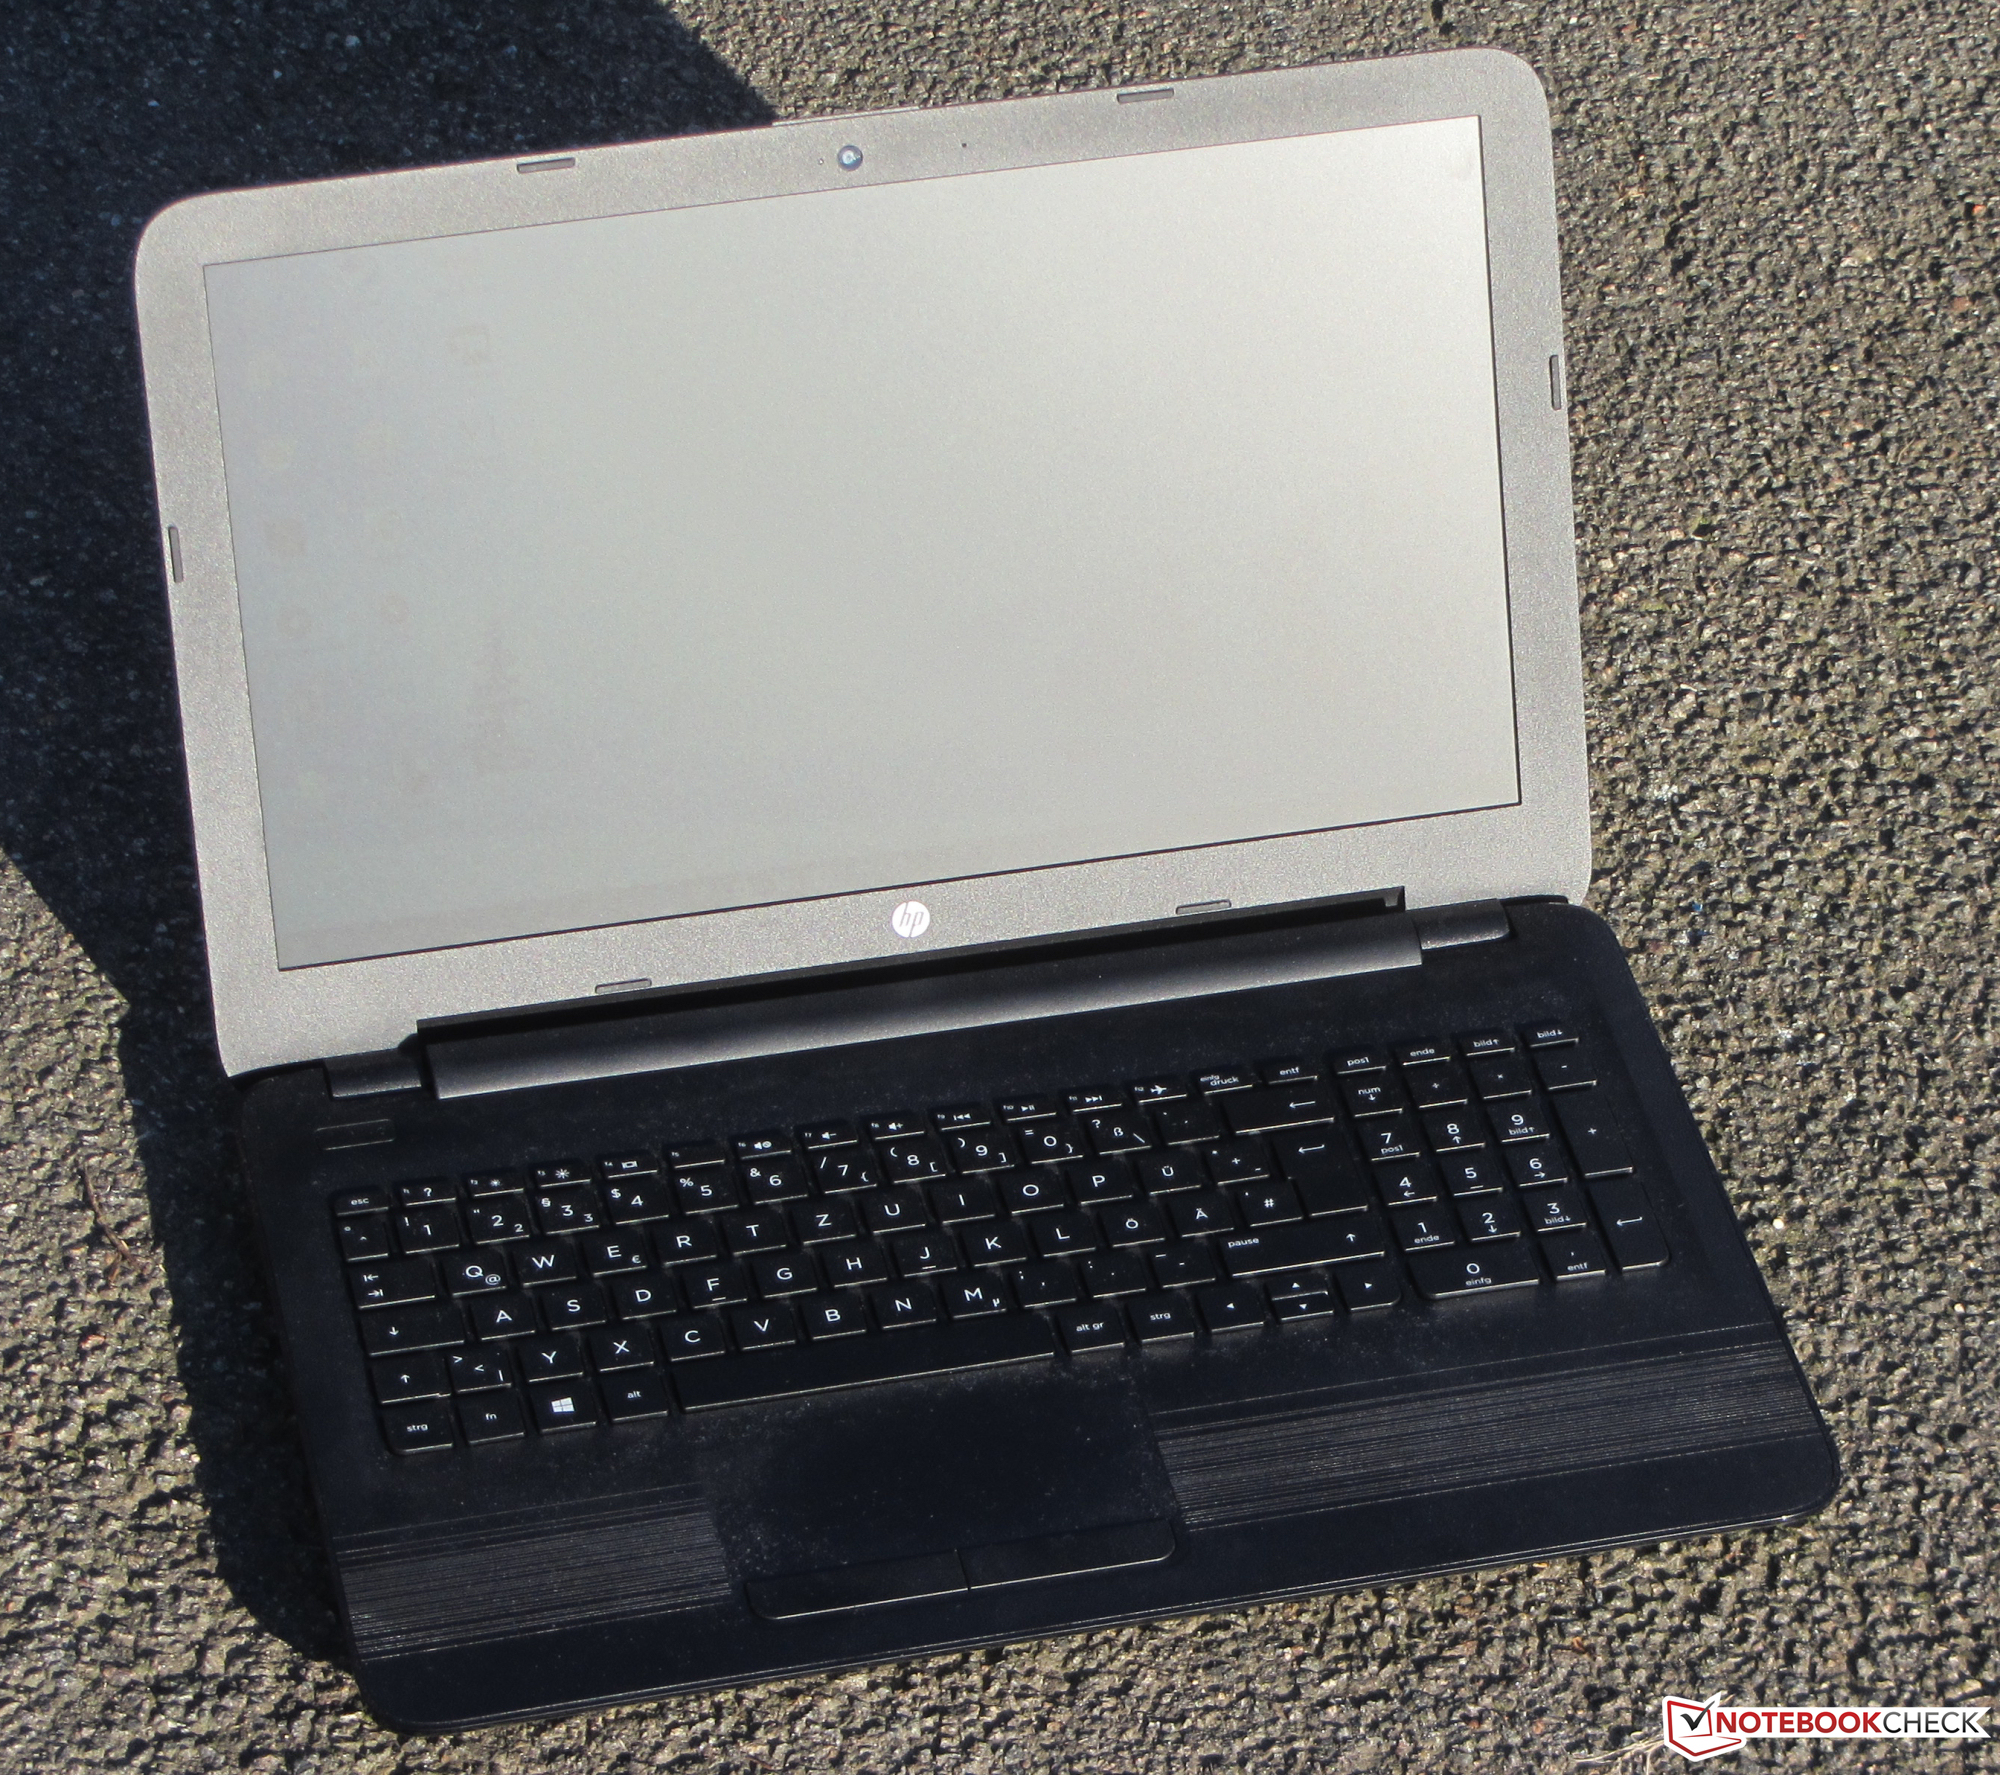
A HP entrega um acessível portátil para home-office com o 15-ba077ng.
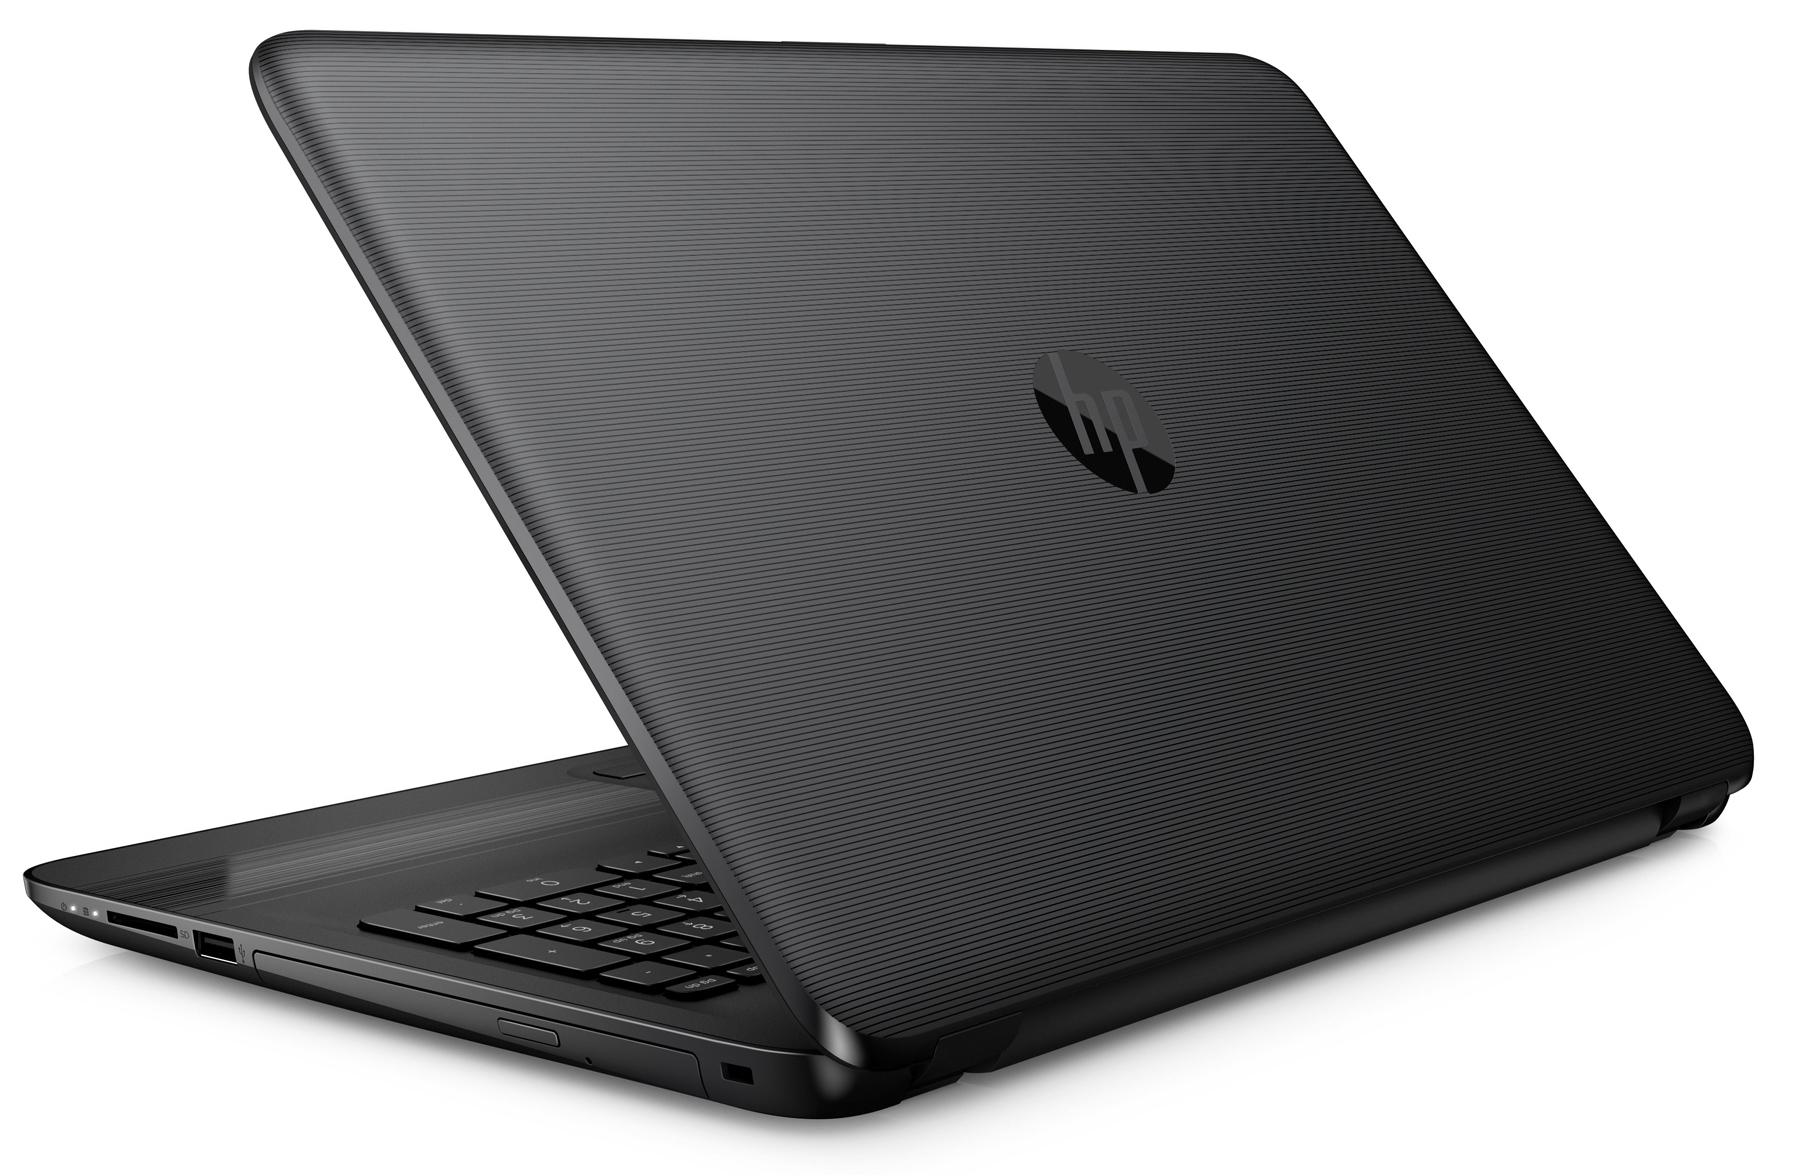
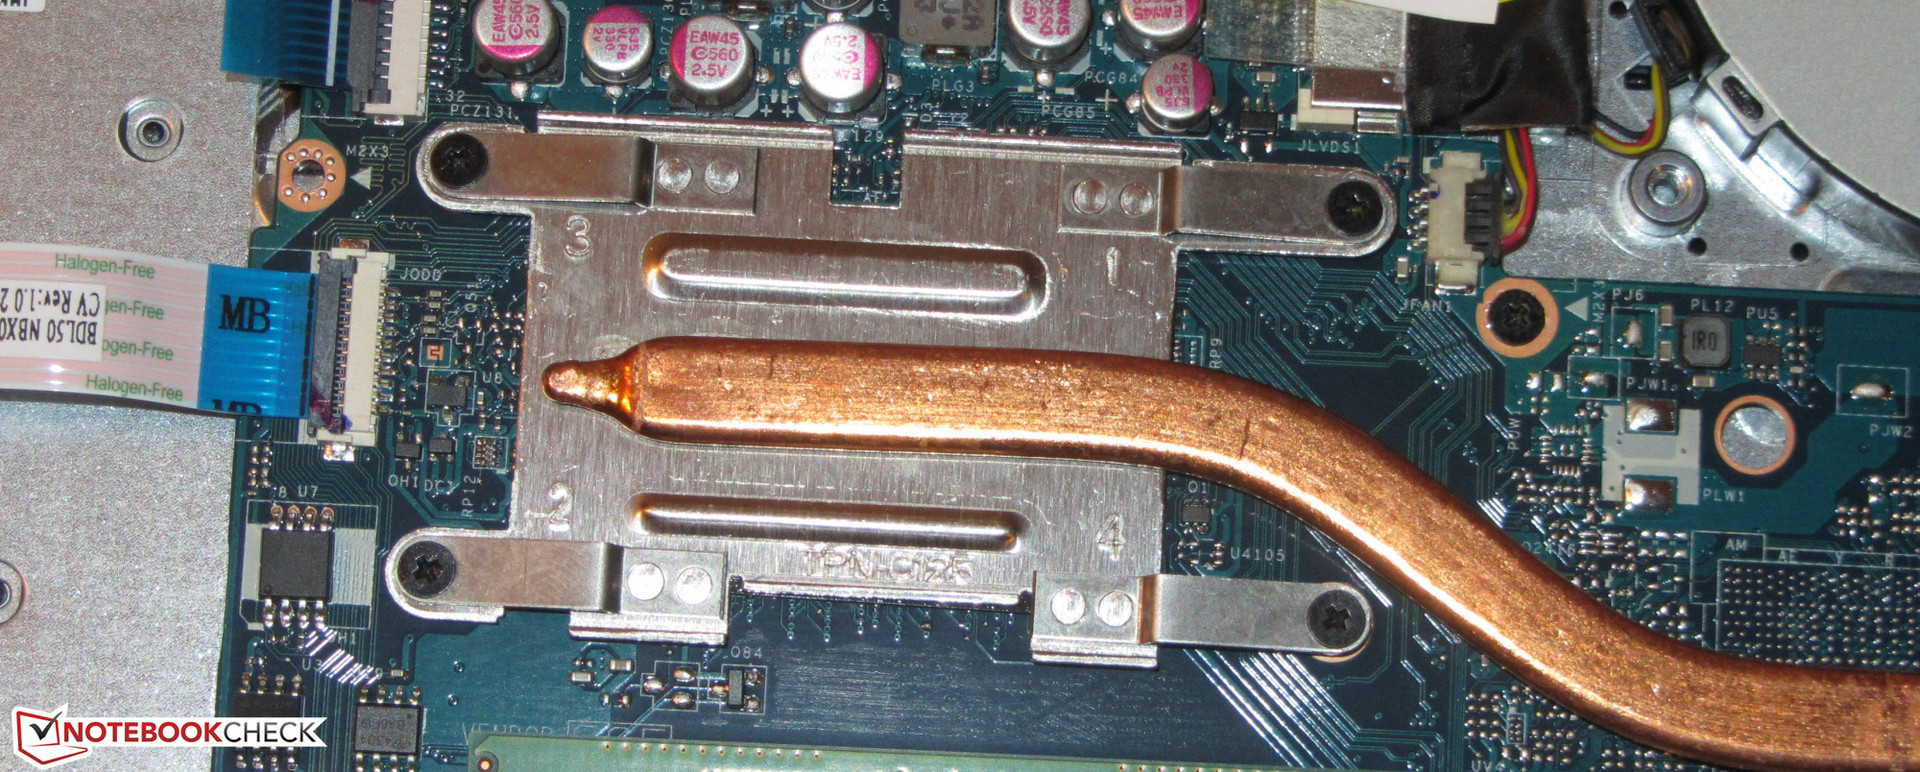
Um veloz SSD garante um sistema fluente. O SSD pode ser substituído, mas a carcaça teria que ser aberta para isto. O portátil não tem uma escotilha de manutenção. O teclado instalado e a medíocre duração da bateria atendem os requerimentos para o uso doméstico. O painel Full HD mate não emocionará a ninguém; é escura, com baixo contraste, e dependente dos ângulos de visão.
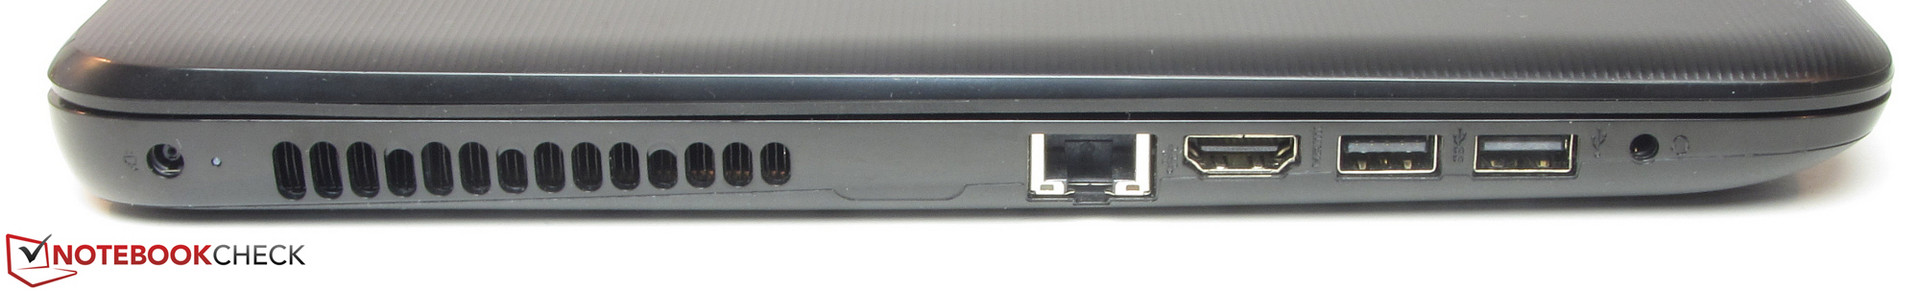
Os massivos recortes que a HP fez não são visíveis a primeira vista. A faixa de preços de aproximadamente 450 Euros (~$482) é notória. A HP inclui apenas uma ano de garantia onde outros fabricantes oferecem dois anos de garantia pelos seus aparelhos de baixo custo. Um módulo Wi-Fi que suporta o veloz padrão ac e um Gigabit Ethernet foram fornecidos. A HP somente fornece uma veloz porta Ethernet. O HP 15 também não consegue servir com uma porta USB Type-C. Para adicionar isso, a tela exibe PWM flickering em apenas 50 Hz no modo bateria (não no modo AC).
O diversos testes e benchmarks que realizamos mostram muito claramente por que os portáteis baseados em APUs AMD somente tem algumas chances no mercado quando são oferecidos com um preço muito inferior que os da concorrência da Intel: O desempenho dos processadores AMD é mais fraco enquanto precisam de mais energia. Este último resulta em uma duração de bateria muito mais curta. O desempenho um pouco superior da iGPU Radeon não traz vantagem alguma para o usuários no uso rotineiro. A AMD terá que fazer um "home run" com sues novos APUs Ryzen apara equilibrar as coisas com a Intel e se voltar a ser relevante no setor de portáteis.
HP 15-ba077ng
-
01/23/2017 v6(old)
Sascha Mölck