 Deutsch
 English
 Español
 Français
 Italiano
 Nederlands
 Polski
 Português
 Русский
 Türkçe
 Svenska
 Chinese
 Magyar
Breve Análise do Portátil HP Pavilion 15-aw004ng
| SD Card Reader | |
| average JPG Copy Test (av. of 3 runs) | |
| Toshiba Satellite L50-C-275 | |
| HP Pavilion 15-aw004ng W8Y60EA | |
| Lenovo Ideapad 500-15ACZ | |
| Lenovo Ideapad 310-15ISK | |
| Asus F555UB-XO043T | |
| Acer Aspire E5-552G-F62G | |
| maximum AS SSD Seq Read Test (1GB) | |
| Toshiba Satellite L50-C-275 | |
| HP Pavilion 15-aw004ng W8Y60EA | |
| Lenovo Ideapad 500-15ACZ | |
| Lenovo Ideapad 310-15ISK | |
| Asus F555UB-XO043T | |
| Acer Aspire E5-552G-F62G | |
| Networking | |
| iperf Server (receive) TCP 1 m | |
| Lenovo Ideapad 310-15ISK | |
| HP Pavilion 15-aw004ng W8Y60EA | |
| iperf Client (transmit) TCP 1 m | |
| Lenovo Ideapad 310-15ISK | |
| HP Pavilion 15-aw004ng W8Y60EA | |
| |||||||||||||||||||||||||
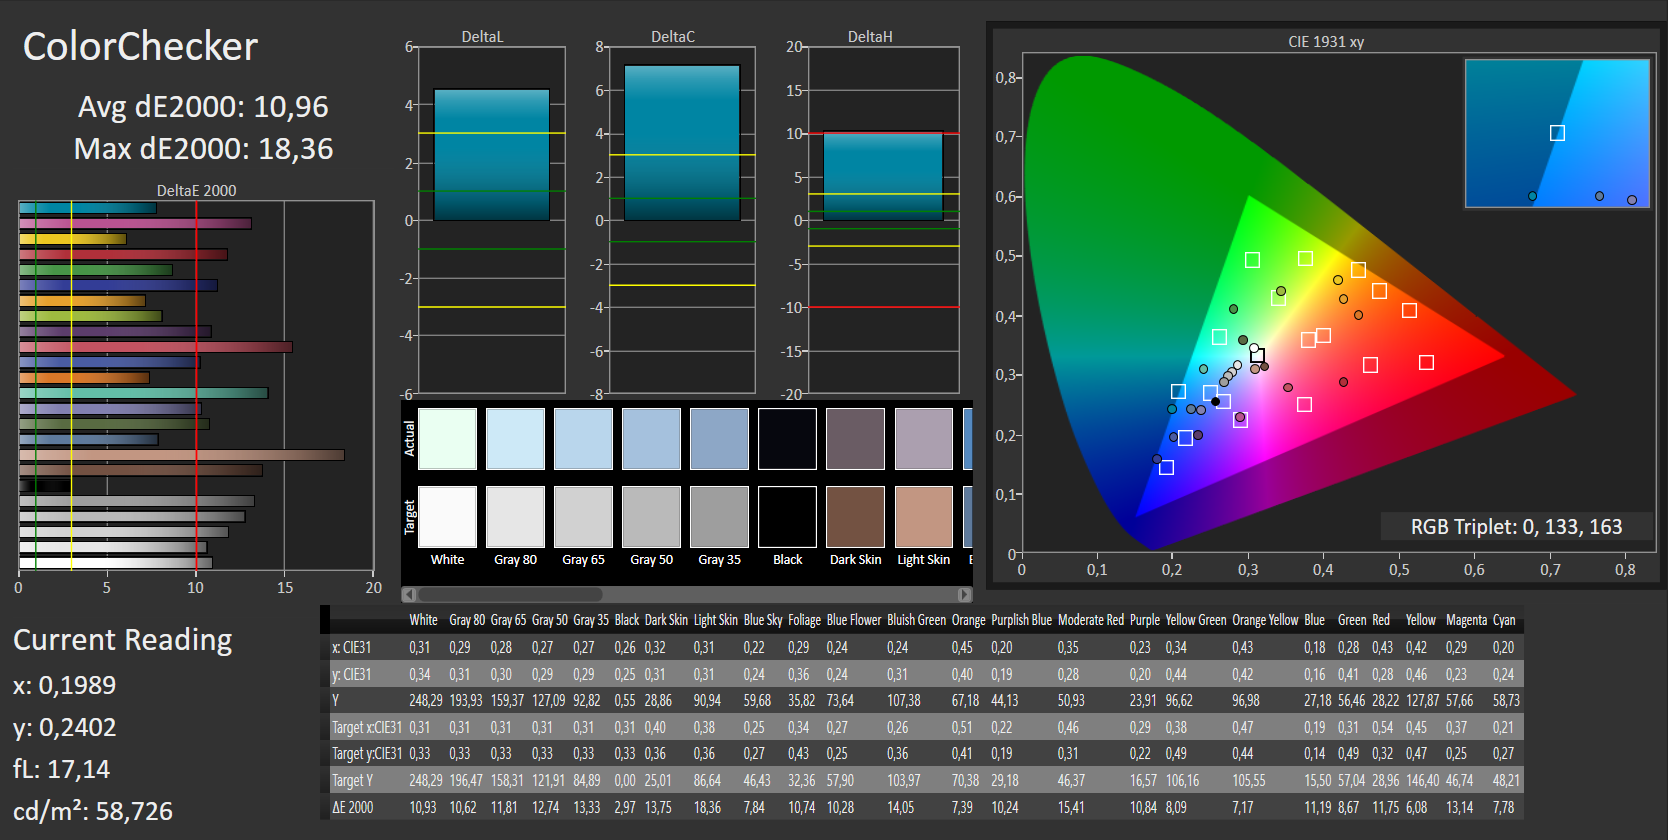
iluminação: 89 %
iluminação com acumulador: 139 cd/m²
Contraste: 490:1 (Preto: 0.49 cd/m²)
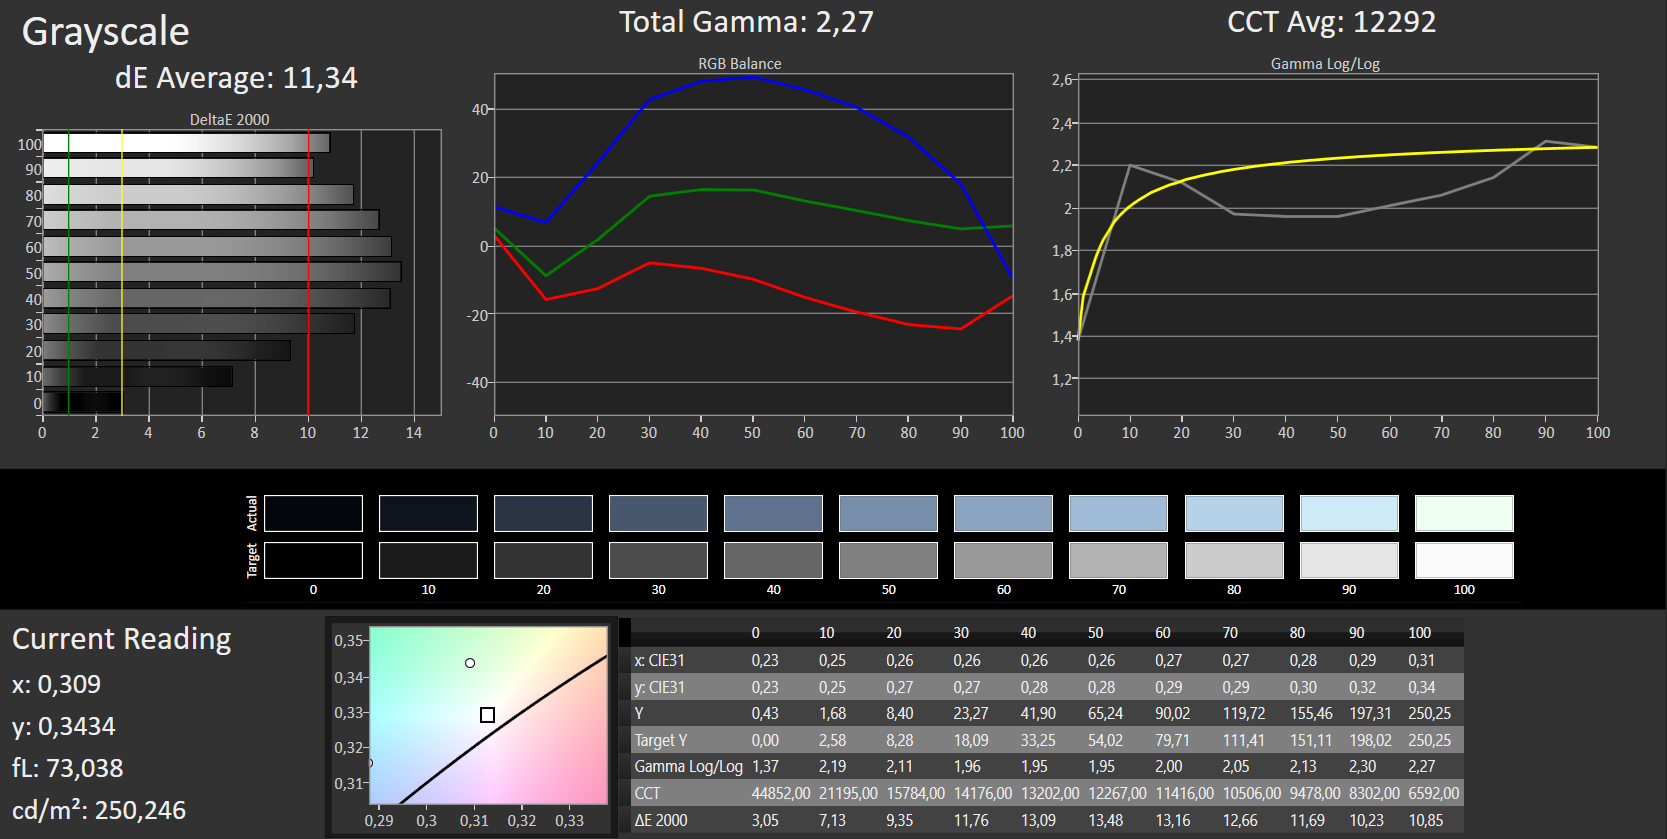
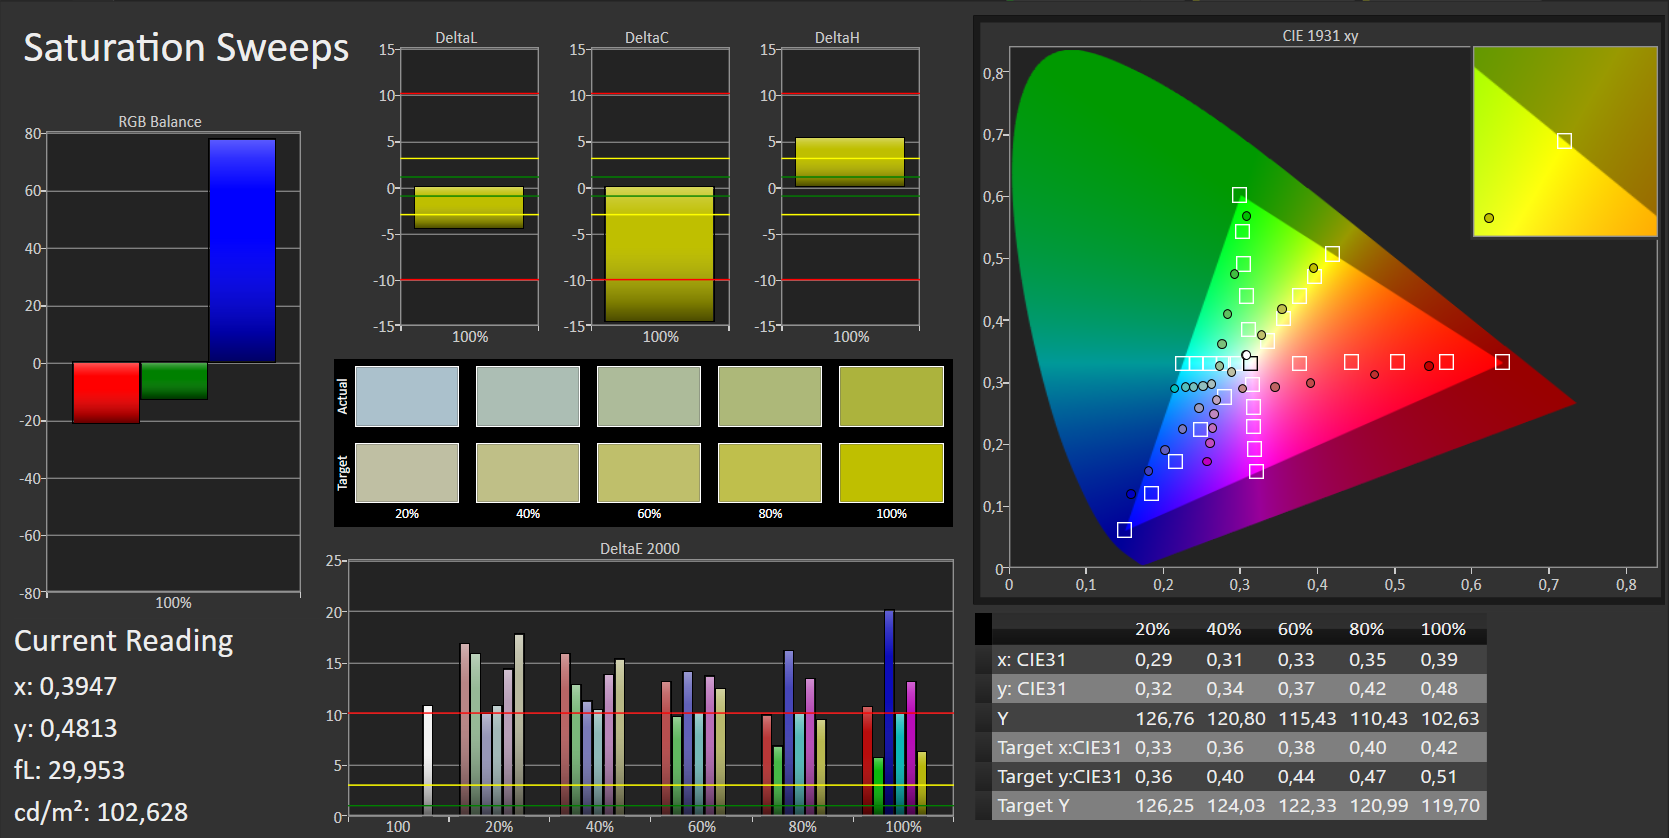
ΔE Color 10.96 | 0.5-29.43 Ø5
ΔE Greyscale 11.34 | 0.57-98 Ø5.3
60% sRGB (Argyll 1.6.3 3D)
39% AdobeRGB 1998 (Argyll 1.6.3 3D)
41.71% AdobeRGB 1998 (Argyll 2.2.0 3D)
60.3% sRGB (Argyll 2.2.0 3D)
40.35% Display P3 (Argyll 2.2.0 3D)
Gamma: 2.27
| HP Pavilion 15-aw004ng W8Y60EA TN LED, 1920x1080 | Acer Aspire E5-552G-F62G TN LED, 1920x1080 | Lenovo Ideapad 500-15ACZ TN LED, 1920x1080 | Toshiba Satellite L50-C-275 IPS, 1920x1080 | Asus F555UB-XO043T TN LED, 1366x768 | Lenovo Ideapad 310-15ISK TN LED, 1366x768 | |
|---|---|---|---|---|---|---|
| Display | -8% | -1% | 47% | -5% | -8% | |
| Display P3 Coverage | 40.35 | 37.13 -8% | 39.82 -1% | 64.1 59% | 38.22 -5% | 37.06 -8% |
| sRGB Coverage | 60.3 | 55.9 -7% | 59.7 -1% | 82.9 37% | 57.5 -5% | 55.8 -7% |
| AdobeRGB 1998 Coverage | 41.71 | 38.36 -8% | 41.16 -1% | 60.6 45% | 39.49 -5% | 38.29 -8% |
| Response Times | -3% | -5% | 25% | -15% | 19% | |
| Response Time Grey 50% / Grey 80% * | 41 ? | 45 ? -10% | 43 ? -5% | 24 ? 41% | 46 ? -12% | 27 ? 34% |
| Response Time Black / White * | 23 ? | 22 ? 4% | 24 ? -4% | 21 ? 9% | 27 ? -17% | 22 ? 4% |
| PWM Frequency | 50 ? | 50 ? | 50 ? | |||
| Screen | -3% | -3% | 46% | 9% | 5% | |
| Brightness middle | 240 | 200 -17% | 238 -1% | 294 23% | 214 -11% | 200 -17% |
| Brightness | 228 | 196 -14% | 221 -3% | 285 25% | 205 -10% | 198 -13% |
| Brightness Distribution | 89 | 76 -15% | 84 -6% | 83 -7% | 82 -8% | 83 -7% |
| Black Level * | 0.49 | 0.34 31% | 0.49 -0% | 0.26 47% | 0.46 6% | 0.28 43% |
| Contrast | 490 | 588 20% | 486 -1% | 1131 131% | 465 -5% | 714 46% |
| Colorchecker dE 2000 * | 10.96 | 11.54 -5% | 11.19 -2% | 5.07 54% | 6.52 41% | 10.63 3% |
| Colorchecker dE 2000 max. * | 18.36 | 19.36 -5% | 19.6 -7% | 9.33 49% | 9.1 50% | 15.69 15% |
| Greyscale dE 2000 * | 11.34 | 12.98 -14% | 11.53 -2% | 4.25 63% | 7.05 38% | 11.19 1% |
| Gamma | 2.27 97% | 2.58 85% | 2.41 91% | 2.49 88% | 2.41 91% | 1.78 124% |
| CCT | 12292 53% | 14060 46% | 13057 50% | 6597 99% | 8623 75% | 11258 58% |
| Color Space (Percent of AdobeRGB 1998) | 39 | 36 -8% | 38 -3% | 54 38% | 36.6 -6% | 35 -10% |
| Color Space (Percent of sRGB) | 60 | 56 -7% | 60 0% | 83 38% | 57.8 -4% | 56 -7% |
| Total Average (Program / Settings) | -5% /
-4% | -3% /
-2% | 39% /
43% | -4% /
3% | 5% /
5% |
* ... smaller is better
Screen Flickering / PWM (Pulse-Width Modulation)
| Screen flickering / PWM not detected | ||
In comparison: 53 % of all tested devices do not use PWM to dim the display. If PWM was detected, an average of 17900 (minimum: 5 - maximum: 3846000) Hz was measured. | ||
Display Response Times
| ↔ Response Time Black to White | ||
|---|---|---|
| 23 ms ... rise ↗ and fall ↘ combined | ↗ 10 ms rise | 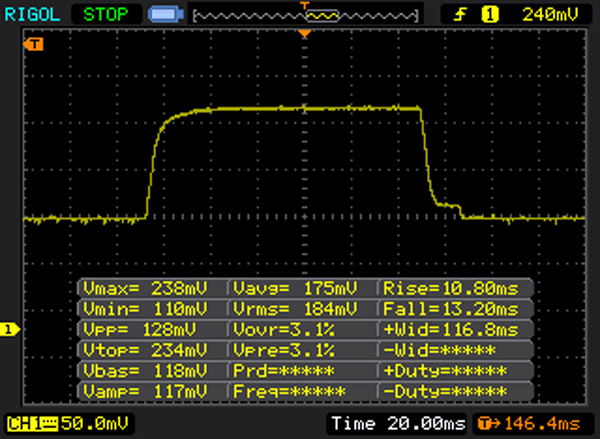 |
| ↘ 13 ms fall | ||
| The screen shows good response rates in our tests, but may be too slow for competitive gamers. In comparison, all tested devices range from 0.1 (minimum) to 240 (maximum) ms. » 45 % of all devices are better. This means that the measured response time is similar to the average of all tested devices (21.5 ms). | ||
| ↔ Response Time 50% Grey to 80% Grey | ||
| 41 ms ... rise ↗ and fall ↘ combined | ↗ 19 ms rise | 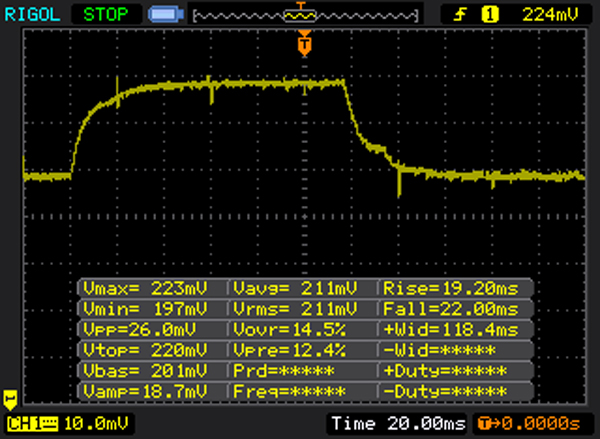 |
| ↘ 22 ms fall | ||
| The screen shows slow response rates in our tests and will be unsatisfactory for gamers. In comparison, all tested devices range from 0.2 (minimum) to 636 (maximum) ms. » 60 % of all devices are better. This means that the measured response time is worse than the average of all tested devices (33.7 ms). | ||
| Cinebench R15 | |
| CPU Single 64Bit | |
| Lenovo Ideapad 310-15ISK | |
| Asus F555UB-XO043T | |
| Toshiba Satellite L50-C-275 | |
| HP Pavilion 14t-ab000 K9E07AV | |
| Asus F555LJ-XX110H | |
| Acer Aspire E5-552G-F62G | |
| HP Pavilion 15-aw004ng W8Y60EA | |
| Lenovo Ideapad 500-15ACZ | |
| CPU Multi 64Bit | |
| Lenovo Ideapad 310-15ISK | |
| Asus F555UB-XO043T | |
| Toshiba Satellite L50-C-275 | |
| HP Pavilion 14t-ab000 K9E07AV | |
| Asus F555LJ-XX110H | |
| HP Pavilion 15-aw004ng W8Y60EA | |
| Acer Aspire E5-552G-F62G | |
| Lenovo Ideapad 500-15ACZ | |
| Cinebench R10 | |
| Rendering Multiple CPUs 32Bit | |
| Lenovo Ideapad 310-15ISK | |
| Asus F555UB-XO043T | |
| Toshiba Satellite L50-C-275 | |
| Asus F555LJ-XX110H | |
| Acer Aspire E5-552G-F62G | |
| Lenovo Ideapad 500-15ACZ | |
| HP Pavilion 15-aw004ng W8Y60EA | |
| Rendering Single 32Bit | |
| Lenovo Ideapad 310-15ISK | |
| Toshiba Satellite L50-C-275 | |
| Asus F555UB-XO043T | |
| Asus F555LJ-XX110H | |
| HP Pavilion 15-aw004ng W8Y60EA | |
| Acer Aspire E5-552G-F62G | |
| Lenovo Ideapad 500-15ACZ | |
| Geekbench 3 | |
| 32 Bit Single-Core Score | |
| Asus F555UB-XO043T | |
| Toshiba Satellite L50-C-275 | |
| Asus F555LJ-XX110H | |
| HP Pavilion 15-aw004ng W8Y60EA | |
| Lenovo Ideapad 500-15ACZ | |
| 32 Bit Multi-Core Score | |
| Asus F555UB-XO043T | |
| Toshiba Satellite L50-C-275 | |
| HP Pavilion 15-aw004ng W8Y60EA | |
| Lenovo Ideapad 500-15ACZ | |
| Asus F555LJ-XX110H | |
| JetStream 1.1 - Total Score | |
| Lenovo Ideapad 310-15ISK | |
| Asus F555UB-XO043T | |
| Toshiba Satellite L50-C-275 | |
| HP Pavilion 15-aw004ng W8Y60EA | |
| Lenovo Ideapad 500-15ACZ | |
| Mozilla Kraken 1.1 - Total | |
| Asus F555LJ-XX110H | |
| Lenovo Ideapad 500-15ACZ | |
| HP Pavilion 15-aw004ng W8Y60EA | |
| Asus F555UB-XO043T | |
| Toshiba Satellite L50-C-275 | |
| Octane V2 - Total Score | |
| Toshiba Satellite L50-C-275 | |
| Asus F555UB-XO043T | |
| HP Pavilion 15-aw004ng W8Y60EA | |
| Lenovo Ideapad 500-15ACZ | |
| Asus F555LJ-XX110H | |
* ... smaller is better
| PCMark 7 Score | 4340 pontos | |
| PCMark 8 Home Score Accelerated v2 | 2904 pontos | |
| PCMark 8 Creative Score Accelerated v2 | 3569 pontos | |
| PCMark 8 Work Score Accelerated v2 | 3883 pontos | |
Ajuda | ||
| PCMark 8 | |
| Home Score Accelerated v2 | |
| Lenovo Ideapad 310-15ISK | |
| Asus F555UB-XO043T | |
| Toshiba Satellite L50-C-275 | |
| HP Pavilion 15-aw004ng W8Y60EA | |
| Acer Aspire E5-552G-F62G | |
| Lenovo Ideapad 500-15ACZ | |
| Work Score Accelerated v2 | |
| Lenovo Ideapad 310-15ISK | |
| Toshiba Satellite L50-C-275 | |
| Asus F555UB-XO043T | |
| HP Pavilion 15-aw004ng W8Y60EA | |
| Acer Aspire E5-552G-F62G | |
| Lenovo Ideapad 500-15ACZ | |

| HP Pavilion 15-aw004ng W8Y60EA | Acer Aspire E5-552G-F62G Western Digital Scorpio Blue WD5000LPVX | Lenovo Ideapad 500-15ACZ Seagate Momentus SpinPoint M8 ST1000LM024 | Toshiba Satellite L50-C-275 Samsung SSD PM871 MZNLN256HCHP | Asus F555UB-XO043T Seagate Momentus SpinPoint M8 ST1000LM024 | |
|---|---|---|---|---|---|
| CrystalDiskMark 3.0 | -88% | -89% | 67% | -89% | |
| Read Seq | 503 | 110.7 -78% | 96.3 -81% | 490.6 -2% | 108.5 -78% |
| Write Seq | 316.6 | 108.9 -66% | 95.9 -70% | 304.1 -4% | 106.2 -66% |
| Read 512 | 261.9 | 36.71 -86% | 36.46 -86% | 414.6 58% | 34.52 -87% |
| Write 512 | 281.2 | 53.7 -81% | 42.75 -85% | 299.6 7% | 42.45 -85% |
| Read 4k | 17.04 | 0.415 -98% | 0.451 -97% | 36.82 116% | 0.391 -98% |
| Write 4k | 46.55 | 1.261 -97% | 0.895 -98% | 99.5 114% | 0.855 -98% |
| Read 4k QD32 | 125 | 1.126 -99% | 0.847 -99% | 333.4 167% | 0.774 -99% |
| Write 4k QD32 | 131.4 | 1.312 -99% | 0.892 -99% | 236.8 80% | 0.852 -99% |
| 3DMark 06 Standard Score | 8878 pontos | |
| 3DMark Vantage P Result | 6853 pontos | |
| 3DMark 11 Performance | 2979 pontos | |
| 3DMark Ice Storm Standard Score | 44367 pontos | |
| 3DMark Cloud Gate Standard Score | 5225 pontos | |
| 3DMark Fire Strike Score | 1678 pontos | |
| 3DMark Fire Strike Extreme Score | 686 pontos | |
| 3DMark Time Spy Score | 315 pontos | |
Ajuda | ||
| 3DMark 11 - 1280x720 Performance GPU | |
| Acer Aspire E5-552G-F62G | |
| HP Pavilion 15-aw004ng W8Y60EA | |
| Lenovo Ideapad 500-15ACZ | |
| Asus F555UB-XO043T | |
| HP Pavilion 15-aw004ng | |
| Toshiba Satellite L50-C-275 | |
| Lenovo Ideapad 310-15ISK | |
| 3DMark | |
| 1280x720 Cloud Gate Standard Graphics | |
| HP Pavilion 15-aw004ng W8Y60EA | |
| Acer Aspire E5-552G-F62G | |
| Lenovo Ideapad 500-15ACZ | |
| Asus F555UB-XO043T | |
| Toshiba Satellite L50-C-275 | |
| HP Pavilion 15-aw004ng | |
| 1920x1080 Fire Strike Graphics | |
| HP Pavilion 15-aw004ng W8Y60EA | |
| Asus F555UB-XO043T | |
| Toshiba Satellite L50-C-275 | |
| Lenovo Ideapad 500-15ACZ | |
| HP Pavilion 15-aw004ng | |
| baixo | média | alto | ultra | |
| Counter-Strike: GO (2012) | 82 | 77.8 | 71.7 | 50.3 |
| Tomb Raider (2013) | 83.6 | 55.7 | 46.3 | 21.8 |
| BioShock Infinite (2013) | 72.7 | 42.9 | 33.7 | 11.7 |
| Battlefield 4 (2013) | 50.1 | 37.2 | 23.4 | 7.7 |
| Middle-earth: Shadow of Mordor (2014) | 33.3 | 21.3 | 12.2 | |
| Alien: Isolation (2014) | 51.6 | 42.7 | 28 | |
| F1 2014 (2014) | 59 | 42 | 39 | 24 |
| Dragon Age: Inquisition (2014) | 40.8 | 27.8 | 9.6 | |
| Battlefield Hardline (2015) | 37.7 | 29.3 | 14 | 8.3 |
| GTA V (2015) | 54.6 | 52.4 | 11.7 | |
| Batman: Arkham Knight (2015) | 19 | 17 | 7 | |
| Metal Gear Solid V (2015) | 60 | 37.5 | 13.3 | |
| FIFA 16 (2015) | 77.5 | 53.8 | 25 | |
| Anno 2205 (2015) | 36 | 17.8 | 7.4 | |
| Call of Duty: Black Ops 3 (2015) | 38.1 | 26.2 | 11.7 | |
| Assassin's Creed Syndicate (2015) | 15.9 | 13.1 | 6.6 | |
| Rainbow Six Siege (2015) | 53.5 | 33.7 | 13.3 | |
| Rise of the Tomb Raider (2016) | 24.4 | 13.9 | 7.7 | |
| XCOM 2 (2016) | 22 | 8 | 5.2 | |
| Far Cry Primal (2016) | 23 | 10 | 9 | |
| The Division (2016) | 23.3 | 15.1 | 7.1 | |
| Hitman 2016 (2016) | 18.6 | 17.7 | 10.5 | |
| Need for Speed 2016 (2016) | 25.6 | 22.6 | 11.7 | 9.5 |
| Ashes of the Singularity (2016) | 14.2 | 7 | 6.2 | |
| Doom (2016) | 22.4 | 12.8 | 8.3 | |
| Mirror's Edge Catalyst (2016) | 26.4 | 12.8 | 5.8 | |
| No Man's Sky (2016) | 21.8 | 18 | 10 | |
| Deus Ex Mankind Divided (2016) | 15.1 | 10.9 | 5.4 |
| BioShock Infinite - 1366x768 Medium Preset | |
| Asus F555UB-XO043T | |
| Toshiba Satellite L50-C-275 | |
| HP Pavilion 15-aw004ng W8Y60EA | |
| HP Pavilion 15-aw004ng | |
| Lenovo Ideapad 310-15ISK | |
| Lenovo Ideapad 500-15ACZ | |
| Tomb Raider - 1366x768 Normal Preset AA:FX AF:4x | |
| Toshiba Satellite L50-C-275 | |
| HP Pavilion 15-aw004ng W8Y60EA | |
| Lenovo Ideapad 500-15ACZ | |
| Battlefield 4 - 1024x768 Low Preset | |
| HP Pavilion 15-aw004ng | |
| HP Pavilion 15-aw004ng W8Y60EA | |
| Lenovo Ideapad 500-15ACZ | |
| Acer Aspire E5-552G-F62G | |
| FIFA 16 - 1366x768 High Preset AA:2x MS | |
| HP Pavilion 15-aw004ng W8Y60EA | |
| Lenovo Ideapad 500-15ACZ | |
| Acer Aspire E5-552G-F62G | |
| GTA V - 1024x768 Lowest Settings possible | |
| Lenovo Ideapad 310-15ISK | |
| HP Pavilion 15-aw004ng W8Y60EA | |
| F1 2014 - 1920x1080 High Preset | |
| Lenovo Ideapad 310-15ISK | |
| HP Pavilion 15-aw004ng W8Y60EA | |
| Lenovo Ideapad 500-15ACZ | |
| Counter-Strike: GO - 1366x768 High AA:2x MS AF:4x | |
| HP Pavilion 15-aw004ng W8Y60EA | |
Barulho
| Ocioso |
| 31.7 / 31.9 / 31.9 dB |
| HDD |
| 32.2 dB |
| DVD |
| 36.6 / dB |
| Carga |
| 41 / 42.7 dB |
 | ||
30 dB silencioso 40 dB(A) audível 50 dB(A) ruidosamente alto |
||
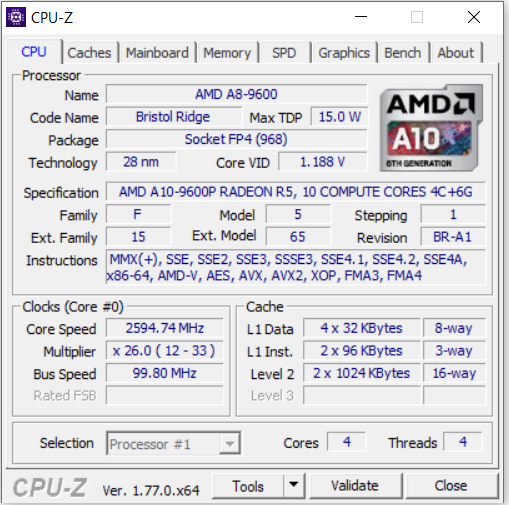
min: | ||
| HP Pavilion 15-aw004ng W8Y60EA A10-9600P, Radeon R8 M445DX | Acer Aspire E5-552G-F62G FX-8800P, Radeon R8 M365DX | Lenovo Ideapad 500-15ACZ A10-8700P, Radeon R6 M340DX | Toshiba Satellite L50-C-275 6200U, GeForce 930M | Asus F555UB-XO043T 6200U, GeForce 940M | Lenovo Ideapad 310-15ISK 6500U, GeForce 920MX | |
|---|---|---|---|---|---|---|
| Noise | 3% | 0% | 9% | -4% | -1% | |
| off / environment * | 31.2 | 31.3 -0% | 31.3 -0% | 22 29% | 31.2 -0% | |
| Idle Minimum * | 31.7 | 32.4 -2% | 33.1 -4% | 31.3 1% | 34 -7% | 32.6 -3% |
| Idle Average * | 31.9 | 33.2 -4% | 33.3 -4% | 31.3 2% | 34 -7% | 32.6 -2% |
| Idle Maximum * | 31.9 | 33.2 -4% | 33.5 -5% | 32.2 -1% | 34.2 -7% | 33.8 -6% |
| Load Average * | 41 | 36.5 11% | 38.9 5% | 36.4 11% | 38.9 5% | 40.2 2% |
| Load Maximum * | 42.7 | 34.4 19% | 38.9 9% | 36.6 14% | 43.6 -2% | 40.4 5% |
* ... smaller is better
(+) The maximum temperature on the upper side is 33.4 °C / 92 F, compared to the average of 36.9 °C / 98 F, ranging from 21.1 to 71 °C for the class Multimedia.
(+) The bottom heats up to a maximum of 32.9 °C / 91 F, compared to the average of 39.1 °C / 102 F
(+) In idle usage, the average temperature for the upper side is 26 °C / 79 F, compared to the device average of 31.2 °C / 88 F.
(+) The palmrests and touchpad are cooler than skin temperature with a maximum of 27 °C / 80.6 F and are therefore cool to the touch.
(±) The average temperature of the palmrest area of similar devices was 28.8 °C / 83.8 F (+1.8 °C / 3.2 F).
| HP Pavilion 15-aw004ng W8Y60EA A10-9600P, Radeon R8 M445DX | Acer Aspire E5-552G-F62G FX-8800P, Radeon R8 M365DX | Lenovo Ideapad 500-15ACZ A10-8700P, Radeon R6 M340DX | Toshiba Satellite L50-C-275 6200U, GeForce 930M | Asus F555UB-XO043T 6200U, GeForce 940M | Lenovo Ideapad 310-15ISK 6500U, GeForce 920MX | |
|---|---|---|---|---|---|---|
| Heat | -5% | -4% | -13% | -8% | -10% | |
| Maximum Upper Side * | 33.4 | 34 -2% | 36 -8% | 42.5 -27% | 33.2 1% | 38.6 -16% |
| Maximum Bottom * | 32.9 | 39.6 -20% | 39.2 -19% | 46.9 -43% | 44 -34% | 42 -28% |
| Idle Upper Side * | 27.7 | 27.7 -0% | 27.1 2% | 25.8 7% | 28.2 -2% | 28.1 -1% |
| Idle Bottom * | 29.4 | 29 1% | 26.6 10% | 26 12% | 28.1 4% | 28.1 4% |
* ... smaller is better
HP Pavilion 15-aw004ng W8Y60EA audio analysis
(-) | not very loud speakers (68 dB)
Bass 100 - 315 Hz
(-) | nearly no bass - on average 22.8% lower than median
(+) | bass is linear (5.9% delta to prev. frequency)
Mids 400 - 2000 Hz
(±) | higher mids - on average 5.5% higher than median
(±) | linearity of mids is average (12.2% delta to prev. frequency)
Highs 2 - 16 kHz
(+) | balanced highs - only 4.7% away from median
(+) | highs are linear (4.7% delta to prev. frequency)
Overall 100 - 16.000 Hz
(±) | linearity of overall sound is average (29.1% difference to median)
Compared to same class
» 94% of all tested devices in this class were better, 2% similar, 4% worse
» The best had a delta of 5%, average was 18%, worst was 45%
Compared to all devices tested
» 85% of all tested devices were better, 3% similar, 13% worse
» The best had a delta of 4%, average was 25%, worst was 134%
Apple MacBook 12 (Early 2016) 1.1 GHz audio analysis
(+) | speakers can play relatively loud (83.6 dB)
Bass 100 - 315 Hz
(±) | reduced bass - on average 11.3% lower than median
(±) | linearity of bass is average (14.2% delta to prev. frequency)
Mids 400 - 2000 Hz
(+) | balanced mids - only 2.4% away from median
(+) | mids are linear (5.5% delta to prev. frequency)
Highs 2 - 16 kHz
(+) | balanced highs - only 2% away from median
(+) | highs are linear (4.5% delta to prev. frequency)
Overall 100 - 16.000 Hz
(+) | overall sound is linear (10.2% difference to median)
Compared to same class
» 5% of all tested devices in this class were better, 2% similar, 93% worse
» The best had a delta of 5%, average was 19%, worst was 53%
Compared to all devices tested
» 3% of all tested devices were better, 1% similar, 96% worse
» The best had a delta of 4%, average was 25%, worst was 134%
| desligado | |
| Ocioso | |
| Carga |
|
| HP Pavilion 15-aw004ng W8Y60EA A10-9600P, Radeon R8 M445DX | Acer Aspire E5-552G-F62G FX-8800P, Radeon R8 M365DX | Lenovo Ideapad 500-15ACZ A10-8700P, Radeon R6 M340DX | Toshiba Satellite L50-C-275 6200U, GeForce 930M | Asus F555UB-XO043T 6200U, GeForce 940M | Lenovo Ideapad 310-15ISK 6500U, GeForce 920MX | |
|---|---|---|---|---|---|---|
| Power Consumption | -2% | -10% | 4% | 13% | 2% | |
| Idle Minimum * | 5.5 | 6.7 -22% | 6.8 -24% | 4.7 15% | 4.7 15% | 7 -27% |
| Idle Average * | 8.2 | 9.8 -20% | 10.5 -28% | 9.9 -21% | 6.5 21% | 8 2% |
| Idle Maximum * | 9.5 | 10.6 -12% | 11 -16% | 10.1 -6% | 6.8 28% | 8.4 12% |
| Load Average * | 44.5 | 46 -3% | 41.6 7% | 36 19% | 42.7 4% | 38.8 13% |
| Load Maximum * | 58 | 32 45% | 51 12% | 51 12% | 59 -2% | 52.8 9% |
* ... smaller is better
| HP Pavilion 15-aw004ng W8Y60EA 41 Wh | Acer Aspire E5-552G-F62G 37 Wh | Lenovo Ideapad 500-15ACZ 32 Wh | Toshiba Satellite L50-C-275 45 Wh | Asus F555UB-XO043T 37 Wh | |
|---|---|---|---|---|---|
| Battery Runtime | -32% | -32% | 33% | 37% | |
| Reader / Idle | 560 | 400 -29% | 365 -35% | ||
| H.264 | 194 | 168 -13% | |||
| WiFi v1.3 | 260 | 168 -35% | 183 -30% | 345 33% | 355 37% |
| Load | 95 | 49 -48% |
Pro
Contra
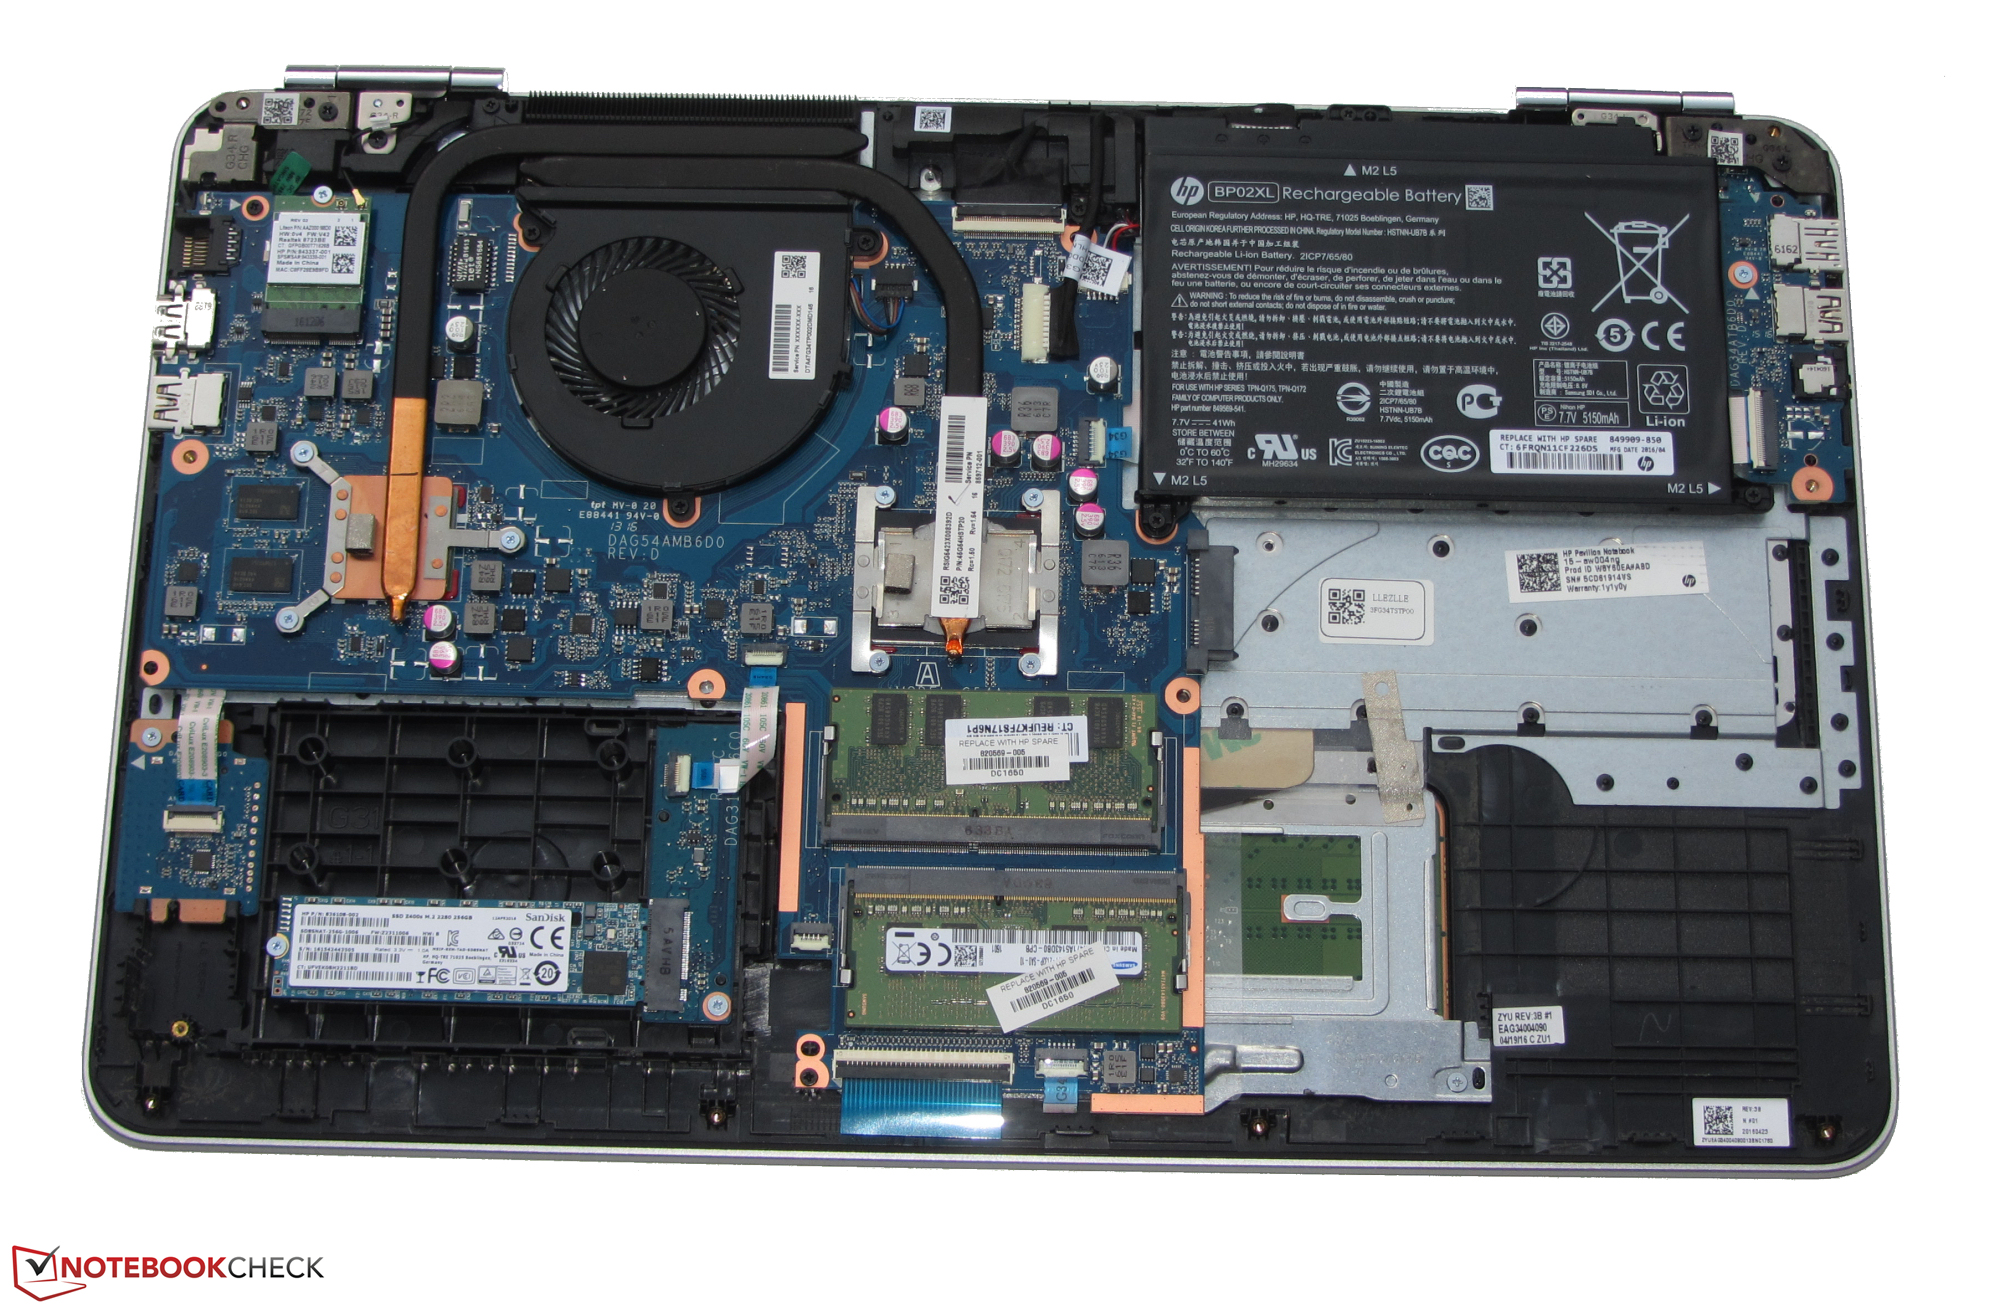
O processador AMD do modelo de teste oferece suficiente desempenho para o uso cotidiano. Além disso, o portátil é silencioso a maior parte do tempo e quase não esquenta. Um SSD veloz garante que o sistema funcione fluentemente. Infelizmente o portátil não possui escotilha de manutenção. Para rocar o SSD, a carcaça deve ser aberta. O teclado basta para o uso doméstico e a duração da bateria não é nada especial. O Pavilion poderia ter sido melhor nestas áreas.
Por apenas 550 Euros, o Pavilion 15-aw004ng é um bom poli funcional para usuários de nível de entrada.
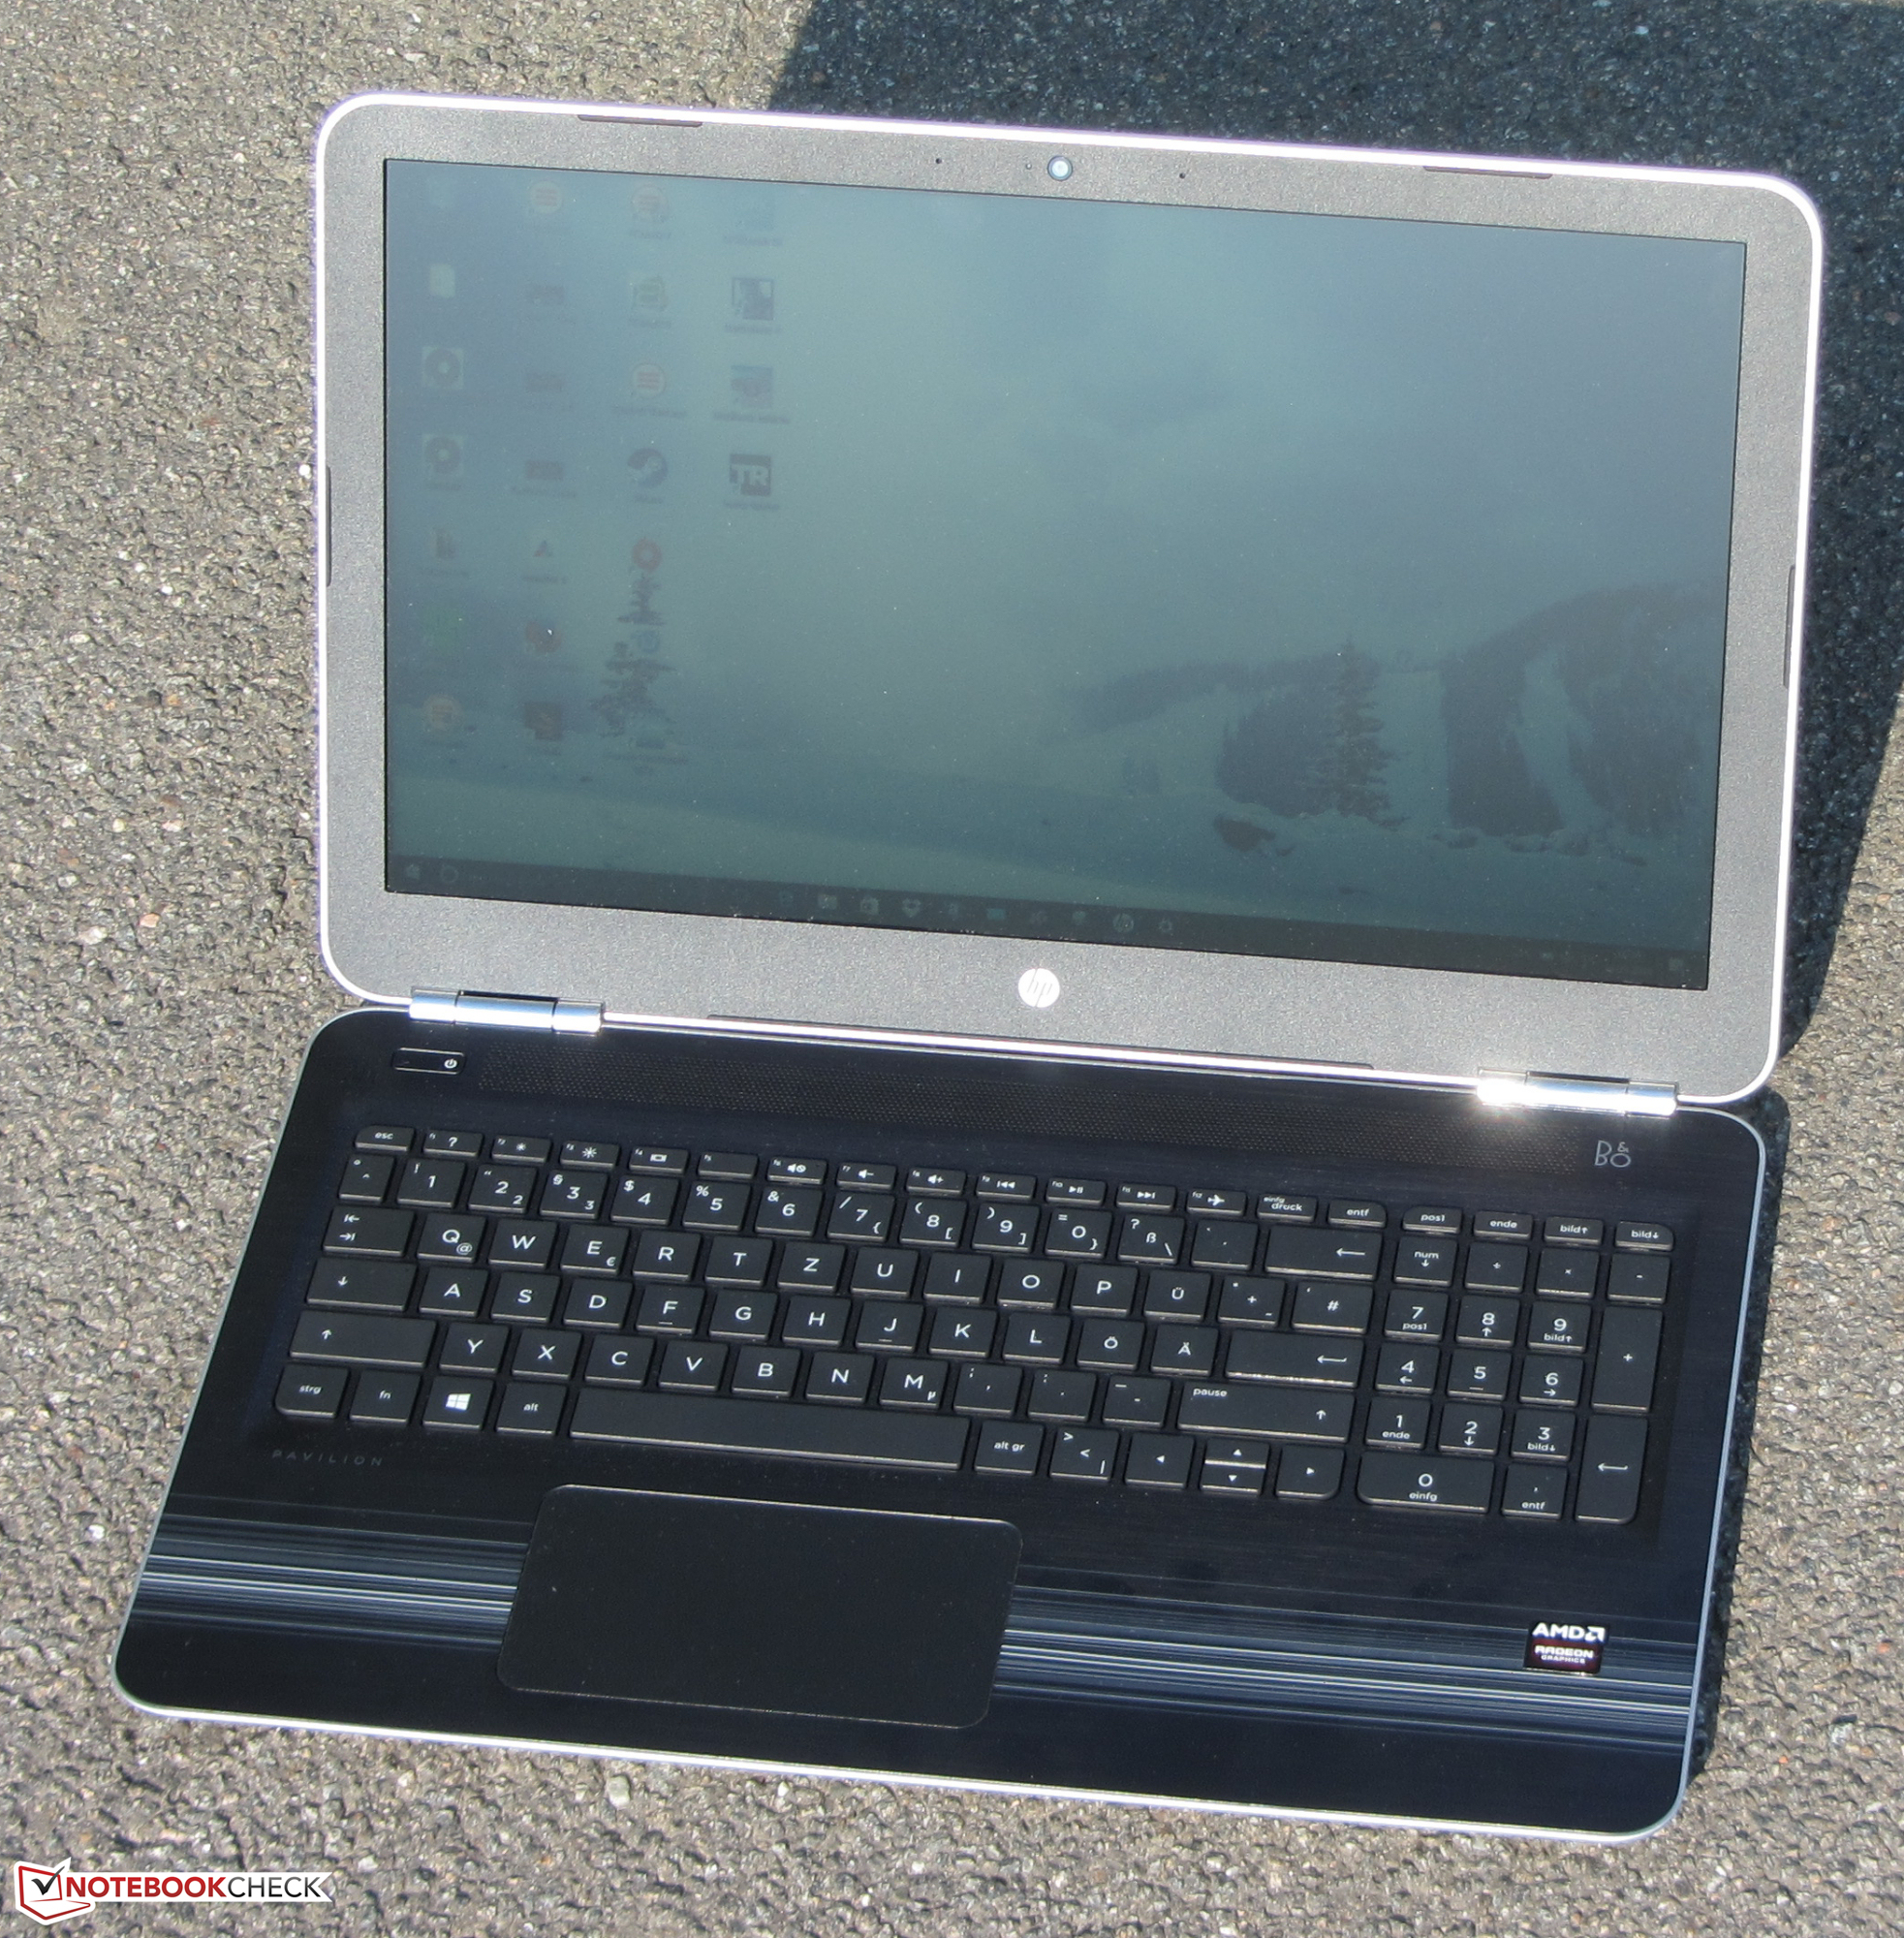
Por um preço relativamente baixo, a HP incluiu uma tela FHD e um sistema dual-graphics. Por outro lado, o painel não é muito brilhante e possui ângulos de visão e contraste pobres. Adicionalmente, em termos de desempenho de jogos, o sistema dual-graphics não é tão potente quanto a concorrência da Nvidia. O próprio sistema é coberto por uma garantia de apenas 1 ano. Em resumo, a HP oferece um portátil econômico de 15,6 polegadas com falhas evidentes, o que pode ser adequado para alguns usuários.
HP Pavilion 15-aw004ng W8Y60EA
-
09/22/2016 v5.1(old)
Sascha Mölck