 Deutsch
 English
 Español
 Français
 Italiano
 Nederlands
 Polski
 Português
 Русский
 Türkçe
 Svenska
 Chinese
 Magyar
Breve Análise do Portátil HP Pavilion 15t-au100 (W0P31AV)

| SD Card Reader | |
| average JPG Copy Test (av. of 3 runs) | |
| Dell XPS 15-9550 i7 | |
| HP Pavilion 15t-au100 CTO (W0P31AV) | |
| Lenovo IdeaPad 510-15IKB 80SV0087GE | |
| Acer Aspire E5-575G-549D | |
| Asus Zenbook UX510UW-CN044T | |
| maximum AS SSD Seq Read Test (1GB) | |
| Dell XPS 15-9550 i7 | |
| HP Pavilion 15t-au100 CTO (W0P31AV) | |
| Acer Aspire E5-575G-549D | |
| Asus Zenbook UX510UW-CN044T | |
| Lenovo IdeaPad 510-15IKB 80SV0087GE | |
| Networking | |
| WiFi Speed Client 1m 512KB | |
| WiFi Speed Server 1m 512KB |
| |||||||||||||||||||||||||
iluminação: 69 %
iluminação com acumulador: 186.5 cd/m²
Contraste: 1036:1 (Preto: 0.18 cd/m²)
ΔE Color 5.7 | 0.5-29.43 Ø5
ΔE Greyscale 4.4 | 0.57-98 Ø5.3
64.95% sRGB (Argyll 1.6.3 3D)
44.71% AdobeRGB 1998 (Argyll 1.6.3 3D)
44.71% AdobeRGB 1998 (Argyll 2.2.0 3D)
64.9% sRGB (Argyll 2.2.0 3D)
43.27% Display P3 (Argyll 2.2.0 3D)
Gamma: 2.35
| HP Pavilion 15t-au100 CTO (W0P31AV) BOE0693, IPS, 15.60, 1920x1080 | Asus Zenbook UX510UW-CN044T LG Philips LP156WF6-SPB6, IPS, 15.60, 1920x1080 | Lenovo IdeaPad 510-15IKB 80SV0087GE BOE HF NV156FHM-N42, IPS, 15.60, 1920x1080 | Acer Aspire E5-575G-549D Chi Mei CMN15C4, TN, 15.60, 1920x1080 | HP Pavilion 15 UHD T9Y85AV SDC5958, IPS, 15.60, 3840x2160 | |
|---|---|---|---|---|---|
| Display | 33% | -1% | -11% | 36% | |
| Display P3 Coverage | 43.27 | 61.5 42% | 42.66 -1% | 38.57 -11% | 60 39% |
| sRGB Coverage | 64.9 | 80.4 24% | 64.1 -1% | 57.4 -12% | 85.8 32% |
| AdobeRGB 1998 Coverage | 44.71 | 58.8 32% | 44.08 -1% | 39.89 -11% | 61.8 38% |
| Response Times | 14% | -36% | 18% | 190% | |
| Response Time Grey 50% / Grey 80% * | 42 ? | 40 ? 5% | 51 ? -21% | 39 ? 7% | 39.6 ? 6% |
| Response Time Black / White * | 33.6 ? | 26 ? 23% | 38 ? -13% | 24 ? 29% | 27.2 ? 19% |
| PWM Frequency | 198.4 | 50 ? -75% | 1282 ? 546% | ||
| Screen | 16% | 21% | -35% | 10% | |
| Brightness middle | 186.5 | 326 75% | 291 56% | 176 -6% | 336.2 80% |
| Brightness | 174 | 316 82% | 265 52% | 169 -3% | 323 86% |
| Brightness Distribution | 69 | 80 16% | 86 25% | 91 32% | 87 26% |
| Black Level * | 0.18 | 0.35 -94% | 0.23 -28% | 0.47 -161% | 0.629 -249% |
| Contrast | 1036 | 931 -10% | 1265 22% | 374 -64% | 534 -48% |
| Colorchecker dE 2000 * | 5.7 | 5.49 4% | 4.78 16% | 8.83 -55% | 3.32 42% |
| Colorchecker dE 2000 max. * | 22.5 | 11.36 50% | 9.51 58% | 14.01 38% | 7.4 67% |
| Greyscale dE 2000 * | 4.4 | 4.84 -10% | 3.49 21% | 8.97 -104% | 2.88 35% |
| Gamma | 2.35 94% | 2.23 99% | 2.58 85% | 2.43 91% | 2.34 94% |
| CCT | 6963 93% | 5971 109% | 6013 108% | 10234 64% | 6279 104% |
| Color Space (Percent of AdobeRGB 1998) | 44.71 | 53 19% | 40 -11% | 36.8 -18% | 55.3 24% |
| Color Space (Percent of sRGB) | 64.95 | 80 23% | 64 -1% | 57.3 -12% | 85.5 32% |
| Total Average (Program / Settings) | 21% /
19% | -5% /
6% | -9% /
-23% | 79% /
48% |
* ... smaller is better
Display Response Times
| ↔ Response Time Black to White | ||
|---|---|---|
| 33.6 ms ... rise ↗ and fall ↘ combined | ↗ 7.6 ms rise | 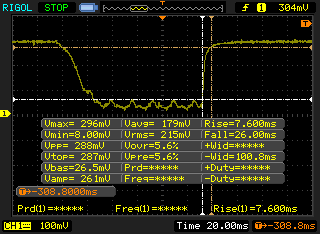 |
| ↘ 26 ms fall | ||
| The screen shows slow response rates in our tests and will be unsatisfactory for gamers. In comparison, all tested devices range from 0.1 (minimum) to 240 (maximum) ms. » 89 % of all devices are better. This means that the measured response time is worse than the average of all tested devices (21.5 ms). | ||
| ↔ Response Time 50% Grey to 80% Grey | ||
| 42 ms ... rise ↗ and fall ↘ combined | ↗ 13.2 ms rise | 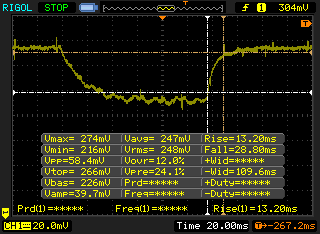 |
| ↘ 28.8 ms fall | ||
| The screen shows slow response rates in our tests and will be unsatisfactory for gamers. In comparison, all tested devices range from 0.2 (minimum) to 636 (maximum) ms. » 63 % of all devices are better. This means that the measured response time is worse than the average of all tested devices (33.7 ms). | ||
Screen Flickering / PWM (Pulse-Width Modulation)
| Screen flickering / PWM detected | 198.4 Hz | 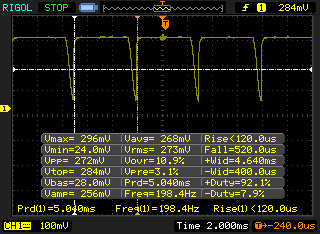 | |
The display backlight flickers at 198.4 Hz (worst case, e.g., utilizing PWM) . The frequency of 198.4 Hz is relatively low, so sensitive users will likely notice flickering and experience eyestrain at the stated brightness setting and below. In comparison: 53 % of all tested devices do not use PWM to dim the display. If PWM was detected, an average of 17900 (minimum: 5 - maximum: 3846000) Hz was measured. | |||

| Cinebench R15 | |
| CPU Single 64Bit | |
| Lenovo IdeaPad 510-15IKB 80SV0087GE | |
| Dell XPS 15-9550 i7 | |
| Dell XPS 15 9550 i7 FHD | |
| HP Pavilion 15t-au100 CTO (W0P31AV) | |
| HP Pavilion 15 UHD T9Y85AV | |
| Asus Zenbook UX510UW-CN044T | |
| Acer Aspire E5-575G-549D | |
| CPU Multi 64Bit | |
| Dell XPS 15 9550 i7 FHD | |
| HP Pavilion 15 UHD T9Y85AV | |
| Dell XPS 15-9550 i7 | |
| HP Pavilion 15t-au100 CTO (W0P31AV) | |
| Lenovo IdeaPad 510-15IKB 80SV0087GE | |
| Acer Aspire E5-575G-549D | |
| Asus Zenbook UX510UW-CN044T | |
| Cinebench R10 | |
| Rendering Single 32Bit | |
| Lenovo IdeaPad 510-15IKB 80SV0087GE | |
| HP Pavilion 15t-au100 CTO (W0P31AV) | |
| Dell XPS 15 9550 i7 FHD | |
| Dell XPS 15-9550 i7 | |
| HP Pavilion 15 UHD T9Y85AV | |
| Acer Aspire E5-575G-549D | |
| Asus Zenbook UX510UW-CN044T | |
| Rendering Multiple CPUs 32Bit | |
| Dell XPS 15-9550 i7 | |
| HP Pavilion 15 UHD T9Y85AV | |
| Dell XPS 15 9550 i7 FHD | |
| HP Pavilion 15t-au100 CTO (W0P31AV) | |
| Acer Aspire E5-575G-549D | |
| Lenovo IdeaPad 510-15IKB 80SV0087GE | |
| Asus Zenbook UX510UW-CN044T | |
| wPrime 2.10 - 1024m | |
| HP Pavilion 15t-au100 CTO (W0P31AV) | |
| Acer Aspire E5-575G-549D | |
| Dell XPS 15 9550 i7 FHD | |
| HP Pavilion 15 UHD T9Y85AV | |
| Super Pi Mod 1.5 XS 32M - 32M | |
| Acer Aspire E5-575G-549D | |
| HP Pavilion 15t-au100 CTO (W0P31AV) | |
| Dell XPS 15 9550 i7 FHD | |
| HP Pavilion 15 UHD T9Y85AV | |
* ... smaller is better
| PCMark 8 | |
| Home Score Accelerated v2 | |
| Lenovo IdeaPad 510-15IKB 80SV0087GE | |
| Dell XPS 15 9550 i7 FHD | |
| HP Pavilion 15t-au100 CTO (W0P31AV) | |
| Asus Zenbook UX510UW-CN044T | |
| Acer Aspire E5-575G-549D | |
| HP Pavilion 15 UHD T9Y85AV | |
| Work Score Accelerated v2 | |
| Dell XPS 15 9550 i7 FHD | |
| Asus Zenbook UX510UW-CN044T | |
| HP Pavilion 15t-au100 CTO (W0P31AV) | |
| Acer Aspire E5-575G-549D | |
| HP Pavilion 15 UHD T9Y85AV | |
| Creative Score Accelerated v2 | |
| Dell XPS 15 9550 i7 FHD | |
| HP Pavilion 15 UHD T9Y85AV | |
| Asus Zenbook UX510UW-CN044T | |
| HP Pavilion 15t-au100 CTO (W0P31AV) | |
| Acer Aspire E5-575G-549D | |
| PCMark 8 Home Score Accelerated v2 | 3424 pontos | |
| PCMark 8 Creative Score Accelerated v2 | 4089 pontos | |
| PCMark 8 Work Score Accelerated v2 | 4340 pontos | |
Ajuda | ||
| HP Pavilion 15t-au100 CTO (W0P31AV) Toshiba MQ01ABD100 | Acer Aspire E5-575G-549D Toshiba MQ01ABD100 | Lenovo IdeaPad 510-15IKB 80SV0087GE Liteonit CV3-DE256 | Asus Zenbook UX510UW-CN044T SanDisk SD8SNAT256G1002 | Dell XPS 15 9550 i7 FHD Samsung PM951 NVMe 512 GB | HP Pavilion 15 UHD T9Y85AV SanDisk Z400s SD8SNAT-128G | |
|---|---|---|---|---|---|---|
| CrystalDiskMark 3.0 | -20% | 10956% | 7338% | 16558% | 6457% | |
| Read Seq | 109.5 | 95.3 -13% | 469.2 328% | 459.3 319% | 1291 1079% | 484.6 343% |
| Write Seq | 105.2 | 85.6 -19% | 431.5 310% | 325.5 209% | 590 461% | 185.2 76% |
| Read 512 | 34.08 | 29.32 -14% | 338.3 893% | 279.2 719% | 632 1754% | 307.6 803% |
| Write 512 | 40.02 | 25.93 -35% | 297.9 644% | 280.1 600% | 588 1369% | 180 350% |
| Read 4k | 0.429 | 0.366 -15% | 28.68 6585% | 22.43 5128% | 41.4 9550% | 22.08 5047% |
| Write 4k | 1.008 | 0.726 -28% | 66.8 6527% | 74.9 7331% | 132.4 13035% | 77.7 7608% |
| Read 4k QD32 | 0.81 | 0.647 -20% | 364.7 44925% | 149 18295% | 542 66814% | 143.7 17641% |
| Write 4k QD32 | 0.893 | 0.722 -19% | 245.9 27436% | 234 26104% | 343.8 38399% | 177.6 19788% |

| 3DMark 11 | |
| 1280x720 Performance GPU | |
| HP Pavilion 15 UHD T9Y85AV | |
| Asus Zenbook UX510UW-CN044T | |
| Acer Aspire E5-575G-549D | |
| HP Pavilion 15t-au100 CTO (W0P31AV) | |
| Lenovo IdeaPad 510-15IKB 80SV0087GE | |
| 1280x720 Performance Combined | |
| HP Pavilion 15 UHD T9Y85AV | |
| Asus Zenbook UX510UW-CN044T | |
| Acer Aspire E5-575G-549D | |
| HP Pavilion 15t-au100 CTO (W0P31AV) | |
| Lenovo IdeaPad 510-15IKB 80SV0087GE | |
| 3DMark | |
| 1280x720 Cloud Gate Standard Graphics | |
| Dell XPS 15 9550 i7 FHD | |
| HP Pavilion 15 UHD T9Y85AV | |
| Asus Zenbook UX510UW-CN044T | |
| Acer Aspire E5-575G-549D | |
| HP Pavilion 15t-au100 CTO (W0P31AV) | |
| 1920x1080 Fire Strike Graphics | |
| HP Pavilion 15 UHD T9Y85AV | |
| Dell XPS 15 9550 i7 FHD | |
| Asus Zenbook UX510UW-CN044T | |
| Acer Aspire E5-575G-549D | |
| HP Pavilion 15t-au100 CTO (W0P31AV) | |
| 1920x1080 Ice Storm Extreme Graphics | |
| Dell XPS 15 9550 i7 FHD | |
| Asus Zenbook UX510UW-CN044T | |
| HP Pavilion 15 UHD T9Y85AV | |
| 3DMark 11 Performance | 2622 pontos | |
| 3DMark Cloud Gate Standard Score | 7017 pontos | |
| 3DMark Fire Strike Score | 1538 pontos | |
| 3DMark Fire Strike Extreme Score | 777 pontos | |
Ajuda | ||
| Rise of the Tomb Raider | |
| 1024x768 Lowest Preset (sort by value) | |
| HP Pavilion 15t-au100 CTO (W0P31AV) | |
| Acer Aspire E5-575G-549D | |
| 1366x768 Medium Preset AF:2x (sort by value) | |
| HP Pavilion 15t-au100 CTO (W0P31AV) | |
| Acer Aspire E5-575G-549D | |
| 1920x1080 High Preset AA:FX AF:4x (sort by value) | |
| HP Pavilion 15t-au100 CTO (W0P31AV) | |
| Acer Aspire E5-575G-549D | |
| Dell XPS 15 9550 i7 FHD | |
| HP Pavilion 15 UHD T9Y85AV | |
| 1920x1080 Very High Preset AA:FX AF:16x (sort by value) | |
| HP Pavilion 15t-au100 CTO (W0P31AV) | |
| Acer Aspire E5-575G-549D | |
| Dell XPS 15 9550 i7 FHD | |
| HP Pavilion 15 UHD T9Y85AV | |
| GRID 2 | |
| 1024x768 Ultra Low Preset (sort by value) | |
| HP Pavilion 15t-au100 CTO (W0P31AV) | |
| 1366x768 Medium Preset (sort by value) | |
| HP Pavilion 15t-au100 CTO (W0P31AV) | |
| 1366x768 High Preset AA:2xMS (sort by value) | |
| HP Pavilion 15t-au100 CTO (W0P31AV) | |
| 1920x1080 Ultra Preset AA:4xMS (sort by value) | |
| HP Pavilion 15t-au100 CTO (W0P31AV) | |
| Metro: Last Light | |
| 1024x768 Low (DX10) AF:4x (sort by value) | |
| HP Pavilion 15t-au100 CTO (W0P31AV) | |
| 1366x768 Medium (DX10) AF:4x (sort by value) | |
| HP Pavilion 15t-au100 CTO (W0P31AV) | |
| 1366x768 High (DX11) AF:16x (sort by value) | |
| HP Pavilion 15t-au100 CTO (W0P31AV) | |
| Dell XPS 15 9550 i7 FHD | |
| HP Pavilion 15 UHD T9Y85AV | |
| 1920x1080 Very High (DX11) AF:16x (sort by value) | |
| HP Pavilion 15t-au100 CTO (W0P31AV) | |
| Dell XPS 15 9550 i7 FHD | |
| HP Pavilion 15 UHD T9Y85AV | |
| BioShock Infinite | |
| 1280x720 Very Low Preset (sort by value) | |
| HP Pavilion 15t-au100 CTO (W0P31AV) | |
| Asus Zenbook UX510UW-CN044T | |
| Lenovo IdeaPad 510-15IKB 80SV0087GE | |
| Acer Aspire E5-575G-549D | |
| 1366x768 Medium Preset (sort by value) | |
| HP Pavilion 15t-au100 CTO (W0P31AV) | |
| Asus Zenbook UX510UW-CN044T | |
| Lenovo IdeaPad 510-15IKB 80SV0087GE | |
| Acer Aspire E5-575G-549D | |
| 1366x768 High Preset (sort by value) | |
| HP Pavilion 15t-au100 CTO (W0P31AV) | |
| Asus Zenbook UX510UW-CN044T | |
| Lenovo IdeaPad 510-15IKB 80SV0087GE | |
| Acer Aspire E5-575G-549D | |
| Dell XPS 15 9550 i7 FHD | |
| HP Pavilion 15 UHD T9Y85AV | |
| 1920x1080 Ultra Preset, DX11 (DDOF) (sort by value) | |
| HP Pavilion 15t-au100 CTO (W0P31AV) | |
| Asus Zenbook UX510UW-CN044T | |
| Lenovo IdeaPad 510-15IKB 80SV0087GE | |
| Acer Aspire E5-575G-549D | |
| Dell XPS 15 9550 i7 FHD | |
| HP Pavilion 15 UHD T9Y85AV | |
| Tomb Raider | |
| 1024x768 Low Preset (sort by value) | |
| HP Pavilion 15t-au100 CTO (W0P31AV) | |
| Asus Zenbook UX510UW-CN044T | |
| 1366x768 Normal Preset AA:FX AF:4x (sort by value) | |
| HP Pavilion 15t-au100 CTO (W0P31AV) | |
| Asus Zenbook UX510UW-CN044T | |
| 1366x768 High Preset AA:FX AF:8x (sort by value) | |
| HP Pavilion 15t-au100 CTO (W0P31AV) | |
| Asus Zenbook UX510UW-CN044T | |
| Dell XPS 15 9550 i7 FHD | |
| 1920x1080 Ultra Preset AA:FX AF:16x (sort by value) | |
| HP Pavilion 15t-au100 CTO (W0P31AV) | |
| Asus Zenbook UX510UW-CN044T | |
| Dell XPS 15 9550 i7 FHD | |
| Company of Heroes 2 | |
| 1024x768 Minimum / Low / Off AA:Off (sort by value) | |
| HP Pavilion 15t-au100 CTO (W0P31AV) | |
| 1366x768 Medium AA:Off (sort by value) | |
| HP Pavilion 15t-au100 CTO (W0P31AV) | |
| 1366x768 High AA:Medium (sort by value) | |
| HP Pavilion 15t-au100 CTO (W0P31AV) | |
| 1920x1080 Maximum / Higher / High AA:High (sort by value) | |
| HP Pavilion 15t-au100 CTO (W0P31AV) | |
| Sleeping Dogs | |
| 1024x768 Low Preset AA:Normal (sort by value) | |
| HP Pavilion 15t-au100 CTO (W0P31AV) | |
| 1366x768 Medium Preset AA:Normal (sort by value) | |
| HP Pavilion 15t-au100 CTO (W0P31AV) | |
| 1366x768 High Preset AA:High (sort by value) | |
| HP Pavilion 15t-au100 CTO (W0P31AV) | |
| Dell XPS 15 9550 i7 FHD | |
| HP Pavilion 15 UHD T9Y85AV | |
| 1920x1080 Extreme Preset AA:Extreme (sort by value) | |
| HP Pavilion 15t-au100 CTO (W0P31AV) | |
| Dell XPS 15 9550 i7 FHD | |
| HP Pavilion 15 UHD T9Y85AV | |
| baixo | média | alto | ultra | |
| Dirt 3 (2011) | 67.8 | 48.7 | 41.6 | 28.9 |
| Anno 2070 (2011) | 130.4 | 66.8 | 42.5 | 21 |
| Sleeping Dogs (2012) | 92.9 | 69.9 | 34 | 9 |
| Hitman: Absolution (2012) | 61.3 | 38.3 | 17.8 | 6.6 |
| Tomb Raider (2013) | 137 | 66.4 | 37.4 | 18.3 |
| BioShock Infinite (2013) | 90.3 | 62.4 | 42.7 | 14.6 |
| Metro: Last Light (2013) | 49.3 | 38.4 | 23.5 | 11.6 |
| GRID 2 (2013) | 125.4 | 89.8 | 60.3 | 21.2 |
| Company of Heroes 2 (2013) | 36.1 | 29.5 | 21 | 7.2 |
| F1 2013 (2013) | 120 | 81 | 41 | 31 |
| Rise of the Tomb Raider (2016) | 34.7 | 22.1 | 13.2 | 10.1 |
Barulho
| Ocioso |
| 32.2 / 32.2 / 33.7 dB |
| Carga |
| 39.4 / 42.2 dB |
 | ||
30 dB silencioso 40 dB(A) audível 50 dB(A) ruidosamente alto |
||
min: | ||
| HP Pavilion 15t-au100 CTO (W0P31AV) GeForce 940MX, i7-7500U, Toshiba MQ01ABD100 | Asus Zenbook UX510UW-CN044T GeForce GTX 960M, 6500U, SanDisk SD8SNAT256G1002 | Lenovo IdeaPad 510-15IKB 80SV0087GE GeForce 940MX, i7-7500U, Liteonit CV3-DE256 | Acer Aspire E5-575G-549D GeForce GTX 950M, i5-7200U, Toshiba MQ01ABD100 | Dell XPS 15 9550 i7 FHD GeForce GTX 960M, 6700HQ, Samsung PM951 NVMe 512 GB | HP Pavilion 15 UHD T9Y85AV GeForce GTX 960M, 6700HQ, SanDisk Z400s SD8SNAT-128G | |
|---|---|---|---|---|---|---|
| Noise | -1% | 5% | 7% | 5% | -4% | |
| Idle Minimum * | 32.2 | 31.6 2% | 32.6 -1% | 30.8 4% | 29.2 9% | 32.3 -0% |
| Idle Average * | 32.2 | 31.6 2% | 32.6 -1% | 30.8 4% | 29.3 9% | 32.4 -1% |
| Idle Maximum * | 33.7 | 33.4 1% | 32.6 3% | 30.8 9% | 29.5 12% | 32.4 4% |
| Load Average * | 39.4 | 41.7 -6% | 35.3 10% | 33.4 15% | 36.5 7% | 40.5 -3% |
| Load Maximum * | 42.2 | 44.8 -6% | 37.1 12% | 40.1 5% | 47.7 -13% | 50.3 -19% |
| off / environment * | 31.6 | 31.6 | 28.9 | 29.5 |
* ... smaller is better
(±) The maximum temperature on the upper side is 40 °C / 104 F, compared to the average of 36.9 °C / 98 F, ranging from 21.1 to 71 °C for the class Multimedia.
(+) The bottom heats up to a maximum of 34.8 °C / 95 F, compared to the average of 39.1 °C / 102 F
(+) In idle usage, the average temperature for the upper side is 24.4 °C / 76 F, compared to the device average of 31.2 °C / 88 F.
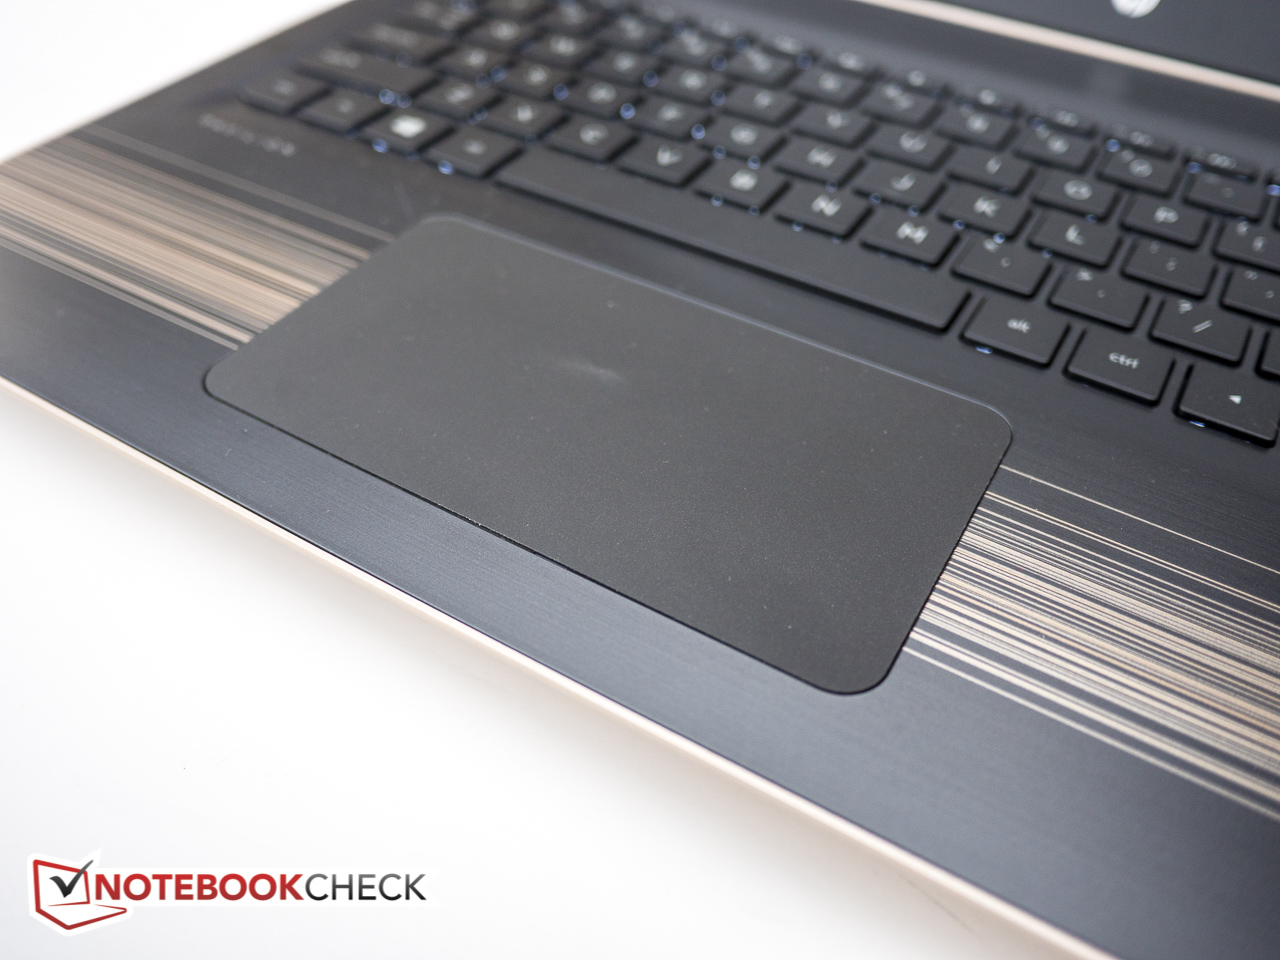
(+) The palmrests and touchpad are cooler than skin temperature with a maximum of 27.2 °C / 81 F and are therefore cool to the touch.
(±) The average temperature of the palmrest area of similar devices was 28.8 °C / 83.8 F (+1.6 °C / 2.8 F).
HP Pavilion 15t-au100 CTO (W0P31AV) audio analysis
(-) | not very loud speakers (58 dB)
Bass 100 - 315 Hz
(±) | reduced bass - on average 14.1% lower than median
(±) | linearity of bass is average (12.4% delta to prev. frequency)
Mids 400 - 2000 Hz
(±) | higher mids - on average 5.6% higher than median
(±) | linearity of mids is average (7.2% delta to prev. frequency)
Highs 2 - 16 kHz
(+) | balanced highs - only 3.1% away from median
(+) | highs are linear (6.6% delta to prev. frequency)
Overall 100 - 16.000 Hz
(-) | overall sound is not linear (32.9% difference to median)
Compared to same class
» 97% of all tested devices in this class were better, 1% similar, 2% worse
» The best had a delta of 5%, average was 18%, worst was 45%
Compared to all devices tested
» 90% of all tested devices were better, 2% similar, 8% worse
» The best had a delta of 4%, average was 25%, worst was 134%
Apple MacBook 12 (Early 2016) 1.1 GHz audio analysis
(+) | speakers can play relatively loud (83.6 dB)
Bass 100 - 315 Hz
(±) | reduced bass - on average 11.3% lower than median
(±) | linearity of bass is average (14.2% delta to prev. frequency)
Mids 400 - 2000 Hz
(+) | balanced mids - only 2.4% away from median
(+) | mids are linear (5.5% delta to prev. frequency)
Highs 2 - 16 kHz
(+) | balanced highs - only 2% away from median
(+) | highs are linear (4.5% delta to prev. frequency)
Overall 100 - 16.000 Hz
(+) | overall sound is linear (10.2% difference to median)
Compared to same class
» 5% of all tested devices in this class were better, 2% similar, 93% worse
» The best had a delta of 5%, average was 19%, worst was 53%
Compared to all devices tested
» 3% of all tested devices were better, 1% similar, 96% worse
» The best had a delta of 4%, average was 25%, worst was 134%
| desligado | |
| Ocioso | |
| Carga |
|
| HP Pavilion 15t-au100 CTO (W0P31AV) i7-7500U, GeForce 940MX, Toshiba MQ01ABD100, IPS, 1920x1080, 15.60 | Asus Zenbook UX510UW-CN044T 6500U, GeForce GTX 960M, SanDisk SD8SNAT256G1002, IPS, 1920x1080, 15.60 | Lenovo IdeaPad 510-15IKB 80SV0087GE i7-7500U, GeForce 940MX, Liteonit CV3-DE256, IPS, 1920x1080, 15.60 | Acer Aspire E5-575G-549D i5-7200U, GeForce GTX 950M, Toshiba MQ01ABD100, TN, 1920x1080, 15.60 | HP Pavilion 15 UHD T9Y85AV 6700HQ, GeForce GTX 960M, SanDisk Z400s SD8SNAT-128G, IPS, 3840x2160, 15.60 | |
|---|---|---|---|---|---|
| Power Consumption | -18% | 15% | -10% | -69% | |
| Idle Minimum * | 6.16 | 5 19% | 3.9 37% | 6 3% | 8.3 -35% |
| Idle Average * | 8.48 | 8.9 -5% | 7.4 13% | 8.1 4% | 14.8 -75% |
| Idle Maximum * | 9.62 | 11.8 -23% | 9.5 1% | 9.8 -2% | 16.8 -75% |
| Load Average * | 41.63 | 55 -32% | 41 2% | 52.5 -26% | 71 -71% |
| Load Maximum * | 63.22 | 93 -47% | 48 24% | 81.6 -29% | 119.2 -89% |
* ... smaller is better
| HP Pavilion 15t-au100 CTO (W0P31AV) i7-7500U, GeForce 940MX, 41 Wh | Asus Zenbook UX510UW-CN044T 6500U, GeForce GTX 960M, 48 Wh | Lenovo IdeaPad 510-15IKB 80SV0087GE i7-7500U, GeForce 940MX, 30 Wh | Acer Aspire E5-575G-549D i5-7200U, GeForce GTX 950M, 62 Wh | Dell XPS 15 9550 i7 FHD 6700HQ, GeForce GTX 960M, 84 Wh | HP Pavilion 15 UHD T9Y85AV 6700HQ, GeForce GTX 960M, 61.5 Wh | |
|---|---|---|---|---|---|---|
| Battery Runtime | 57% | 25% | 50% | 90% | 8% | |
| Reader / Idle | 438 | 816 86% | 767 75% | 979 124% | 510 16% | |
| WiFi v1.3 | 220 | 430 95% | 275 25% | 451 105% | 544 147% | 264 20% |
| Load | 106 | 95 -10% | 75 -29% | 106 0% | 93 -12% |
Pro
Contra


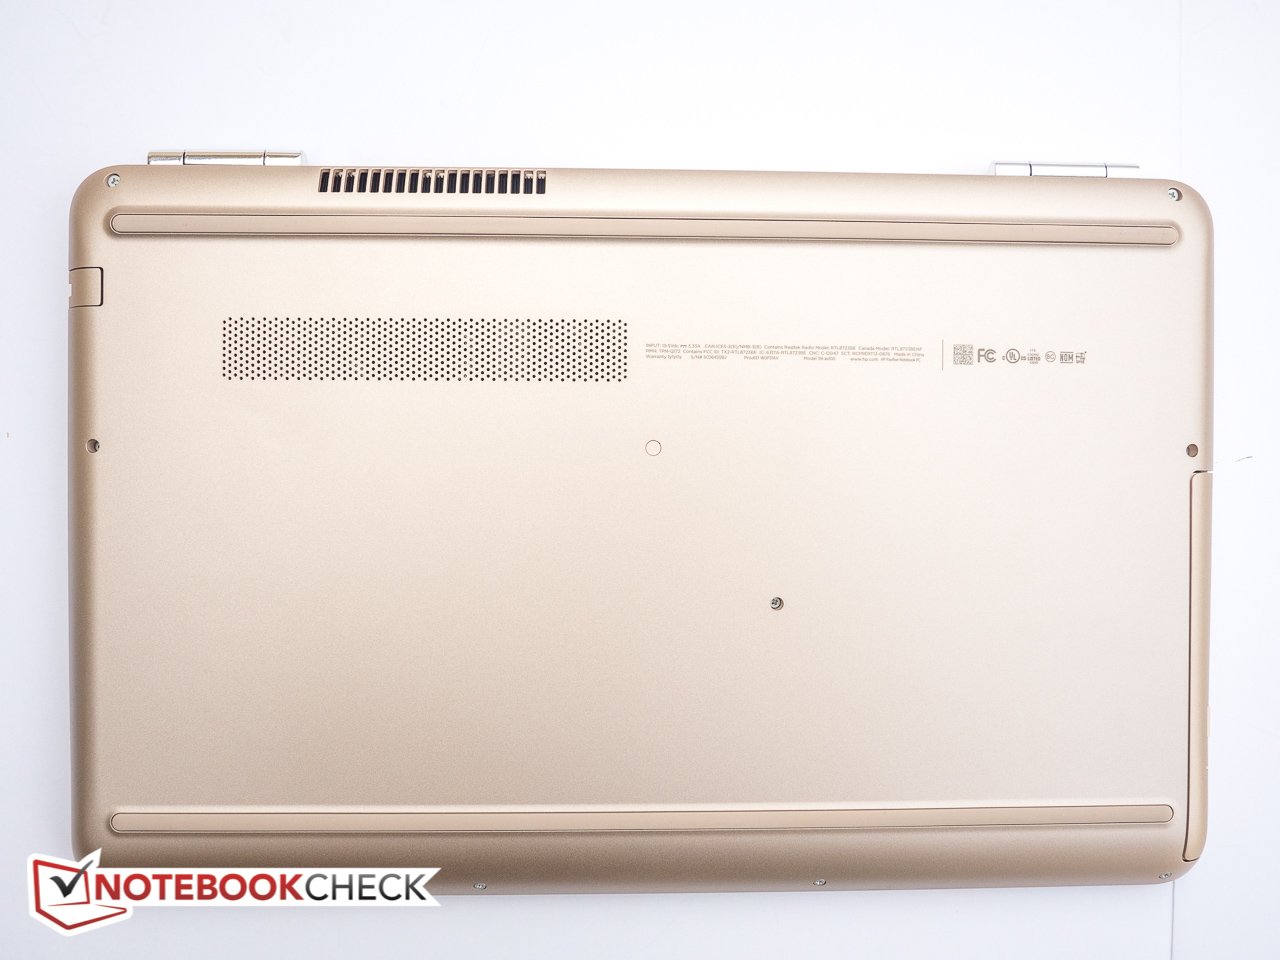
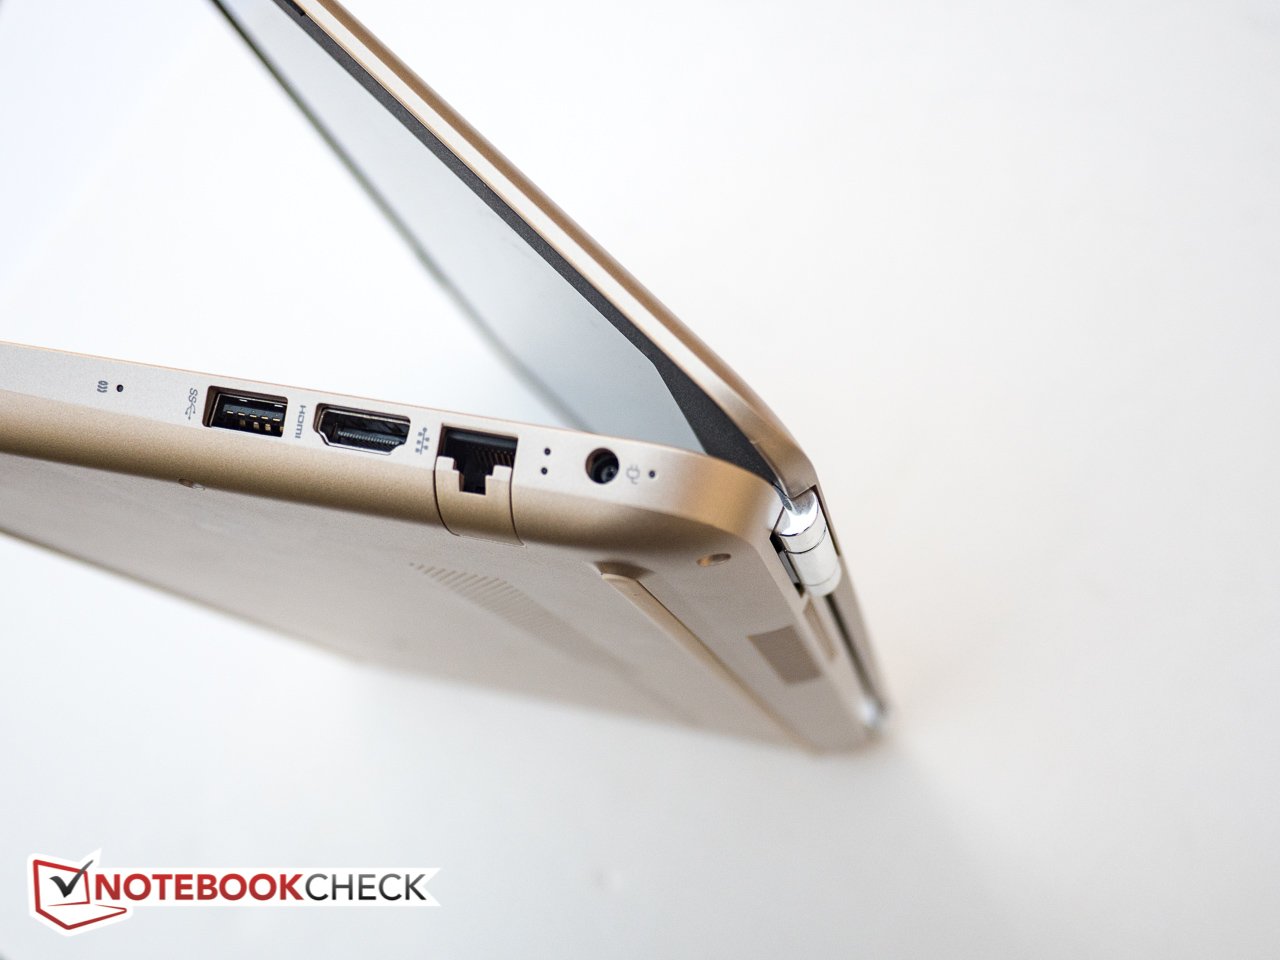
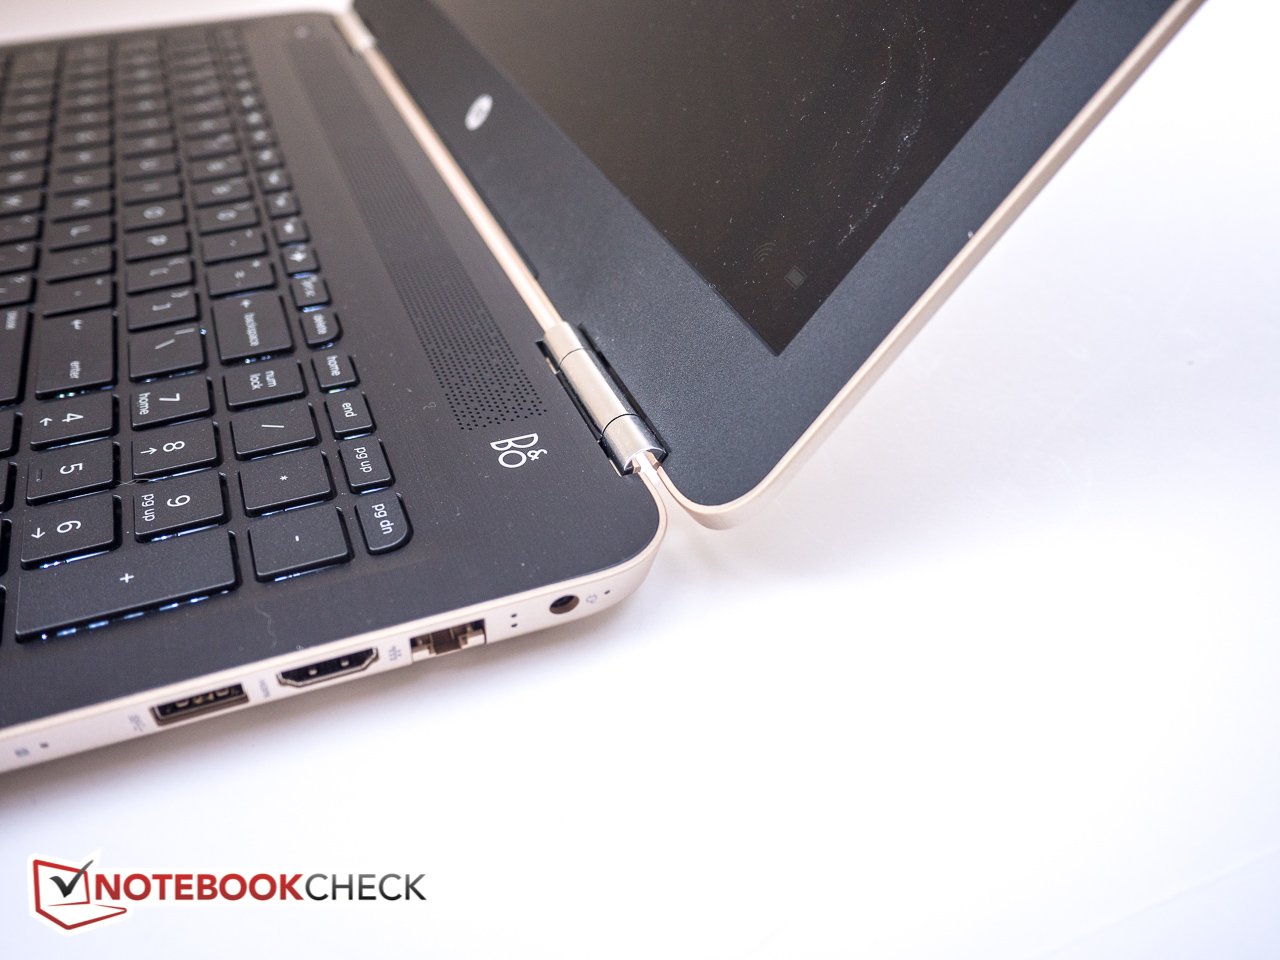
O HP Pavilion 15t-au100 é um portátil atraente de 15,6 polegadas com muito desempenho para lidar com as tarefas do dia a dia. Equipado com uma CPU dual-core i7 da geração atual, 8 GB de RAM e uma placa de vídeo GeForce 940MX de gama média, é possível jogar jogos leves a moderados. Enquanto o desempenho geral é muito bom, o gargalo do sistema sem dúvida é o disco rígido mecânico, que gira a pobres 5400 RPM. O portátil simplesmente não se sente tão veloz quanto outros sistemas concorrentes com SSDs. Afortunadamente, alguns modelos na série possuem SSDs PCIe NVMe M.2 e inclusive podem ser equipados com um SSD e com uma unidade SATA convencional para dar uma acelerada no desempenho enquanto mantém o armazenamento econômico.
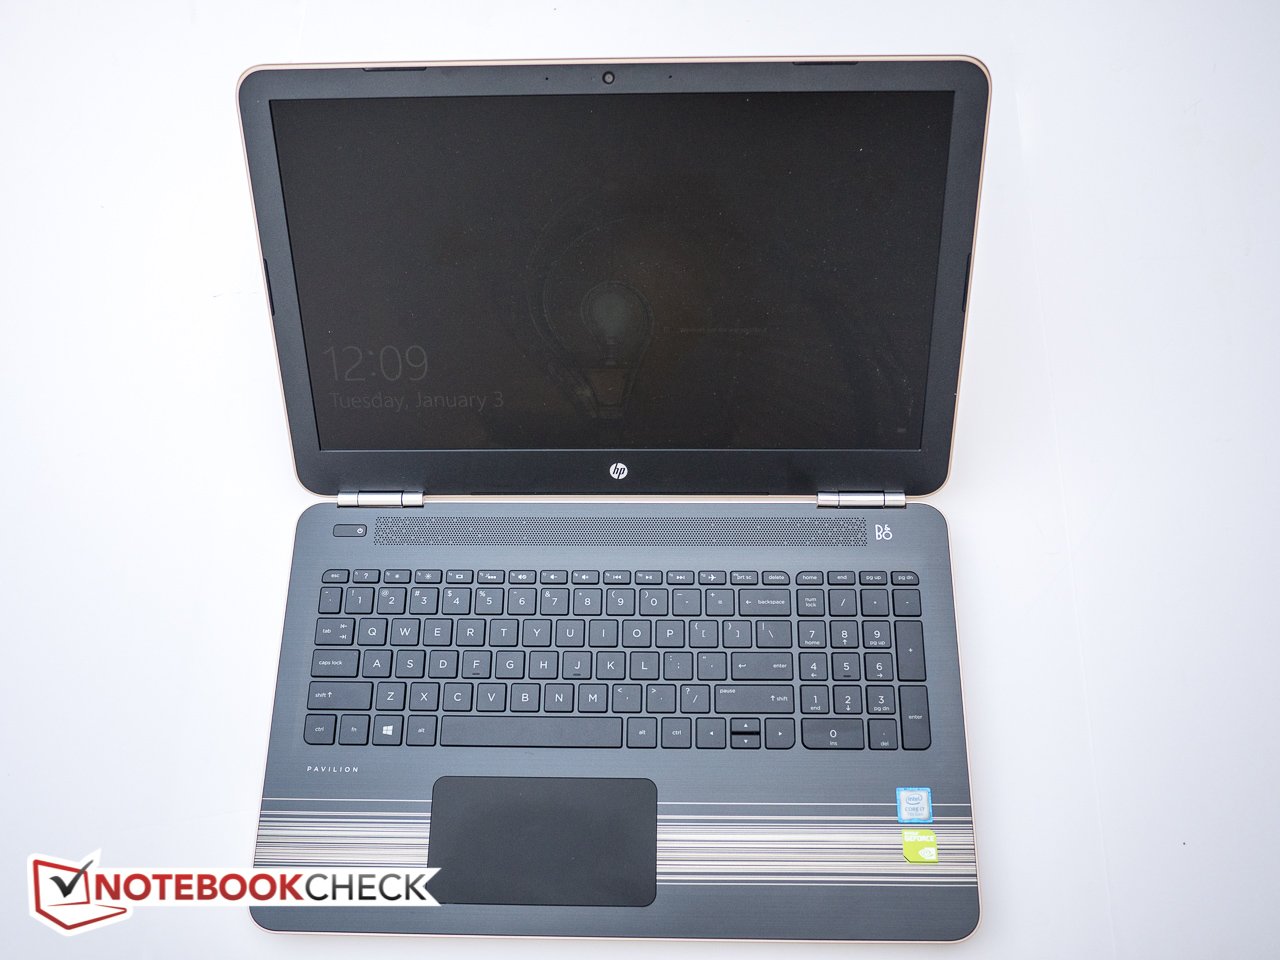
Outro ponto de crítica é a tela, que infelizmente é muito escura e refletiva. Esta combinação faz com que trabalhar em exteriores ou em ambientes mais brilhantes seja um desafio. Finalmente, a duração da bateria também é escassa, com alguns concorrentes que duram o dobro.
O HP Pavilion 15t oferece bom desempenho, mas é puxado para trás pelo seu disco rígido mecânico, tela ruim e curta duração da bateria. A não ser que a HP aumente o brilho do modelo Full-HD, preferiríamos optar pelo modelo UHD com unidade SSD e gráficos mais poderosos.
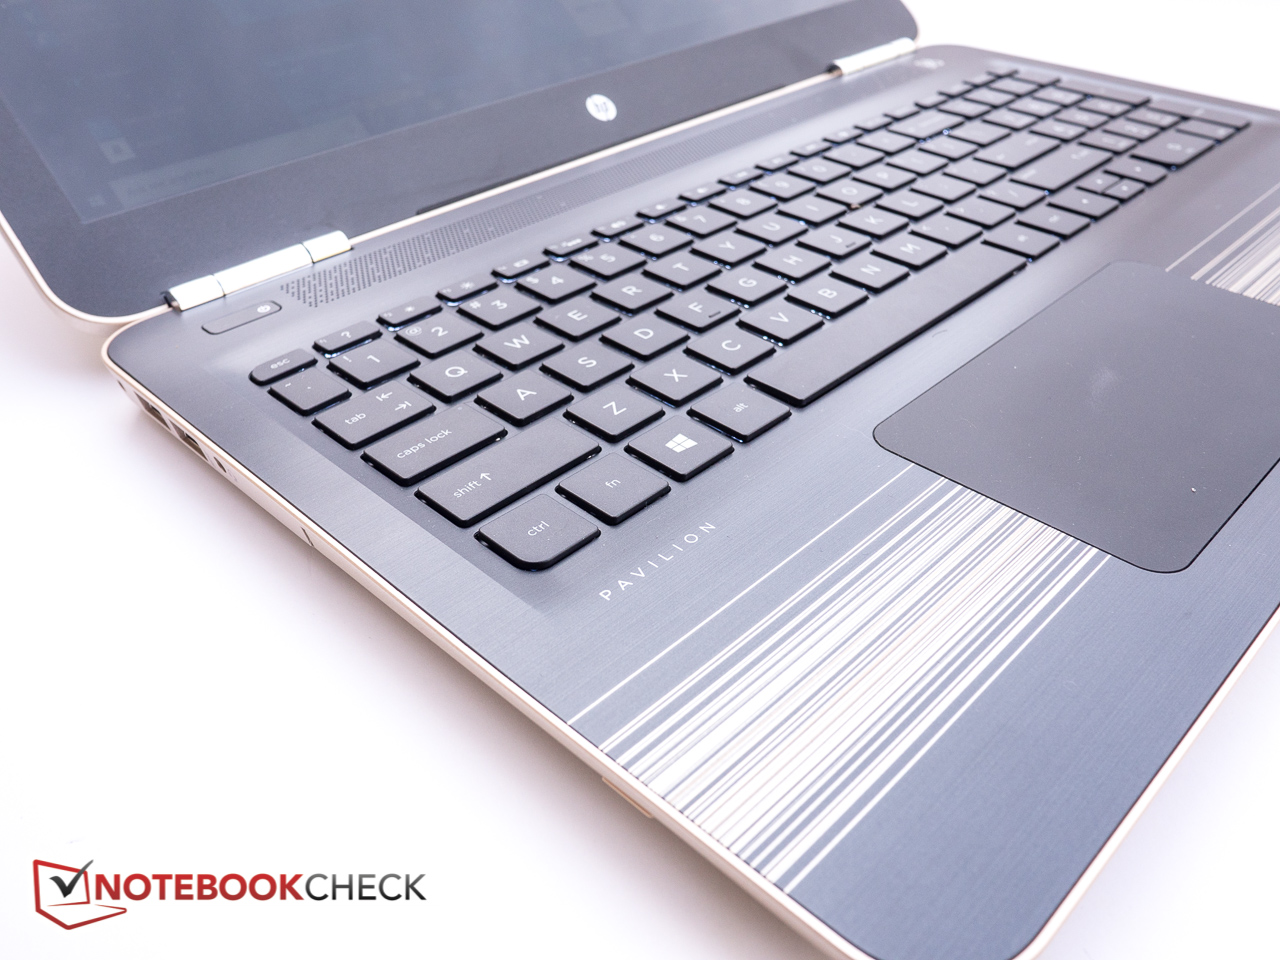
HP Pavilion 15t-au100 CTO (W0P31AV)
-
01/07/2017 v6(old)
Bernhard Pechlaner
Pricecompare
