 Deutsch
 English
 Español
 Français
 Italiano
 Nederlands
 Polski
 Português
 Русский
 Türkçe
 Svenska
 Chinese
 Magyar
Breve Análise do Portátil HP ProBook 640 G2
| SD Card Reader | |
| average JPG Copy Test (av. of 3 runs) | |
| Dell Latitude 14 E5470 | |
| HP ProBook 640 G2-T9X60ET | |
| Toshiba Tecra Z40-C-106 | |
| Lenovo ThinkPad L460-20FVS01400 | |
| maximum AS SSD Seq Read Test (1GB) | |
| Dell Latitude 14 E5470 | |
| HP ProBook 640 G2-T9X60ET | |
| Toshiba Tecra Z40-C-106 | |
| Lenovo ThinkPad L460-20FVS01400 | |
| Networking | |
| WiFi Speed Client 1m | |
| WiFi Speed Server 1m |
| |||||||||||||||||||||||||
iluminação: 93 %
iluminação com acumulador: 321 cd/m²
Contraste: 516:1 (Preto: 0.61 cd/m²)
ΔE Color 8.8 | 0.5-29.43 Ø5
ΔE Greyscale 9.44 | 0.57-98 Ø5.3
74.78% sRGB (Argyll 1.6.3 3D)
47.37% AdobeRGB 1998 (Argyll 1.6.3 3D)
51.2% AdobeRGB 1998 (Argyll 2.2.0 3D)
74.6% sRGB (Argyll 2.2.0 3D)
49.54% Display P3 (Argyll 2.2.0 3D)
Gamma: 2.53
| HP ProBook 640 G2-T9X60ET Chi Mei CMN14C0, TN-Panel, 1920x1080, 14.00 | Lenovo ThinkPad L460-20FVS01400 Lenovo N140HCE-EAA, IPS, 1920x1080, 14.00 | Dell Latitude 14 E5470 LG Philips LGD04B1 140WHU, TN, 1366x768, 14.00 | Toshiba Tecra Z40-C-106 Toshiba TOS508F, IPS, 1920x1080, 14.00 | |
|---|---|---|---|---|
| Display | -15% | -19% | 22% | |
| Display P3 Coverage | 49.54 | 42.2 -15% | 40.06 -19% | 64.8 31% |
| sRGB Coverage | 74.6 | 62.3 -16% | 60.3 -19% | 84.4 13% |
| AdobeRGB 1998 Coverage | 51.2 | 43.72 -15% | 41.42 -19% | 61.7 21% |
| Response Times | -13% | -26% | 10% | |
| Response Time Grey 50% / Grey 80% * | 43.2 ? | 44.4 ? -3% | 56.8 ? -31% | 32.8 ? 24% |
| Response Time Black / White * | 24 ? | 29.6 ? -23% | 28.8 ? -20% | 25.2 ? -5% |
| PWM Frequency | 200 ? | |||
| Screen | 11% | -20% | 18% | |
| Brightness middle | 315 | 245 -22% | 229 -27% | 269 -15% |
| Brightness | 304 | 225 -26% | 207 -32% | 257 -15% |
| Brightness Distribution | 93 | 83 -11% | 80 -14% | 86 -8% |
| Black Level * | 0.61 | 0.24 61% | 0.69 -13% | 0.52 15% |
| Contrast | 516 | 1021 98% | 332 -36% | 517 0% |
| Colorchecker dE 2000 * | 8.8 | 6.89 22% | 10.16 -15% | 3.45 61% |
| Colorchecker dE 2000 max. * | 15.03 | 17.62 -17% | 17.18 -14% | 9.34 38% |
| Greyscale dE 2000 * | 9.44 | 6.45 32% | 10.87 -15% | 2.28 76% |
| Gamma | 2.53 87% | 2.46 89% | 2.41 91% | 2.38 92% |
| CCT | 11794 55% | 6857 95% | 12881 50% | 6230 104% |
| Color Space (Percent of AdobeRGB 1998) | 47.37 | 40.1 -15% | 38.4 -19% | 55.24 17% |
| Color Space (Percent of sRGB) | 74.78 | 61.8 -17% | 60.4 -19% | 84.32 13% |
| Total Average (Program / Settings) | -6% /
2% | -22% /
-21% | 17% /
18% |
* ... smaller is better
Display Response Times
| ↔ Response Time Black to White | ||
|---|---|---|
| 24 ms ... rise ↗ and fall ↘ combined | ↗ 17.6 ms rise | 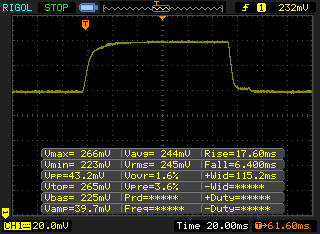 |
| ↘ 6.4 ms fall | ||
| The screen shows good response rates in our tests, but may be too slow for competitive gamers. In comparison, all tested devices range from 0.1 (minimum) to 240 (maximum) ms. » 48 % of all devices are better. This means that the measured response time is worse than the average of all tested devices (21.5 ms). | ||
| ↔ Response Time 50% Grey to 80% Grey | ||
| 43.2 ms ... rise ↗ and fall ↘ combined | ↗ 21.6 ms rise | 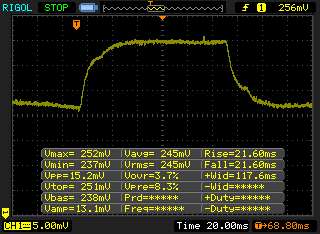 |
| ↘ 21.6 ms fall | ||
| The screen shows slow response rates in our tests and will be unsatisfactory for gamers. In comparison, all tested devices range from 0.2 (minimum) to 636 (maximum) ms. » 68 % of all devices are better. This means that the measured response time is worse than the average of all tested devices (33.8 ms). | ||
Screen Flickering / PWM (Pulse-Width Modulation)
| Screen flickering / PWM detected | 200 Hz | ≤ 90 % brightness setting | 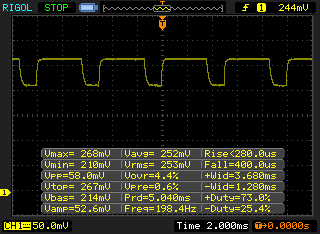 |
The display backlight flickers at 200 Hz (worst case, e.g., utilizing PWM) Flickering detected at a brightness setting of 90 % and below. There should be no flickering or PWM above this brightness setting. The frequency of 200 Hz is relatively low, so sensitive users will likely notice flickering and experience eyestrain at the stated brightness setting and below. In comparison: 53 % of all tested devices do not use PWM to dim the display. If PWM was detected, an average of 17933 (minimum: 5 - maximum: 3846000) Hz was measured. | |||
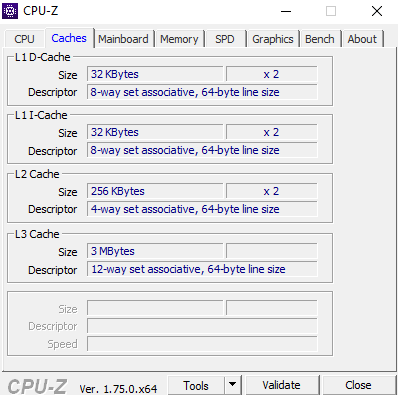
| Cinebench R15 | |
| CPU Single 64Bit | |
| Lenovo ThinkPad T460s-20FA003GGE | |
| Lenovo ThinkPad L460-20FVS01400 | |
| Dell Latitude 14 E5470 | |
| HP ProBook 640 G2-T9X60ET | |
| Lenovo ThinkPad E560 20EV000MGE | |
| Toshiba Tecra Z40-C-106 | |
| CPU Multi 64Bit | |
| Lenovo ThinkPad T460s-20FA003GGE | |
| Dell Latitude 14 E5470 | |
| Lenovo ThinkPad L460-20FVS01400 | |
| HP ProBook 640 G2-T9X60ET | |
| Lenovo ThinkPad E560 20EV000MGE | |
| Toshiba Tecra Z40-C-106 | |
| Cinebench R11.5 | |
| CPU Single 64Bit | |
| Lenovo ThinkPad T460s-20FA003GGE | |
| Dell Latitude 14 E5470 | |
| Lenovo ThinkPad L460-20FVS01400 | |
| HP ProBook 640 G2-T9X60ET | |
| Lenovo ThinkPad E560 20EV000MGE | |
| Toshiba Tecra Z40-C-106 | |
| CPU Multi 64Bit | |
| Lenovo ThinkPad T460s-20FA003GGE | |
| Dell Latitude 14 E5470 | |
| Lenovo ThinkPad L460-20FVS01400 | |
| HP ProBook 640 G2-T9X60ET | |
| Lenovo ThinkPad E560 20EV000MGE | |
| Toshiba Tecra Z40-C-106 | |
| X264 HD Benchmark 4.0 | |
| Pass 1 | |
| Lenovo ThinkPad T460s-20FA003GGE | |
| HP ProBook 640 G2-T9X60ET | |
| Pass 2 | |
| Lenovo ThinkPad T460s-20FA003GGE | |
| HP ProBook 640 G2-T9X60ET | |
| HP ProBook 640 G2-T9X60ET Samsung SSD PM871 MZNLN256HCHP | Lenovo ThinkPad L460-20FVS01400 Toshiba HG6 THNSFJ256GCSU | Dell Latitude 14 E5470 Liteon L8H-256V2G | Toshiba Tecra Z40-C-106 Toshiba HG6 THNSNJ256G8NY | Lenovo ThinkPad T460s-20FA003GGE Samsung SSD SM951a 512GB M.2 PCIe 3.0 x4 NVMe (MZVKV512) | Lenovo ThinkPad T460s-20FAS2G900 Samsung SSD PM961 1TB M.2 PCIe 3.0 x4 NVMe (MZSLW1T0) | |
|---|---|---|---|---|---|---|
| CrystalDiskMark 3.0 | -13% | -5% | -5% | 180% | 134% | |
| Read Seq | 492.8 | 480.9 -2% | 508 3% | 521 6% | 1778 261% | 1676 240% |
| Write Seq | 303.2 | 426.4 41% | 360.6 19% | 444.5 47% | 1530 405% | 1286 324% |
| Read 512 | 417.4 | 361.8 -13% | 374.1 -10% | 420.2 1% | 1339 221% | 546 31% |
| Write 512 | 301.5 | 220.9 -27% | 300.2 0% | 421 40% | 1506 400% | 1031 242% |
| Read 4k | 33.28 | 21.51 -35% | 31.98 -4% | 20.32 -39% | 51.3 54% | 46.31 39% |
| Write 4k | 84.6 | 71.5 -15% | 93.1 10% | 79.6 -6% | 139.3 65% | 150.1 77% |
| Read 4k QD32 | 394.2 | 277.6 -30% | 274.7 -30% | 229 -42% | 561 42% | 586 49% |
| Write 4k QD32 | 295.5 | 230.4 -22% | 205.6 -30% | 153.6 -48% | 277 -6% | 496.3 68% |

| PCMark 8 | |
| Home Score Accelerated v2 | |
| Lenovo ThinkPad T460s-20FA003GGE | |
| Dell Latitude 14 E5470 | |
| HP EliteBook 840 G3 T9X59ET#ABD | |
| HP ProBook 640 G2-T9X60ET | |
| Toshiba Tecra Z40-C-106 | |
| Lenovo ThinkPad L460-20FVS01400 | |
| Work Score Accelerated v2 | |
| Dell Latitude 14 E5470 | |
| Lenovo ThinkPad L460-20FVS01400 | |
| Lenovo ThinkPad T460s-20FA003GGE | |
| Toshiba Tecra Z40-C-106 | |
| HP EliteBook 840 G3 T9X59ET#ABD | |
| HP ProBook 640 G2-T9X60ET | |
| Creative Score Accelerated v2 | |
| Lenovo ThinkPad T460s-20FA003GGE | |
| Dell Latitude 14 E5470 | |
| HP ProBook 640 G2-T9X60ET | |
| Lenovo ThinkPad L460-20FVS01400 | |
| PCMark 7 Score | 4917 pontos | |
| PCMark 8 Home Score Accelerated v2 | 3224 pontos | |
| PCMark 8 Creative Score Accelerated v2 | 3891 pontos | |
| PCMark 8 Work Score Accelerated v2 | 4260 pontos | |
Ajuda | ||
| 3DMark 11 - 1280x720 Performance GPU | |
| Lenovo ThinkPad L460-20FVS01400 | |
| Lenovo ThinkPad T460s-20FA003GGE | |
| HP ProBook 640 G2-T9X60ET | |
| HP EliteBook 840 G3 T9X59ET#ABD | |
| Dell Latitude 14 E5470 | |
| Toshiba Tecra Z40-C-106 | |
| 3DMark | |
| 1280x720 Cloud Gate Standard Graphics | |
| Lenovo ThinkPad T460s-20FA003GGE | |
| HP ProBook 640 G2-T9X60ET | |
| HP EliteBook 840 G3 T9X59ET#ABD | |
| Dell Latitude 14 E5470 | |
| Lenovo ThinkPad L460-20FVS01400 | |
| 1920x1080 Fire Strike Graphics | |
| Lenovo ThinkPad L460-20FVS01400 | |
| Lenovo ThinkPad T460s-20FA003GGE | |
| HP EliteBook 840 G3 T9X59ET#ABD | |
| Dell Latitude 14 E5470 | |
| HP ProBook 640 G2-T9X60ET | |
| 3DMark 06 Standard Score | 7702 pontos | |
| 3DMark 11 Performance | 1500 pontos | |
| 3DMark Ice Storm Standard Score | 45053 pontos | |
| 3DMark Cloud Gate Standard Score | 5073 pontos | |
| 3DMark Fire Strike Score | 720 pontos | |
Ajuda | ||
| baixo | média | alto | ultra | |
| BioShock Infinite (2013) | 43.7 | 24.5 | 20.2 | 6.1 |
| Metro: Last Light (2013) | 23.5 | 18.2 | 11.5 | |
| Dirt Rally (2015) | 72.1 | 20.1 | 12.5 |
| HP ProBook 640 G2-T9X60ET HD Graphics 520, 6200U, Samsung SSD PM871 MZNLN256HCHP | Lenovo ThinkPad L460-20FVS01400 Radeon R5 M330, 6500U, Toshiba HG6 THNSFJ256GCSU | Dell Latitude 14 E5470 HD Graphics 520, 6300U, Liteon L8H-256V2G | Toshiba Tecra Z40-C-106 HD Graphics 520, 6200U, Toshiba HG6 THNSNJ256G8NY | |
|---|---|---|---|---|
| Noise | -3% | -2% | -3% | |
| off / environment * | 29 | 29.2 -1% | 29.2 -1% | 29 -0% |
| Idle Minimum * | 29 | 29.2 -1% | 29.2 -1% | 29.8 -3% |
| Idle Average * | 29.8 | 29.2 2% | 29.2 2% | 29.8 -0% |
| Idle Maximum * | 30.2 | 29.2 3% | 29.2 3% | 29.8 1% |
| Load Average * | 30.2 | 32.5 -8% | 32.1 -6% | 32.6 -8% |
| Load Maximum * | 33.9 | 37.2 -10% | 36.8 -9% | 37.2 -10% |
* ... smaller is better
Barulho
| Ocioso |
| 29 / 29.8 / 30.2 dB |
| Carga |
| 30.2 / 33.9 dB |
 | ||
30 dB silencioso 40 dB(A) audível 50 dB(A) ruidosamente alto |
||
min: | ||
(±) The maximum temperature on the upper side is 40.7 °C / 105 F, compared to the average of 34.2 °C / 94 F, ranging from 21.2 to 62.5 °C for the class Office.
(±) The bottom heats up to a maximum of 42.6 °C / 109 F, compared to the average of 36.7 °C / 98 F
(+) In idle usage, the average temperature for the upper side is 28.5 °C / 83 F, compared to the device average of 29.5 °C / 85 F.
(+) The palmrests and touchpad are cooler than skin temperature with a maximum of 30.7 °C / 87.3 F and are therefore cool to the touch.
(-) The average temperature of the palmrest area of similar devices was 27.7 °C / 81.9 F (-3 °C / -5.4 F).
| desligado | |
| Ocioso | |
| Carga |
|
| HP ProBook 640 G2-T9X60ET 6200U, HD Graphics 520, Samsung SSD PM871 MZNLN256HCHP, TN-Panel, 1920x1080, 14.00 | Lenovo ThinkPad L460-20FVS01400 6500U, Radeon R5 M330, Toshiba HG6 THNSFJ256GCSU, IPS, 1920x1080, 14.00 | Dell Latitude 14 E5470 6300U, HD Graphics 520, Liteon L8H-256V2G, TN, 1366x768, 14.00 | Toshiba Tecra Z40-C-106 6200U, HD Graphics 520, Toshiba HG6 THNSNJ256G8NY, IPS, 1920x1080, 14.00 | |
|---|---|---|---|---|
| Power Consumption | -15% | 5% | -13% | |
| Idle Minimum * | 3.3 | 3.1 6% | 3.5 -6% | 4.3 -30% |
| Idle Average * | 6 | 6.3 -5% | 5.3 12% | 7.6 -27% |
| Idle Maximum * | 6.9 | 7.9 -14% | 6 13% | 8.3 -20% |
| Load Average * | 27.7 | 29.5 -6% | 26.3 5% | 26.8 3% |
| Load Maximum * | 36.6 | 57.3 -57% | 36.6 -0% | 32.6 11% |
* ... smaller is better
| HP ProBook 640 G2-T9X60ET 6200U, HD Graphics 520, 46 Wh | Lenovo ThinkPad L460-20FVS01400 6500U, Radeon R5 M330, 48 Wh | Dell Latitude 14 E5470 6300U, HD Graphics 520, 62 Wh | Toshiba Tecra Z40-C-106 6200U, HD Graphics 520, 64 Wh | |
|---|---|---|---|---|
| Battery Runtime | -18% | 15% | -2% | |
| Reader / Idle | 997 | 1153 16% | 1304 31% | 1045 5% |
| WiFi v1.3 | 573 | 425 -26% | 667 16% | 539 -6% |
| Load | 173 | 97 -44% | 172 -1% | 164 -5% |
| H.264 | 431 | 645 |
Pro
Contra
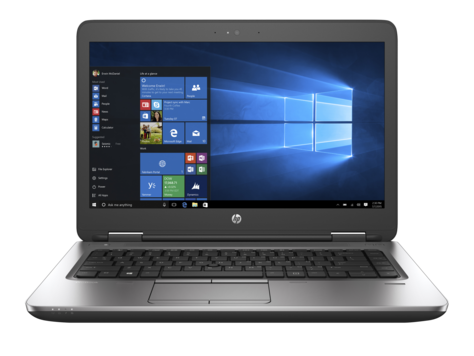
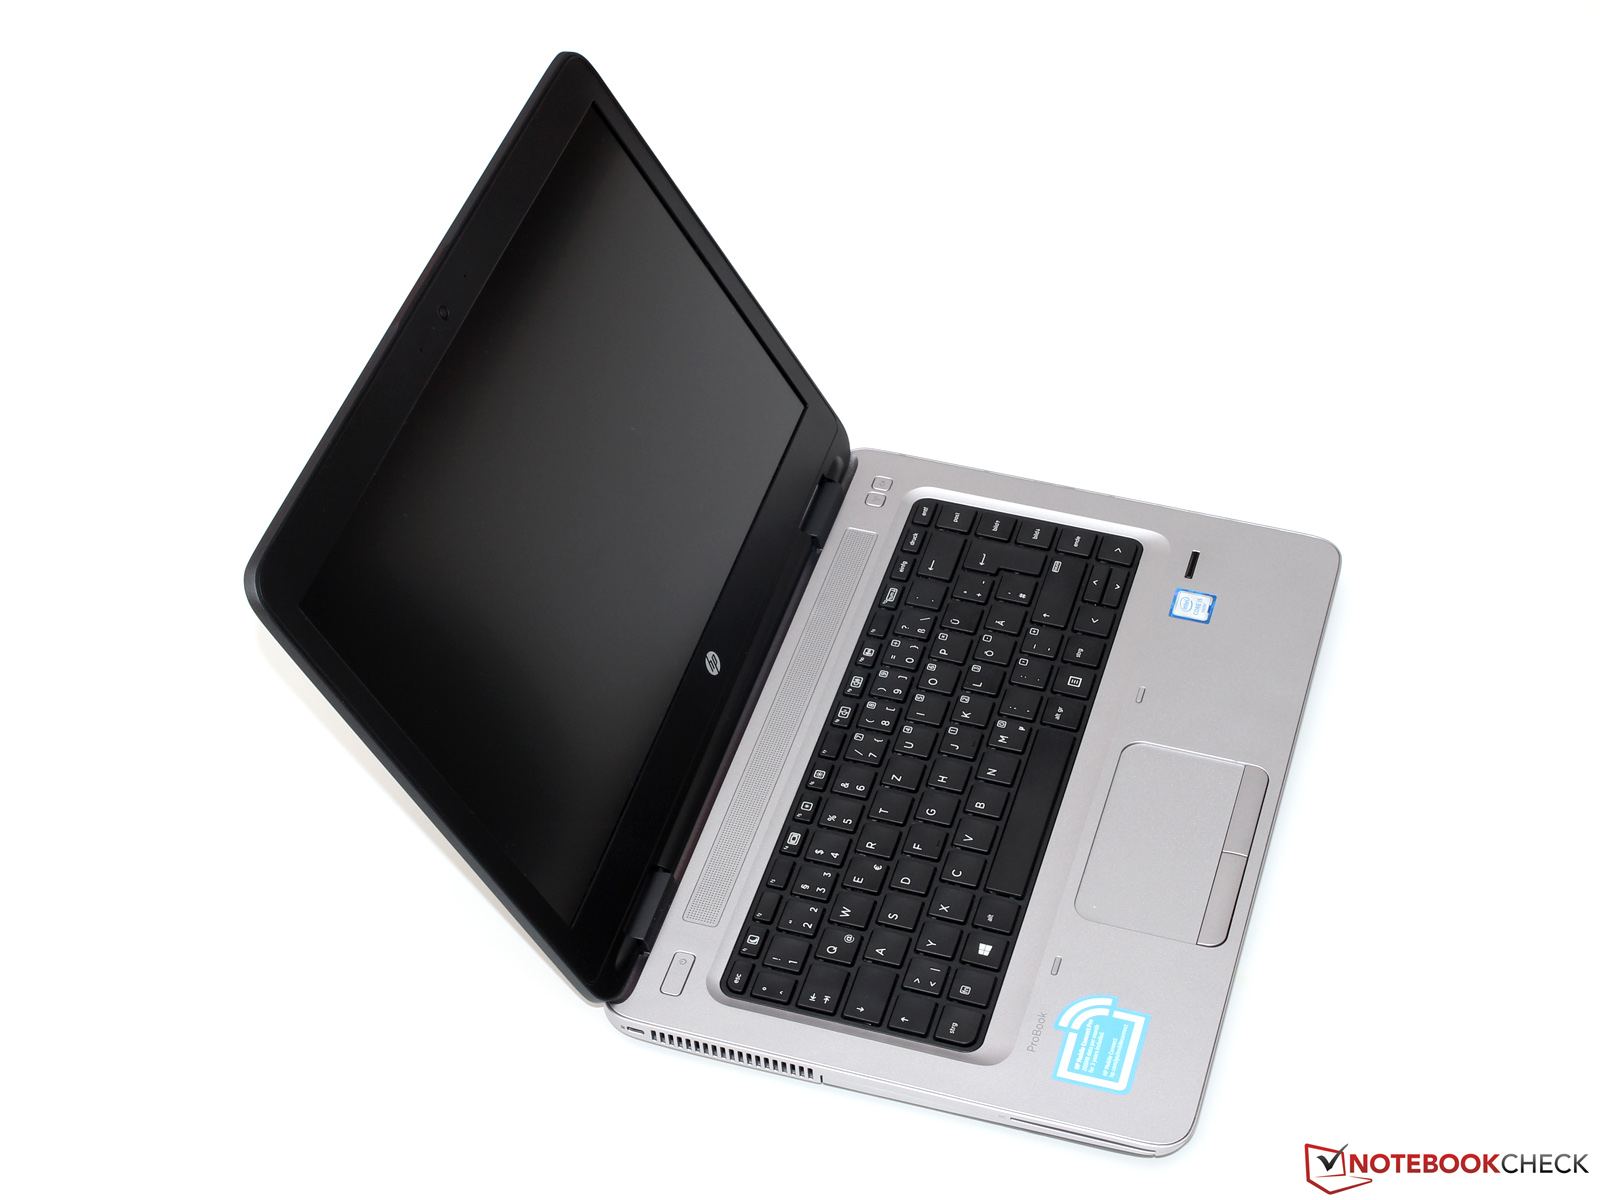
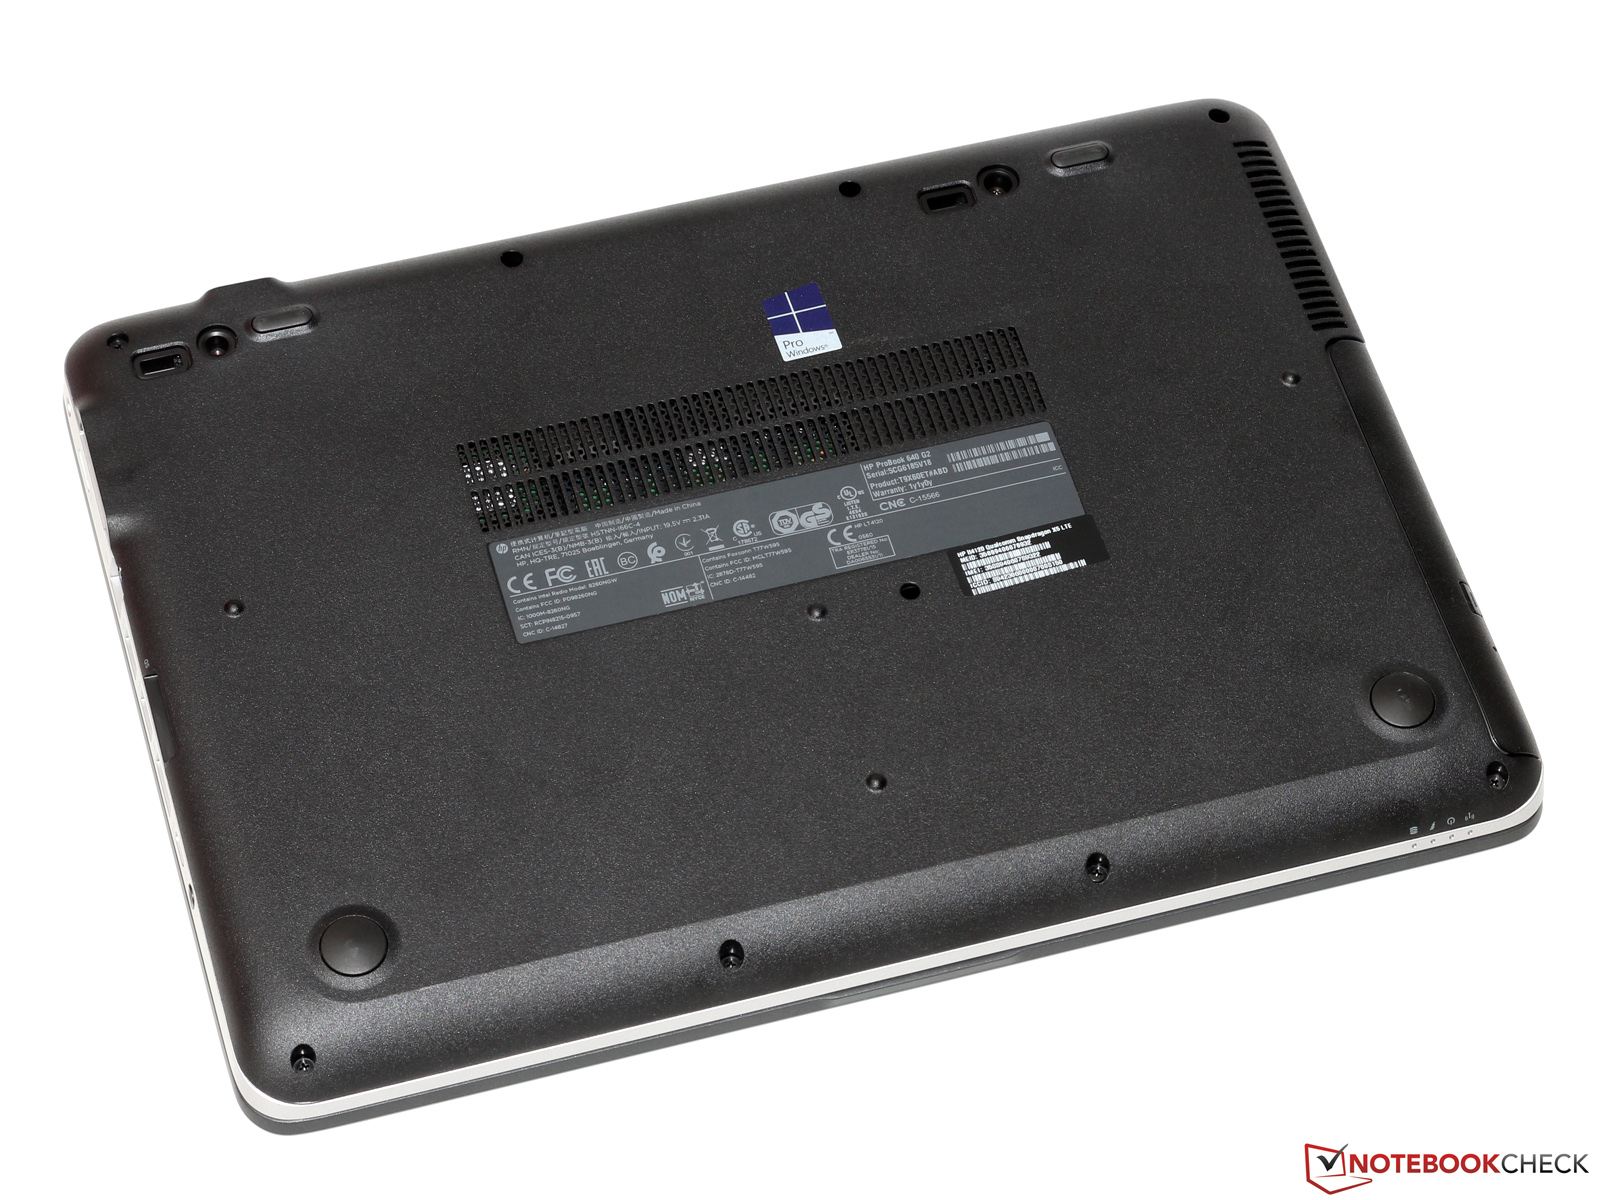
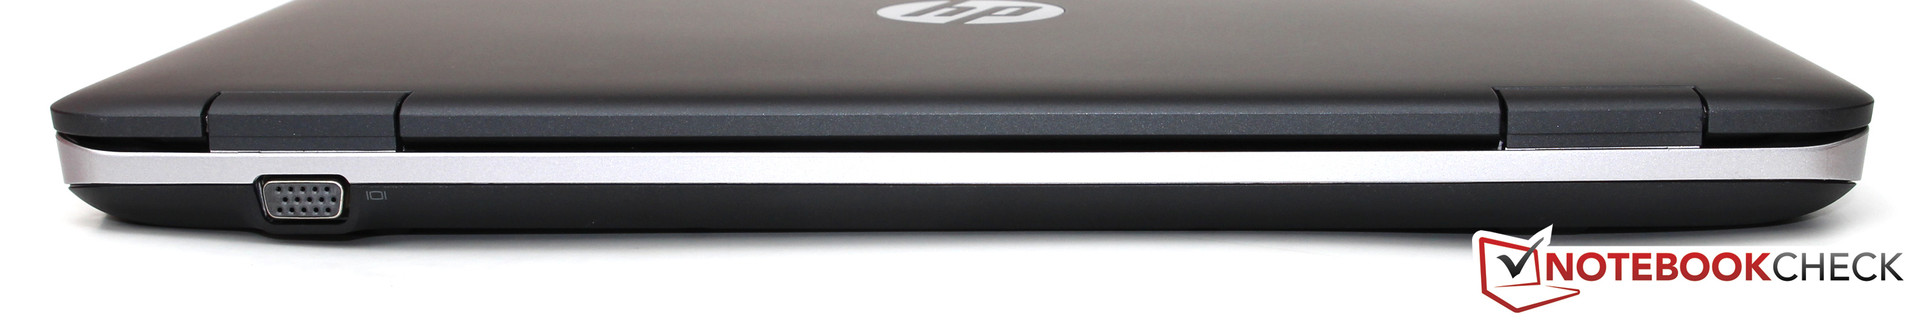
Embora existam alguns portáteis de escritório mais elegantes e finos que o ProBook 640 G2, a HP sem dúvida montou um pacote interessante no que diz respeito as outras qualidades do aparelho de 14-polegadas. Apenas alguns rivais podem oferecer uma unidade ótica e uma saída VGA. Isto, no entanto, cobra o seu preço no peso. Em troca, o ProBook compensa por isso com dispositivos de entrada impecáveis, alto desempenho de aplicativos, e longa duração da bateria. O fabricante também tem que ser aplaudido pelo módulo LTE integrado e baixas emissões.
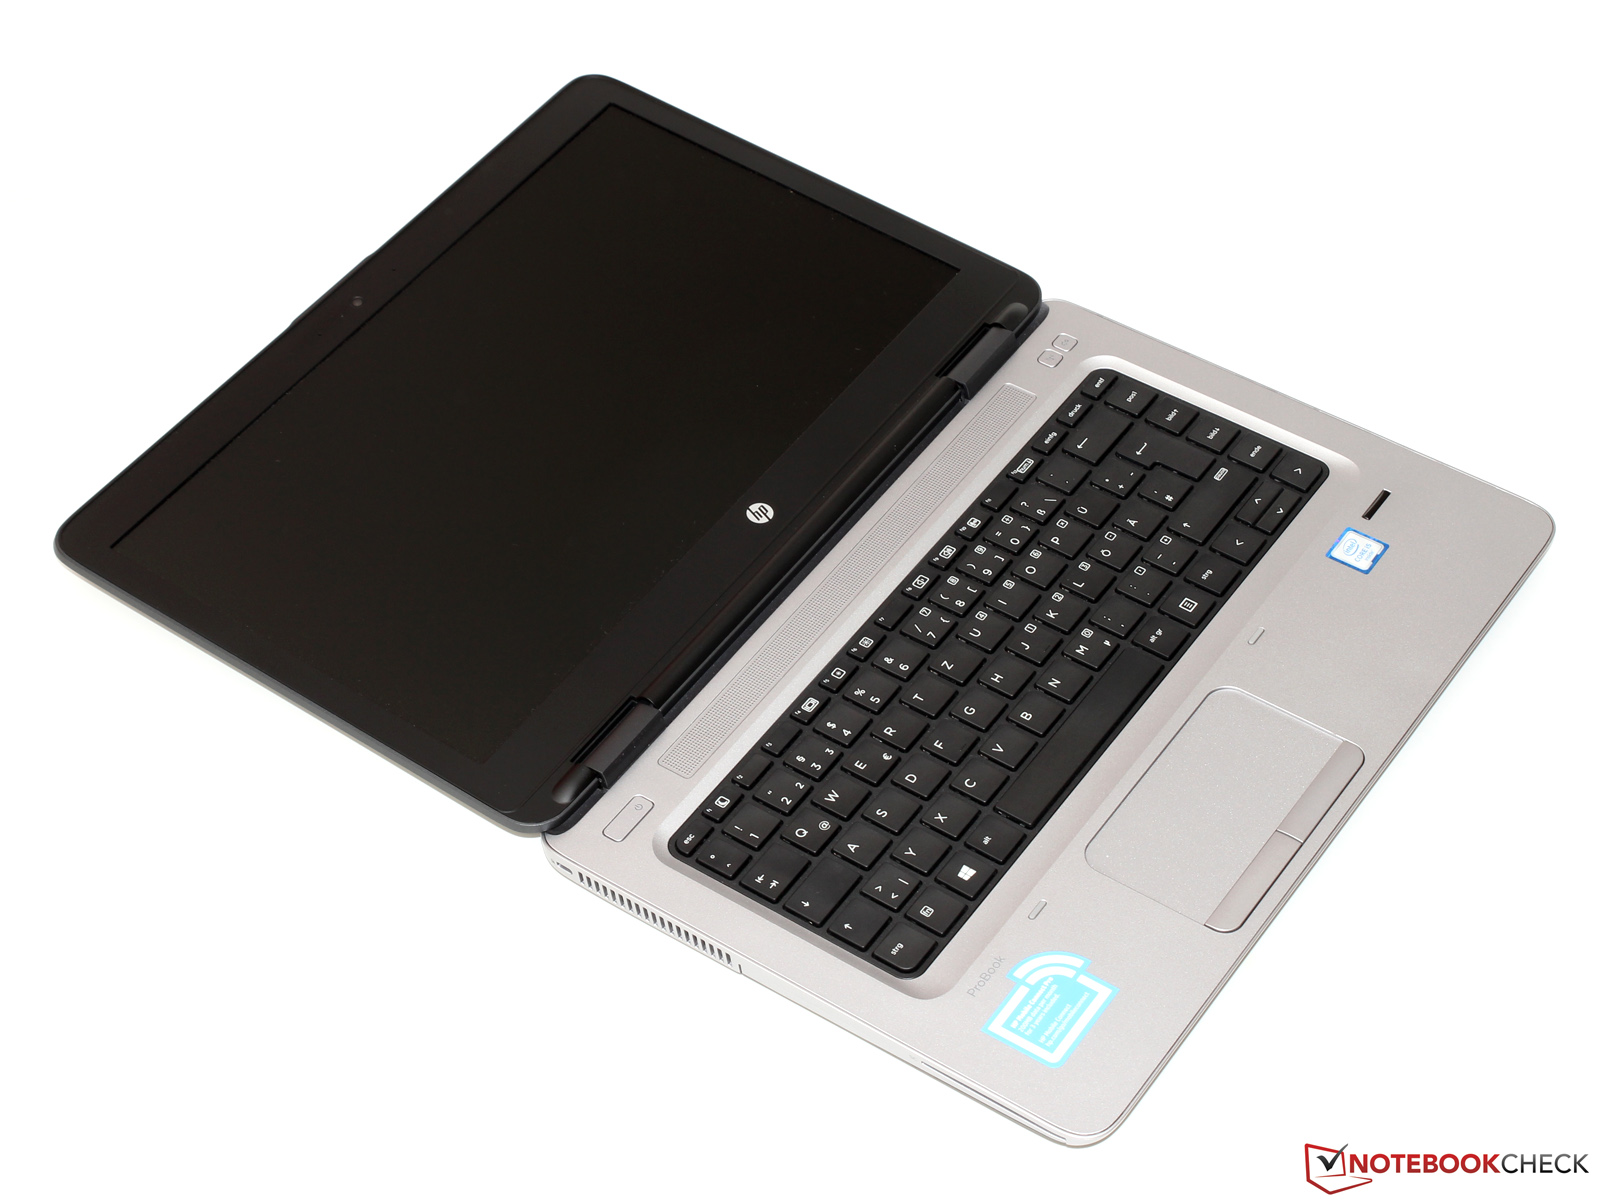
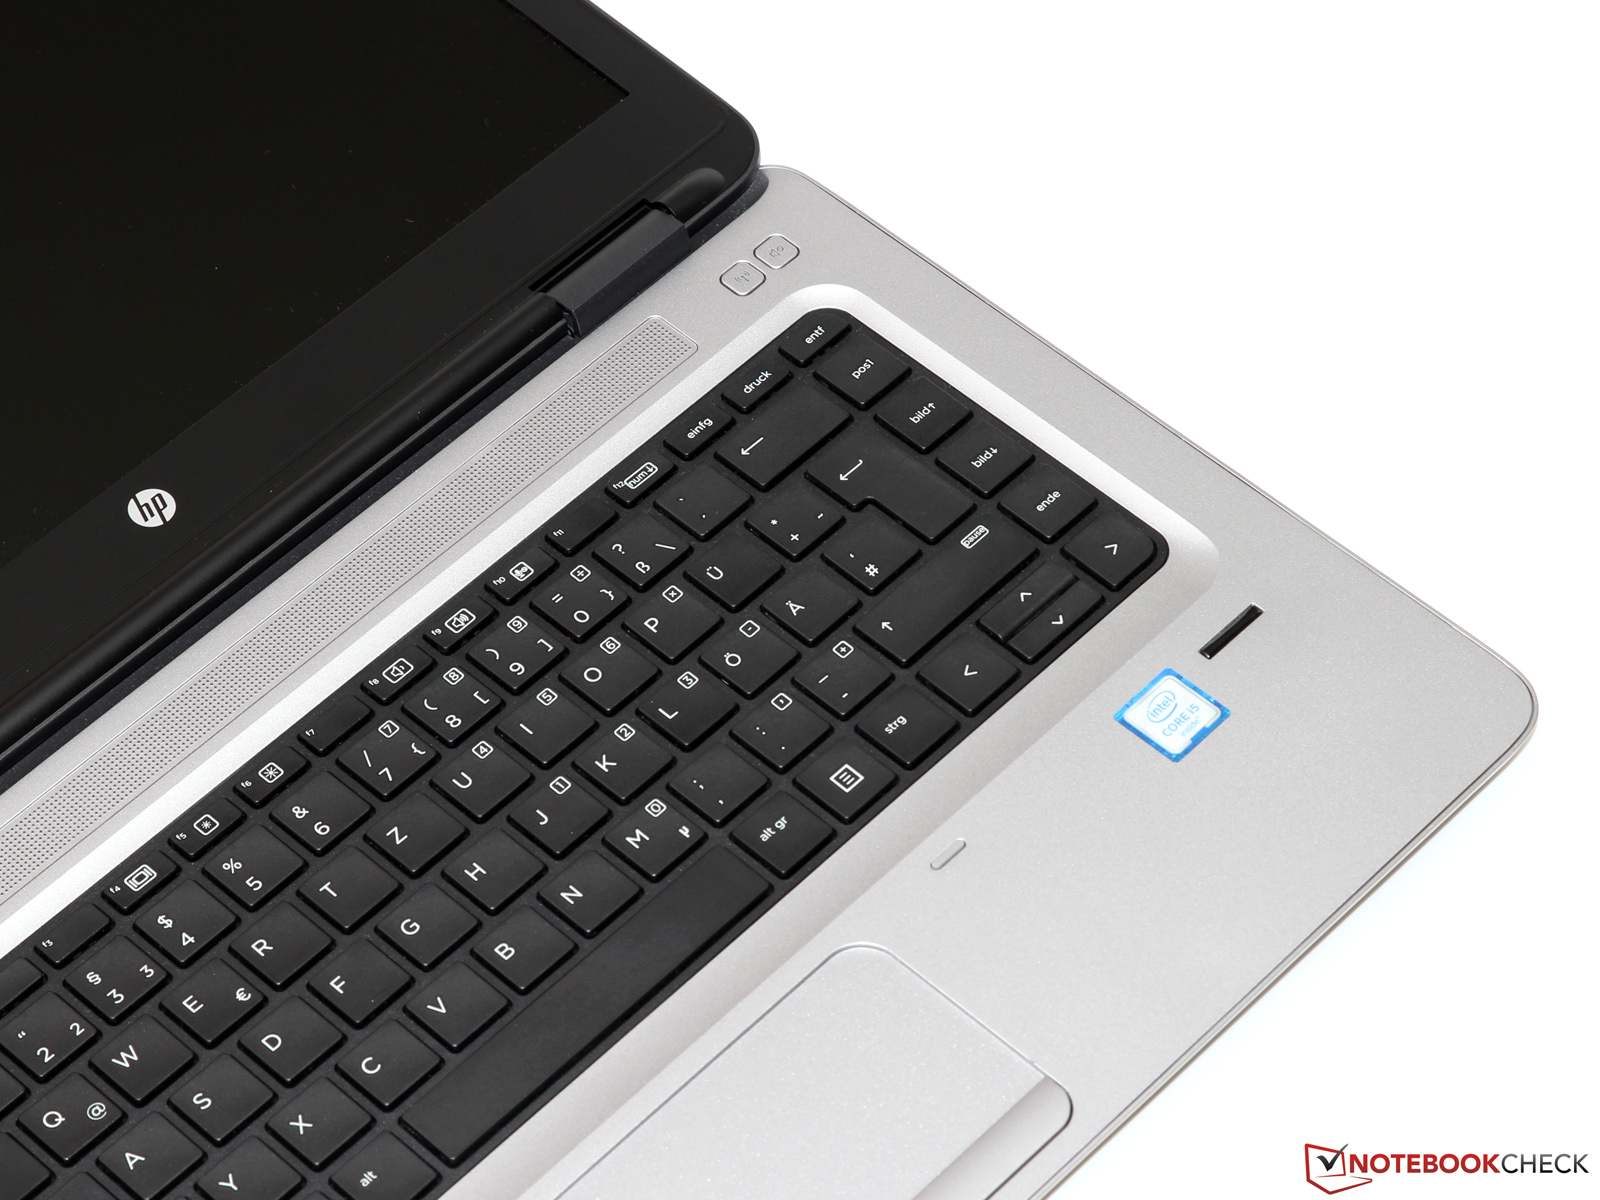
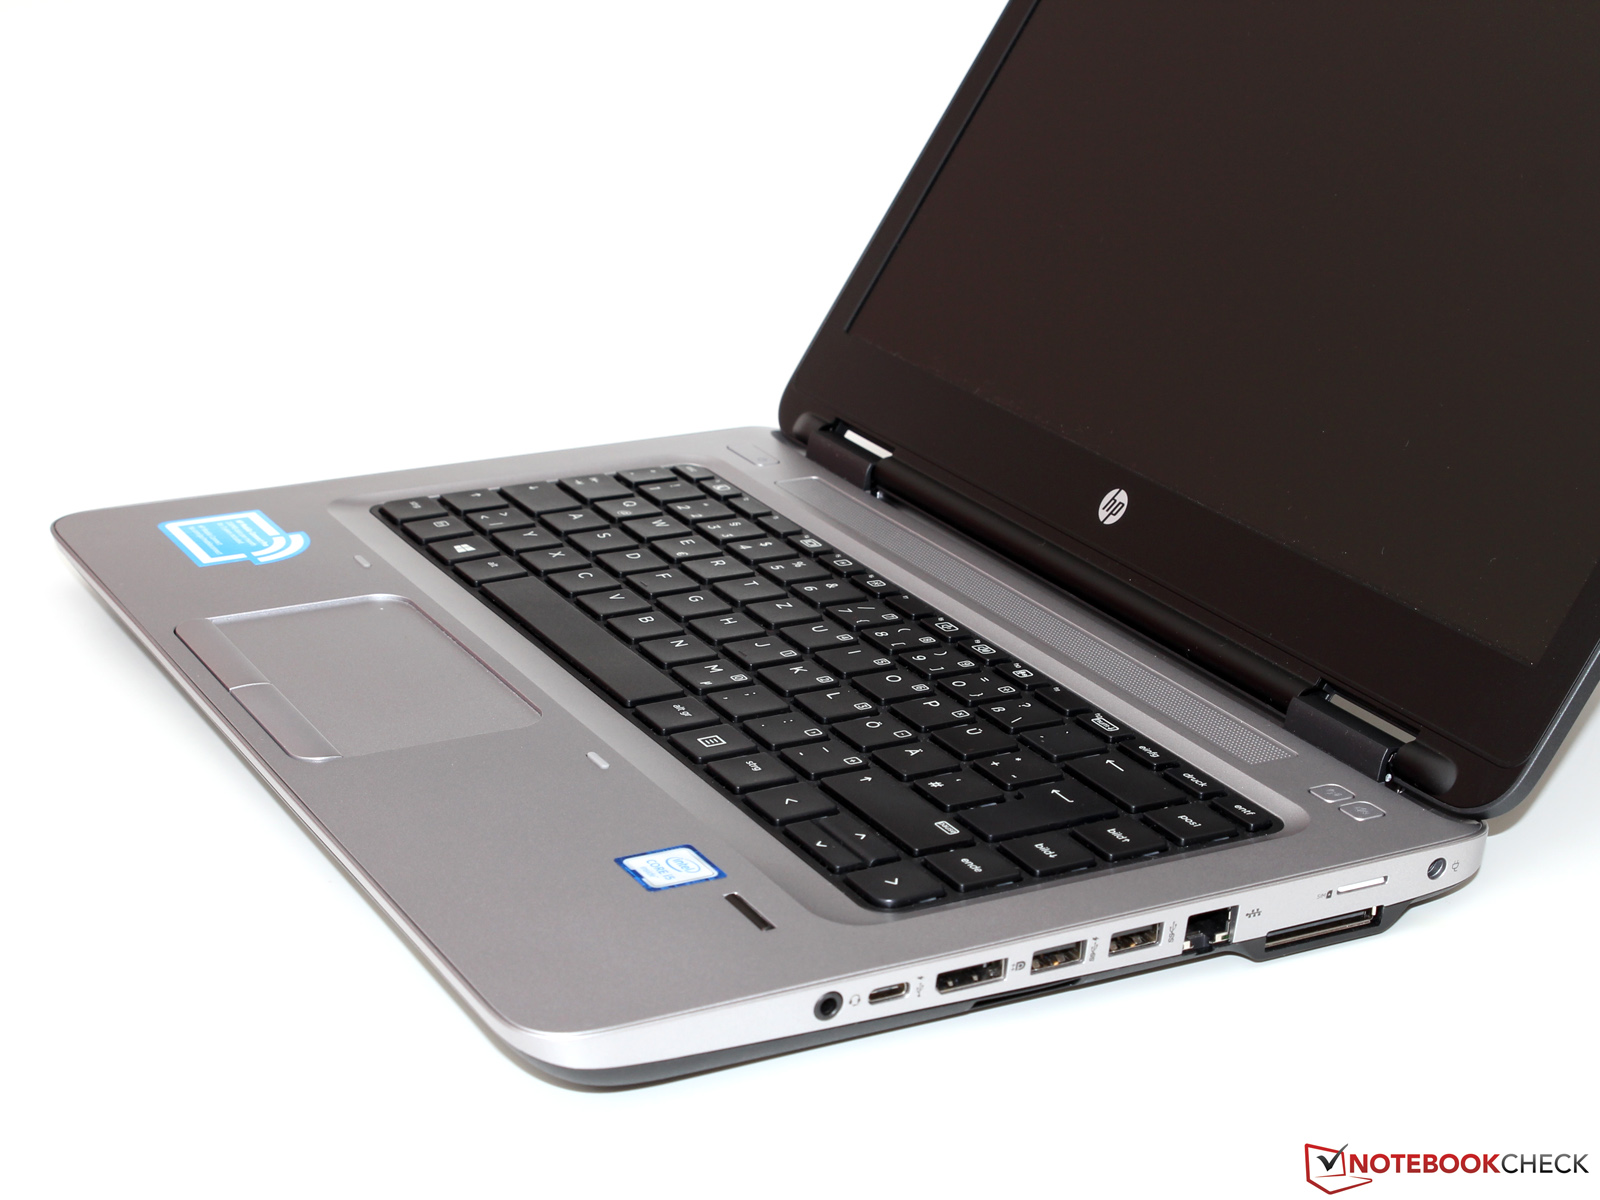
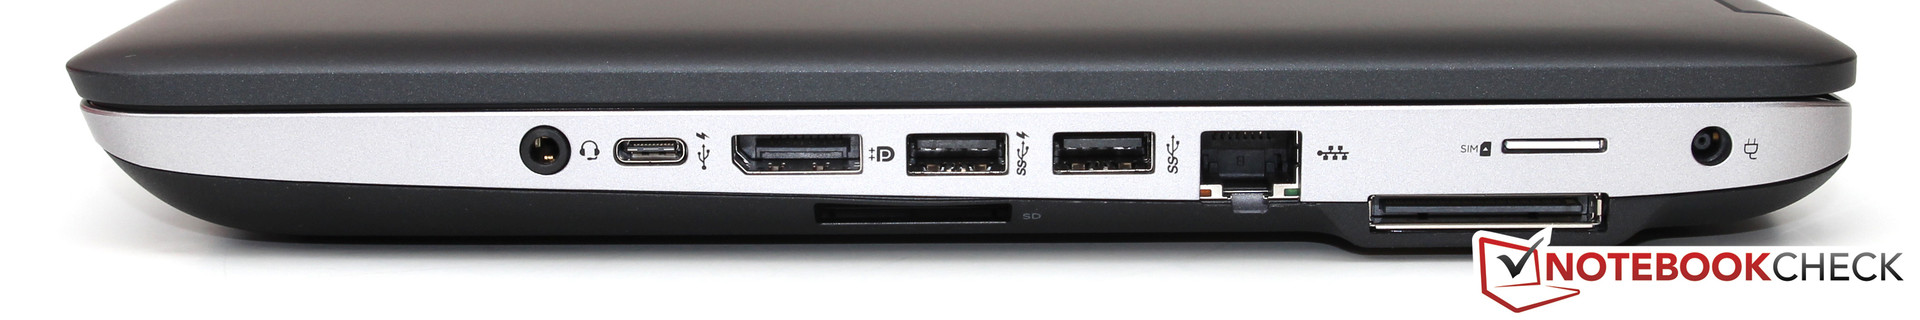
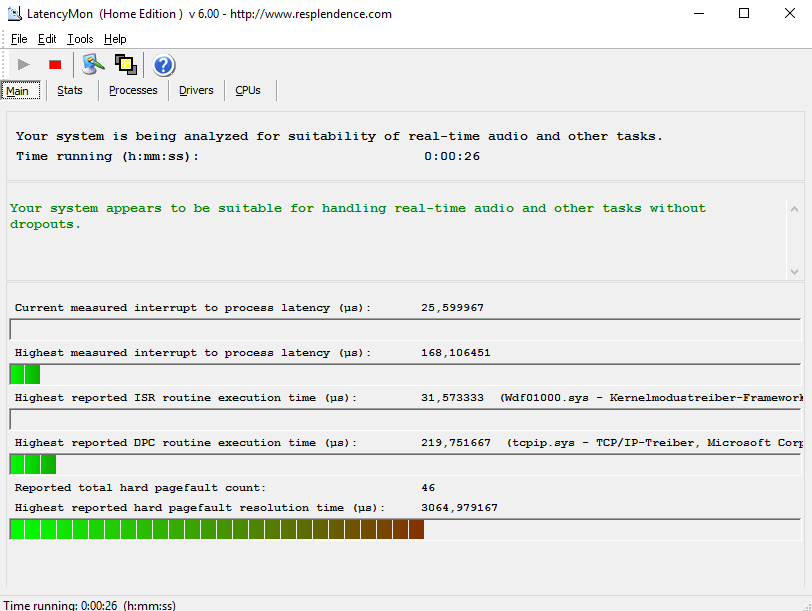
Infelizmente, algumas fraquezas nos detalhes estragam a bora impressão deixada até esse ponto. Primeiramente por causa do layout desfavorável das interfaces, a ventoinha pulsante, e a tela TN extremamente dependentes dos ângulos de visão. Particularmente, este último é decepcionante em vista do preço de quatro dígitos e também porque todos os concorrentes (pelo menos opcionalmente) oferecem painéis IPS de maior qualidade. O brilho máximo especialmente alto somente compensa até certo grau. Os compradores que possam ignorar estas desvantagens podem optar pelo portátil - depois de tudo, os aparelhos da Dell, Lenovo ou Toshiba também têm críticas.
Os compradores que possam ignorar a tela dependente dos ângulos de visão e construção robusta encontrarão um sólido aparelho de trabalho para o escritório no ProBook 640 G2, que comparado com a concorrência, também vem com um singular destaque na forma de unidade ótica.
Esta é uma versão reduzida da análise original. Você pode ler a análise completa em inglês.
HP ProBook 640 G2-T9X60ET
-
08/09/2016 v5.1(old)
Till Schönborn