 Deutsch
 English
 Español
 Français
 Italiano
 Nederlands
 Polski
 Português
 Русский
 Türkçe
 Svenska
 Chinese
 Magyar
Breve Análise do Portátil HP Spectre x360 13t (i7-8550U, FHD, SSD)

| SD Card Reader | |
| average JPG Copy Test (av. of 3 runs) | |
| Lenovo ThinkPad X1 Yoga 2018-20LES01W00 (Toshiba Exceria Pro M501) | |
| Dell XPS 13 9370 FHD i5 (Toshiba Exceria Pro M501 64 GB UHS-II) | |
| HP Spectre x360 13-ae048ng (Toshiba Exceria Pro M501 microSDXC 64GB) | |
| SCHENKER Slim 15 L17 (Toshiba Exceria Pro SDXC 64 GB UHS-II) | |
| Asus ZenBook 13 UX331UN (Toshiba Exceria Pro M501 microSDXC 64GB) | |
| Average Intel Core i7-8550U (16.8 - 191.2, n=53) | |
| Acer Spin 5 SP515-51GN-80A3 (Toshiba Exceria Pro SDXC 64 GB UHS-II) | |
| maximum AS SSD Seq Read Test (1GB) | |
| Lenovo ThinkPad X1 Yoga 2018-20LES01W00 (Toshiba Exceria Pro M501) | |
| HP Spectre x360 13-ae048ng (Toshiba Exceria Pro M501 microSDXC 64GB) | |
| Dell XPS 13 9370 FHD i5 (Toshiba Exceria Pro M501 64 GB UHS-II) | |
| SCHENKER Slim 15 L17 (Toshiba Exceria Pro SDXC 64 GB UHS-II) | |
| Asus ZenBook 13 UX331UN (Toshiba Exceria Pro M501 microSDXC 64GB) | |
| Average Intel Core i7-8550U (22.8 - 224, n=52) | |
| Acer Spin 5 SP515-51GN-80A3 (Toshiba Exceria Pro SDXC 64 GB UHS-II) | |
| |||||||||||||||||||||||||
iluminação: 82 %
iluminação com acumulador: 270 cd/m²
Contraste: 1555:1 (Preto: 0.2 cd/m²)
ΔE Color 3.98 | 0.5-29.43 Ø5
ΔE Greyscale 5.57 | 0.57-98 Ø5.3
99% sRGB (Argyll 1.6.3 3D)
64% AdobeRGB 1998 (Argyll 1.6.3 3D)
70.2% AdobeRGB 1998 (Argyll 2.2.0 3D)
99.5% sRGB (Argyll 2.2.0 3D)
68.1% Display P3 (Argyll 2.2.0 3D)
Gamma: 2.51
| HP Spectre x360 13-ae048ng Chi Mei (CMN1376), , 1920x1080, 13.30 | HP Spectre x360 13-ac033dx LG Philips LGD054D, , 3840x2160, 13.30 | HP Spectre 13-af033ng AU Optronics AUO422D, , 1920x1080, 13.30 | Lenovo Yoga 920-13IKB-80Y7 AU Optronics B139HAN03.0, , 1920x1080, 13.90 | Dell XPS 13 9370 FHD i5 SHP1484, , 1920x1080, 13.30 | Lenovo ThinkPad X1 Yoga 2018-20LES01W00 Lenovo 40AE / B140QAN02.0, , 2560x1440, 14.00 | Asus ZenBook 13 UX331UN AU Optronics B133HAN04.9, , 1920x1080, 13.30 | Acer Spin 5 SP513-52N-54SF LC133LF102, , 1920x1080, 13.30 | |
|---|---|---|---|---|---|---|---|---|
| Display | 0% | -7% | -8% | -1% | 23% | -10% | -1% | |
| Display P3 Coverage | 68.1 | 69.4 2% | 64 -6% | 62.5 -8% | 68.9 1% | 86.5 27% | 63.3 -7% | 69.8 2% |
| sRGB Coverage | 99.5 | 96.8 -3% | 90.7 -9% | 91.7 -8% | 96.6 -3% | 100 1% | 86.7 -13% | 94.6 -5% |
| AdobeRGB 1998 Coverage | 70.2 | 71.1 1% | 65.1 -7% | 64.1 -9% | 69.6 -1% | 99.4 42% | 63.4 -10% | 69.3 -1% |
| Response Times | -18% | 18% | -23% | -79% | -24% | -6% | -44% | |
| Response Time Grey 50% / Grey 80% * | 36 ? | 42 ? -17% | 27 ? 25% | 46 ? -28% | 62.4 ? -73% | 56.8 ? -58% | 44 ? -22% | 49 ? -36% |
| Response Time Black / White * | 27 ? | 32 ? -19% | 24 ? 11% | 31.6 ? -17% | 45.6 ? -69% | 24 ? 11% | 24 ? 11% | 27 ? -0% |
| PWM Frequency | 25000 ? | 1008 ? -96% | 1000 ? -96% | |||||
| Screen | 8% | 5% | -27% | 10% | 27% | -2% | 3% | |
| Brightness middle | 311 | 302.6 -3% | 304 -2% | 297.9 -4% | 428 38% | 562 81% | 329 6% | 295 -5% |
| Brightness | 278 | 282 1% | 287 3% | 278 0% | 405 46% | 522 88% | 306 10% | 276 -1% |
| Brightness Distribution | 82 | 83 1% | 80 -2% | 81 -1% | 87 6% | 86 5% | 86 5% | 88 7% |
| Black Level * | 0.2 | 0.25 -25% | 0.21 -5% | 0.44 -120% | 0.26 -30% | 0.3 -50% | 0.3 -50% | 0.27 -35% |
| Contrast | 1555 | 1210 -22% | 1448 -7% | 677 -56% | 1646 6% | 1873 20% | 1097 -29% | 1093 -30% |
| Colorchecker dE 2000 * | 3.98 | 2.4 40% | 3.66 8% | 5.1 -28% | 3.8 5% | 2.8 30% | 4.07 -2% | 2.97 25% |
| Colorchecker dE 2000 max. * | 8.48 | 4.9 42% | 5.66 33% | 11 -30% | 7.2 15% | 5.8 32% | 7.05 17% | 5.67 33% |
| Greyscale dE 2000 * | 5.57 | 2.8 50% | 3.51 37% | 6.7 -20% | 4.4 21% | 4.5 19% | 2.76 50% | 3.12 44% |
| Gamma | 2.51 88% | 2.2 100% | 2.55 86% | 2.9 76% | 2.21 100% | 2.16 102% | 2.56 86% | 2.45 90% |
| CCT | 7810 83% | 6333 103% | 6955 93% | 6839 95% | 7067 92% | 7205 90% | 6915 94% | 6676 97% |
| Color Space (Percent of AdobeRGB 1998) | 64 | 65.5 2% | 59 -8% | 64.1 0% | 62.8 -2% | 88.9 39% | 56 -12% | 62 -3% |
| Color Space (Percent of sRGB) | 99 | 97.1 -2% | 91 -8% | 91.7 -7% | 96.4 -3% | 100 1% | 86 -13% | 94 -5% |
| Total Average (Program / Settings) | -3% /
3% | 5% /
4% | -19% /
-22% | -23% /
-9% | 9% /
19% | -6% /
-4% | -14% /
-7% |
* ... smaller is better
Display Response Times
| ↔ Response Time Black to White | ||
|---|---|---|
| 27 ms ... rise ↗ and fall ↘ combined | ↗ 13 ms rise | 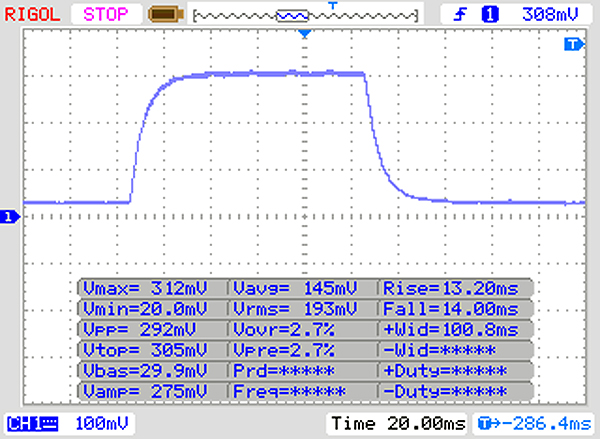 |
| ↘ 14 ms fall | ||
| The screen shows relatively slow response rates in our tests and may be too slow for gamers. In comparison, all tested devices range from 0.1 (minimum) to 240 (maximum) ms. » 63 % of all devices are better. This means that the measured response time is worse than the average of all tested devices (21.5 ms). | ||
| ↔ Response Time 50% Grey to 80% Grey | ||
| 36 ms ... rise ↗ and fall ↘ combined | ↗ 18 ms rise | 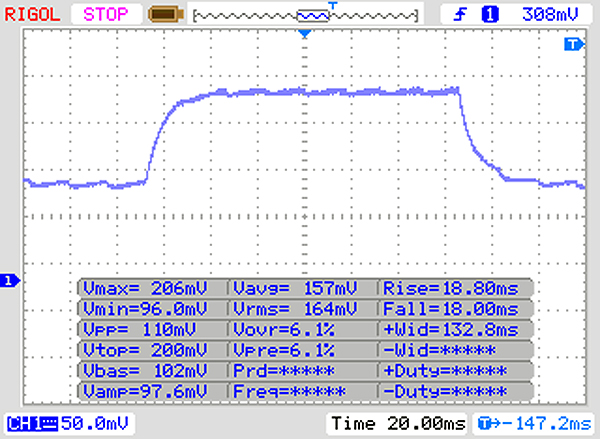 |
| ↘ 18 ms fall | ||
| The screen shows slow response rates in our tests and will be unsatisfactory for gamers. In comparison, all tested devices range from 0.2 (minimum) to 636 (maximum) ms. » 44 % of all devices are better. This means that the measured response time is similar to the average of all tested devices (33.7 ms). | ||
Screen Flickering / PWM (Pulse-Width Modulation)
| Screen flickering / PWM detected | 25000 Hz | ≤ 40 % brightness setting | 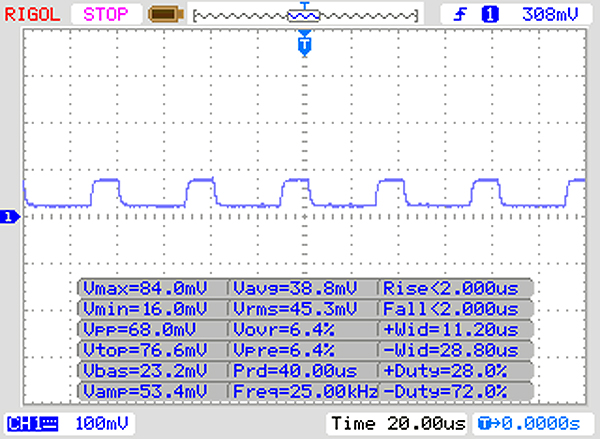 |
The display backlight flickers at 25000 Hz (worst case, e.g., utilizing PWM) Flickering detected at a brightness setting of 40 % and below. There should be no flickering or PWM above this brightness setting. The frequency of 25000 Hz is quite high, so most users sensitive to PWM should not notice any flickering. In comparison: 53 % of all tested devices do not use PWM to dim the display. If PWM was detected, an average of 17924 (minimum: 5 - maximum: 3846000) Hz was measured. | |||
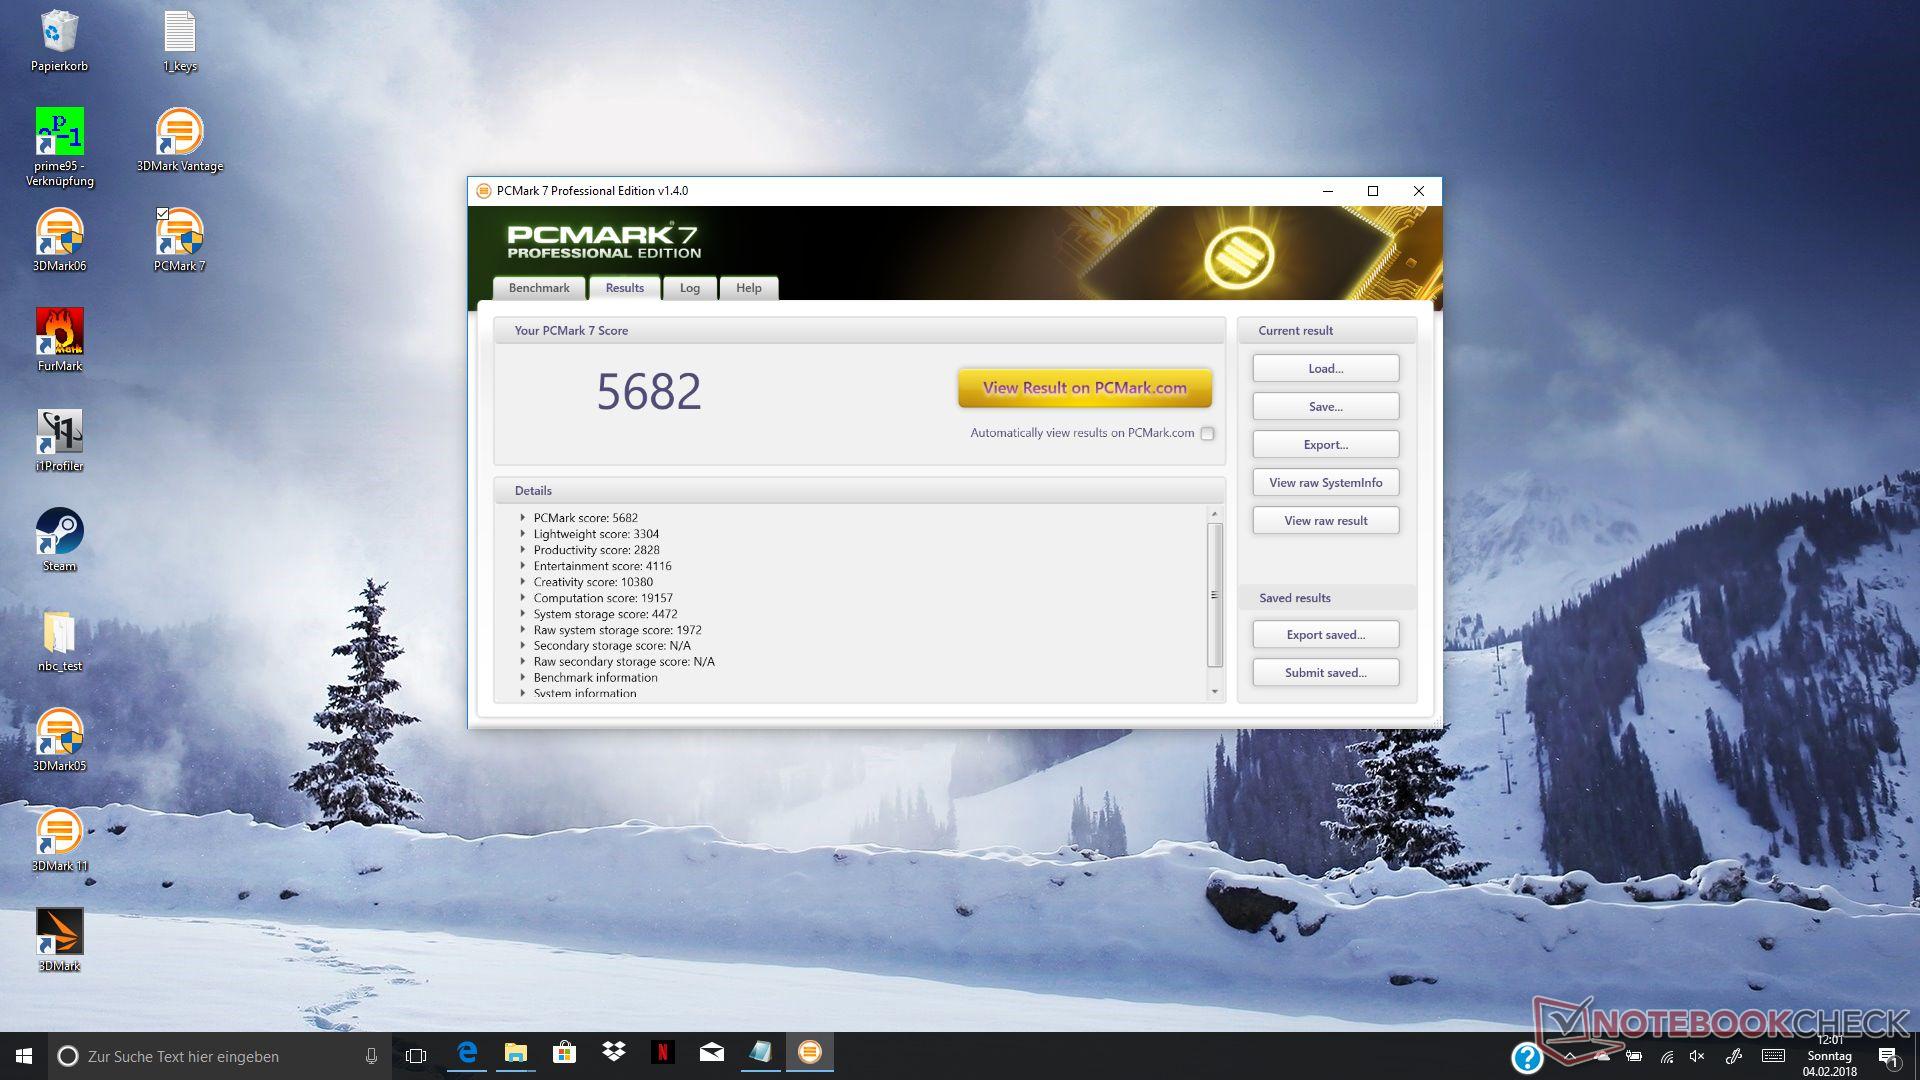
| PCMark 7 Score | 5682 pontos | |
| PCMark 8 Home Score Accelerated v2 | 3605 pontos | |
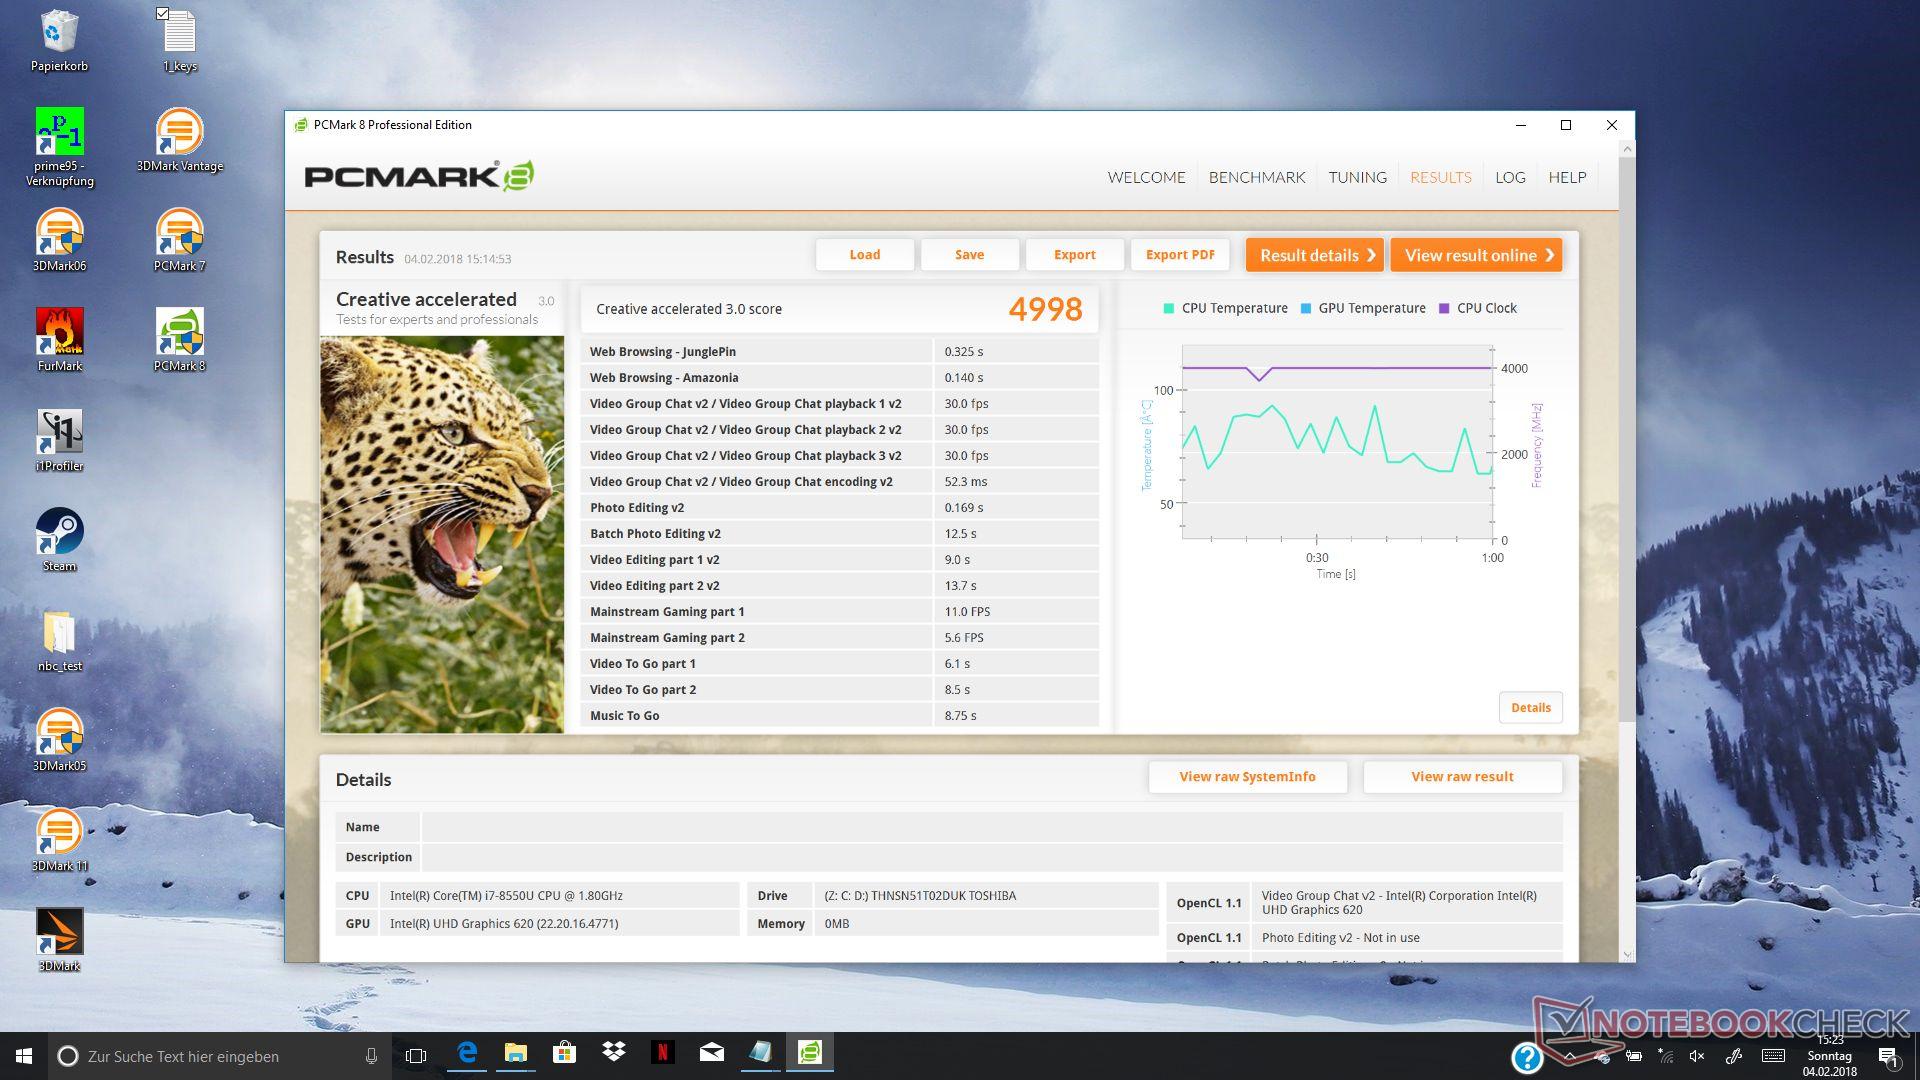
| PCMark 8 Creative Score Accelerated v2 | 4998 pontos | |
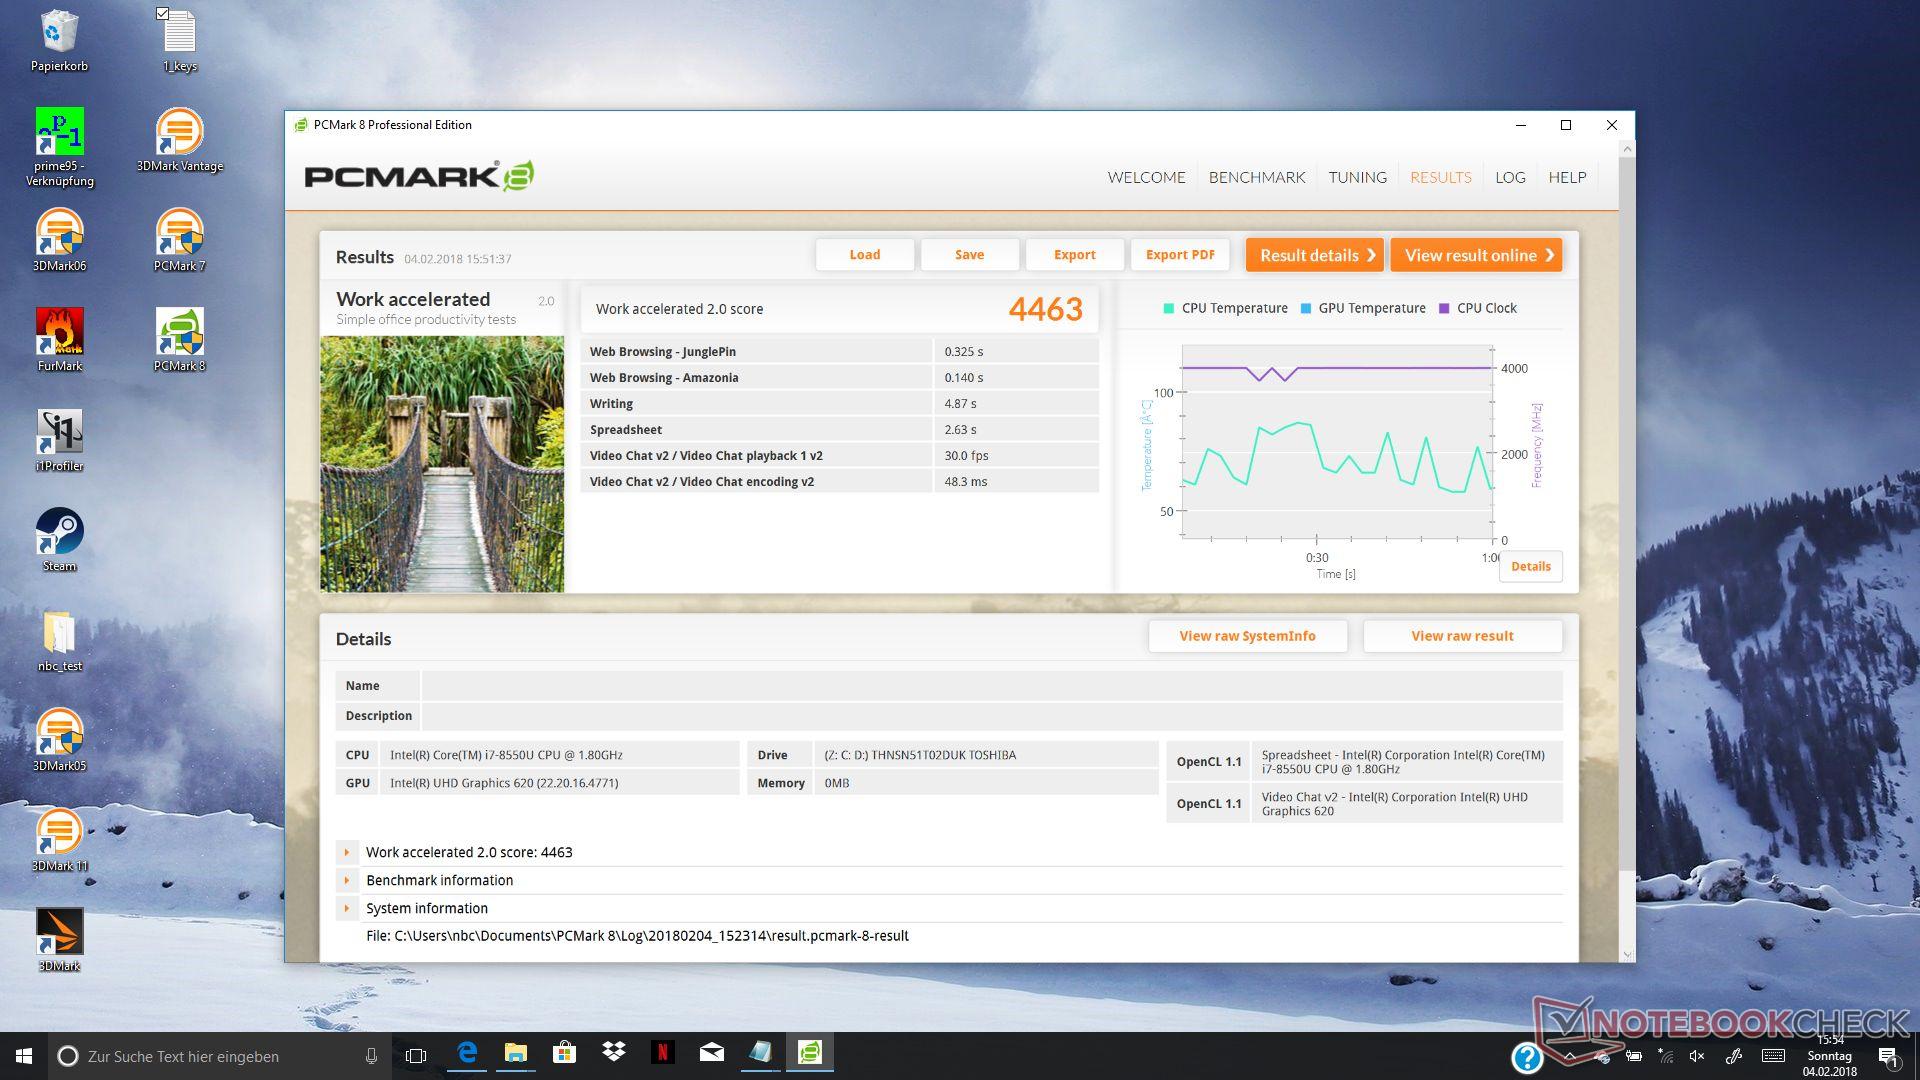
| PCMark 8 Work Score Accelerated v2 | 4463 pontos | |
Ajuda | ||
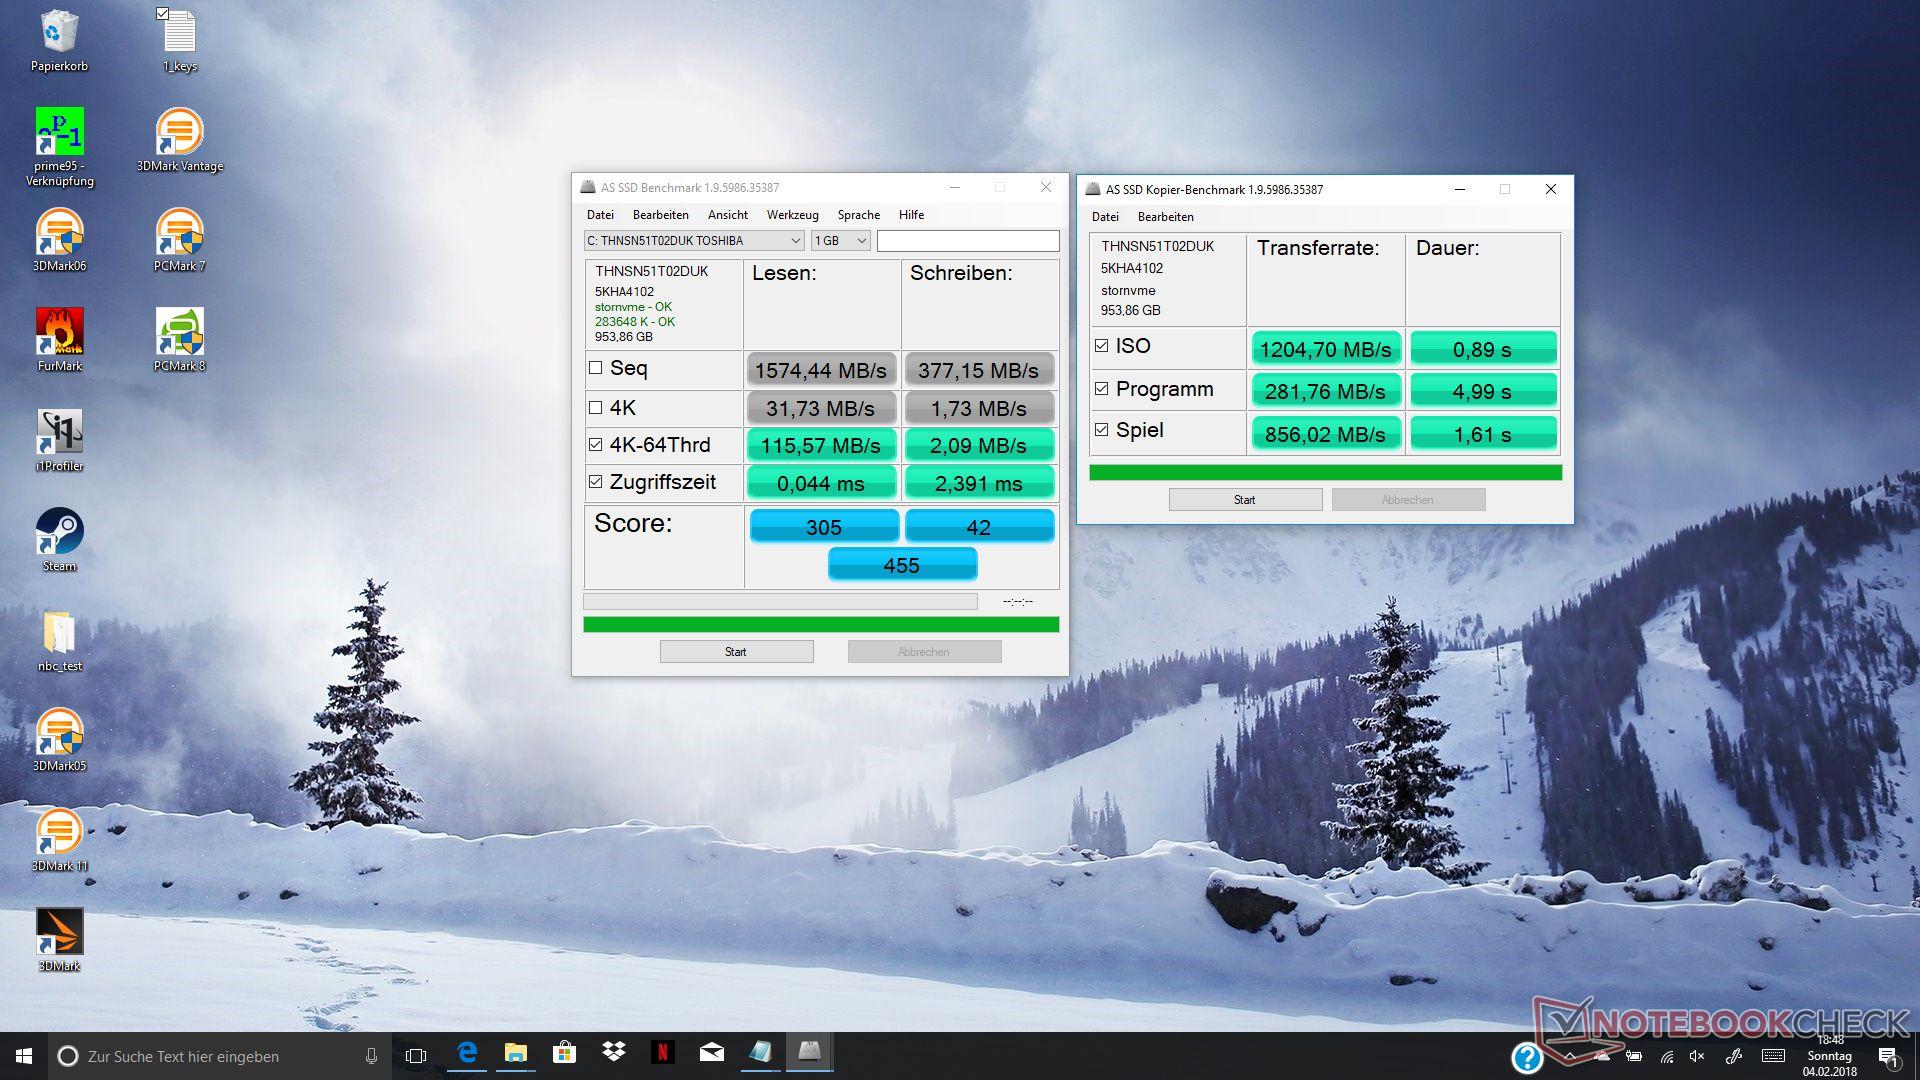
| HP Spectre x360 13-ae048ng Toshiba NVMe THNSN51T02DUK | HP Spectre x360 13-ac033dx Samsung PM961 NVMe MZVLW512HMJP | HP Spectre 13-af033ng Samsung PM961 NVMe MZVLW512HMJP | Lenovo Yoga 920-13IKB-80Y7 Samsung PM961 MZVLW256HEHP | Dell XPS 13 9370 FHD i5 Toshiba XG5 KXG50ZNV256G | Asus ZenBook 13 UX331UN SK Hynix HFS256G39TND-N210A | Acer Spin 5 SP513-52N-54SF Micron 1100 MTFDDAV256TBN | |
|---|---|---|---|---|---|---|---|
| CrystalDiskMark 3.0 | 43% | 4% | 44% | -5% | -48% | -42% | |
| Read Seq | 919 | 2065 125% | 907 -1% | 2070 125% | 1875 104% | 435.6 -53% | 462.7 -50% |
| Write Seq | 776 | 1550 100% | 878 13% | 1125 45% | 352.7 -55% | 263 -66% | 439.9 -43% |
| Read 512 | 620 | 865 40% | 515 -17% | 1252 102% | 840 35% | 258.1 -58% | 325.2 -48% |
| Write 512 | 575 | 1229 114% | 546 -5% | 832 45% | 353.9 -38% | 256.6 -55% | 361.9 -37% |
| Read 4k | 45.99 | 54.7 19% | 60 30% | 56.2 22% | 34.18 -26% | 30.37 -34% | 27.52 -40% |
| Write 4k | 138.1 | 139.4 1% | 144 4% | 142.4 3% | 127.5 -8% | 78.6 -43% | 91.6 -34% |
| Read 4k QD32 | 542 | 518 -4% | 543 0% | 432.9 -20% | 381.8 -30% | 356.8 -34% | 247.3 -54% |
| Write 4k QD32 | 437.3 | 225.6 -48% | 476 9% | 573 31% | 339.9 -22% | 257.2 -41% | 292 -33% |

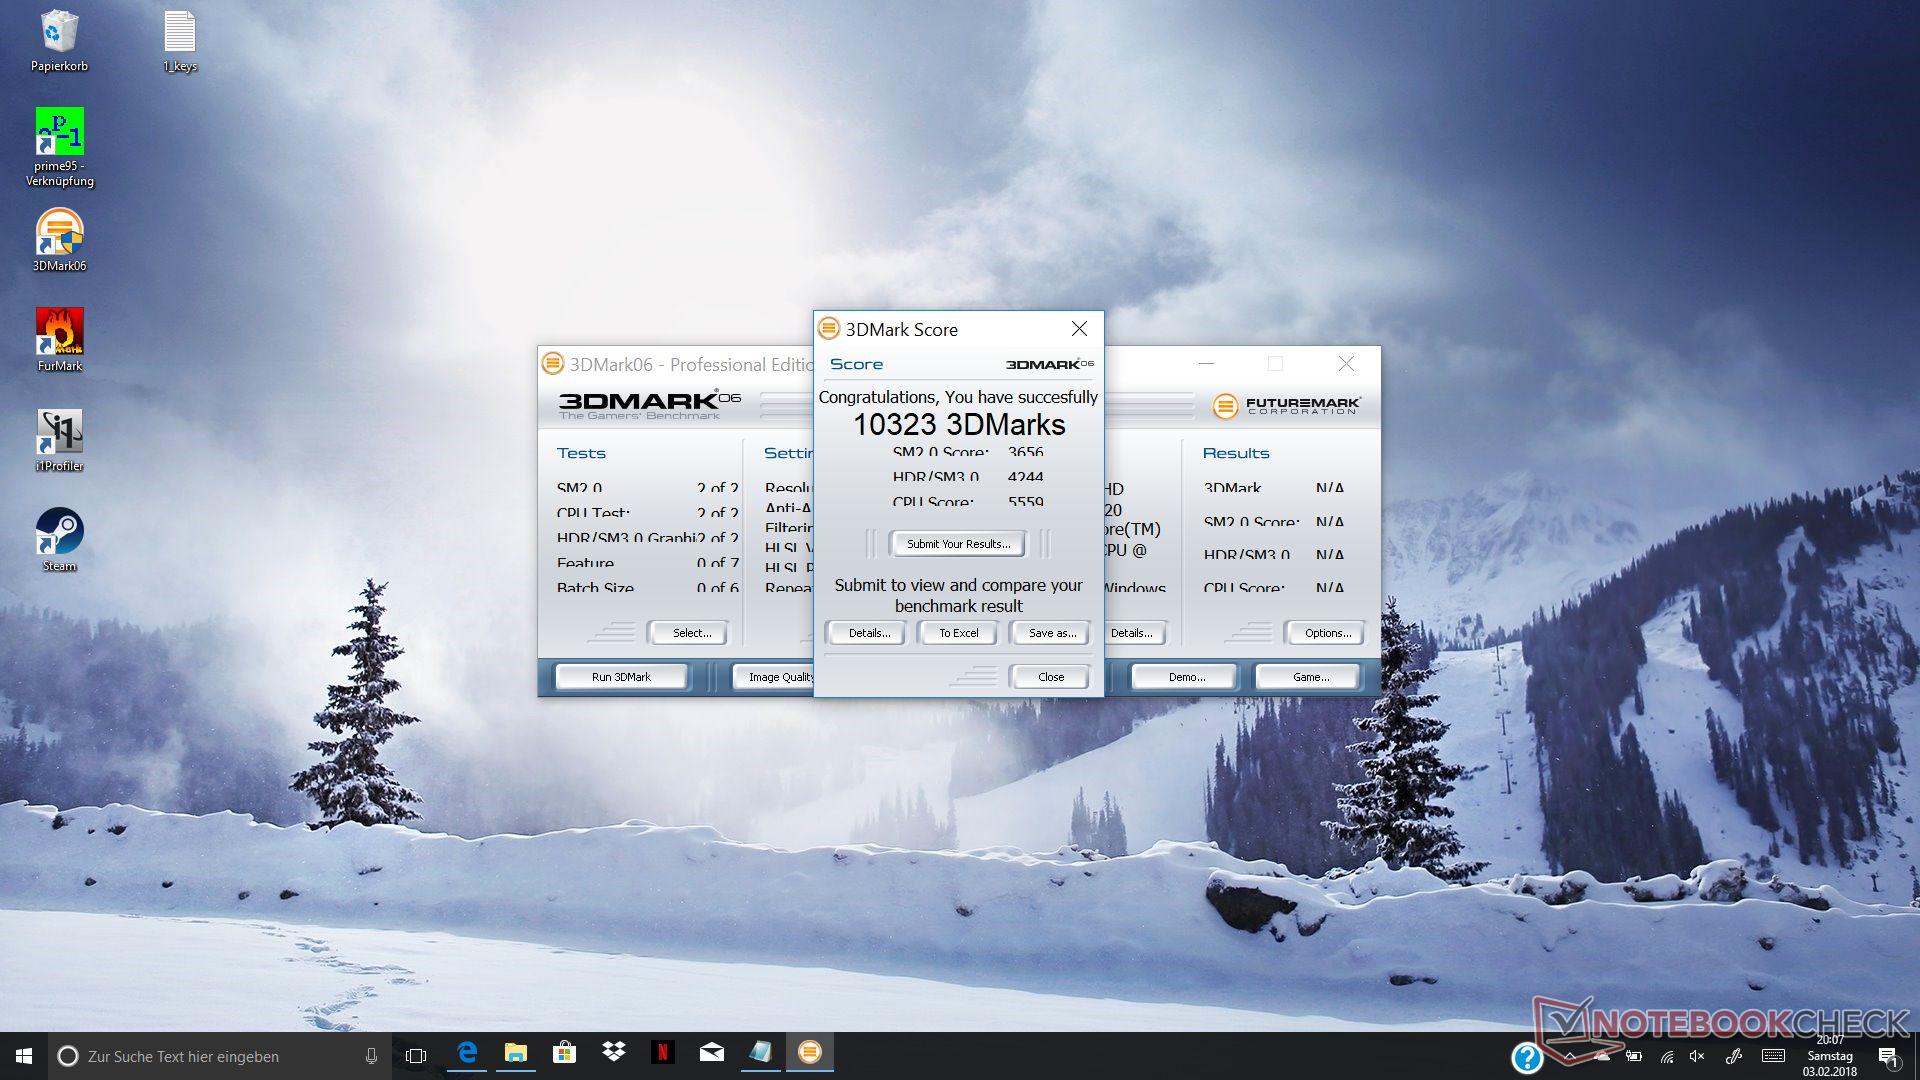
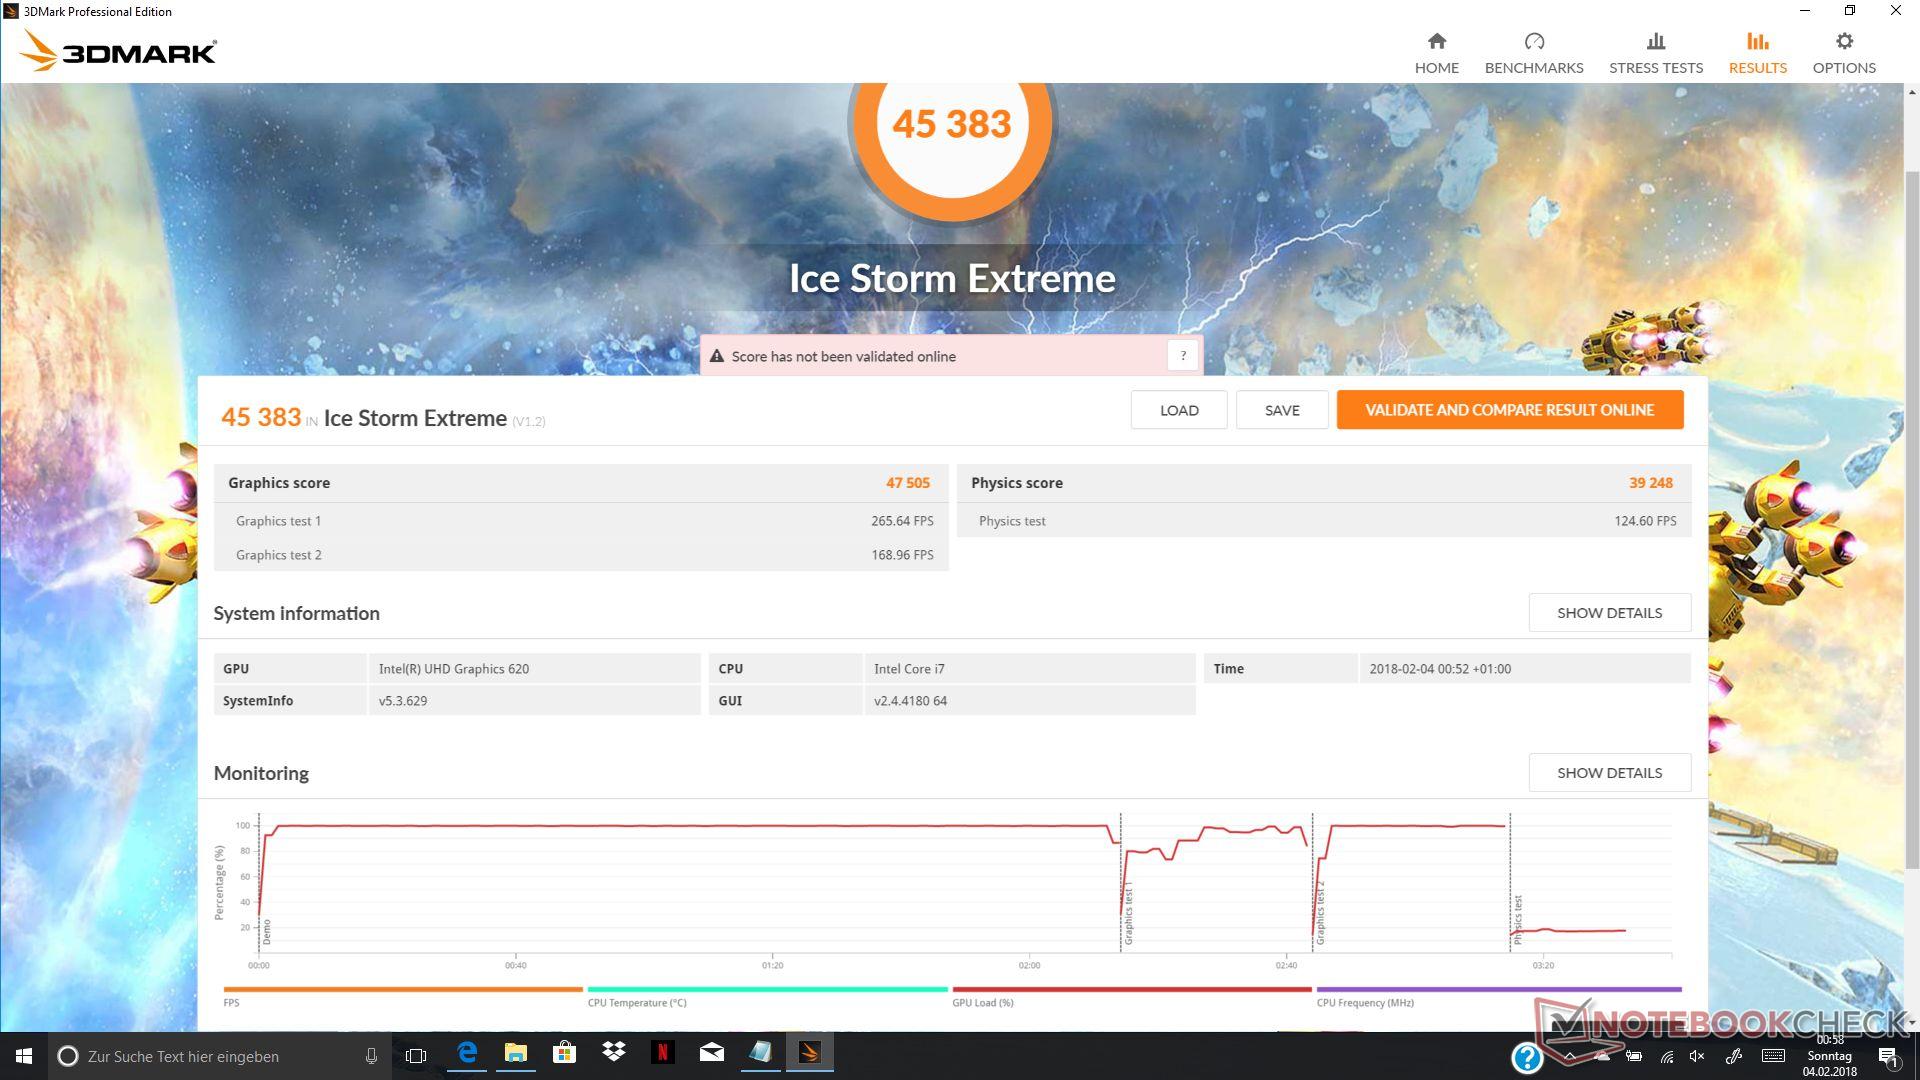

| 3DMark 06 Standard Score | 10323 pontos | |
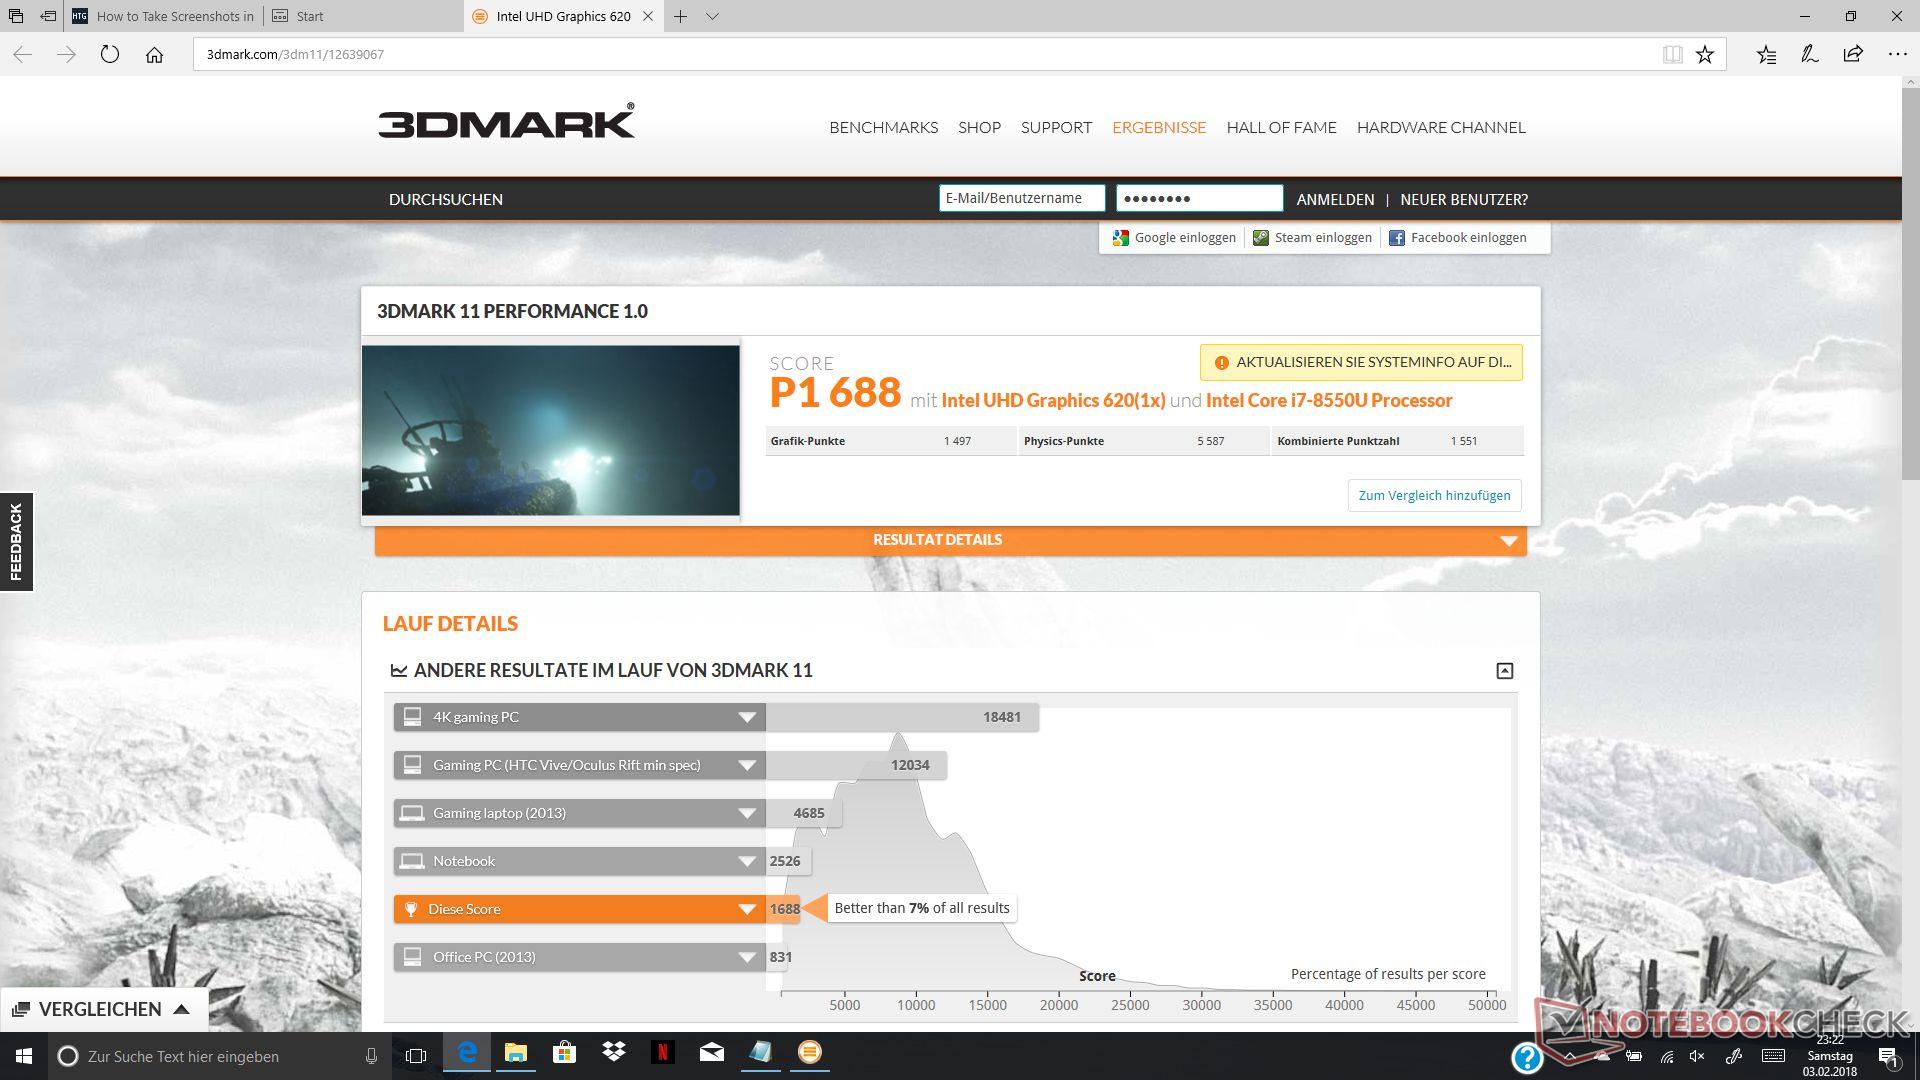
| 3DMark 11 Performance | 1688 pontos | |
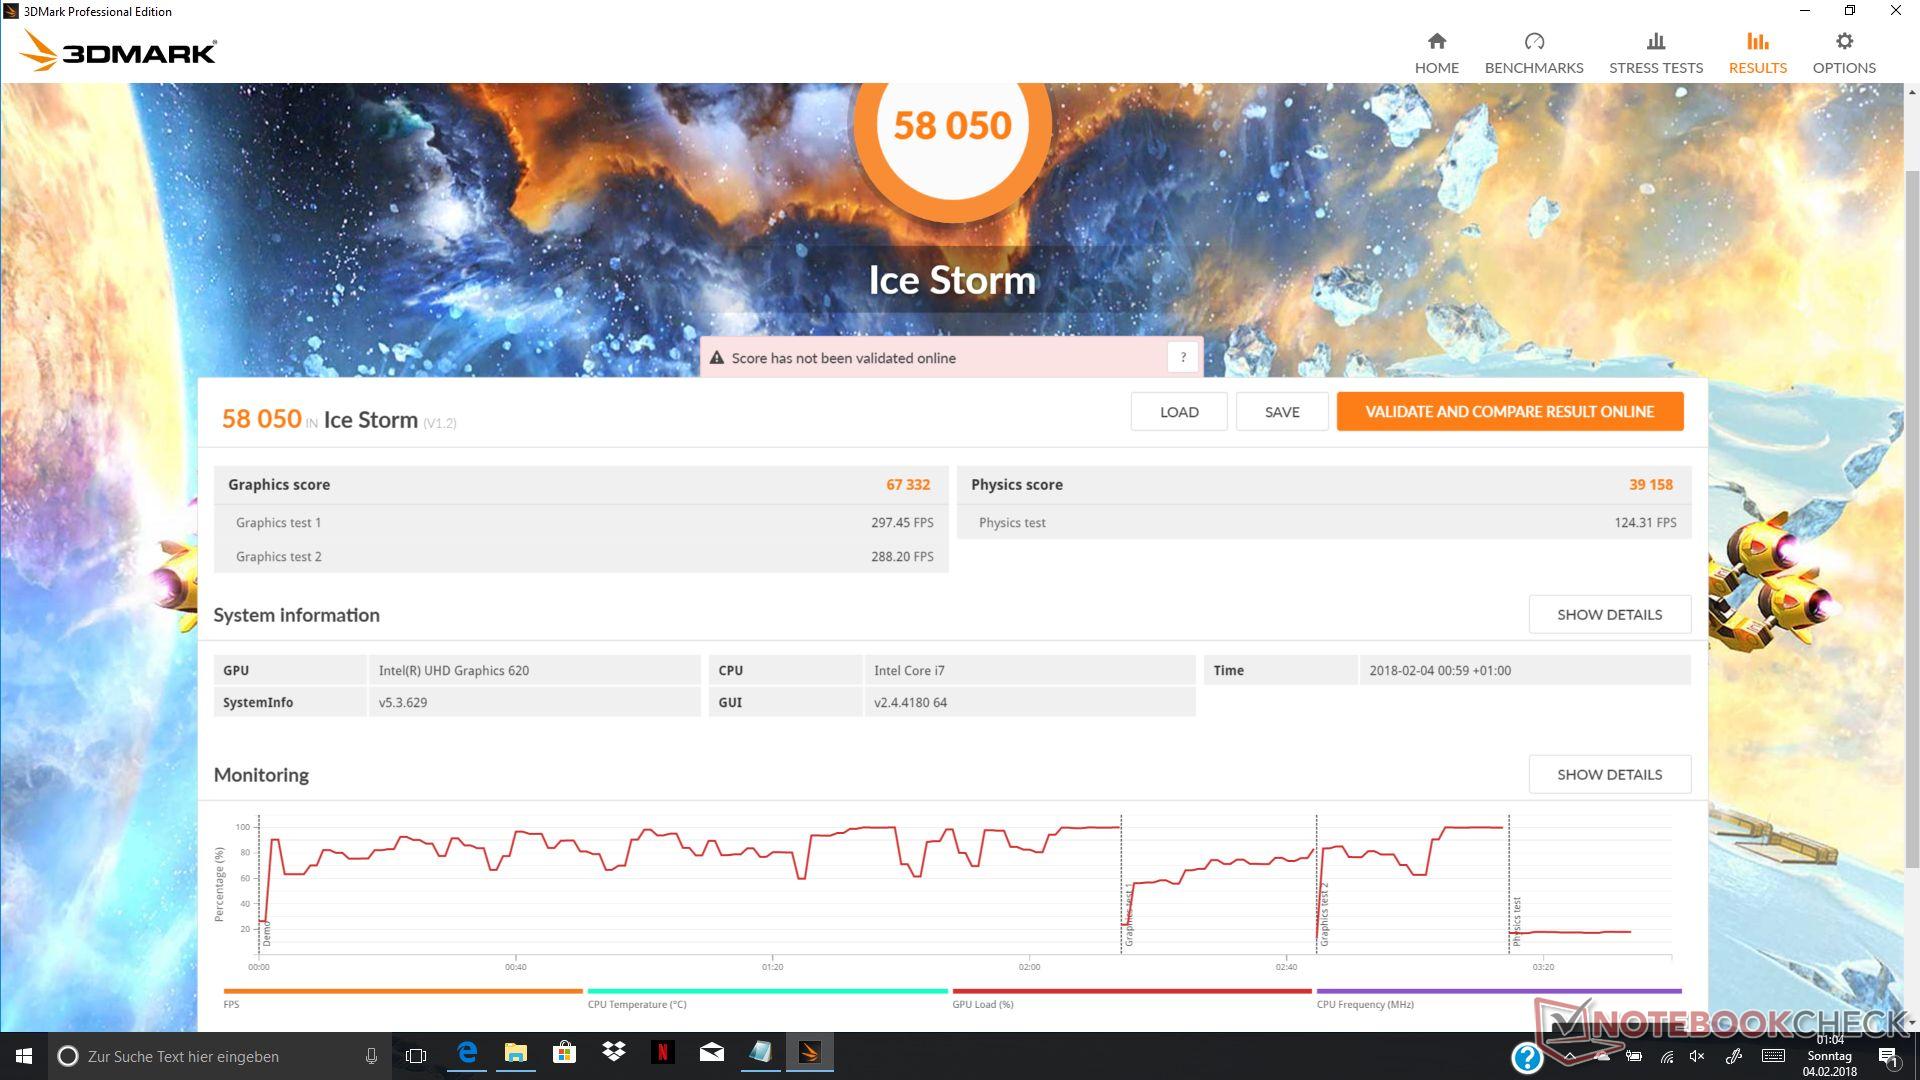
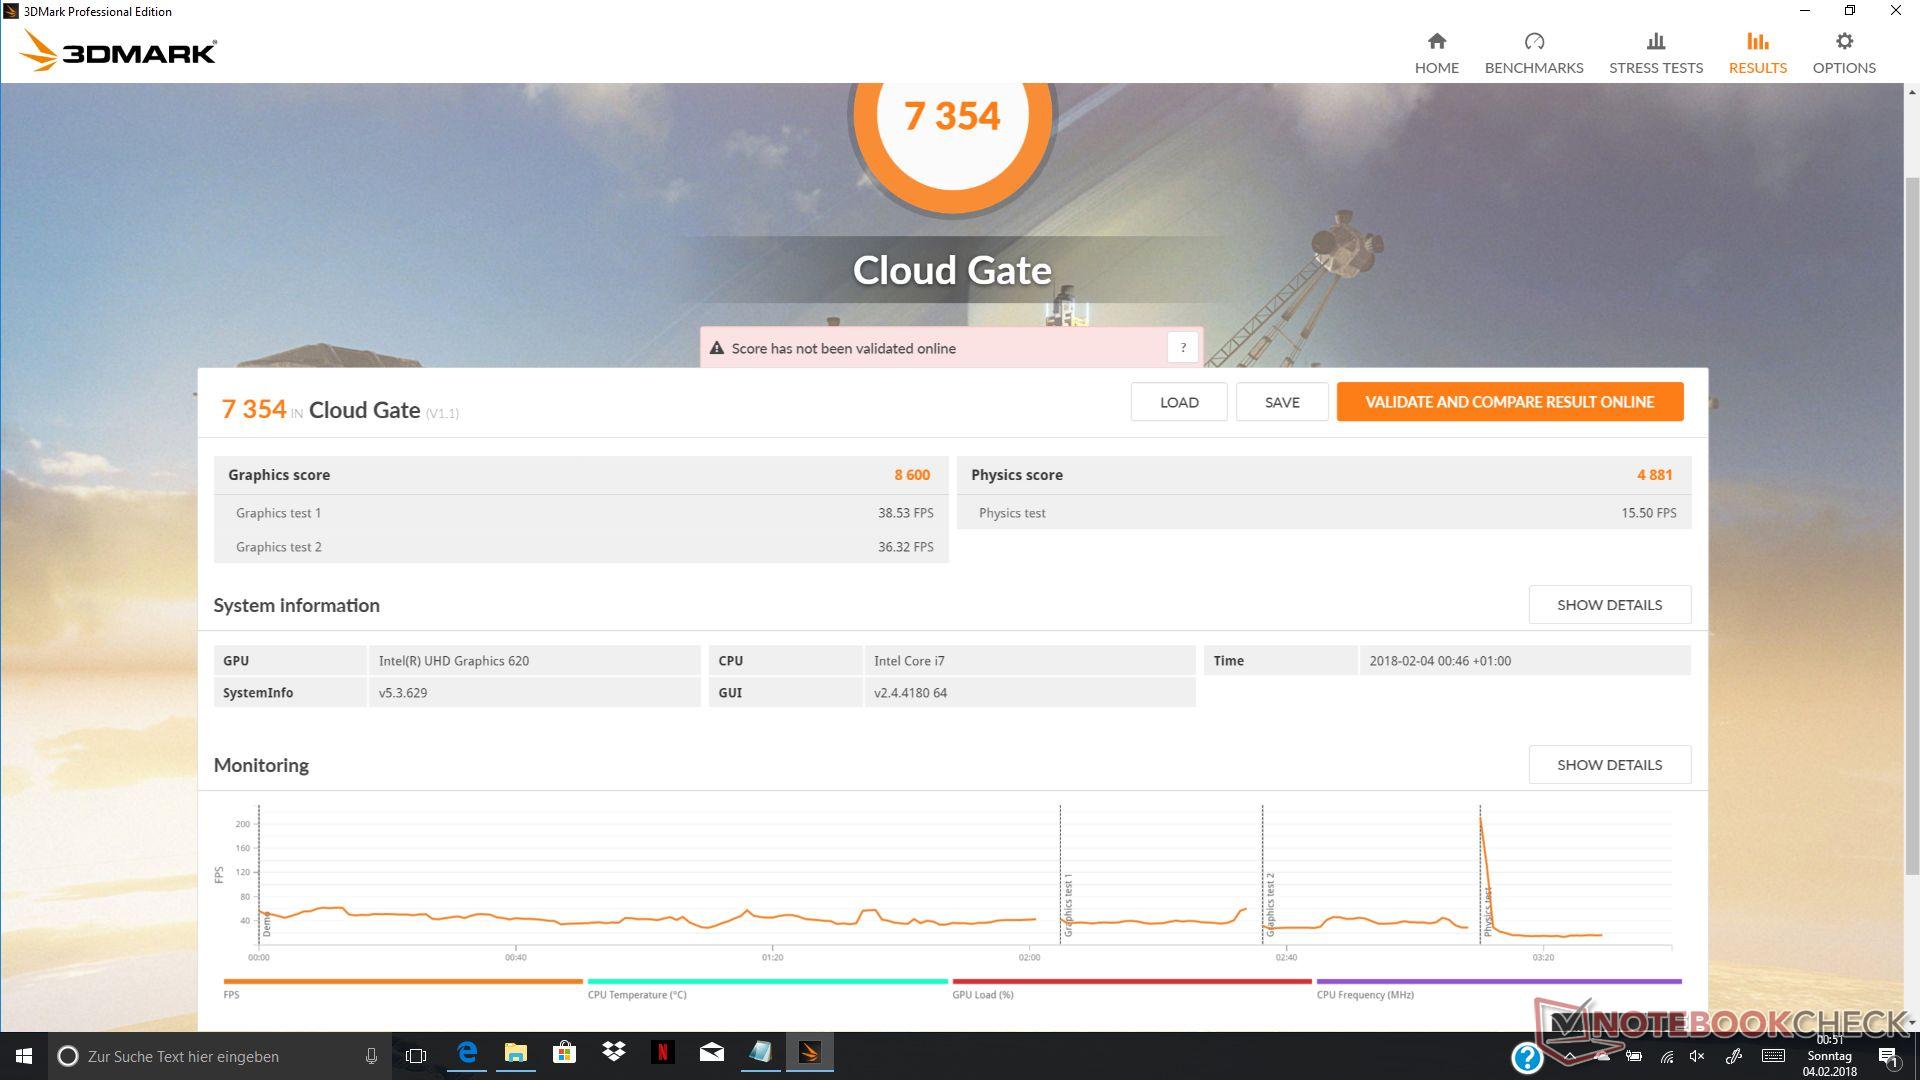
| 3DMark Cloud Gate Standard Score | 7354 pontos | |
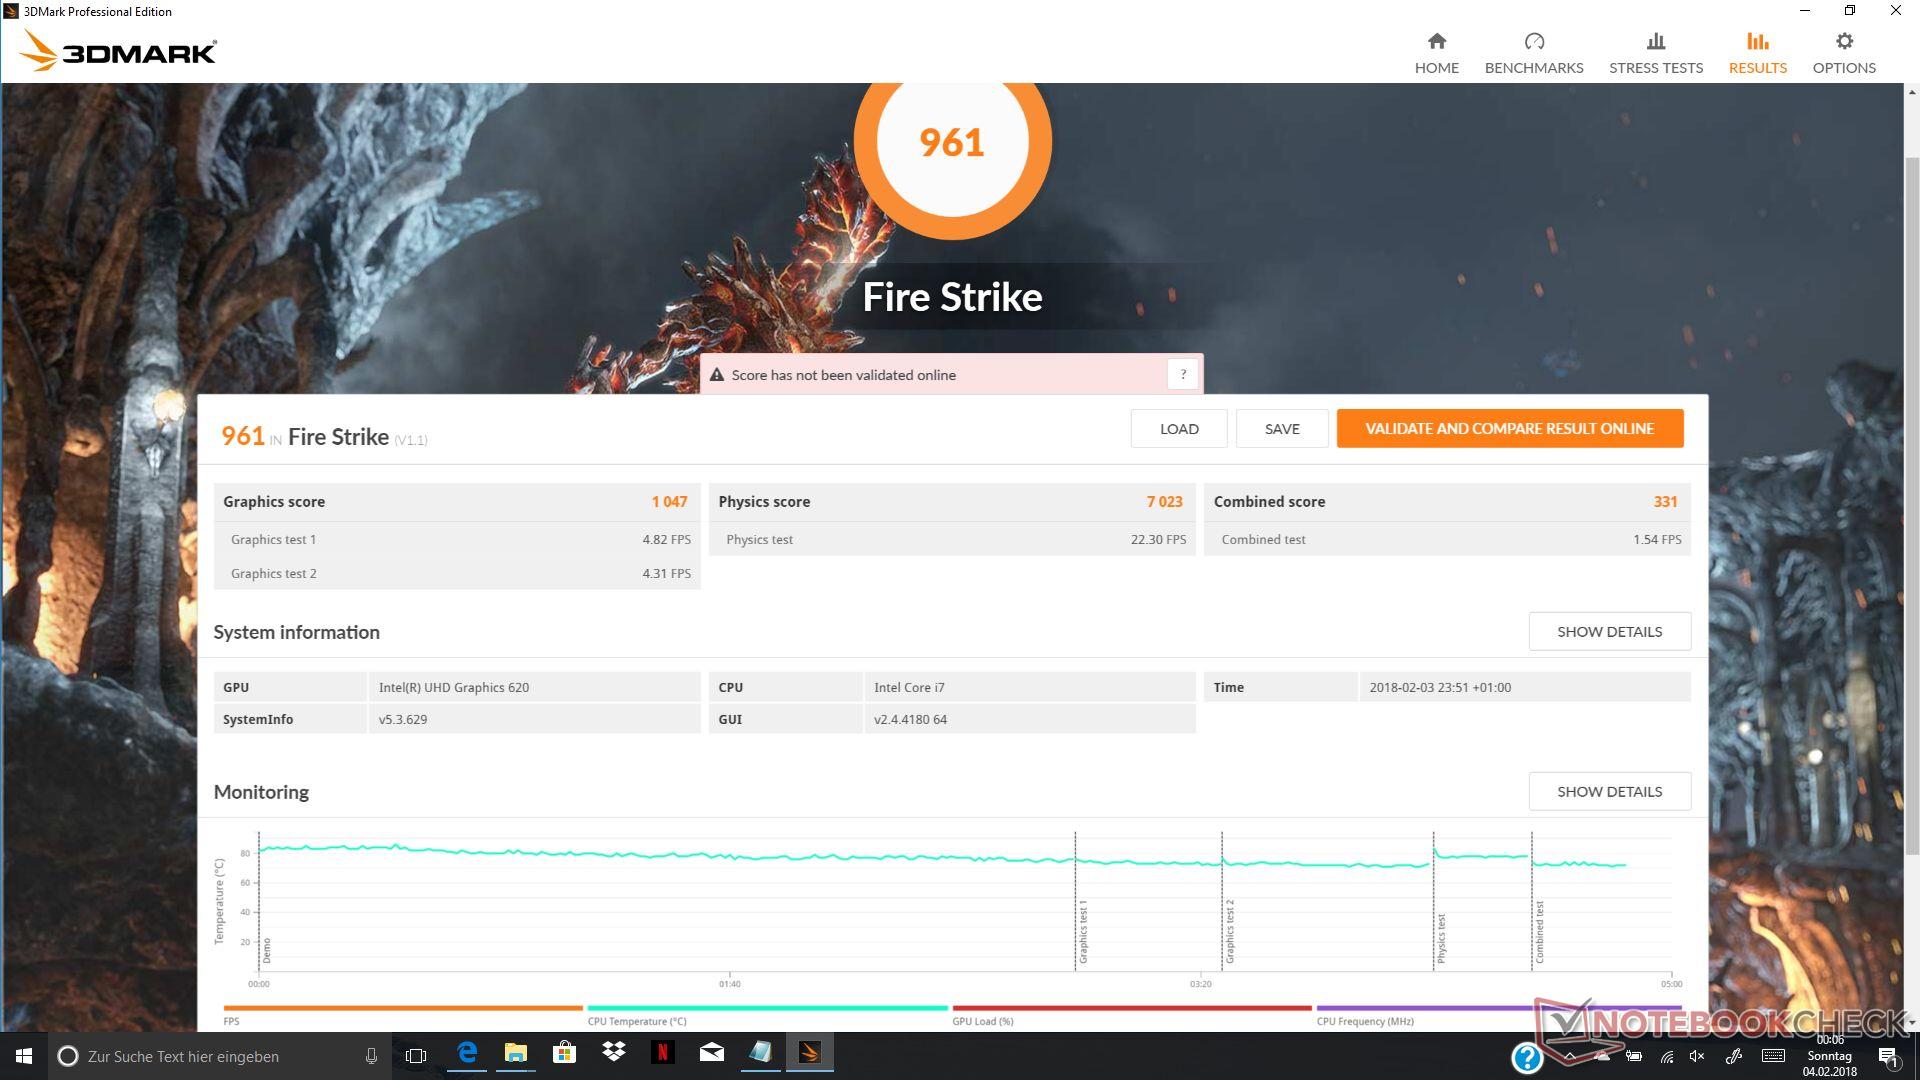
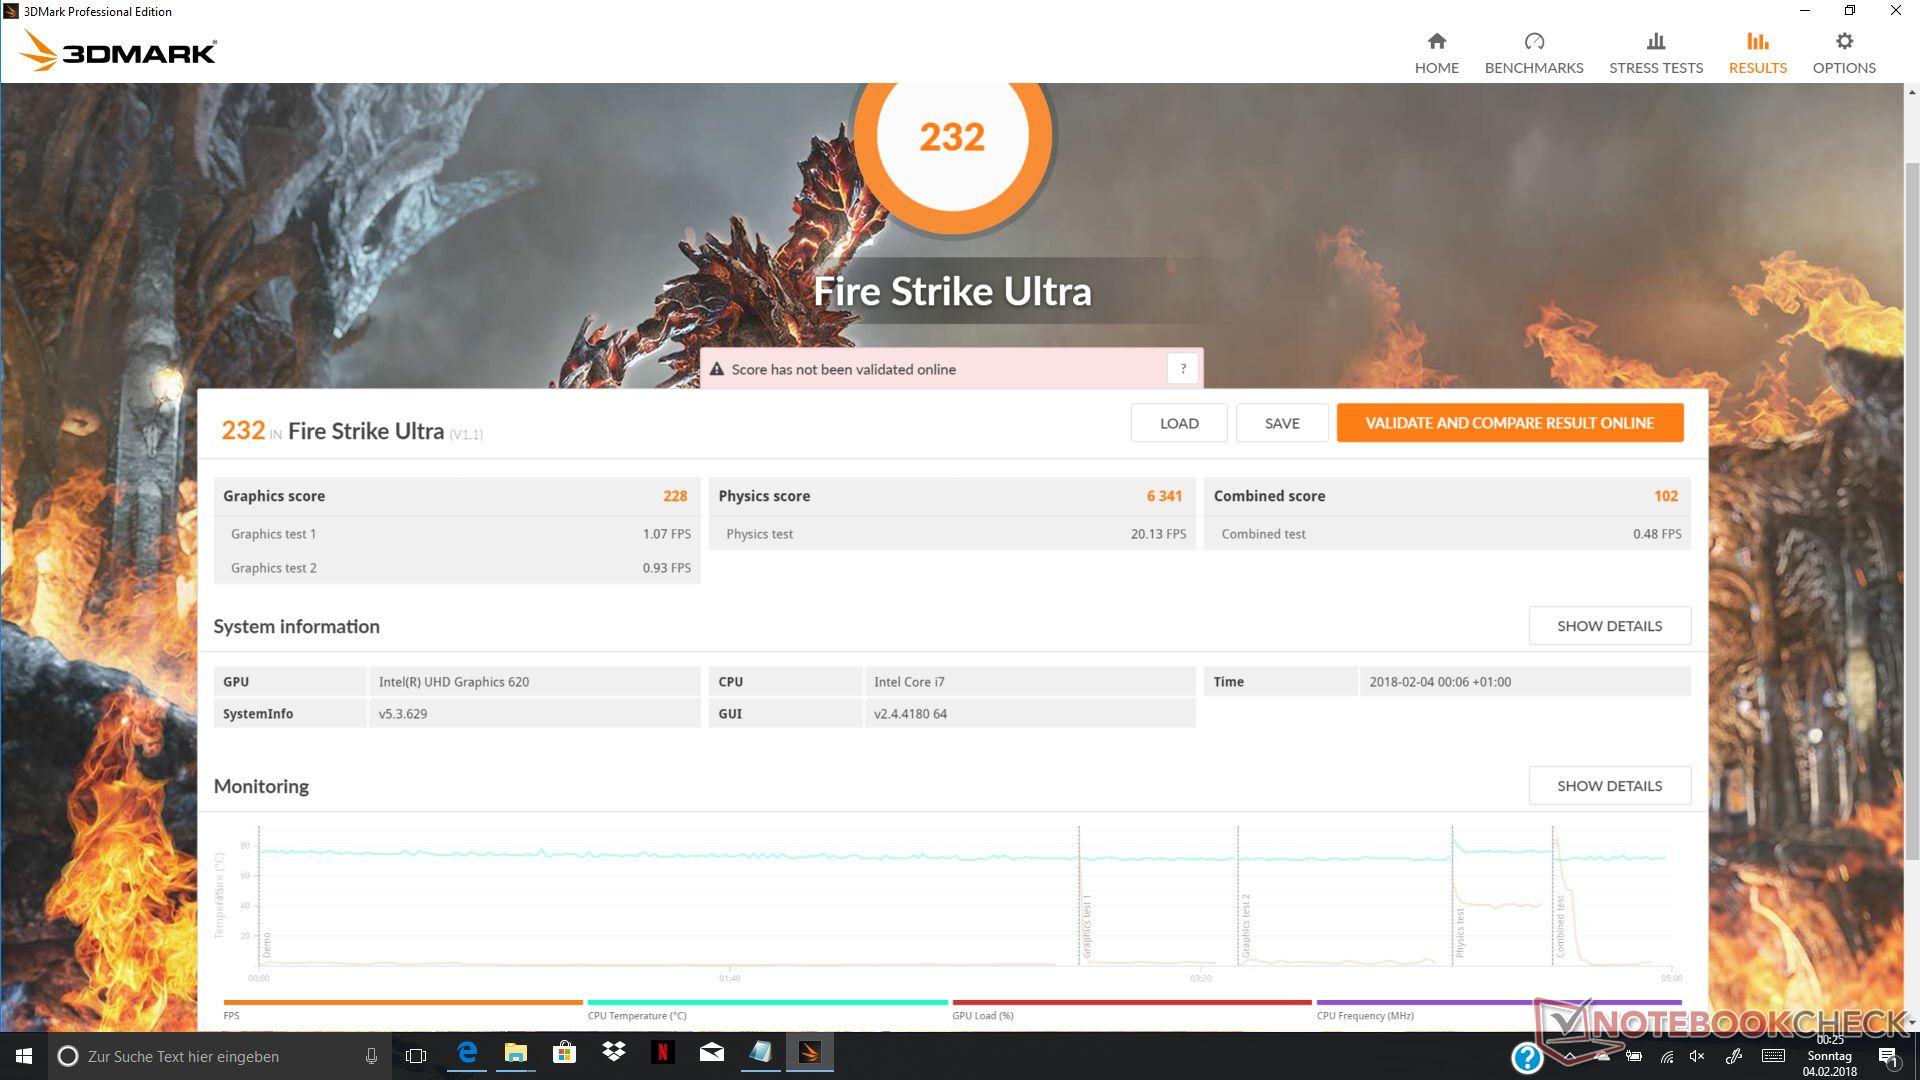
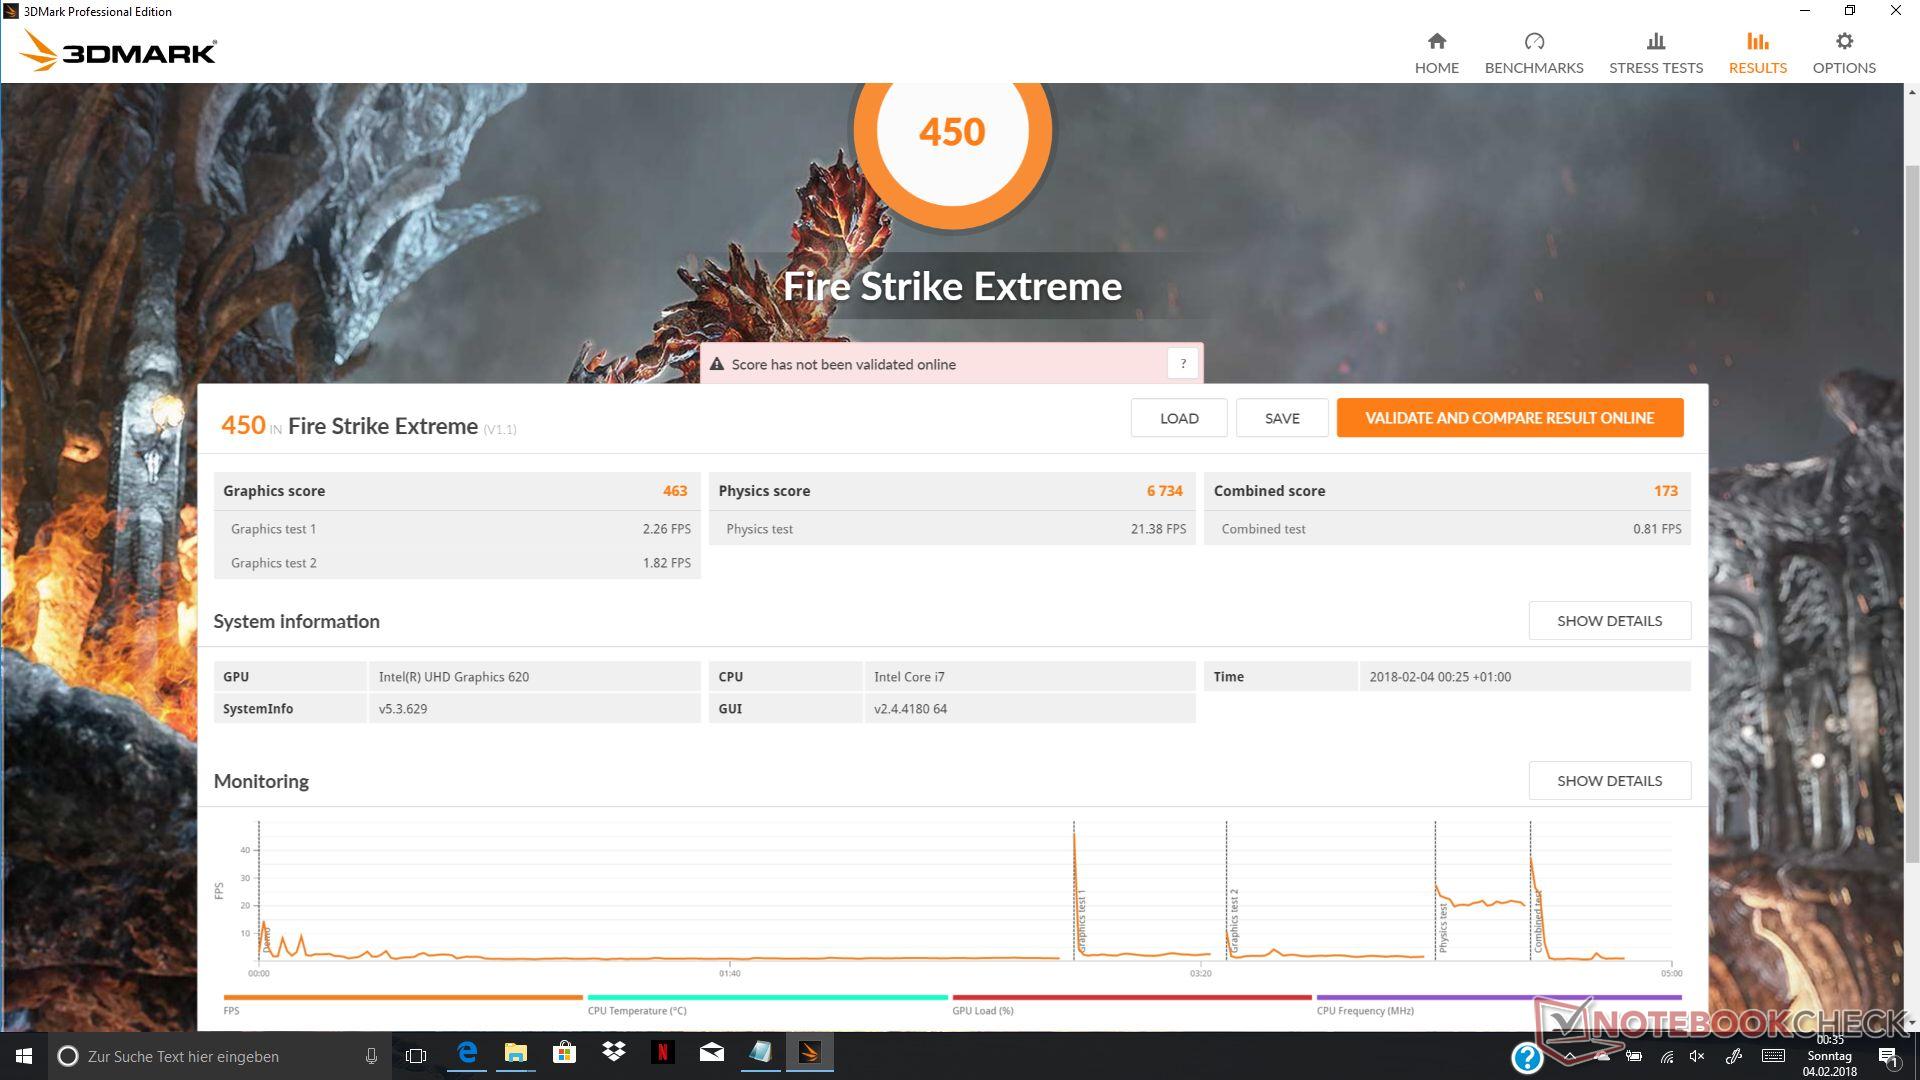
| 3DMark Fire Strike Score | 961 pontos | |
Ajuda | ||
| F1 2017 | |
| 1280x720 Ultra Low Preset | |
| HP Spectre x360 13-ae048ng | |
| HP Spectre 13-af033ng | |
| 1920x1080 Medium Preset AF:4x | |
| HP Spectre 13-af033ng | |
| HP Spectre x360 13-ae048ng | |
| 1920x1080 High Preset AA:T AF:8x | |
| HP Spectre 13-af033ng | |
| HP Spectre x360 13-ae048ng | |
| Rise of the Tomb Raider | |
| 1024x768 Lowest Preset | |
| Lenovo Yoga 920-13IKB-80Y7 | |
| Lenovo ThinkPad X1 Yoga 2018-20LES01W00 | |
| HP Spectre x360 13-ae048ng | |
| HP Spectre 13-af033ng | |
| 1366x768 Medium Preset AF:2x | |
| Lenovo Yoga 920-13IKB-80Y7 | |
| HP Spectre 13-af033ng | |
| HP Spectre x360 13-ae048ng | |
| 1920x1080 High Preset AA:FX AF:4x | |
| HP Spectre x360 13-ae048ng | |
| Lenovo Yoga 920-13IKB-80Y7 | |
| HP Spectre 13-af033ng | |
| The Witcher 3 | |
| 1024x768 Low Graphics & Postprocessing | |
| Asus ZenBook 13 UX331UN | |
| Dell XPS 13 9370 FHD i5 | |
| HP Spectre x360 13-ae048ng | |
| 1366x768 Medium Graphics & Postprocessing | |
| Asus ZenBook 13 UX331UN | |
| Dell XPS 13 9370 FHD i5 | |
| HP Spectre x360 13-ae048ng | |
| 1920x1080 High Graphics & Postprocessing (Nvidia HairWorks Off) | |
| Asus ZenBook 13 UX331UN | |
| HP Spectre x360 13-ae048ng | |
| Final Fantasy XV Benchmark | |
| 1280x720 Lite Quality | |
| Asus ZenBook 13 UX331UN | |
| HP Spectre 13-af033ng | |
| 1920x1080 Standard Quality | |
| Asus ZenBook 13 UX331UN | |
| HP Spectre x360 13-ae048ng | |
| HP Spectre 13-af033ng | |
| 1920x1080 High Quality | |
| Asus ZenBook 13 UX331UN | |
| HP Spectre x360 13-ae048ng | |
| baixo | média | alto | ultra | |
| The Witcher 3 (2015) | 14.2 | 9.9 | 5.7 | |
| Rise of the Tomb Raider (2016) | 20.1 | 12.2 | 10.3 | |
| F1 2017 (2017) | 31 | 13 | 9 | |
| Final Fantasy XV Benchmark (2018) | 4.9 | 2.6 |
Barulho
| Ocioso |
| 30.13 / 30 / 30.13 dB |
| Carga |
| 33.4 / 33 dB |
 | ||
30 dB silencioso 40 dB(A) audível 50 dB(A) ruidosamente alto |
||
min: | ||
| HP Spectre x360 13-ae048ng i5-8550U, UHD Graphics 620 | HP Spectre x360 13-ac033dx i7-7500U, HD Graphics 620 | HP Spectre 13-af033ng i5-8550U, UHD Graphics 620 | Dell XPS 13 9370 FHD i5 i5-8250U, UHD Graphics 620 | Lenovo Yoga 720-13IKB i5-8550U, UHD Graphics 620 | Acer Spin 5 SP513-52N-54SF i5-8250U, UHD Graphics 620 | |
|---|---|---|---|---|---|---|
| Noise | -8% | 1% | 1% | -1% | -2% | |
| off / environment * | 30.13 | 28.7 5% | 30.13 -0% | 29.1 3% | 30.5 -1% | 30.4 -1% |
| Idle Minimum * | 30.13 | 28.7 5% | 30.13 -0% | 29.1 3% | 30.5 -1% | 30.4 -1% |
| Idle Average * | 30 | 34.2 -14% | 30.13 -0% | 29.1 3% | 30.5 -2% | 30.4 -1% |
| Idle Maximum * | 30.13 | 35.8 -19% | 30.13 -0% | 29.1 3% | 30.5 -1% | 30.9 -3% |
| Load Average * | 33.4 | 35.8 -7% | 31.5 6% | 32.2 4% | 32.8 2% | 34 -2% |
| Load Maximum * | 33 | 39.6 -20% | 33.5 -2% | 37.3 -13% | 34.7 -5% | 33.5 -2% |
* ... smaller is better
(-) The maximum temperature on the upper side is 46.5 °C / 116 F, compared to the average of 35.3 °C / 96 F, ranging from 19.6 to 55.7 °C for the class Convertible.
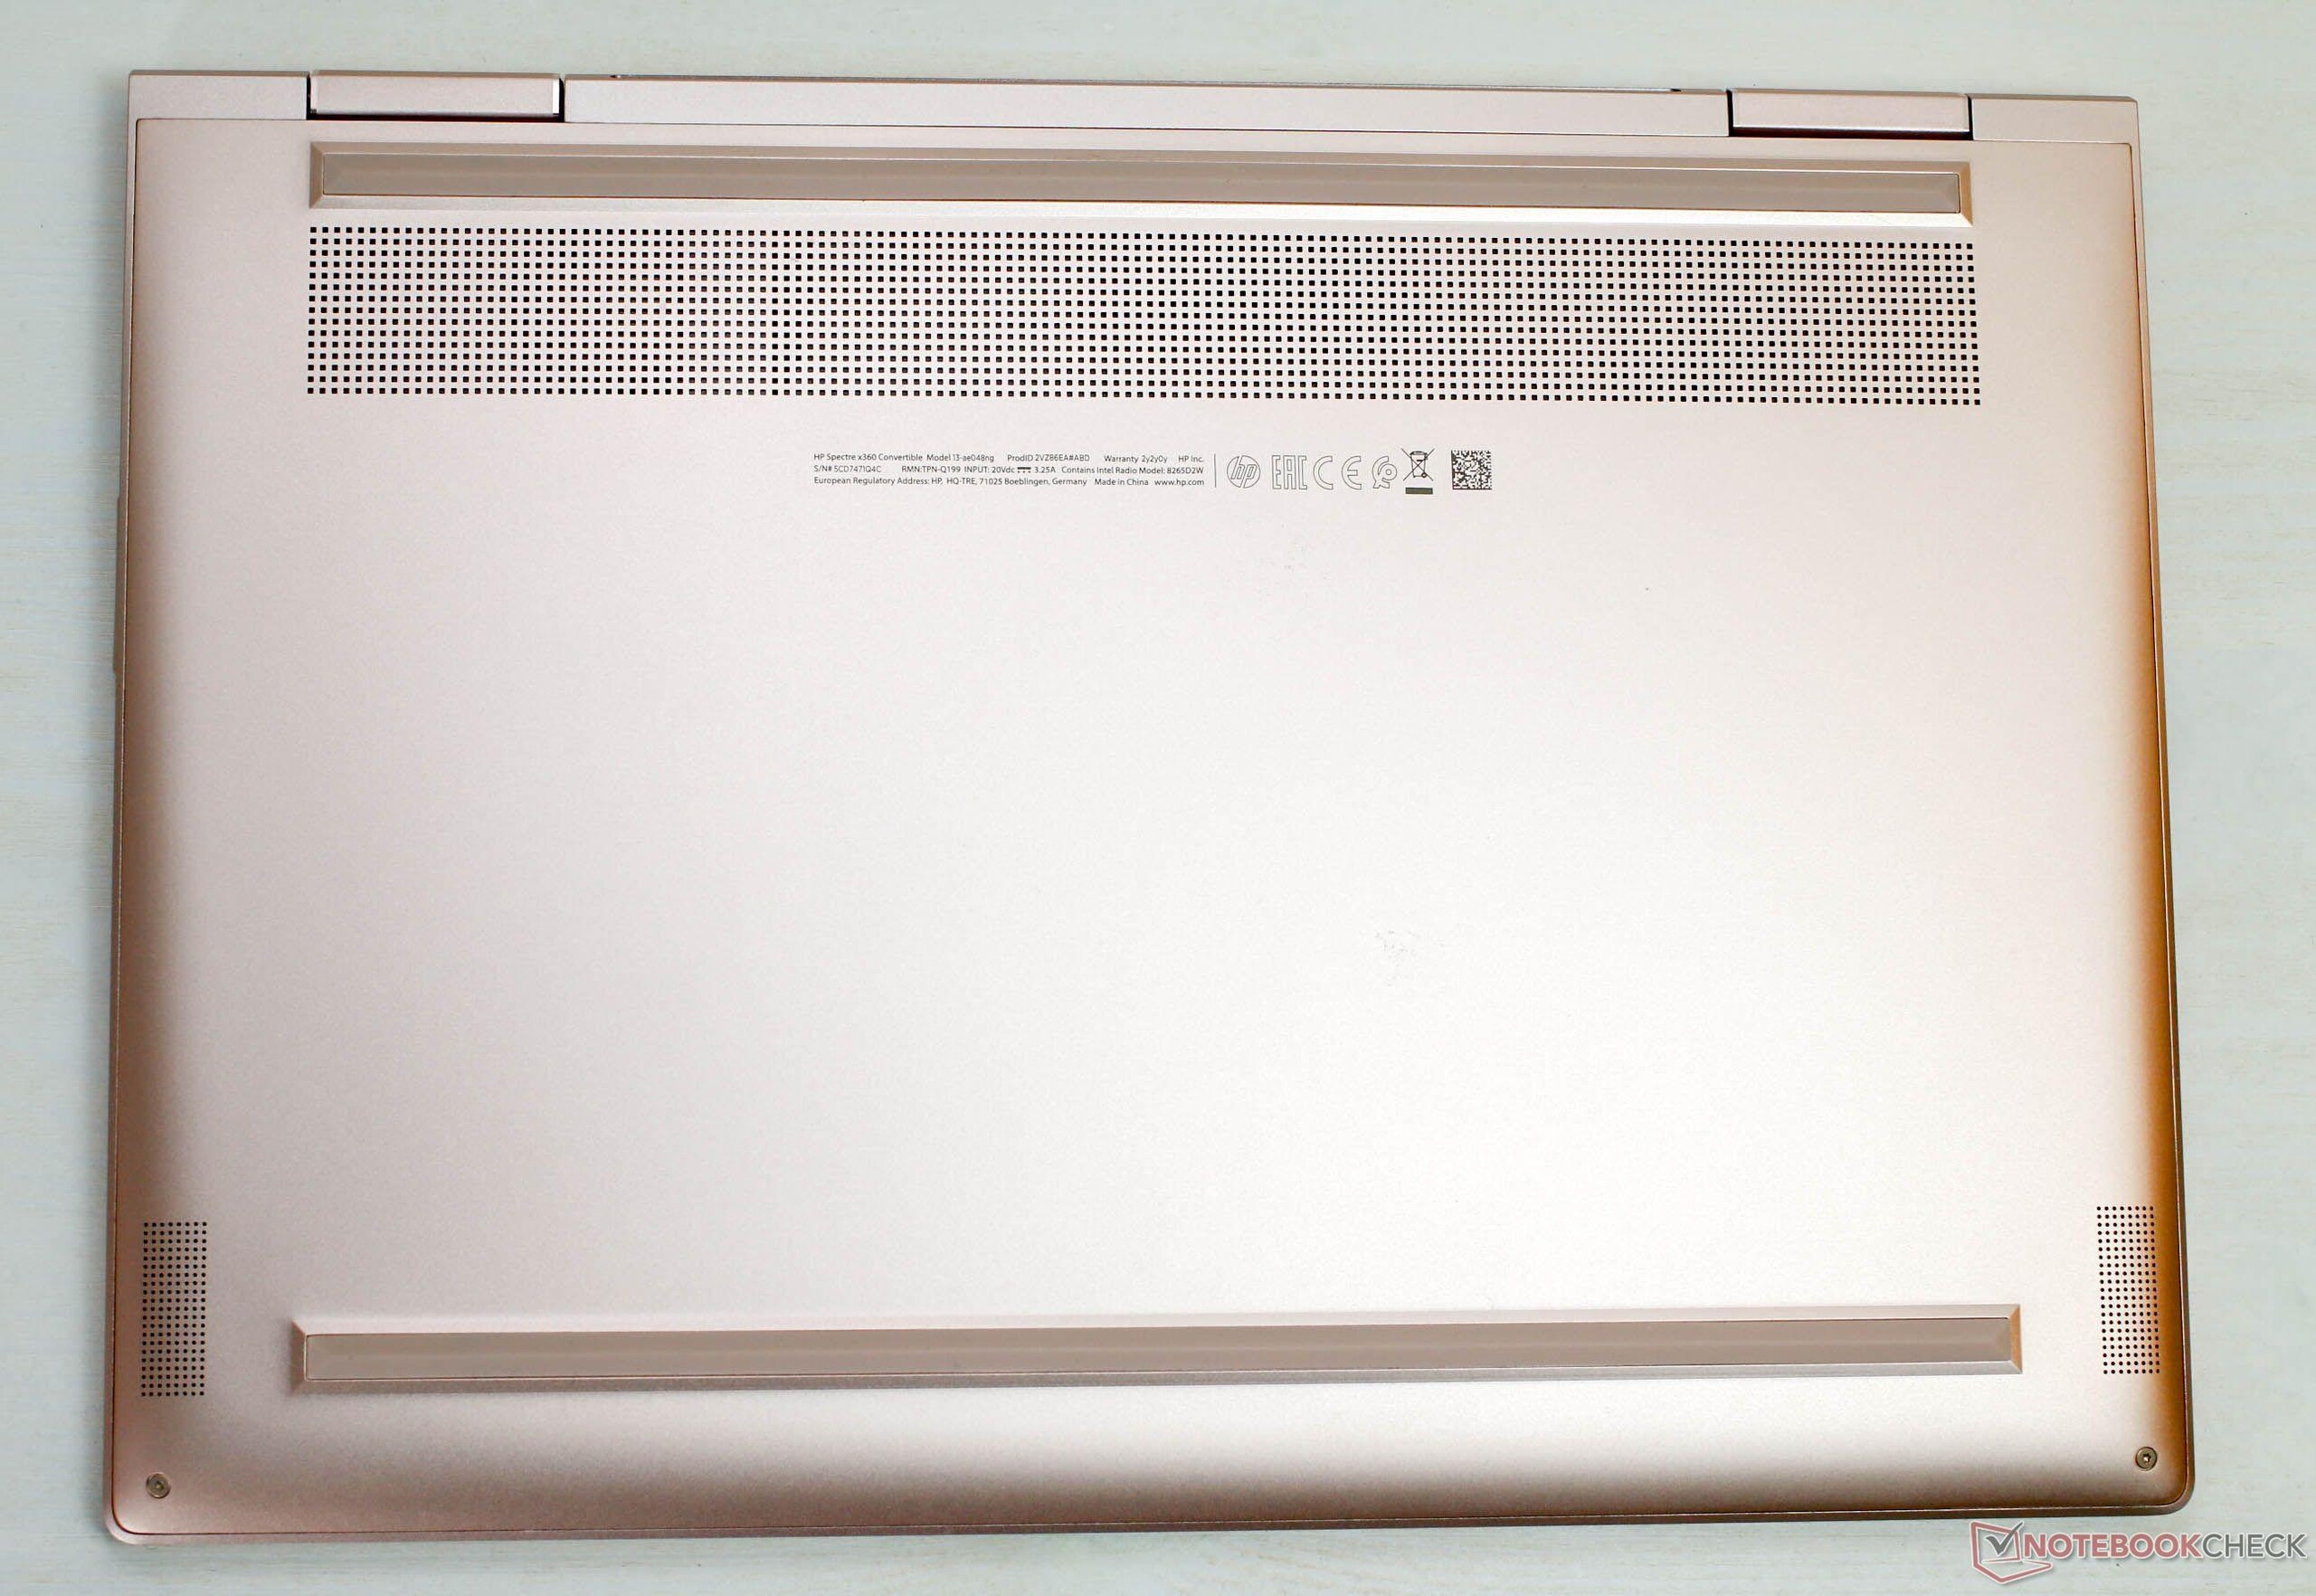
(-) The bottom heats up to a maximum of 46.5 °C / 116 F, compared to the average of 36.8 °C / 98 F
(+) In idle usage, the average temperature for the upper side is 26 °C / 79 F, compared to the device average of 30.2 °C / 86 F.
(+) The palmrests and touchpad are cooler than skin temperature with a maximum of 29.1 °C / 84.4 F and are therefore cool to the touch.
(±) The average temperature of the palmrest area of similar devices was 28.1 °C / 82.6 F (-1 °C / -1.8 F).
HP Spectre x360 13-ae048ng audio analysis
(±) | speaker loudness is average but good (72.6 dB)
Bass 100 - 315 Hz
(±) | reduced bass - on average 13.4% lower than median
(+) | bass is linear (6.3% delta to prev. frequency)
Mids 400 - 2000 Hz
(+) | balanced mids - only 4% away from median
(+) | mids are linear (4% delta to prev. frequency)
Highs 2 - 16 kHz
(+) | balanced highs - only 1.5% away from median
(+) | highs are linear (4% delta to prev. frequency)
Overall 100 - 16.000 Hz
(+) | overall sound is linear (13.3% difference to median)
Compared to same class
» 14% of all tested devices in this class were better, 2% similar, 84% worse
» The best had a delta of 6%, average was 21%, worst was 57%
Compared to all devices tested
» 11% of all tested devices were better, 3% similar, 87% worse
» The best had a delta of 4%, average was 25%, worst was 134%
Dell XPS 13 9370 FHD i5 audio analysis
(+) | speakers can play relatively loud (82.8 dB)
Bass 100 - 315 Hz
(-) | nearly no bass - on average 18.6% lower than median
(±) | linearity of bass is average (11.1% delta to prev. frequency)
Mids 400 - 2000 Hz
(±) | higher mids - on average 5.3% higher than median
(+) | mids are linear (3.8% delta to prev. frequency)
Highs 2 - 16 kHz
(+) | balanced highs - only 3.9% away from median
(+) | highs are linear (6.4% delta to prev. frequency)
Overall 100 - 16.000 Hz
(±) | linearity of overall sound is average (18.2% difference to median)
Compared to same class
» 47% of all tested devices in this class were better, 7% similar, 46% worse
» The best had a delta of 5%, average was 19%, worst was 53%
Compared to all devices tested
» 33% of all tested devices were better, 8% similar, 59% worse
» The best had a delta of 4%, average was 25%, worst was 134%
Apple MacBook Air 13.3" 1.8 GHz (2017) audio analysis
(±) | speaker loudness is average but good (77.7 dB)
Bass 100 - 315 Hz
(±) | reduced bass - on average 9.2% lower than median
(±) | linearity of bass is average (11% delta to prev. frequency)
Mids 400 - 2000 Hz
(+) | balanced mids - only 3.6% away from median
(±) | linearity of mids is average (9.7% delta to prev. frequency)
Highs 2 - 16 kHz
(±) | higher highs - on average 5.2% higher than median
(±) | linearity of highs is average (8.4% delta to prev. frequency)
Overall 100 - 16.000 Hz
(±) | linearity of overall sound is average (15.1% difference to median)
Compared to same class
» 27% of all tested devices in this class were better, 5% similar, 68% worse
» The best had a delta of 5%, average was 19%, worst was 53%
Compared to all devices tested
» 17% of all tested devices were better, 4% similar, 79% worse
» The best had a delta of 4%, average was 25%, worst was 134%
| desligado | |
| Ocioso | |
| Carga |
|
| HP Spectre x360 13-ae048ng i5-8550U, UHD Graphics 620, Toshiba NVMe THNSN51T02DUK, IPS, 1920x1080, 13.30 | HP Spectre x360 13-ac033dx i7-7500U, HD Graphics 620, Samsung PM961 NVMe MZVLW512HMJP, IPS, 3840x2160, 13.30 | HP Spectre 13-af033ng i5-8550U, UHD Graphics 620, Samsung PM961 NVMe MZVLW512HMJP, IPS, 1920x1080, 13.30 | Lenovo Yoga 920-13IKB-80Y7 i5-8550U, UHD Graphics 620, Samsung PM961 MZVLW256HEHP, IPS, 1920x1080, 13.90 | Dell XPS 13 9370 FHD i5 i5-8250U, UHD Graphics 620, Toshiba XG5 KXG50ZNV256G, IPS, 1920x1080, 13.30 | Lenovo ThinkPad X1 Yoga 2018-20LES01W00 i5-8550U, UHD Graphics 620, Samsung SSD PM981 MZVLB512HAJQ, IPS Dolby Vision HDR, 2560x1440, 14.00 | Asus ZenBook 13 UX331UN i5-8550U, GeForce MX150, SK Hynix HFS256G39TND-N210A, IPS, 1920x1080, 13.30 | Acer Spin 5 SP513-52N-54SF i5-8250U, UHD Graphics 620, Micron 1100 MTFDDAV256TBN, IPS, 1920x1080, 13.30 | |
|---|---|---|---|---|---|---|---|---|
| Power Consumption | -30% | -1% | 0% | -5% | -51% | 2% | -8% | |
| Idle Minimum * | 3.2 | 5.3 -66% | 2.8 12% | 3.1 3% | 3.14 2% | 3.4 -6% | 2.2 31% | 3.9 -22% |
| Idle Average * | 6 | 9.6 -60% | 6.2 -3% | 6.6 -10% | 5.22 13% | 8.8 -47% | 5 17% | 8.2 -37% |
| Idle Maximum * | 9.2 | 10.1 -10% | 9.4 -2% | 7 24% | 6 35% | 11.9 -29% | 8 13% | 8.8 4% |
| Load Average * | 29.5 | 34.4 -17% | 32.2 -9% | 35.2 -19% | 38.5 -31% | 50.4 -71% | 33 -12% | 28.5 3% |
| Load Maximum * | 35.6 | 34.8 2% | 36.6 -3% | 34.6 3% | 50.4 -42% | 71.2 -100% | 49.4 -39% | 30.7 14% |
* ... smaller is better
| HP Spectre x360 13-ae048ng i5-8550U, UHD Graphics 620, 60 Wh | HP Spectre x360 13-ac033dx i7-7500U, HD Graphics 620, 57.8 Wh | HP Spectre 13-af033ng i5-8550U, UHD Graphics 620, 43 Wh | Lenovo Yoga 920-13IKB-80Y7 i5-8550U, UHD Graphics 620, 70 Wh | Dell XPS 13 9370 FHD i5 i5-8250U, UHD Graphics 620, 52 Wh | Asus ZenBook 13 UX331UN i5-8550U, GeForce MX150, 50 Wh | SCHENKER Slim 15 L17 i5-8550U, UHD Graphics 620, 44 Wh | Acer Spin 5 SP513-52N-54SF i5-8250U, UHD Graphics 620, 53.9 Wh | |
|---|---|---|---|---|---|---|---|---|
| Battery Runtime | -15% | -36% | 7% | -9% | -28% | -57% | -5% | |
| H.264 | 1070 | 649 -39% | 831 -22% | 534 -50% | 255 -76% | |||
| WiFi v1.3 | 527 | 537 2% | 352 -33% | 685 30% | 644 22% | 538 2% | 275 -48% | 500 -5% |
| Load | 166 | 114 -31% | 104 -37% | 140 -16% | 119 -28% | 105 -37% | 86 -48% | |
| Reader / Idle | 792 | 1655 | 1417 | 1240 | 442 |
Pro
Contra
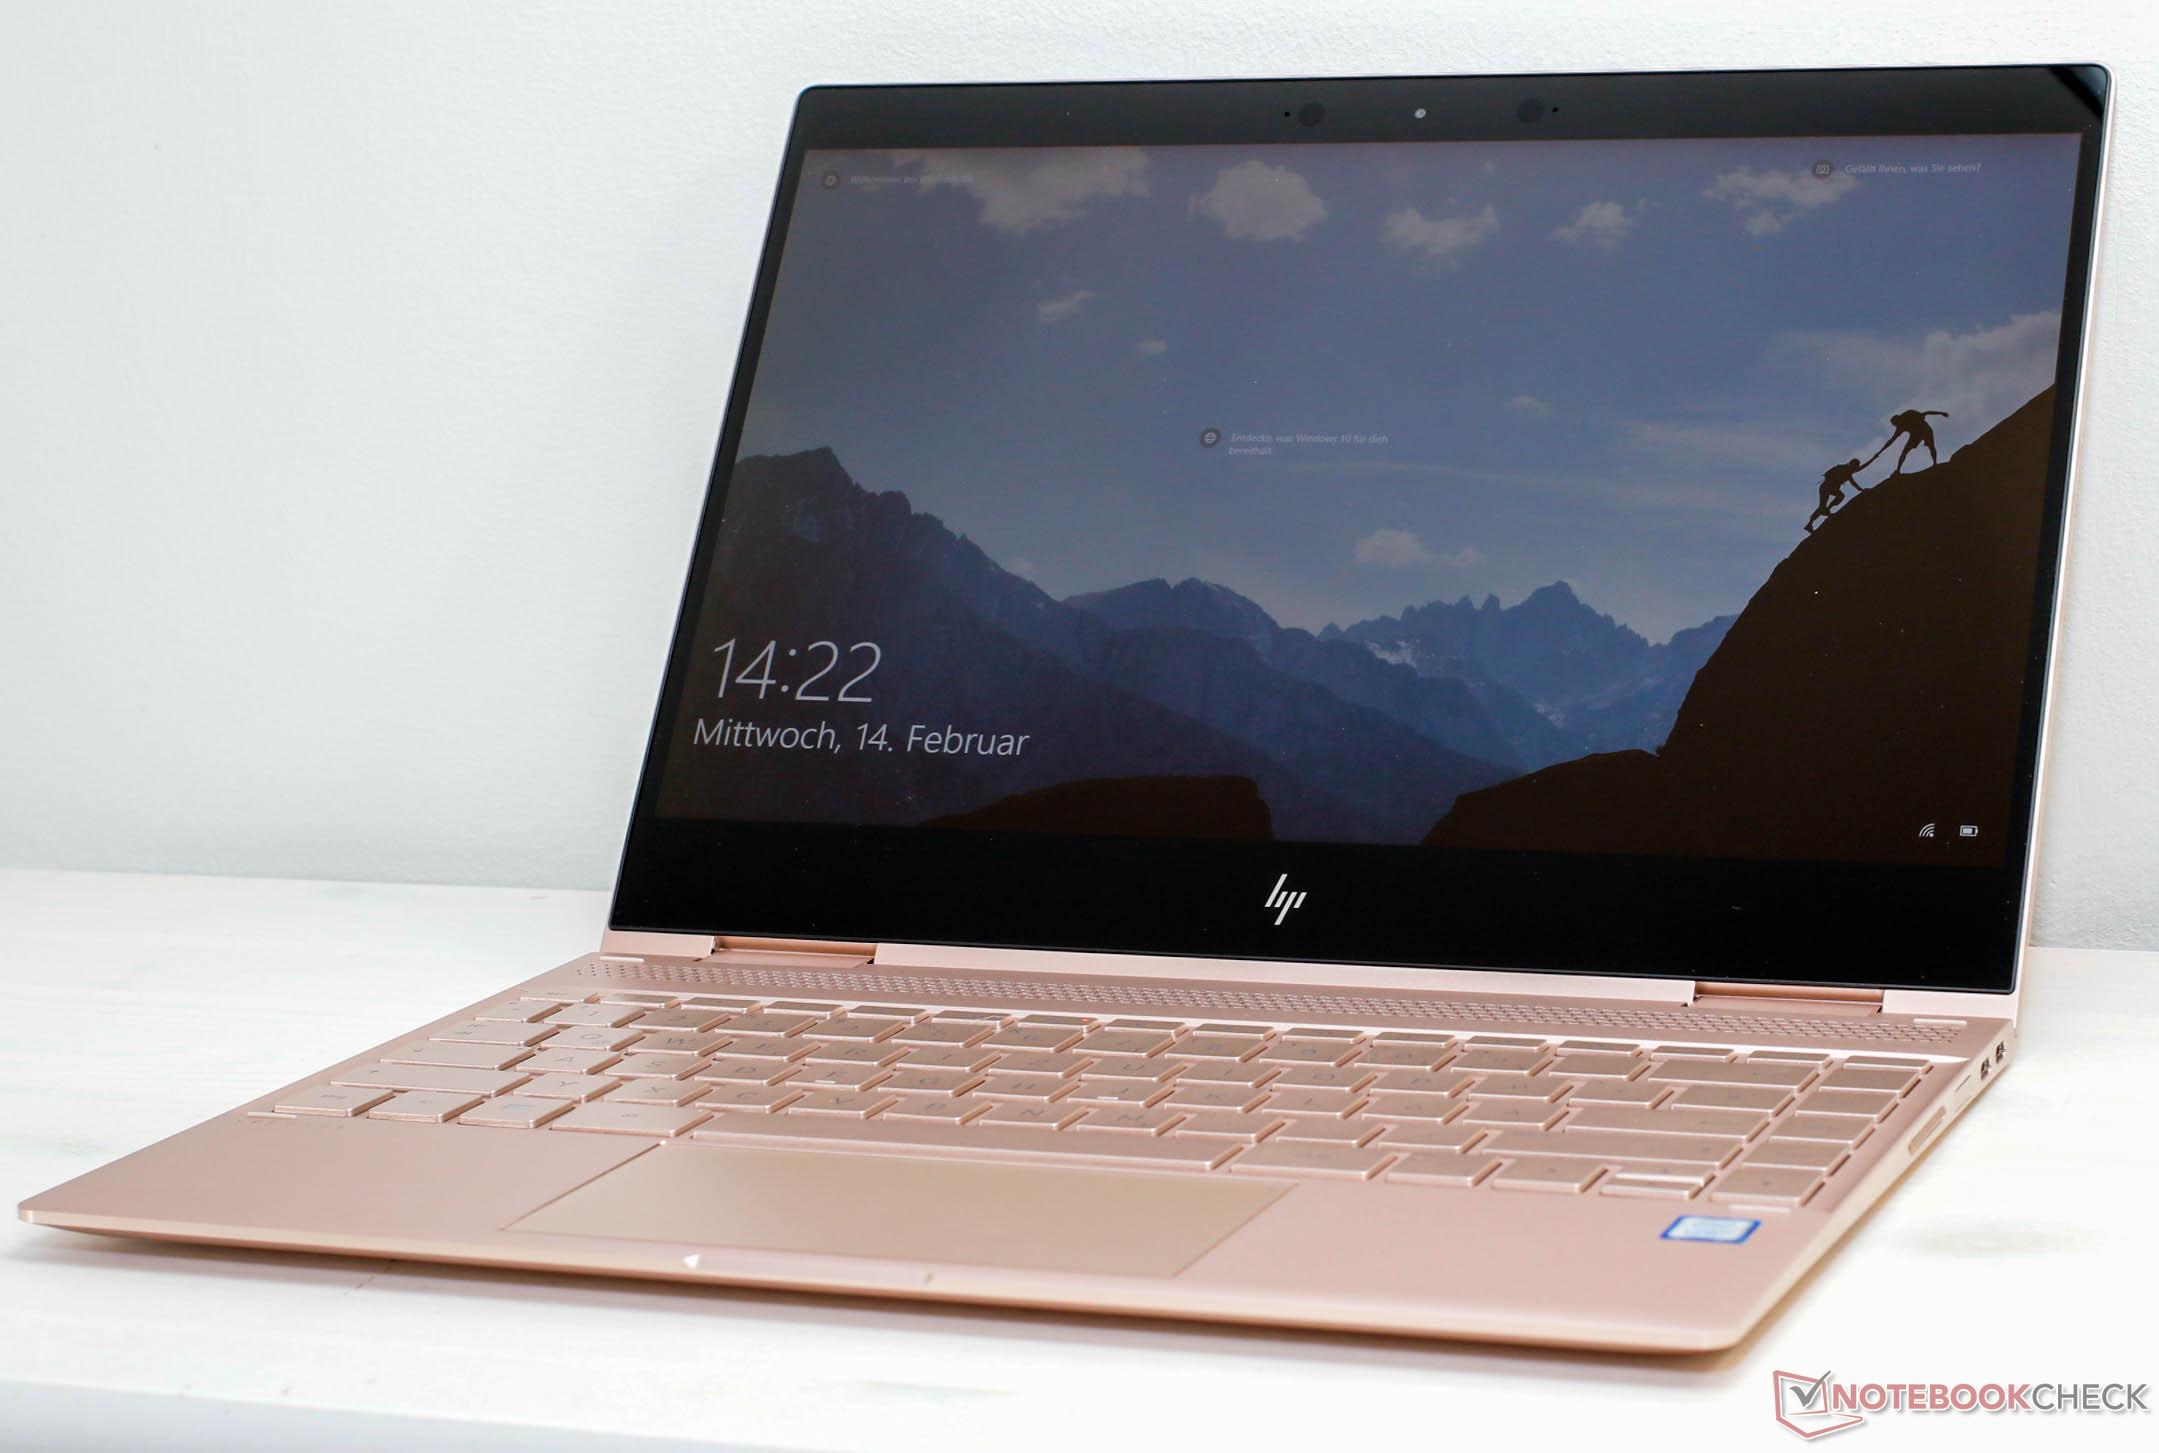
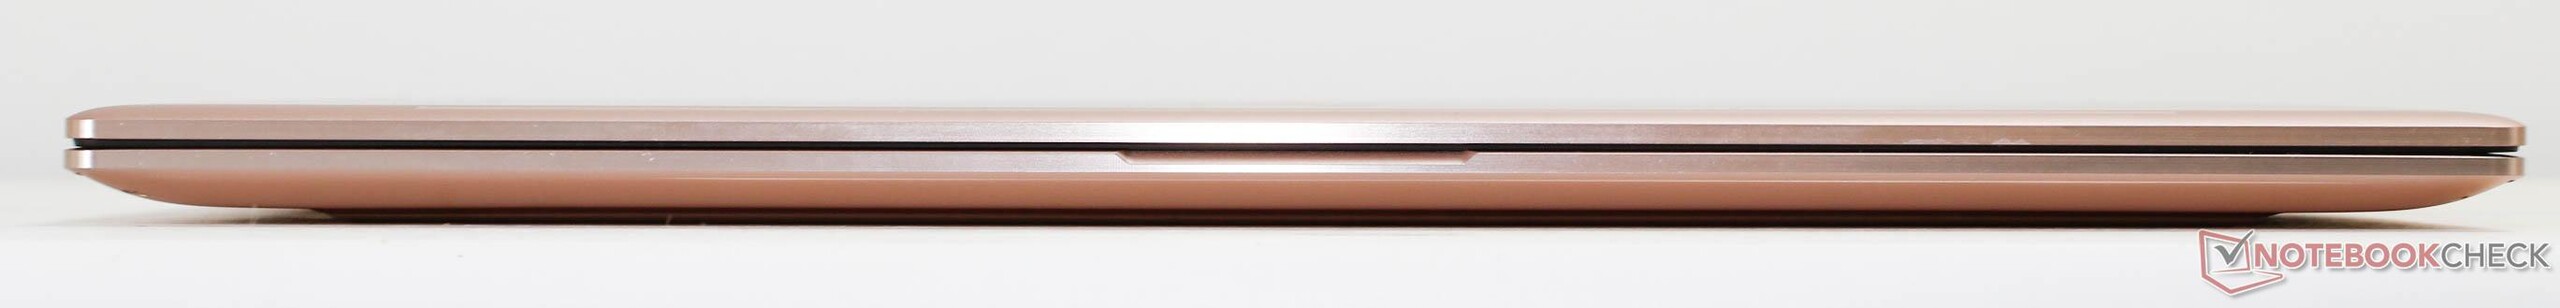
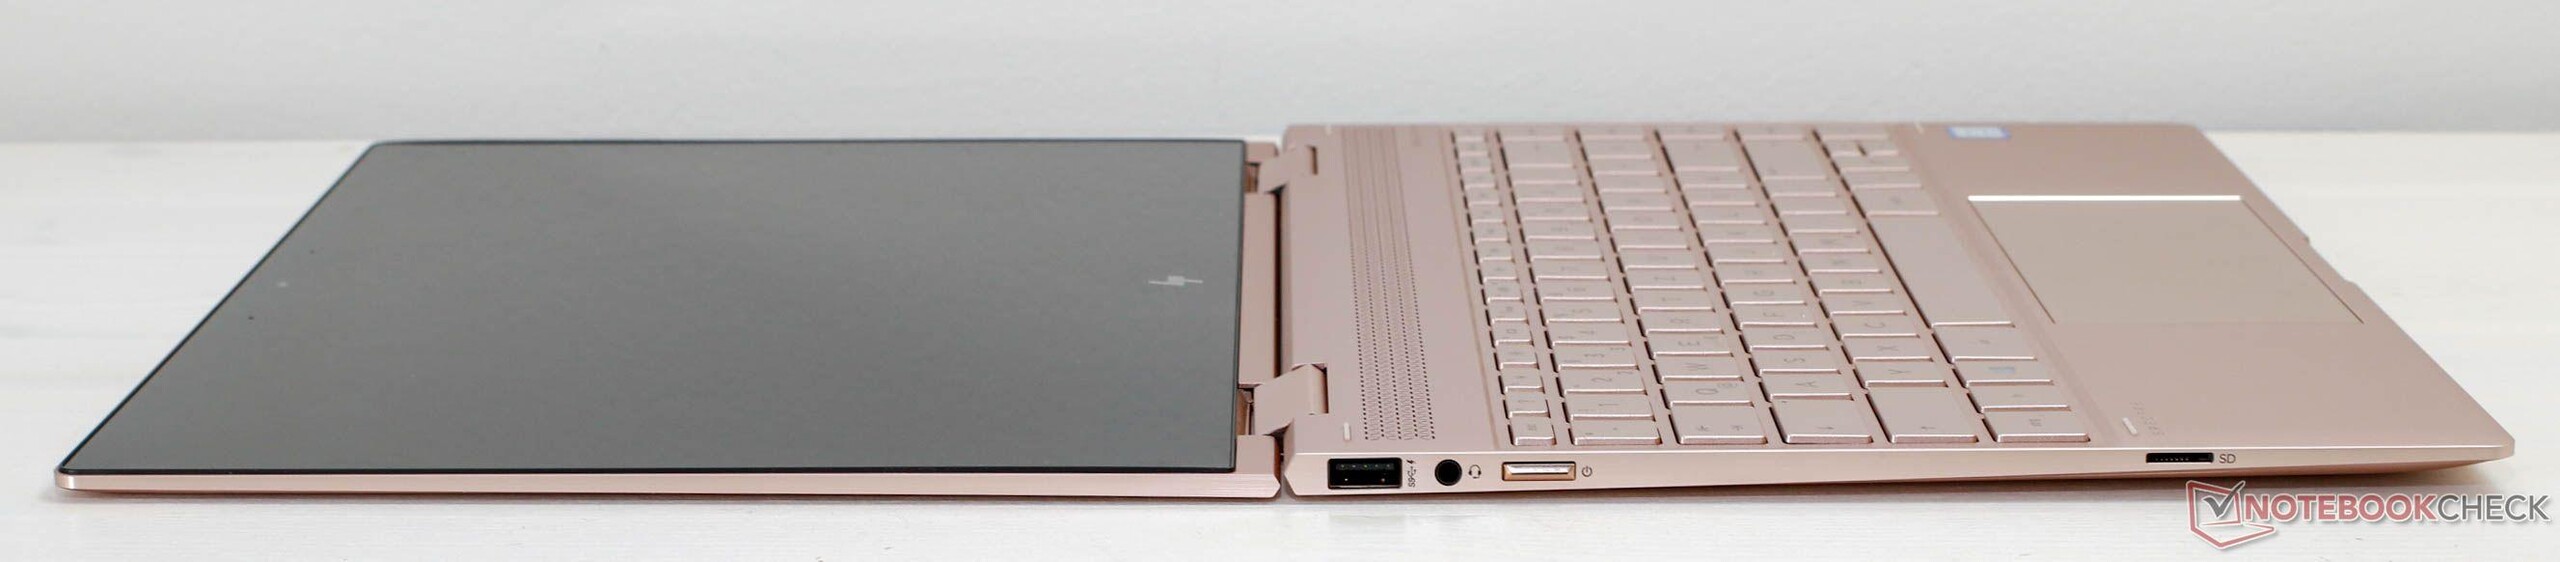
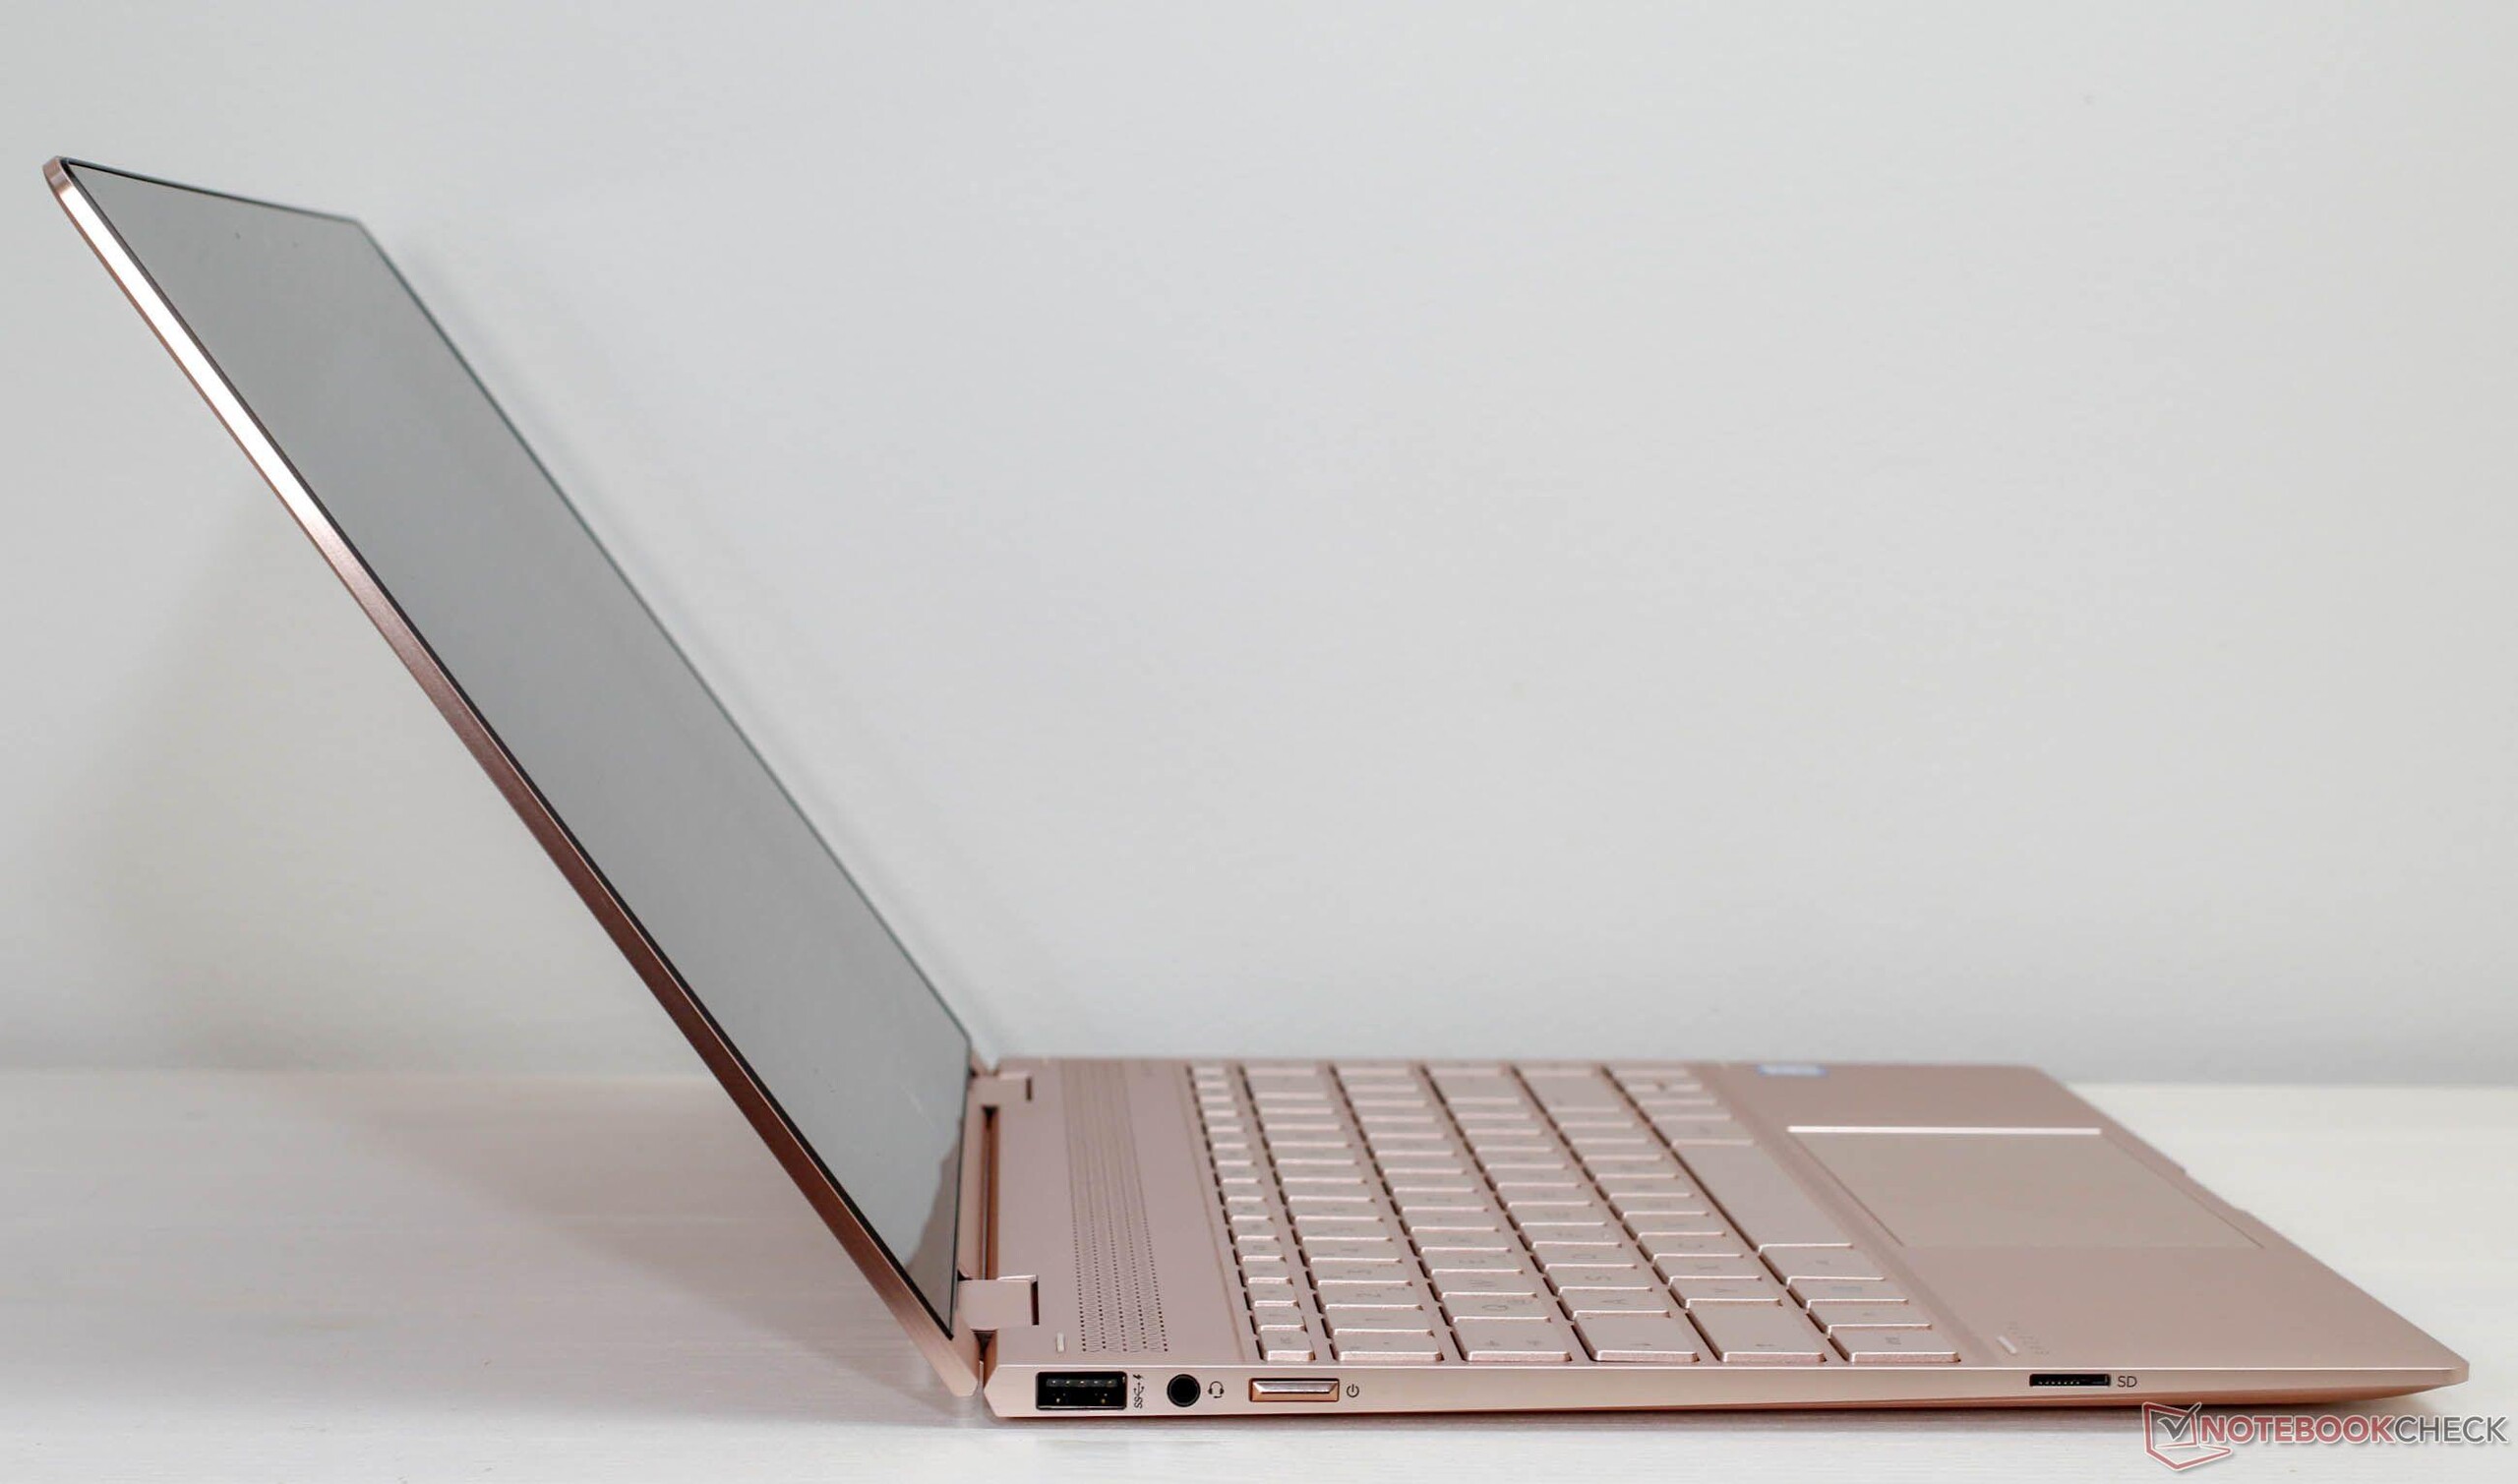
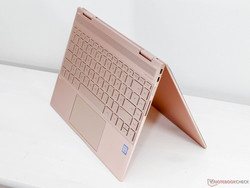
Ao rodar nossos testes Spectre x360 e benchmark perguntamos a vocês, nossos leitores, quais são as características mais importantes de um conversível premium, e portabilidade, duração da bateria, ruído da bobina, desempenho e rigidez da carcaça, estão entre os fatores mais importantes. De um modo geral, um conversível deve ser portátil até certo ponto; a carcaça deve ser rígida e a duração da bateria deve ser longa o suficiente. A carcaça do x360 é muito robusta considerando seu peso e espessura. Obviamente não é totalmente imune a flexão e deformação, mas muito mais do que o Ultrabook Spectre 13. As dobradiças também pareciam ser mais duráveis e firmes.
O segundo aspecto da portabilidade - duração da bateria - foi abordado pela bateria de 60 Wh (comparada à minúscula bateria de 43 Wh do Ultrabook). Graças ao baixo consumo de energia e a uma política ativa de otimização dinâmica, o Spectre x360 conseguiu superar o Lenovo Yoga 920 com sua bateria de 70 Wh. O preço que você paga é um desempenho menor do sistema e da CPU - o Lenovo Yoga 920 é muito mais rápido em todos os aspectos do que o Spectre x360. Se a duração da bateria for mais importante, sugerimos que fique longe do modelo 4K, pois reduzirá significativamente a duração da bateria.
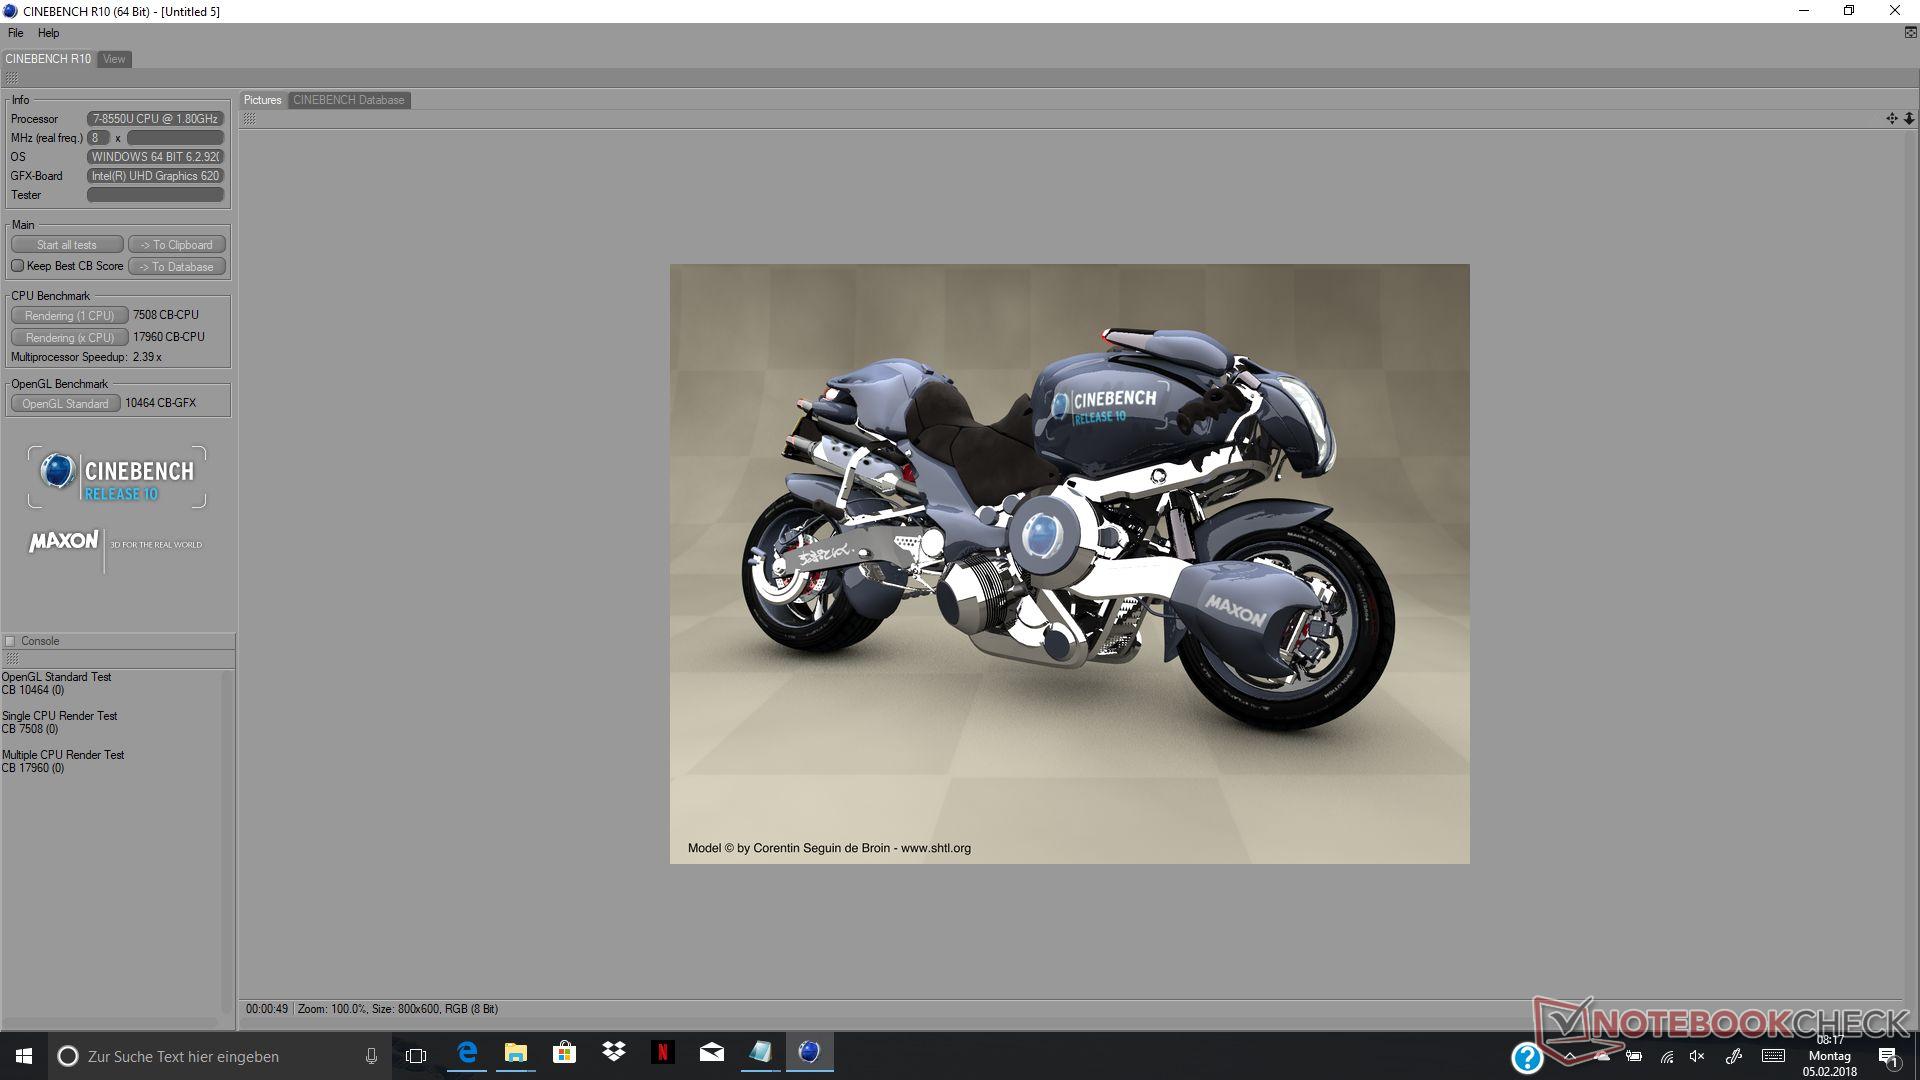
O desempenho geral do Core i7-8550U foi sólido, com exceção de cargas de trabalho ou jogos graficamente intensivos, nos quais a UHD Graphics 620 era visivelmente mais lenta do que em outros portáteis comparativamente equipados. As cargas de trabalho cotidianas não são um desafio real, no entanto. O touchpad e a tela táctil funcionaram bem, mas infelizmente não conseguimos analisar a caneta opcional.
O preço pode parecer exagerado quando olha para a avaliação de desempenho do Spectre, mas a qualidade de construção e o design compensam isso.
O preço obviamente depende da sua escolha de hardware, e o dispositivo pode ser configurado de acordo com o seu gosto pessoal na loja online da HP. O modelo básico está a partir de $999 e inclui uma CPU i5-8250U, 8 GB de RAM e um SSD de 360 GB (atualmente uma atualização gratuita do habitual SSD de 256 GB); um modelo totalmente especificado (visor 4K, i7-8550U, 16 GB de RAM, SSD de 1 TB) custará quase $1.700.
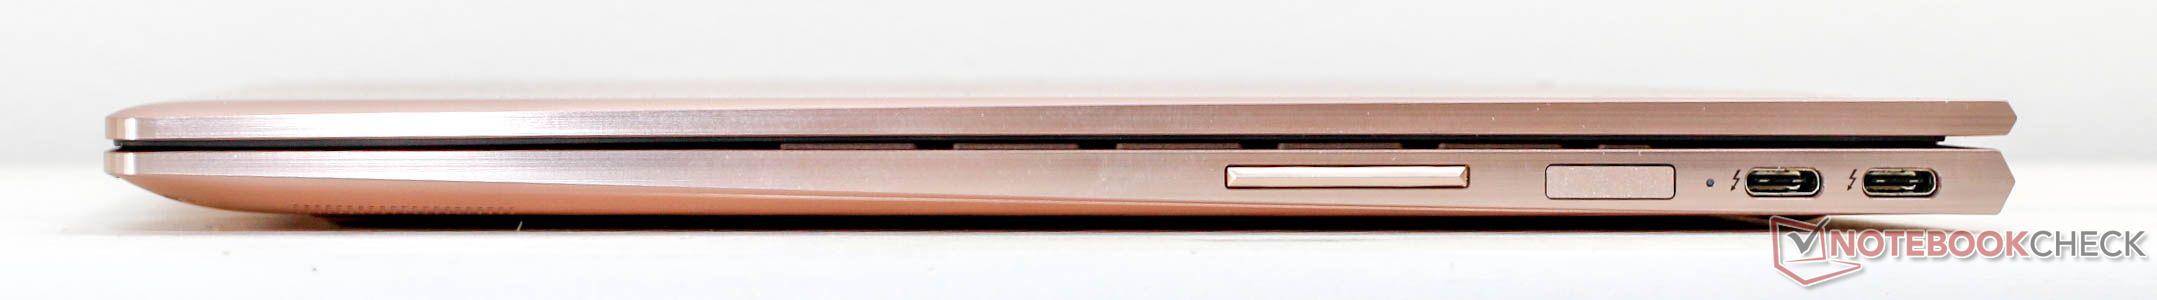
Se você achar o Spectre x360 muito caro, talvez o Acer Spin 5 de 13 polegadas (i7-8550U, 16 GB RAM, SSD de 512 GB) pode ser uma opção. Seu desempenho é comparável ao Spectre x360, mas não possui uma porta Thunderbolt 3.0. Ele também é 1 cm mais grosso e não pode realmente competir com o x360 em termos de design.
The price obviously depends on your choice of hardware, and the device can be configured according to your individual liking in HP’s web store. The base model starts at $999 and includes an i5-8250U CPU, 8 GB of RAM, and a 360 GB SSD (currently a free upgrade from the usual 256 GB SSD); a fully specced model (4K display, i7-8550U, 16 GB RAM, 1 TB SSD) will cost you almost $1,700.
If you find the Spectre x360 too expensive maybe the 13-inch Acer Spin 5 (i7-8550U, 16 GB RAM, 512 GB SSD) might be an option. Its performance is comparable to the Spectre x360 but it lacks a Thunderbolt 3.0 port. It is also 1 cm thicker and cannot really compete with the x360 in terms of design.
HP Spectre x360 13-ae048ng
-
03/01/2018 v6(old)
Daniel Puschina
Pricecompare
