 Deutsch
 English
 Español
 Français
 Italiano
 Nederlands
 Polski
 Português
 Русский
 Türkçe
 Svenska
 Chinese
 Magyar
Breve Análise do Portátil Lenovo ThinkPad E470 (HD-Display, HD 620)
Connectivity
| Networking | |
| iperf3 transmit AX12 | |
| Lenovo ThinkPad E470 | |
| Lenovo ThinkPad E470-20H2S00400 | |
| iperf3 receive AX12 | |
| Lenovo ThinkPad E470-20H2S00400 | |
| Lenovo ThinkPad E470 | |
| |||||||||||||||||||||||||
iluminação: 81 %
iluminação com acumulador: 215 cd/m²
Contraste: 360:1 (Preto: 0.58 cd/m²)
ΔE Color 8.12 | 0.5-29.43 Ø5
ΔE Greyscale 9.86 | 0.57-98 Ø5.3
58% sRGB (Argyll 1.6.3 3D)
37% AdobeRGB 1998 (Argyll 1.6.3 3D)
40.43% AdobeRGB 1998 (Argyll 2.2.0 3D)
58.3% sRGB (Argyll 2.2.0 3D)
39.13% Display P3 (Argyll 2.2.0 3D)
Gamma: 2.37
| Lenovo ThinkPad E470 NT140WHM-N41, , 1366x768, 14.00 | Lenovo ThinkPad E470-20H2S00400 N140HCA-EAB, , 1920x1080, 14.00 | HP ProBook 440 G4-Y8B51EA AUO1E3D, , 1920x1080, 14.00 | Acer TravelMate P249-M-5452 Chi Mei N140HGE-EAA, , 1920x1080, 14.00 | Dell Latitude 14 3470 Innolux N140BGE, , 1366x768, 14.00 | Lenovo ThinkPad T470-20HD002HGE N140HCA-EAB, , 1920x1080, 14.00 | |
|---|---|---|---|---|---|---|
| Display | 5% | -4% | -3% | 3% | 6% | |
| Display P3 Coverage | 39.13 | 41.23 5% | 37.6 -4% | 38.15 -3% | 40.21 3% | 41.6 6% |
| sRGB Coverage | 58.3 | 61.4 5% | 56.6 -3% | 56.7 -3% | 60.5 4% | 61.9 6% |
| AdobeRGB 1998 Coverage | 40.43 | 42.67 6% | 38.85 -4% | 39.48 -2% | 41.55 3% | 43.06 7% |
| Response Times | -55% | -36% | -30% | -47% | -69% | |
| Response Time Grey 50% / Grey 80% * | 44 ? | 40.8 ? 7% | 43.2 ? 2% | 44 ? -0% | 47 ? -7% | 41.6 ? 5% |
| Response Time Black / White * | 14 ? | 30.4 ? -117% | 24.4 ? -74% | 16 ? -14% | 26 ? -86% | 34 ? -143% |
| PWM Frequency | 200 ? | 50 ? -75% | ||||
| Screen | 24% | 4% | 13% | -4% | 41% | |
| Brightness middle | 209 | 244 17% | 216 3% | 249 19% | 206 -1% | 306 46% |
| Brightness | 208 | 231 11% | 203 -2% | 238 14% | 193 -7% | 287 38% |
| Brightness Distribution | 81 | 89 10% | 83 2% | 87 7% | 87 7% | 88 9% |
| Black Level * | 0.58 | 0.37 36% | 0.47 19% | 0.41 29% | 0.48 17% | 0.3 48% |
| Contrast | 360 | 659 83% | 460 28% | 607 69% | 429 19% | 1020 183% |
| Colorchecker dE 2000 * | 8.12 | 6.41 21% | 8.98 -11% | 9.09 -12% | 11 -35% | 6.2 24% |
| Colorchecker dE 2000 max. * | 15.18 | 13.4 12% | 14.07 7% | 14.64 4% | 19.57 -29% | 13.6 10% |
| Greyscale dE 2000 * | 9.86 | 5.94 40% | 9.61 3% | 9.92 -1% | 11.51 -17% | 5.8 41% |
| Gamma | 2.37 93% | 2.28 96% | 2.63 84% | 2.42 91% | 2.23 99% | 2.04 108% |
| CCT | 10218 64% | 6101 107% | 11265 58% | 11177 58% | 13671 48% | 6277 104% |
| Color Space (Percent of AdobeRGB 1998) | 37 | 39.3 6% | 35.9 -3% | 36.5 -1% | 38.46 4% | 39.62 7% |
| Color Space (Percent of sRGB) | 58 | 61.1 5% | 56.7 -2% | 56.7 -2% | 60.61 5% | 61.44 6% |
| Total Average (Program / Settings) | -9% /
10% | -12% /
-3% | -7% /
2% | -16% /
-8% | -7% /
20% |
* ... smaller is better
Display Response Times
| ↔ Response Time Black to White | ||
|---|---|---|
| 14 ms ... rise ↗ and fall ↘ combined | ↗ 8 ms rise | 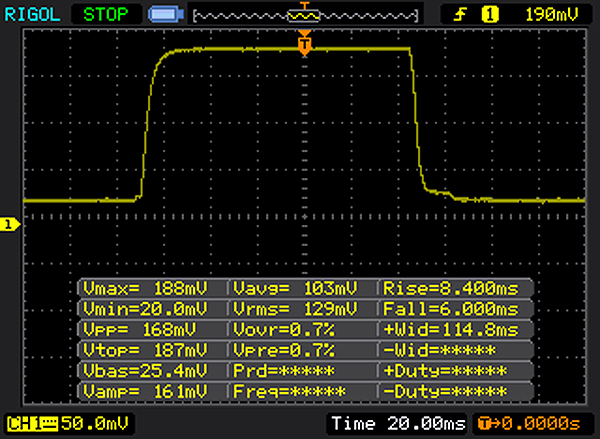 |
| ↘ 6 ms fall | ||
| The screen shows good response rates in our tests, but may be too slow for competitive gamers. In comparison, all tested devices range from 0.1 (minimum) to 240 (maximum) ms. » 29 % of all devices are better. This means that the measured response time is better than the average of all tested devices (21.5 ms). | ||
| ↔ Response Time 50% Grey to 80% Grey | ||
| 44 ms ... rise ↗ and fall ↘ combined | ↗ 22 ms rise | 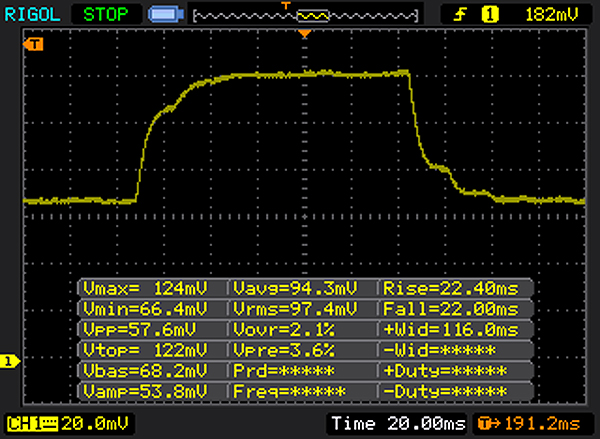 |
| ↘ 22 ms fall | ||
| The screen shows slow response rates in our tests and will be unsatisfactory for gamers. In comparison, all tested devices range from 0.2 (minimum) to 636 (maximum) ms. » 69 % of all devices are better. This means that the measured response time is worse than the average of all tested devices (33.8 ms). | ||
Screen Flickering / PWM (Pulse-Width Modulation)
| Screen flickering / PWM detected | 200 Hz | ≤ 90 % brightness setting | 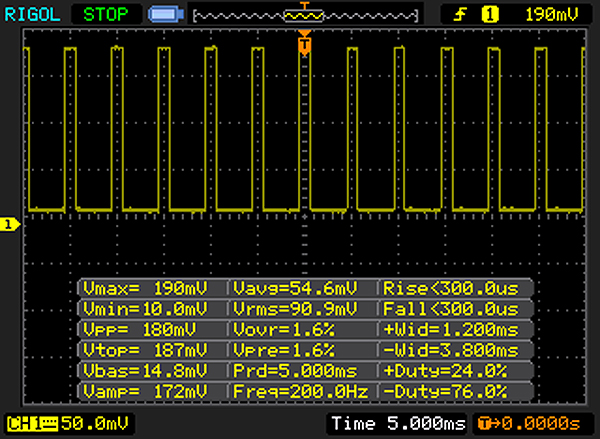 |
The display backlight flickers at 200 Hz (worst case, e.g., utilizing PWM) Flickering detected at a brightness setting of 90 % and below. There should be no flickering or PWM above this brightness setting. The frequency of 200 Hz is relatively low, so sensitive users will likely notice flickering and experience eyestrain at the stated brightness setting and below. In comparison: 53 % of all tested devices do not use PWM to dim the display. If PWM was detected, an average of 17942 (minimum: 5 - maximum: 3846000) Hz was measured. | |||
| PCMark 8 Home Score Accelerated v2 | 3674 pontos | |
| PCMark 8 Work Score Accelerated v2 | 4834 pontos | |
| PCMark 10 Score | 3144 pontos | |
Ajuda | ||
| Lenovo ThinkPad E470 SanDisk X400 SED 256GB, SATA (SD8TB8U-256G) | Lenovo ThinkPad E470-20H2S00400 SanDisk X400 SED 256GB, SATA (SD8TB8U-256G) | HP ProBook 440 G4-Y8B51EA SanDisk SD8SNAT256G1002 | Acer TravelMate P249-M-5452 SK Hynix HFS256G39TND-N210A | Dell Latitude 14 3470 Toshiba MQ01ACF050 | Lenovo ThinkPad T470-20HD002HGE Samsung PM961 NVMe MZVLW512HMJP | |
|---|---|---|---|---|---|---|
| CrystalDiskMark 3.0 | -0% | -14% | 7% | -92% | 117% | |
| Read Seq | 454.2 | 476.5 5% | 491.2 8% | 510 12% | 108.9 -76% | 1155 154% |
| Write Seq | 438.1 | 458.7 5% | 322.2 -26% | 267.2 -39% | 103.2 -76% | 1076 146% |
| Read 512 | 304.6 | 346.4 14% | 310.1 2% | 347.6 14% | 811 166% | |
| Write 512 | 343.7 | 291.1 -15% | 276 -20% | 267.5 -22% | 862 151% | |
| Read 4k | 34.15 | 35.15 3% | 19.57 -43% | 33.12 -3% | 0.362 -99% | 55.5 63% |
| Write 4k | 75.1 | 78.8 5% | 77.8 4% | 95.9 28% | 0.946 -99% | 134.6 79% |
| Read 4k QD32 | 284.2 | 276 -3% | 146.3 -49% | 392.8 38% | 0.721 -100% | 496.2 75% |
| Write 4k QD32 | 208.8 | 178.3 -15% | 241.4 16% | 266.4 28% | 0.901 -100% | 425.4 104% |

| 3DMark 11 - 1280x720 Performance GPU | |
| Lenovo ThinkPad E470-20H2S00400 | |
| HP ProBook 440 G4-Y8B51EA | |
| Lenovo ThinkPad T470-20HD002HGE | |
| Lenovo ThinkPad E470 | |
| Acer TravelMate P249-M-5452 | |
| Dell Latitude 14 3470 | |
| 3DMark 11 Performance | 1522 pontos | |
| 3DMark Cloud Gate Standard Score | 5502 pontos | |
| 3DMark Fire Strike Score | 789 pontos | |
Ajuda | ||
| baixo | média | alto | ultra | |
| BioShock Infinite (2013) | 39.74 | 23 () | 19 () | |
| Company of Heroes 2 (2013) | 21.28 | |||
| Rise of the Tomb Raider (2016) | 15.7 |
Barulho
| Ocioso |
| 30.5 / 30.5 / 30.5 dB |
| Carga |
| 32.9 / 32.9 dB |
 | ||
30 dB silencioso 40 dB(A) audível 50 dB(A) ruidosamente alto |
||
min: | ||
(+) The maximum temperature on the upper side is 35.6 °C / 96 F, compared to the average of 34.2 °C / 94 F, ranging from 21.2 to 62.5 °C for the class Office.
(+) The bottom heats up to a maximum of 37.2 °C / 99 F, compared to the average of 36.7 °C / 98 F
(+) In idle usage, the average temperature for the upper side is 22.7 °C / 73 F, compared to the device average of 29.5 °C / 85 F.
(+) The palmrests and touchpad are cooler than skin temperature with a maximum of 26.7 °C / 80.1 F and are therefore cool to the touch.
(±) The average temperature of the palmrest area of similar devices was 27.7 °C / 81.9 F (+1 °C / 1.8 F).
Lenovo ThinkPad E470 audio analysis
(+) | speakers can play relatively loud (82.4 dB)
Bass 100 - 315 Hz
(-) | nearly no bass - on average 17.5% lower than median
(±) | linearity of bass is average (11.7% delta to prev. frequency)
Mids 400 - 2000 Hz
(±) | higher mids - on average 10.6% higher than median
(±) | linearity of mids is average (14% delta to prev. frequency)
Highs 2 - 16 kHz
(+) | balanced highs - only 4.5% away from median
(±) | linearity of highs is average (11.2% delta to prev. frequency)
Overall 100 - 16.000 Hz
(±) | linearity of overall sound is average (25.8% difference to median)
Compared to same class
» 76% of all tested devices in this class were better, 7% similar, 16% worse
» The best had a delta of 7%, average was 22%, worst was 53%
Compared to all devices tested
» 76% of all tested devices were better, 5% similar, 19% worse
» The best had a delta of 4%, average was 25%, worst was 134%
Lenovo ThinkPad T470-20HD002HGE audio analysis
(±) | speaker loudness is average but good (80.4 dB)
Bass 100 - 315 Hz
(-) | nearly no bass - on average 16.6% lower than median
(±) | linearity of bass is average (8.8% delta to prev. frequency)
Mids 400 - 2000 Hz
(+) | balanced mids - only 4.3% away from median
(+) | mids are linear (6.7% delta to prev. frequency)
Highs 2 - 16 kHz
(±) | higher highs - on average 5.4% higher than median
(±) | linearity of highs is average (13.3% delta to prev. frequency)
Overall 100 - 16.000 Hz
(±) | linearity of overall sound is average (18.7% difference to median)
Compared to same class
» 29% of all tested devices in this class were better, 6% similar, 65% worse
» The best had a delta of 7%, average was 22%, worst was 53%
Compared to all devices tested
» 37% of all tested devices were better, 8% similar, 55% worse
» The best had a delta of 4%, average was 25%, worst was 134%
| desligado | |
| Ocioso | |
| Carga |
|
| Lenovo ThinkPad E470 i5-7200U, HD Graphics 620, SanDisk X400 SED 256GB, SATA (SD8TB8U-256G), TN LED, 1366x768, 14.00 | Lenovo ThinkPad E470-20H2S00400 i5-7200U, GeForce 940MX, SanDisk X400 SED 256GB, SATA (SD8TB8U-256G), IPS, 1920x1080, 14.00 | HP ProBook 440 G4-Y8B51EA i7-7500U, GeForce 930MX, SanDisk SD8SNAT256G1002, TN, 1920x1080, 14.00 | Acer TravelMate P249-M-5452 6200U, HD Graphics 520, SK Hynix HFS256G39TND-N210A, TN LED, 1920x1080, 14.00 | Dell Latitude 14 3470 6100U, HD Graphics 520, Toshiba MQ01ACF050, TN LED, 1366x768, 14.00 | Lenovo ThinkPad T470-20HD002HGE i5-7200U, HD Graphics 620, Samsung PM961 NVMe MZVLW512HMJP, IPS, 1920x1080, 14.00 | |
|---|---|---|---|---|---|---|
| Power Consumption | -11% | -4% | 8% | 7% | 16% | |
| Idle Minimum * | 5.2 | 2.7 48% | 3 42% | 3.8 27% | 5 4% | 3.21 38% |
| Idle Average * | 7.6 | 5.5 28% | 5.4 29% | 7.6 -0% | 6.8 11% | 6.15 19% |
| Idle Maximum * | 9.9 | 6.5 34% | 6.3 36% | 8 19% | 8.9 10% | 6.82 31% |
| Load Average * | 31 | 44.2 -43% | 37.5 -21% | 30.5 2% | 26.2 15% | 28.5 8% |
| Load Maximum * | 29.7 | 65.2 -120% | 61.1 -106% | 32.5 -9% | 31.8 -7% | 34.5 -16% |
* ... smaller is better
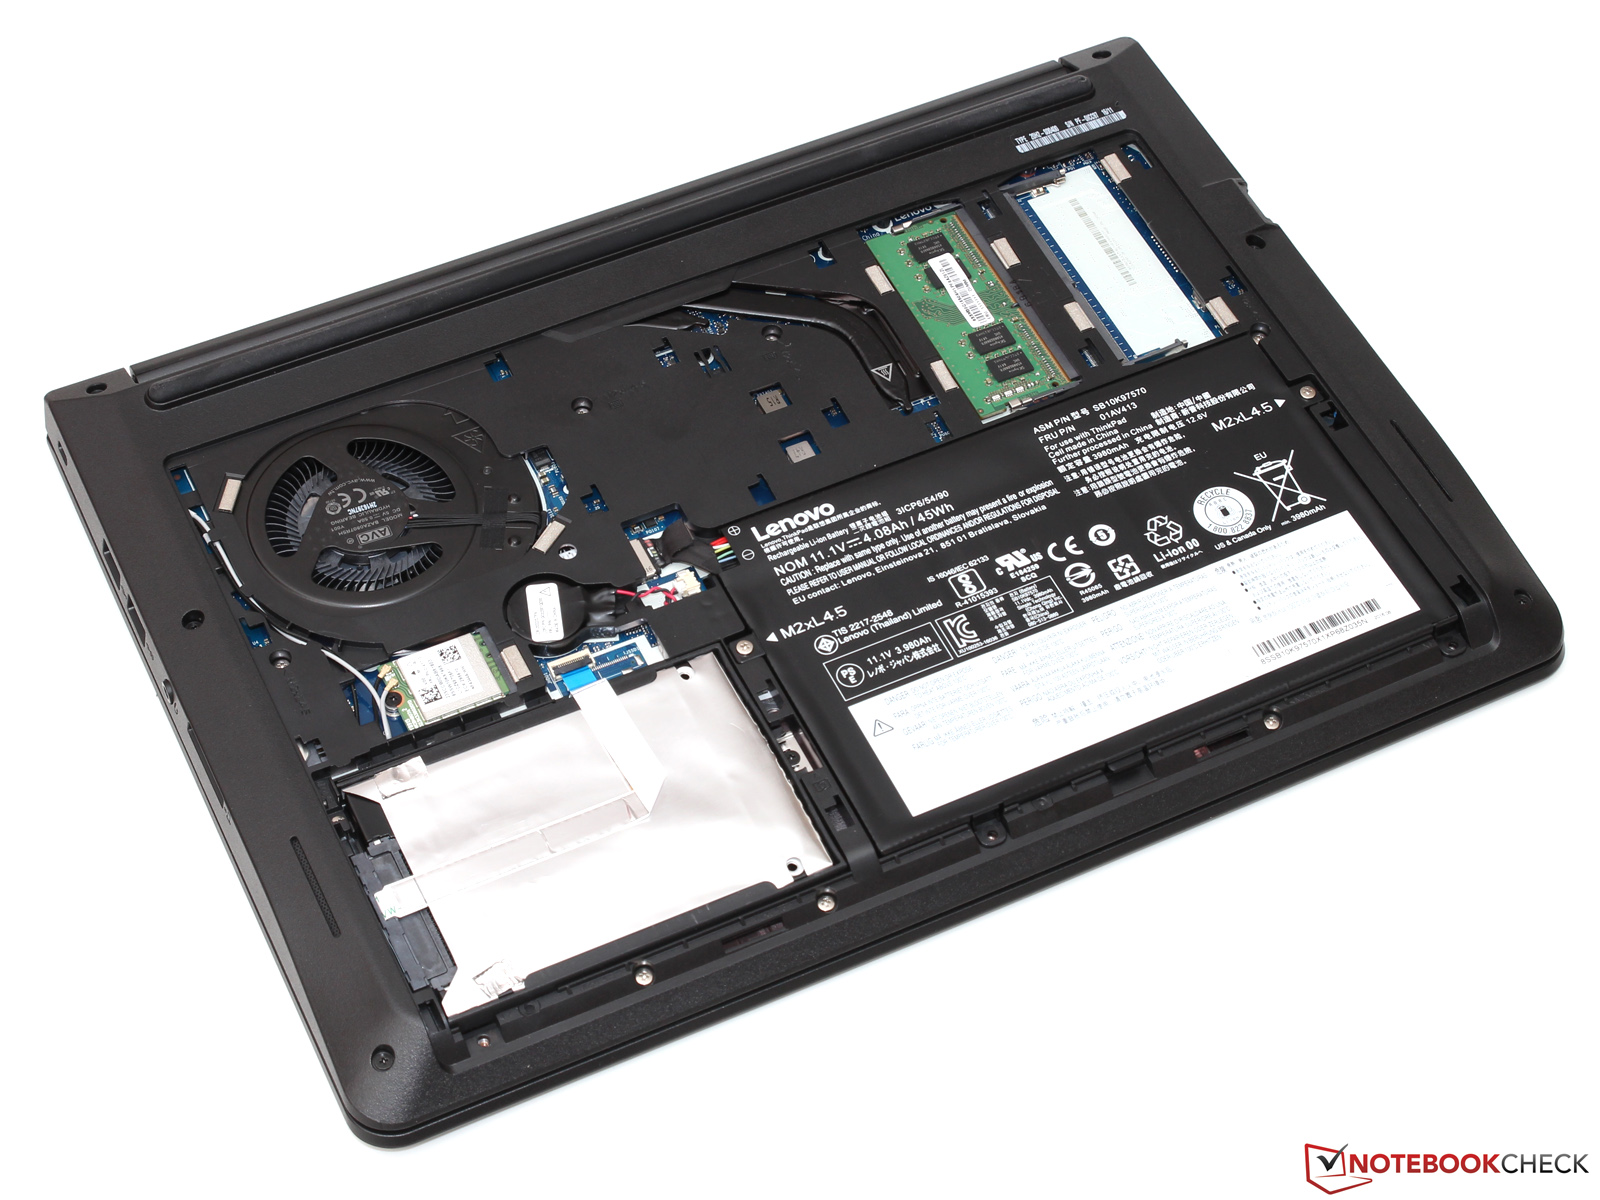
| Lenovo ThinkPad E470 i5-7200U, HD Graphics 620, 45 Wh | Lenovo ThinkPad E470-20H2S00400 i5-7200U, GeForce 940MX, 45 Wh | HP ProBook 440 G4-Y8B51EA i7-7500U, GeForce 930MX, 48 Wh | Acer TravelMate P249-M-5452 6200U, HD Graphics 520, 41 Wh | Dell Latitude 14 3470 6100U, HD Graphics 520, 41 Wh | Lenovo ThinkPad T470-20HD002HGE i5-7200U, HD Graphics 620, 48 Wh | |
|---|---|---|---|---|---|---|
| Battery Runtime | -9% | 6% | -26% | -19% | 1% | |
| Reader / Idle | 1112 | 1043 -6% | 1083 -3% | 791 -29% | 668 -40% | |
| H.264 | 546 | 503 -8% | 571 5% | 361 -34% | 623 14% | |
| WiFi v1.3 | 480 | 326 -32% | 414 -14% | 400 -17% | 278 -42% | 438 -9% |
| Load | 111 | 124 12% | 151 36% | 87 -22% | 140 26% | 110 -1% |
Pro
Contra
A conclusão é que o E470 é um portátil empresarial acessível, mas não podemos recomendar esta configuração particular que analisamos hoje.
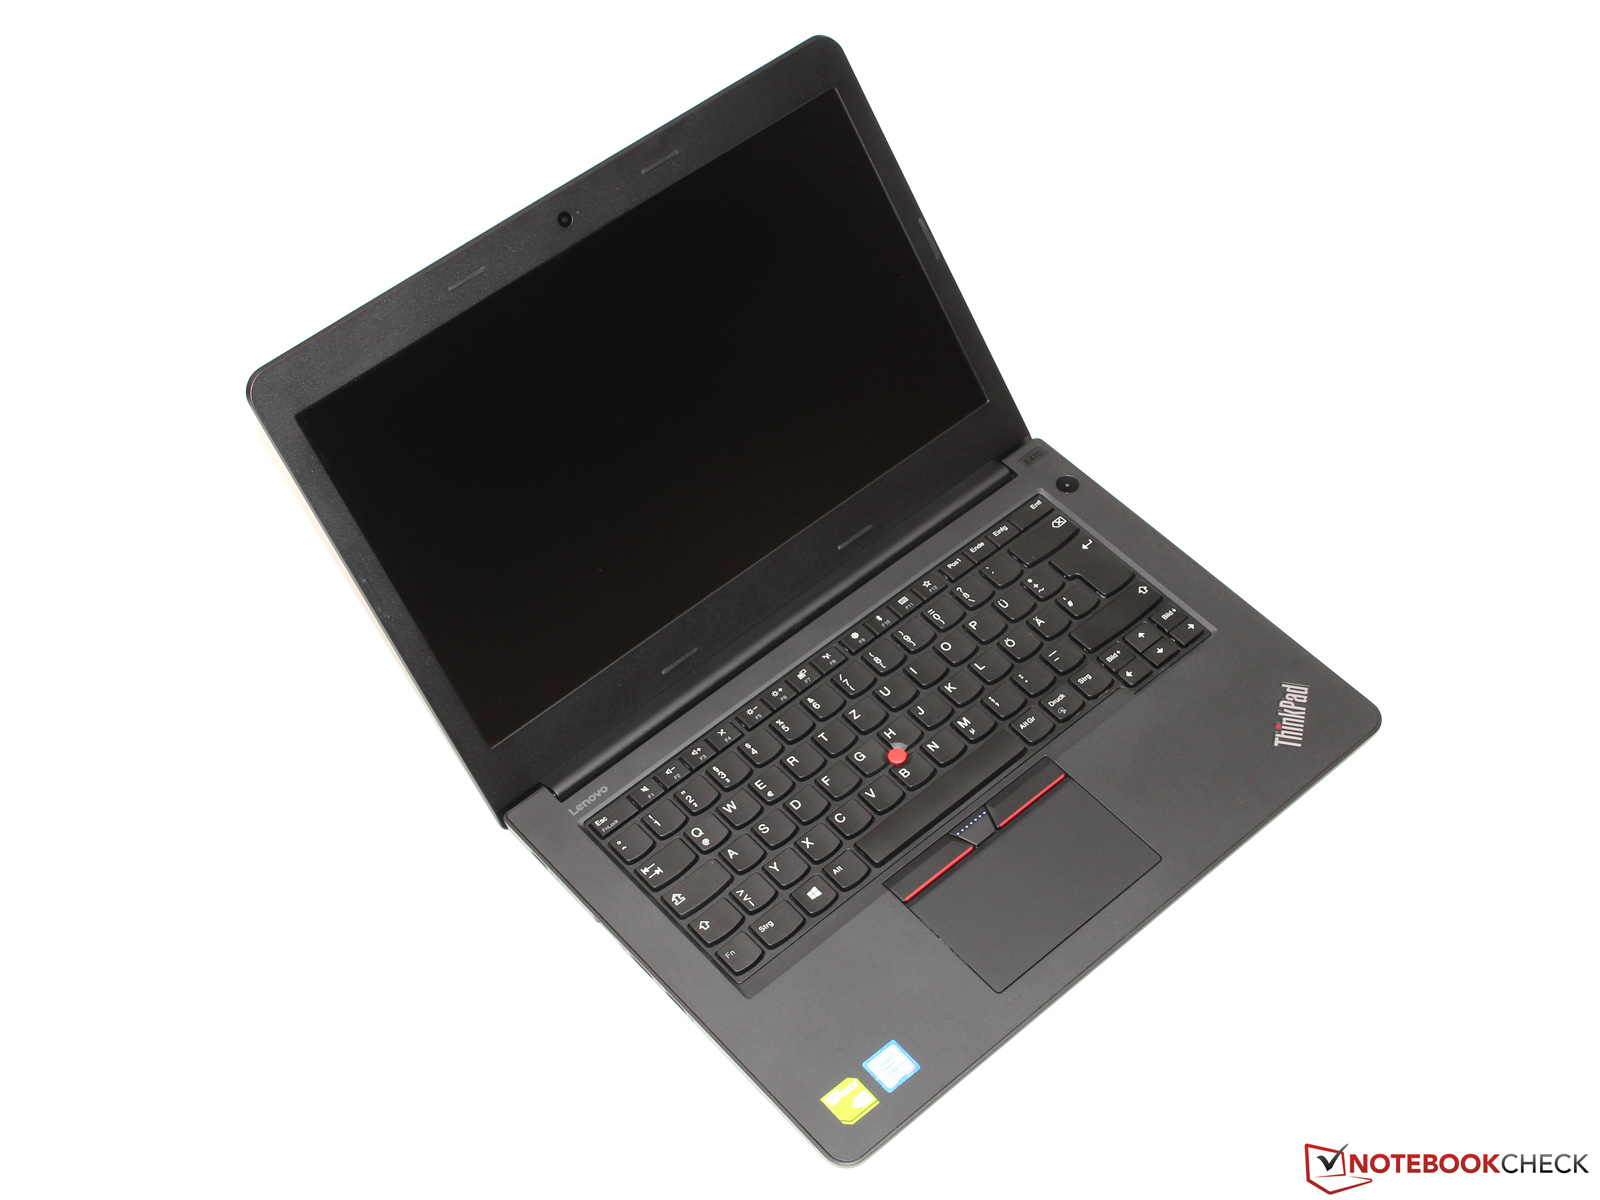
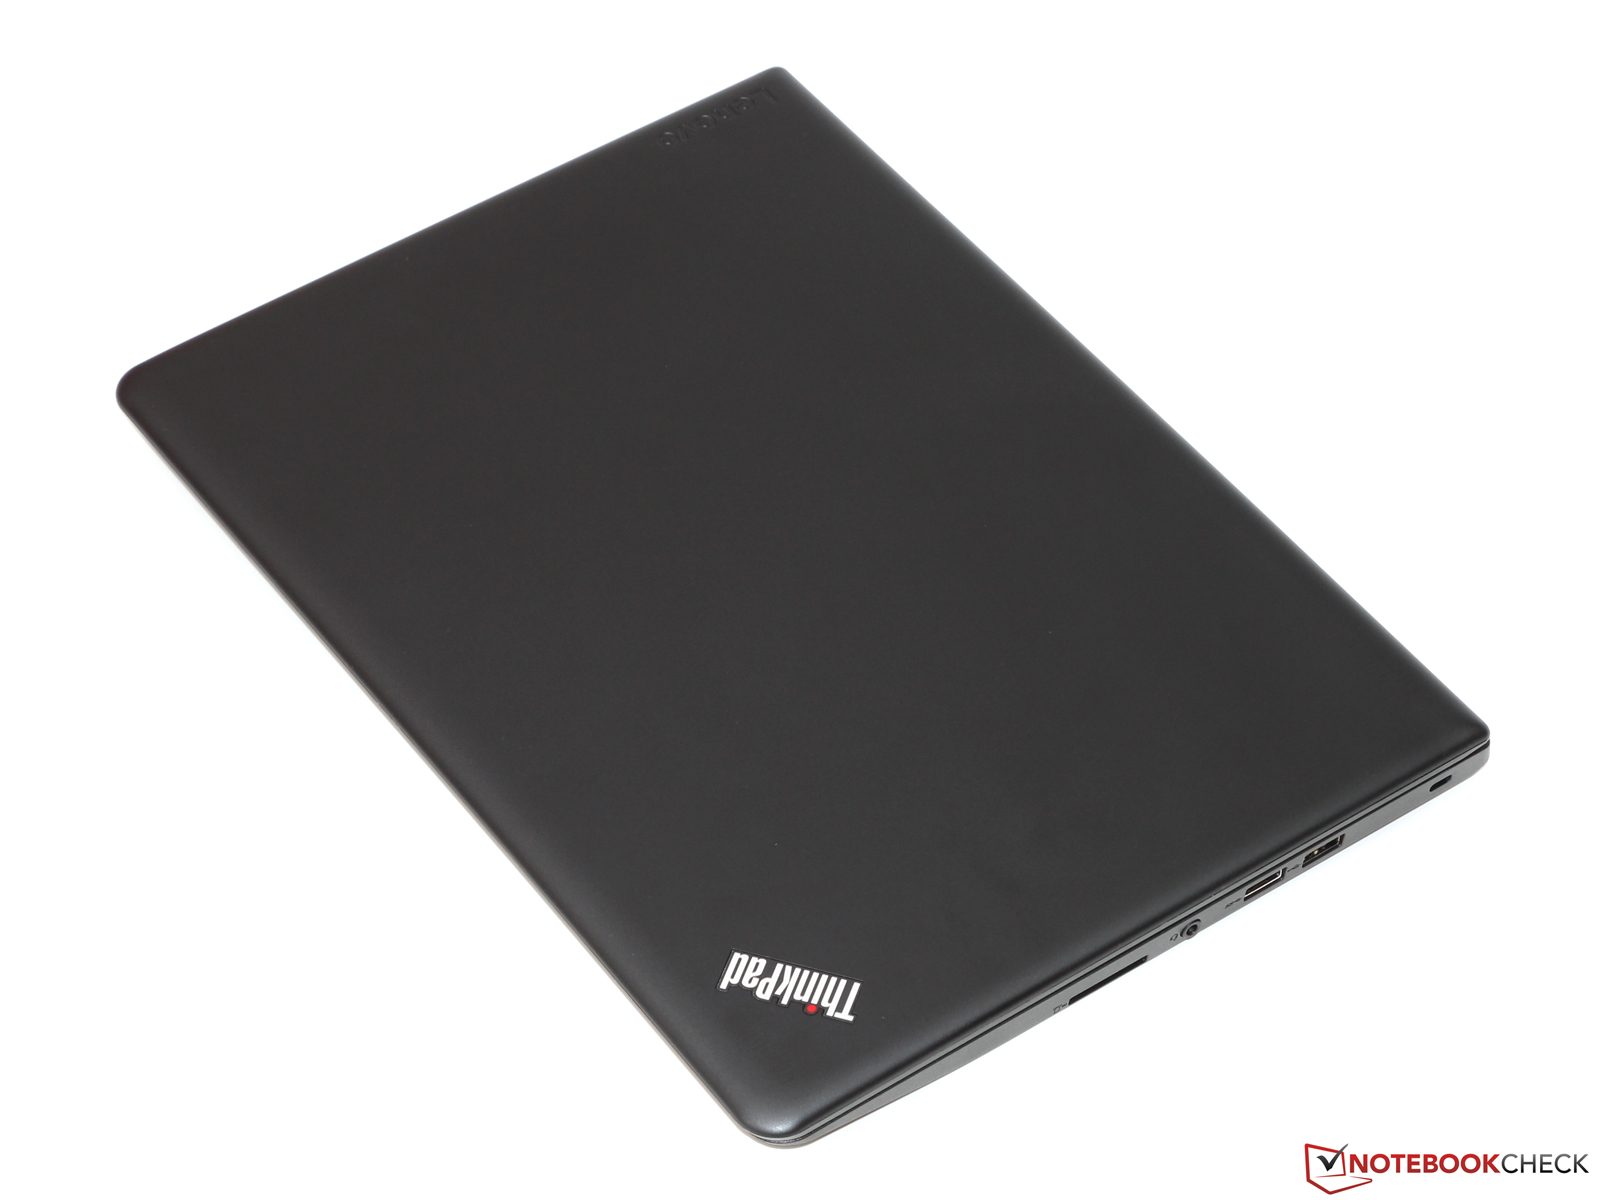
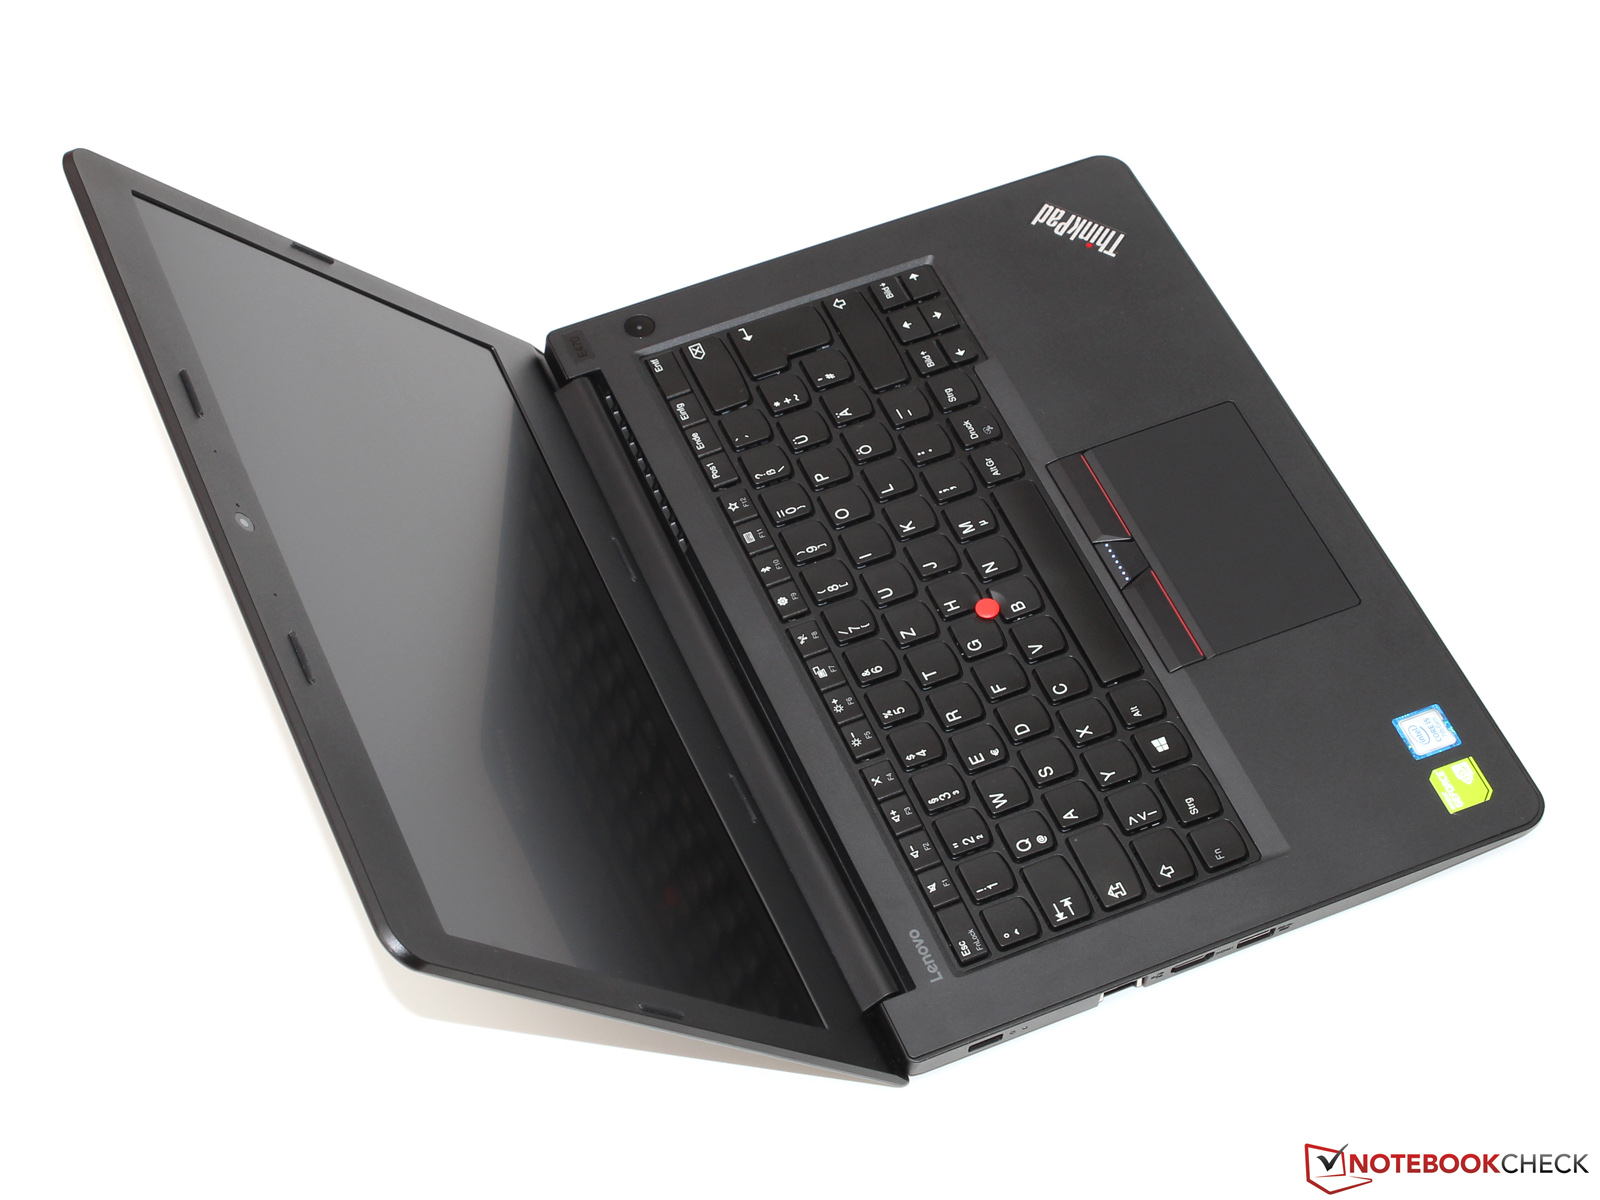
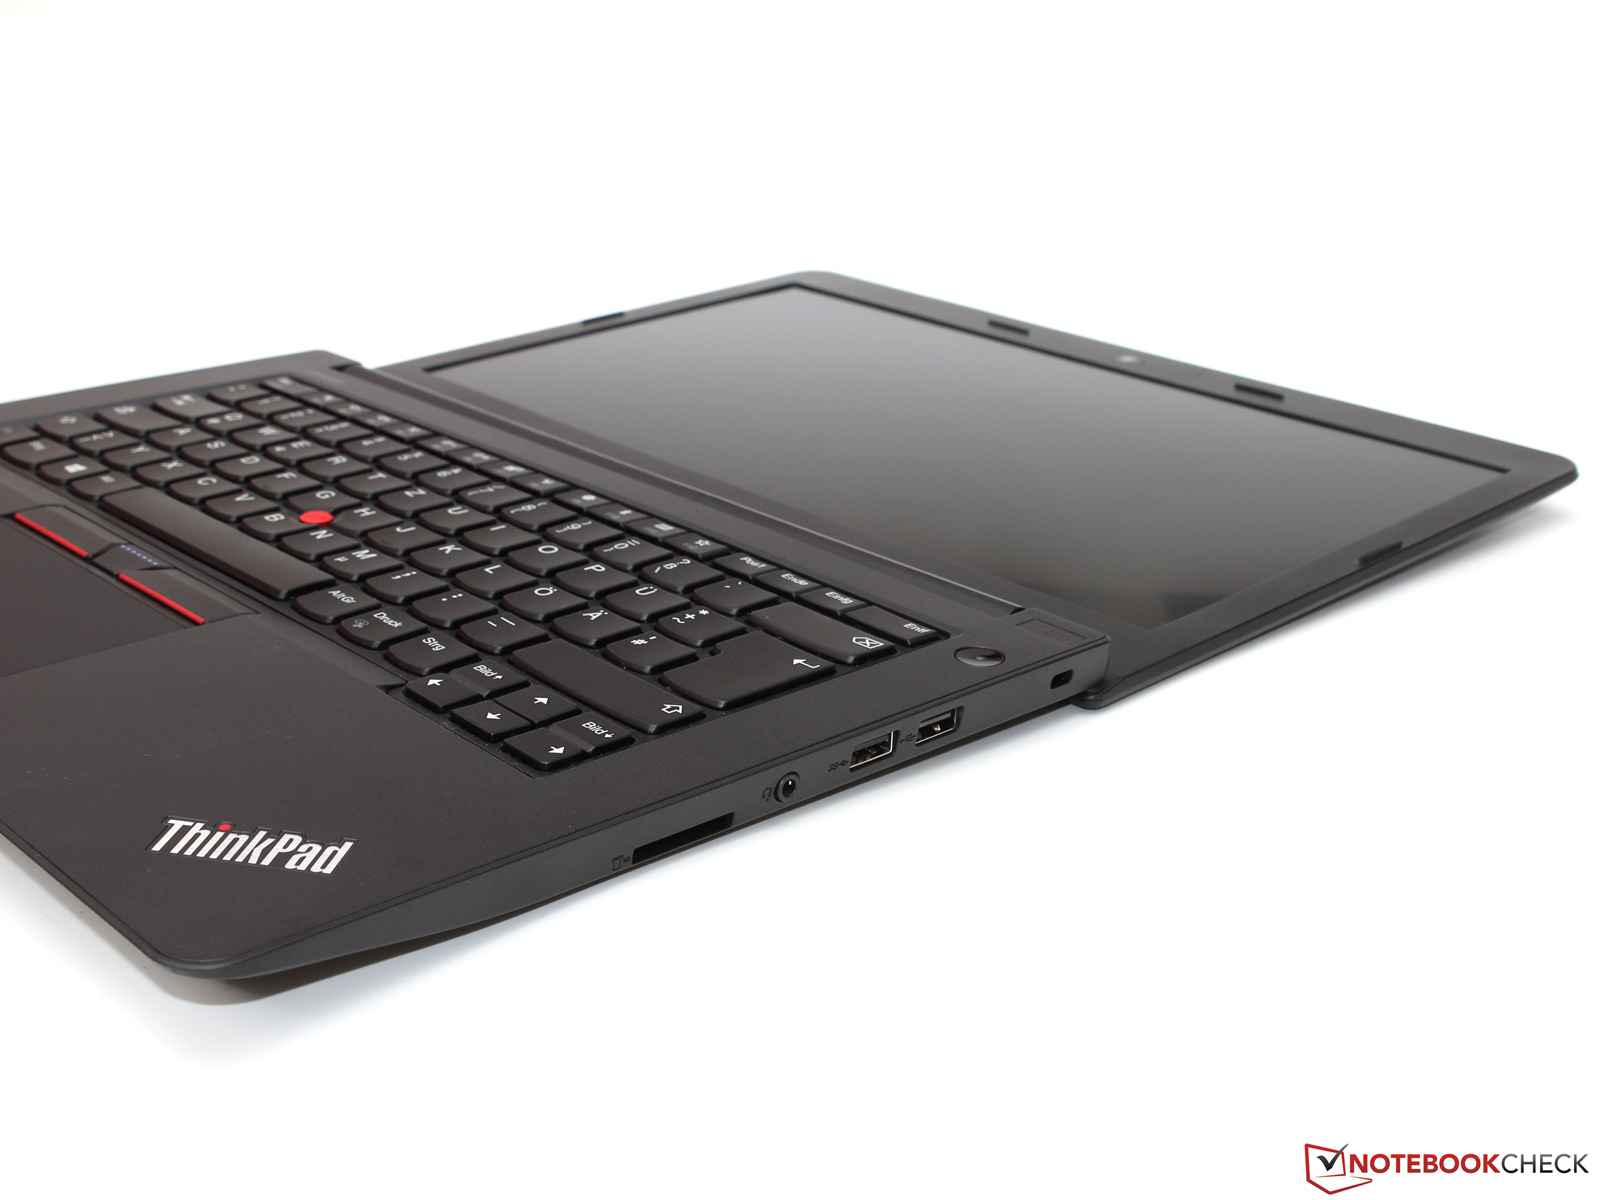
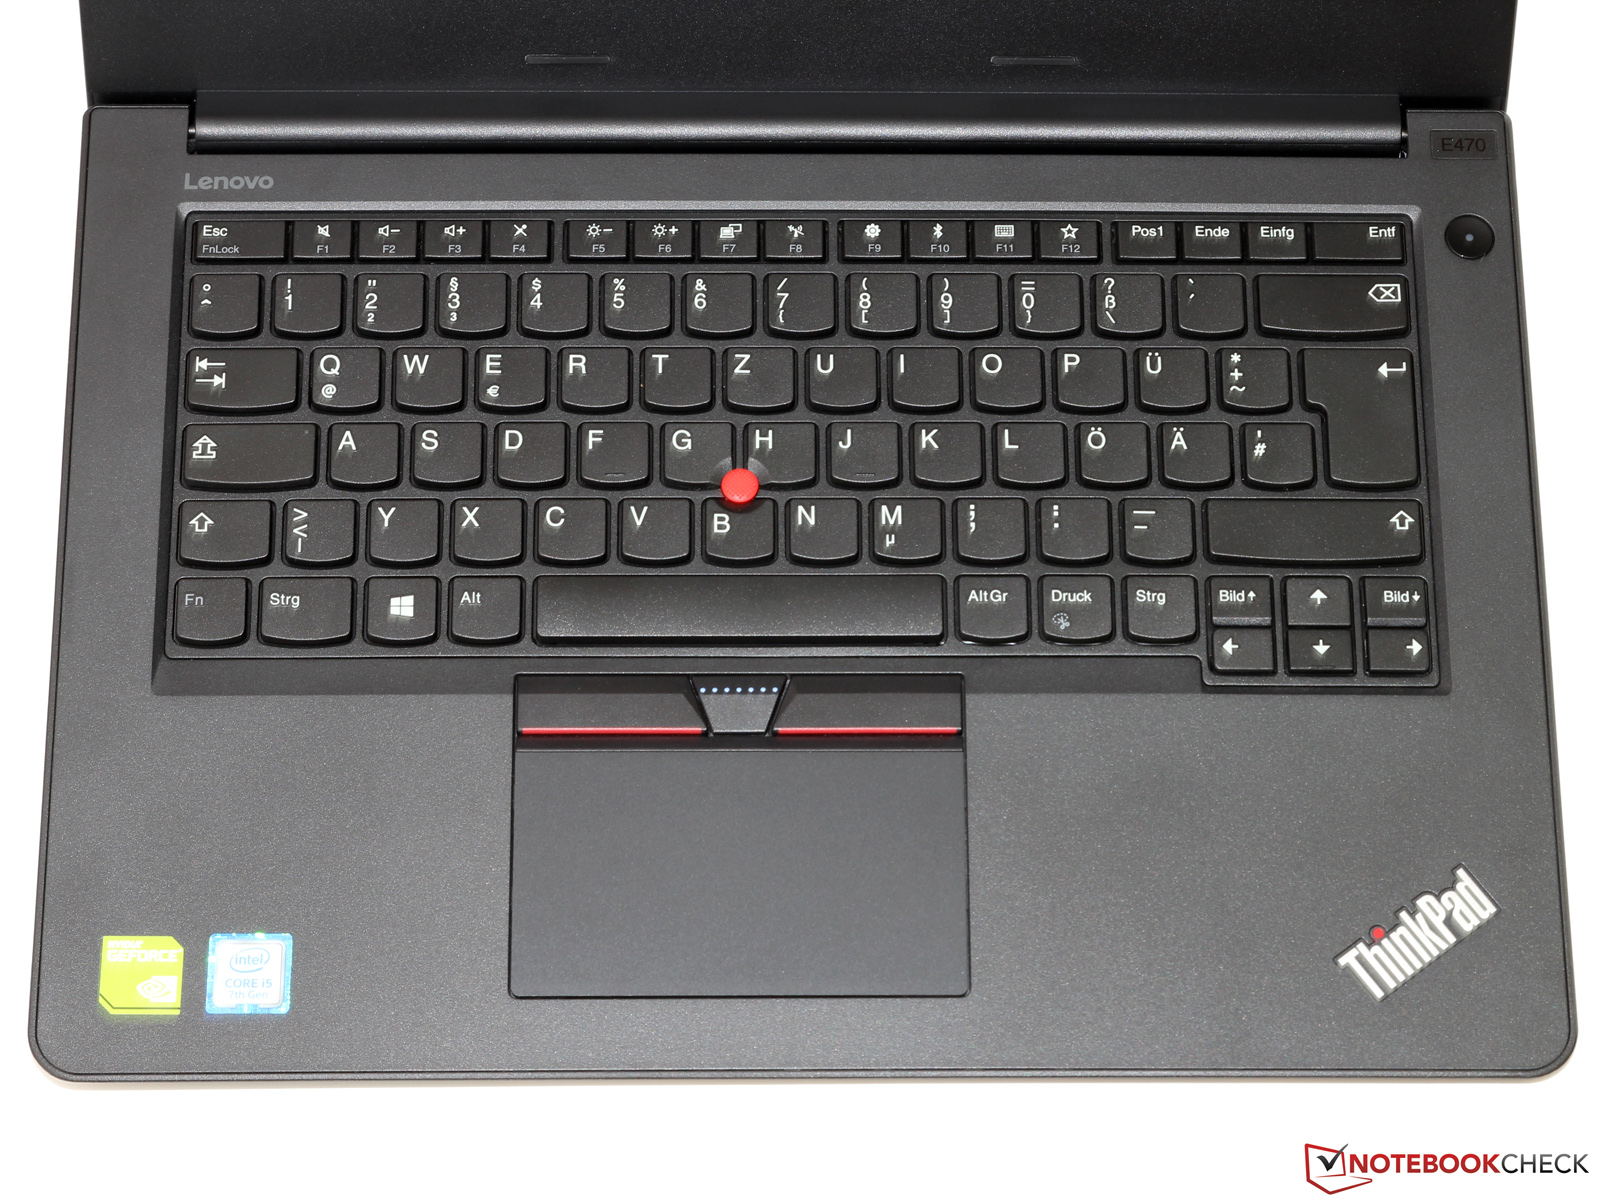
Ele compartilha muitas das suas vantagens com o outro E470: dispositivos de entrada confortáveis e decentes com os quase lendários teclado ThinkPad e trackpad; uma carcaça sólida e bem construída que, embora não seja a mais bonita, faz o trabalho é muito bem; um modem Wi-Fi rápido; e um desempenho de aplicativos sólido - tudo o que você pode esperar do E470. Os únicos dois aspectos em que a unidade de teste de hoje é melhor que o outro Lenovo ThinkPad E470 (Core i5, GeForce 940MX) equipado com a 940MXhttps://www.notebookcheck.net/Lenovo-ThinkPad-E470-Core-i5-GeForce-940MX-Notebook-Review.189999.0.html são o sistema de resfriamento e a duração da bateria. A falta da GPU Nvidia torna o portátil muito mais frio e mais silencioso, e a baixa resolução de tela resulta em uma duração melhorada.
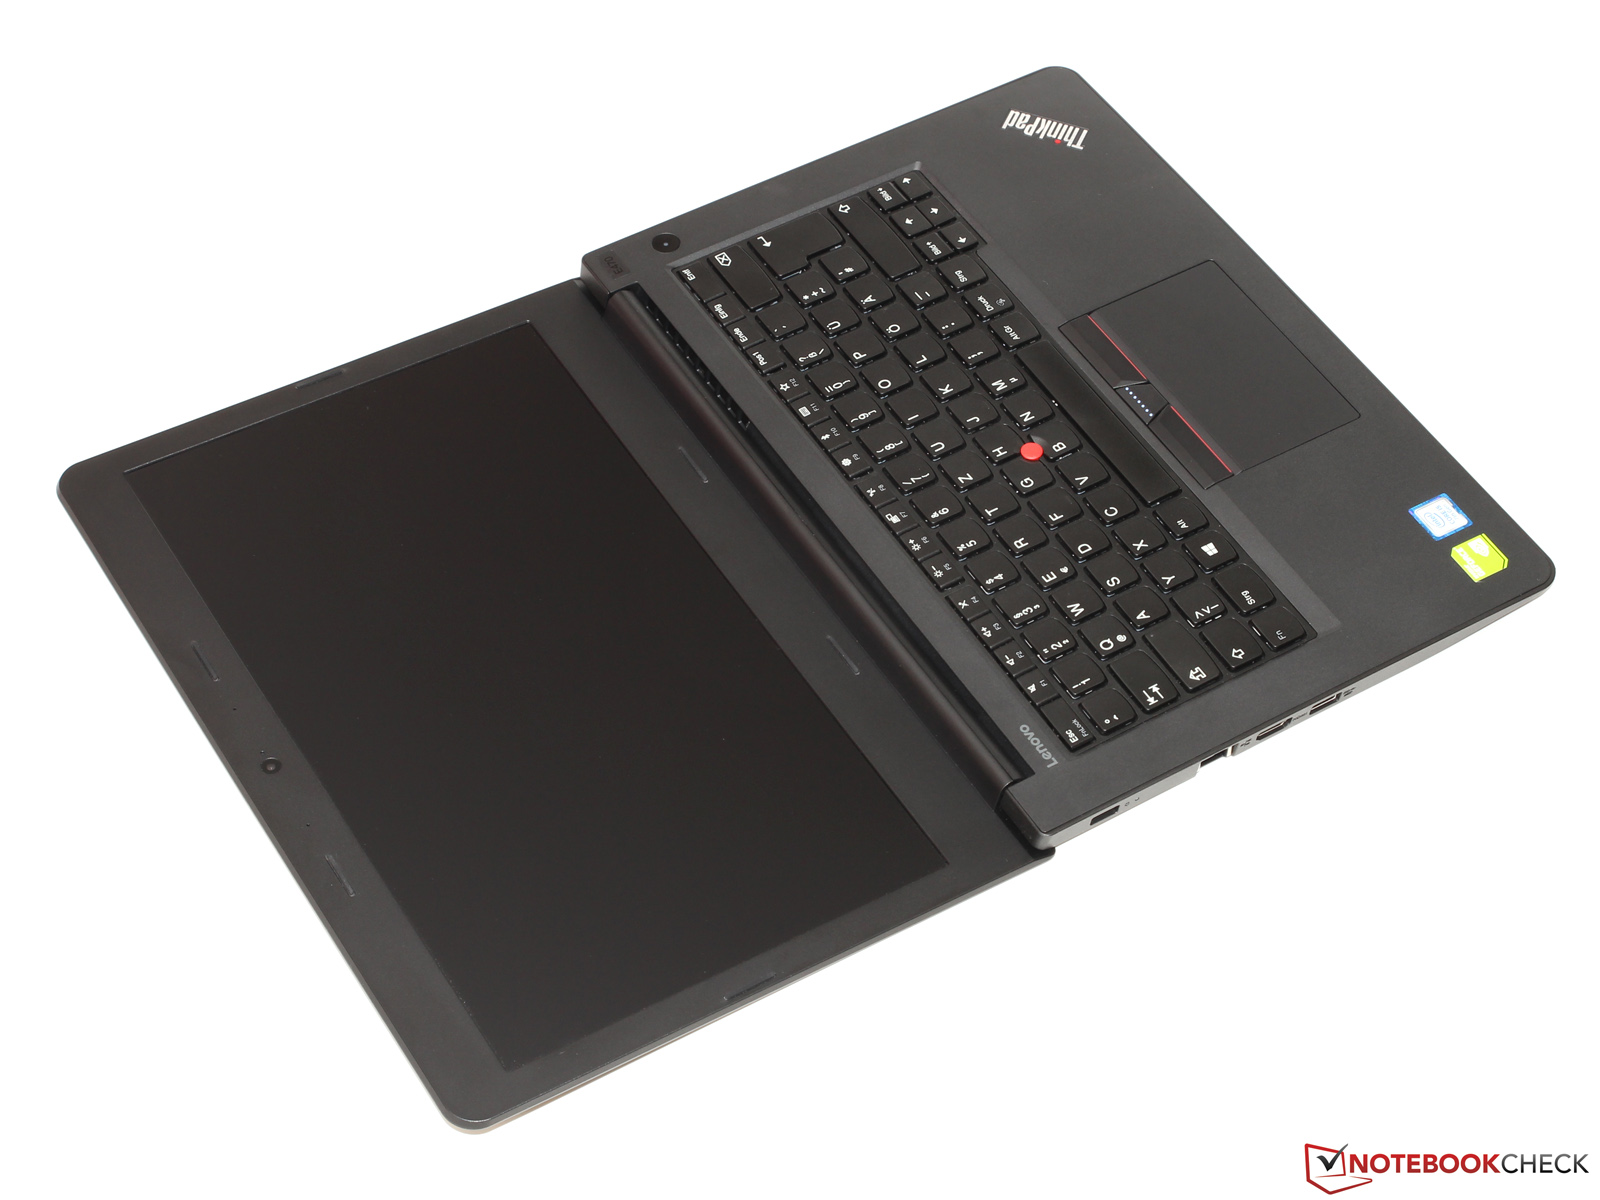
Isso é, no entanto, a única vantagem da tela HD. De outra maneira, a tela é péssima: muito alto nível de preto, ângulos de visão muito estreitos e cobertura de espaço de cores não digna de seu nome. Além disso, ele também usa PWM para modulação do brilho com uma frequência muito baixa.
Não podemos recomendar o modelo E470 específico em análise devido à sua configuração desequilibrada e sua péssima tela. Se estiver interessado no E470, certifique-se de optar pela tela IPS.
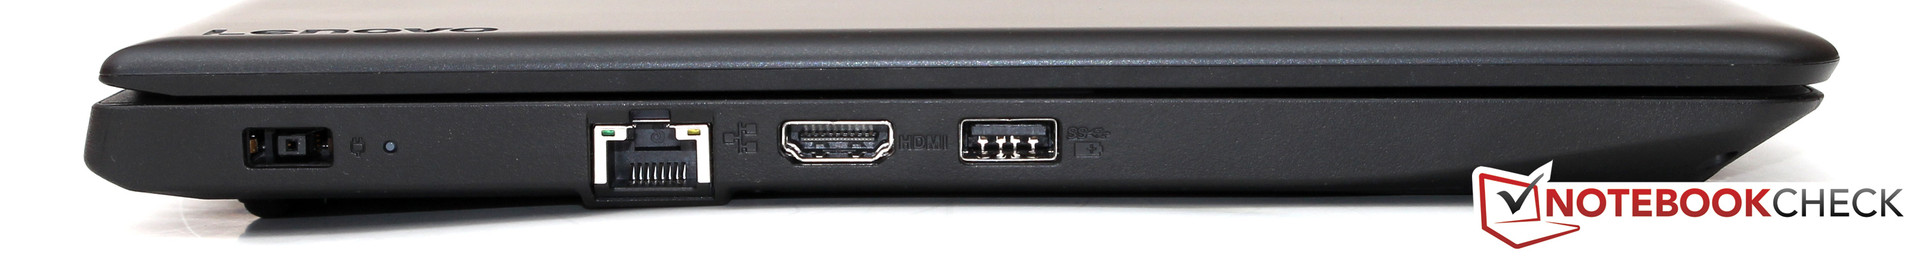
Isso é suficiente para negar uma recomendação para o E470. Quase $800 é simplesmente demais para um portátil com uma tela tão pobre quanto esta. Se estiver interessado no E470, certifique-se de optar pela tela IPS FHD. De qualquer forma, o E470 está longe de ser perfeito. Por exemplo, sentimos falta de uma porta USB-C e a garantia limitada padrão da Lenovo de apenas 12 meses, estão no lado fraco. Podemos viver com essas desvantagens, dado o baixo preço do portátil, mas a tela é um ponto negativo. Além disso, o aparelho foi incapaz de entregar o seu desempenho máximo com a bateria, razão pela qual a pontuação final teve que ser reduzida em conformidade.
Lenovo ThinkPad E470
-
10/12/2017 v6(old)
Benjamin Herzig
Pricecompare
