 Deutsch
 English
 Español
 Français
 Italiano
 Nederlands
 Polski
 Português
 Русский
 Türkçe
 Svenska
 Chinese
 Magyar
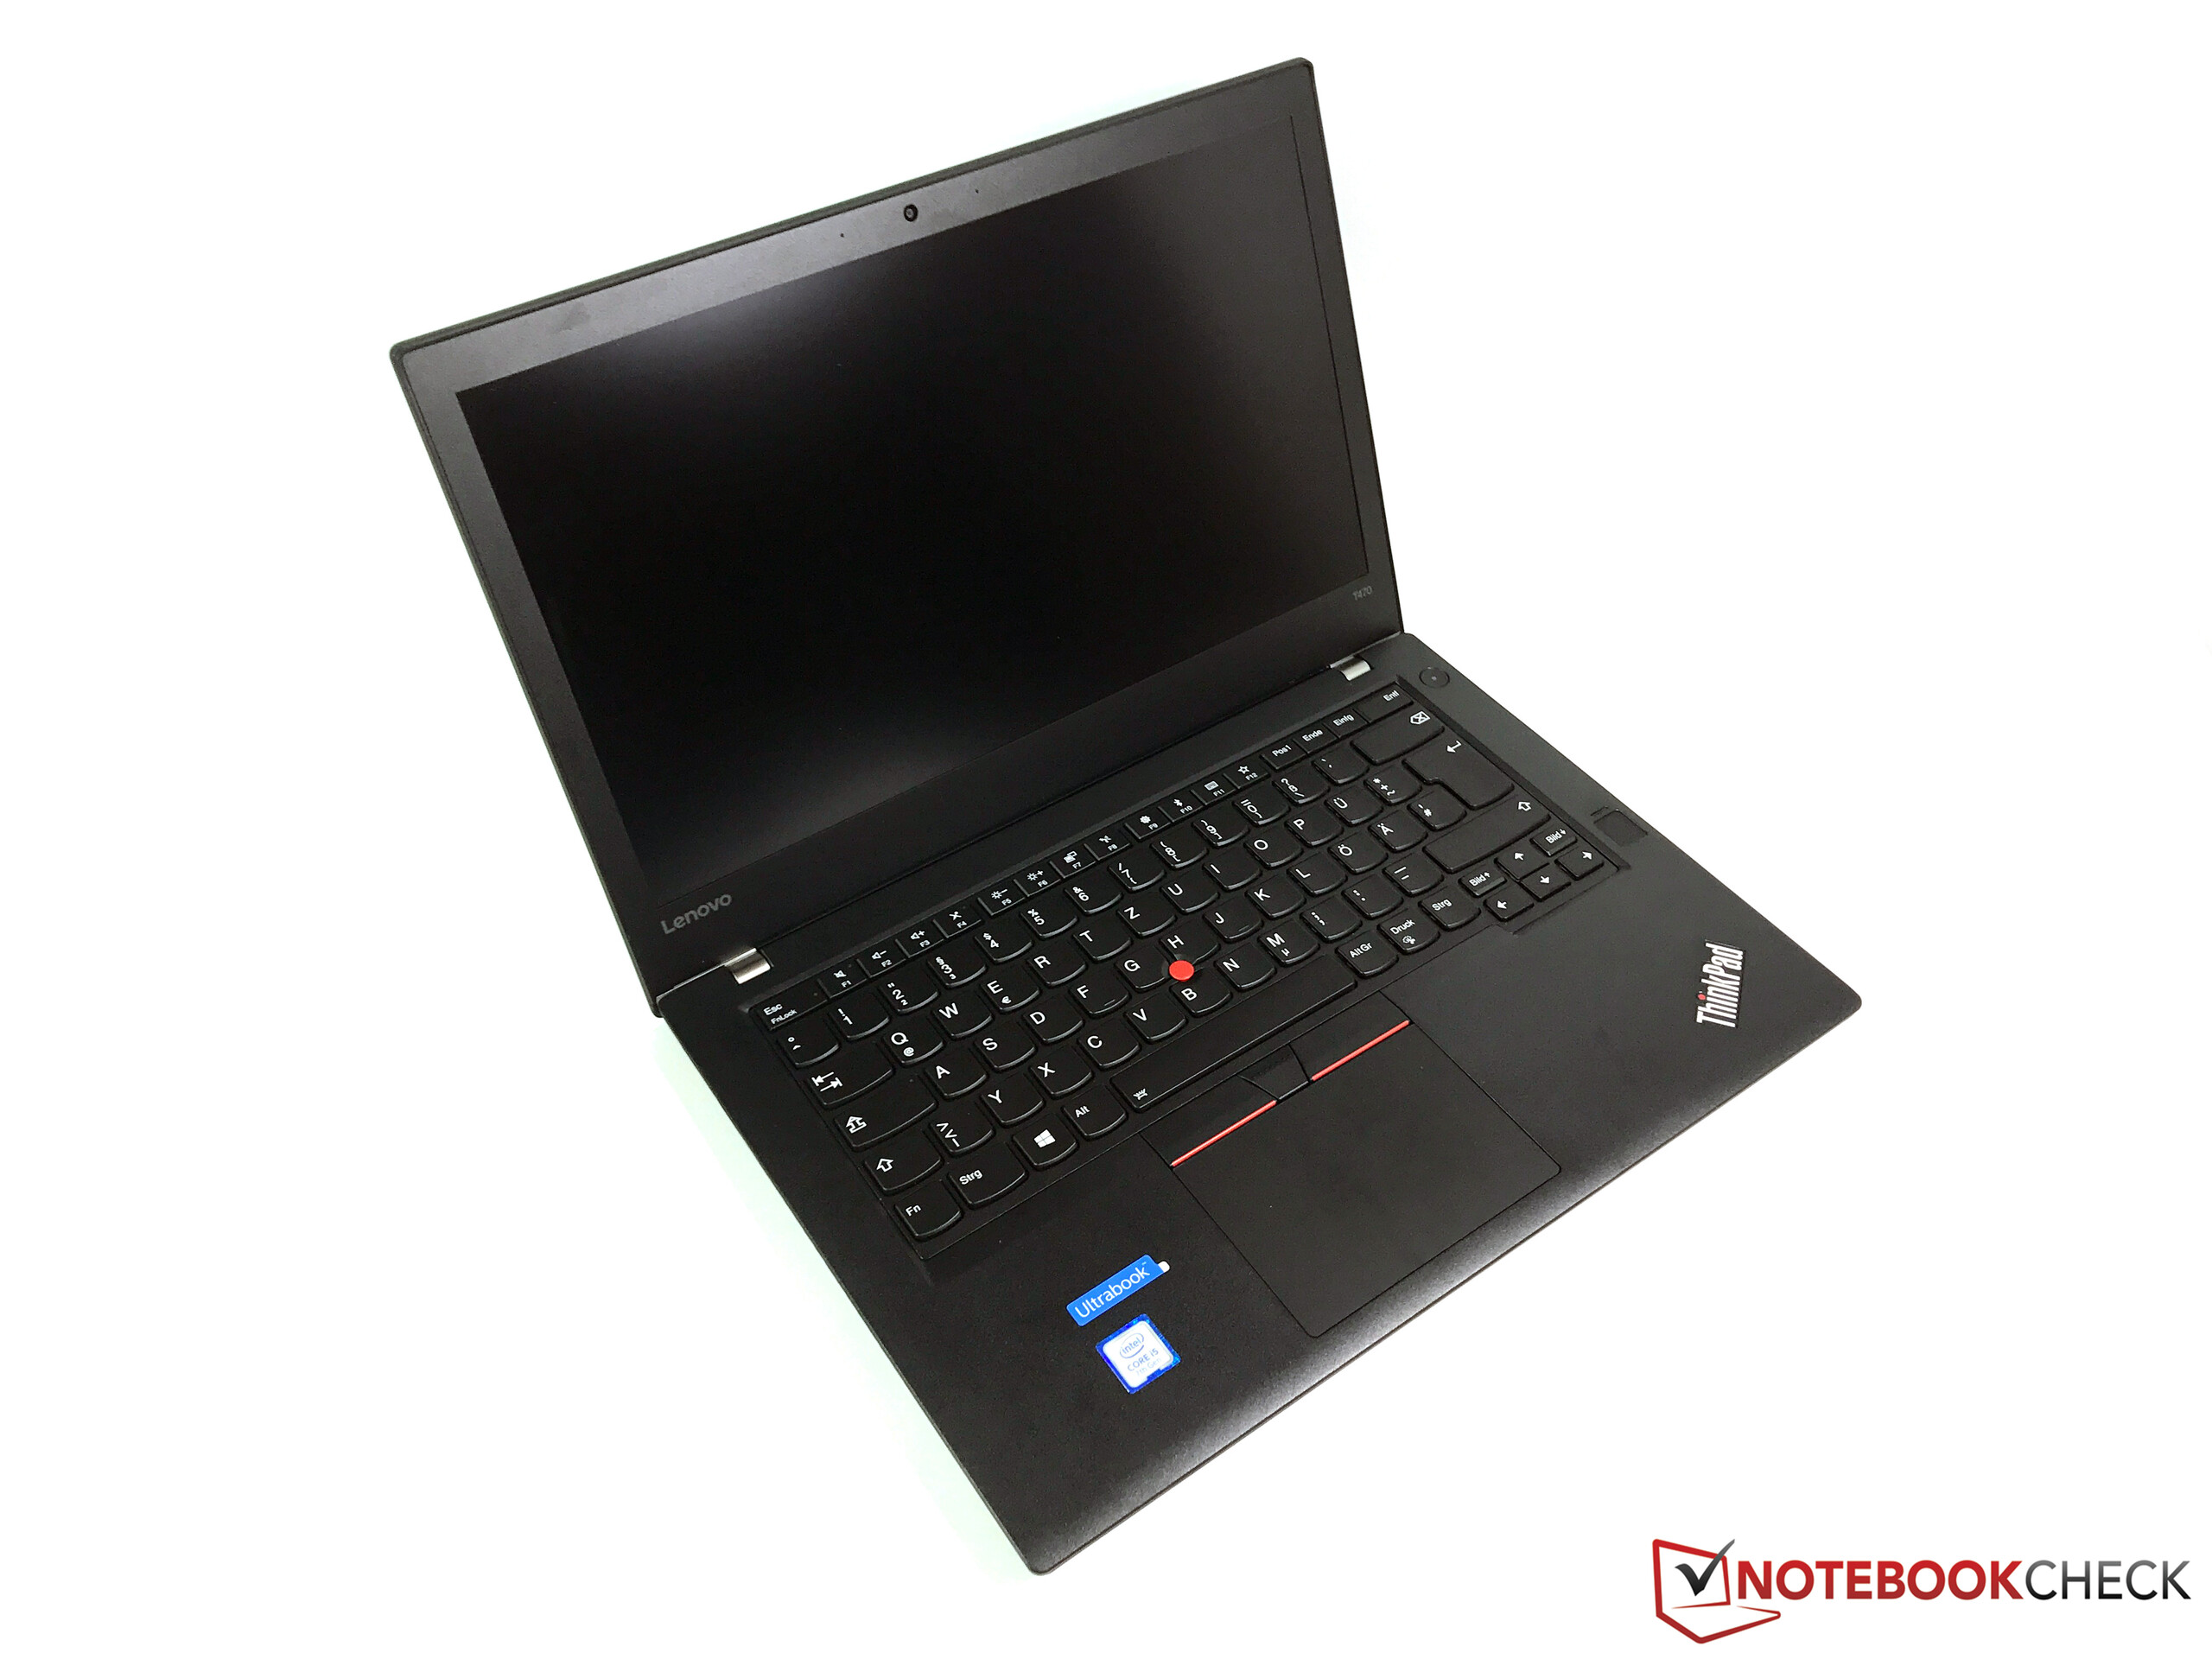
Breve Análise do Portátil Lenovo ThinkPad T470 (Core i5, Full-HD)
| SD Card Reader | |
| average JPG Copy Test (av. of 3 runs) | |
| Lenovo ThinkPad T470-20HD002HGE | |
| Lenovo ThinkPad T460s-20F9003SGE | |
| maximum AS SSD Seq Read Test (1GB) | |
| Lenovo ThinkPad T470-20HD002HGE | |
| Lenovo ThinkPad T460s-20F9003SGE | |
| Networking | |
| iperf3 transmit AX12 | |
| Apple MacBook Pro 15 2016 (2.6 GHz, 450) (Klaus I211) | |
| Lenovo ThinkPad T470-20HD002HGE | |
| Lenovo ThinkPad E470-20H2S00400 | |
| iperf3 receive AX12 | |
| Apple MacBook Pro 15 2016 (2.6 GHz, 450) (Klaus I211) | |
| Lenovo ThinkPad T470-20HD002HGE | |
| Lenovo ThinkPad E470-20H2S00400 | |
| |||||||||||||||||||||||||
iluminação: 88 %
iluminação com acumulador: 304 cd/m²
Contraste: 1020:1 (Preto: 0.3 cd/m²)
ΔE Color 6.2 | 0.5-29.43 Ø5
ΔE Greyscale 5.8 | 0.57-98 Ø5.3
61.44% sRGB (Argyll 1.6.3 3D)
39.62% AdobeRGB 1998 (Argyll 1.6.3 3D)
43.06% AdobeRGB 1998 (Argyll 2.2.0 3D)
61.9% sRGB (Argyll 2.2.0 3D)
41.6% Display P3 (Argyll 2.2.0 3D)
Gamma: 2.04
| Lenovo ThinkPad T470-20HD002HGE N140HCA-EAB, , 1920x1080, 14.00 | Lenovo ThinkPad T460-20FN003LGE Lenovo LEN40A9 / N140HCE-EAA, , 1920x1080, 14.00 | Lenovo ThinkPad T460s-20F9003SGE N140HCE-EAA, LEN40A9, , 1920x1080, 14.00 | Dell Latitude 14 7000 Series E7470 AUO B140QAN Dell PN F0WXVV, , 2560x1440, 14.00 | Lenovo ThinkPad E470-20H2S00400 N140HCA-EAB, , 1920x1080, 14.00 | |
|---|---|---|---|---|---|
| Display | 1% | 0% | 59% | -1% | |
| Display P3 Coverage | 41.6 | 42.09 1% | 41.65 0% | 67.2 62% | 41.23 -1% |
| sRGB Coverage | 61.9 | 62 0% | 61.6 0% | 95.9 55% | 61.4 -1% |
| AdobeRGB 1998 Coverage | 43.06 | 43.6 1% | 43.14 0% | 69.3 61% | 42.67 -1% |
| Response Times | 13% | 7% | 3% | 7% | |
| Response Time Grey 50% / Grey 80% * | 41.6 ? | 42.4 ? -2% | 42 ? -1% | 48 ? -15% | 40.8 ? 2% |
| Response Time Black / White * | 34 ? | 24.8 ? 27% | 29.2 ? 14% | 27 ? 21% | 30.4 ? 11% |
| PWM Frequency | |||||
| Screen | -12% | -5% | 33% | -10% | |
| Brightness middle | 306 | 230 -25% | 226 -26% | 380 24% | 244 -20% |
| Brightness | 287 | 216 -25% | 211 -26% | 354 23% | 231 -20% |
| Brightness Distribution | 88 | 85 -3% | 89 1% | 81 -8% | 89 1% |
| Black Level * | 0.3 | 0.26 13% | 0.22 27% | 0.26 13% | 0.37 -23% |
| Contrast | 1020 | 885 -13% | 1027 1% | 1462 43% | 659 -35% |
| Colorchecker dE 2000 * | 6.2 | 7.32 -18% | 6.44 -4% | 3.11 50% | 6.41 -3% |
| Colorchecker dE 2000 max. * | 13.6 | 18.14 -33% | 17.18 -26% | 6.73 51% | 13.4 1% |
| Greyscale dE 2000 * | 5.8 | 6.98 -20% | 5.87 -1% | 4.35 25% | 5.94 -2% |
| Gamma | 2.04 108% | 2.5 88% | 2.37 93% | 2.37 93% | 2.28 96% |
| CCT | 6277 104% | 6683 97% | 6856 95% | 6771 96% | 6101 107% |
| Color Space (Percent of AdobeRGB 1998) | 39.62 | 39.97 1% | 39.58 0% | 62 56% | 39.3 -1% |
| Color Space (Percent of sRGB) | 61.44 | 61.55 0% | 61.15 0% | 96 56% | 61.1 -1% |
| Total Average (Program / Settings) | 1% /
-6% | 1% /
-3% | 32% /
34% | -1% /
-6% |
* ... smaller is better
Display Response Times
| ↔ Response Time Black to White | ||
|---|---|---|
| 34 ms ... rise ↗ and fall ↘ combined | ↗ 9.6 ms rise | 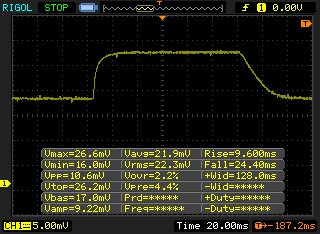 |
| ↘ 24.4 ms fall | ||
| The screen shows slow response rates in our tests and will be unsatisfactory for gamers. In comparison, all tested devices range from 0.1 (minimum) to 240 (maximum) ms. » 89 % of all devices are better. This means that the measured response time is worse than the average of all tested devices (21.5 ms). | ||
| ↔ Response Time 50% Grey to 80% Grey | ||
| 41.6 ms ... rise ↗ and fall ↘ combined | ↗ 20.4 ms rise | 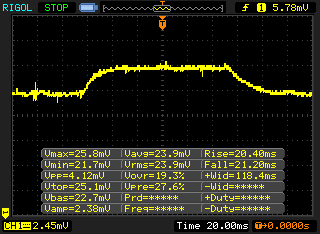 |
| ↘ 21.2 ms fall | ||
| The screen shows slow response rates in our tests and will be unsatisfactory for gamers. In comparison, all tested devices range from 0.2 (minimum) to 636 (maximum) ms. » 62 % of all devices are better. This means that the measured response time is worse than the average of all tested devices (33.7 ms). | ||
Screen Flickering / PWM (Pulse-Width Modulation)
| Screen flickering / PWM not detected | ||
In comparison: 53 % of all tested devices do not use PWM to dim the display. If PWM was detected, an average of 17900 (minimum: 5 - maximum: 3846000) Hz was measured. | ||
| PCMark 8 Home Score Accelerated v2 | 3507 pontos | |
| PCMark 8 Creative Score Accelerated v2 | 4347 pontos | |
| PCMark 8 Work Score Accelerated v2 | 4667 pontos | |
Ajuda | ||

| 3DMark 11 - 1280x720 Performance GPU | |
| Lenovo ThinkPad E470-20H2S00400 | |
| Asus Zenbook UX3410UA | |
| Lenovo ThinkPad T470-20HD002HGE | |
| Lenovo ThinkPad T460-20FN003LGE | |
| Lenovo ThinkPad T460s-20F9003SGE | |
| 3DMark | |
| 1280x720 Cloud Gate Standard Graphics | |
| Lenovo ThinkPad E470-20H2S00400 | |
| Asus Zenbook UX3410UA | |
| Lenovo ThinkPad T470-20HD002HGE | |
| Lenovo ThinkPad T460s-20F9003SGE | |
| Lenovo ThinkPad T460-20FN003LGE | |
| 1920x1080 Fire Strike Graphics | |
| Lenovo ThinkPad E470-20H2S00400 | |
| Asus Zenbook UX3410UA | |
| Lenovo ThinkPad T470-20HD002HGE | |
| Lenovo ThinkPad T460s-20F9003SGE | |
| 3DMark 11 Performance | 1554 pontos | |
| 3DMark Cloud Gate Standard Score | 5317 pontos | |
| 3DMark Fire Strike Score | 762 pontos | |
Ajuda | ||
| BioShock Infinite | |
| 1280x720 Very Low Preset | |
| HP Spectre x360 15-bl002xx | |
| Lenovo ThinkPad T470-20HD002HGE | |
| 1366x768 Medium Preset | |
| HP Spectre x360 15-bl002xx | |
| Lenovo ThinkPad T470-20HD002HGE | |
| 1366x768 High Preset | |
| HP Spectre x360 15-bl002xx | |
| Lenovo ThinkPad T470-20HD002HGE | |
| Tomb Raider | |
| 1024x768 Low Preset | |
| HP Spectre x360 15-bl002xx | |
| Lenovo ThinkPad T470-20HD002HGE | |
| 1366x768 Normal Preset AA:FX AF:4x | |
| HP Spectre x360 15-bl002xx | |
| Lenovo ThinkPad T470-20HD002HGE | |
| 1366x768 High Preset AA:FX AF:8x | |
| HP Spectre x360 15-bl002xx | |
| Lenovo ThinkPad T470-20HD002HGE | |
| Rise of the Tomb Raider | |
| 1024x768 Lowest Preset | |
| HP Spectre x360 15-bl002xx | |
| Lenovo ThinkPad T470-20HD002HGE | |
| 1366x768 Medium Preset AF:2x | |
| HP Spectre x360 15-bl002xx | |
| Lenovo ThinkPad T470-20HD002HGE | |
| baixo | média | alto | ultra | |
| Tomb Raider (2013) | 66.1 | 33.3 | 19.5 | |
| BioShock Infinite (2013) | 40.5 | 23.9 | 19.9 | 6.4 |
| Battlefield 4 (2013) | 31.5 | 25 | 16.2 | |
| The Witcher 3 (2015) | 13.3 | |||
| Rise of the Tomb Raider (2016) | 17.8 | 12.6 |
Barulho
| Ocioso |
| 28 / 28 / 29.4 dB |
| Carga |
| 31.4 / 34.6 dB |
 | ||
30 dB silencioso 40 dB(A) audível 50 dB(A) ruidosamente alto |
||
min: | ||
| Lenovo ThinkPad T470-20HD002HGE i5-7200U, HD Graphics 620 | Lenovo ThinkPad T460-20FN003LGE 6200U, HD Graphics 520 | Lenovo ThinkPad T460s-20F9003SGE 6200U, HD Graphics 520 | Dell Latitude 14 7000 Series E7470 6600U, HD Graphics 520 | Lenovo ThinkPad E470-20H2S00400 i5-7200U, GeForce 940MX | HP EliteBook 840 G4-Z2V49ET ABD i5-7200U, HD Graphics 620 | |
|---|---|---|---|---|---|---|
| Noise | -5% | -3% | -6% | -6% | -7% | |
| off / environment * | 28 | 29 -4% | 29.1 -4% | 31.2 -11% | 29 -4% | 31 -11% |
| Idle Minimum * | 28 | 29 -4% | 29.1 -4% | 31.2 -11% | 29 -4% | 31 -11% |
| Idle Average * | 28 | 29 -4% | 29.1 -4% | 31.2 -11% | 29 -4% | 31 -11% |
| Idle Maximum * | 29.4 | 29 1% | 29.1 1% | 31.2 -6% | 29 1% | 31 -5% |
| Load Average * | 31.4 | 34.2 -9% | 32.3 -3% | 31.9 -2% | 35.6 -13% | 33.5 -7% |
| Load Maximum * | 34.6 | 37.8 -9% | 36.6 -6% | 31.9 8% | 38.5 -11% | 33.7 3% |
* ... smaller is better
(+) The maximum temperature on the upper side is 37.2 °C / 99 F, compared to the average of 34.2 °C / 94 F, ranging from 21.2 to 62.5 °C for the class Office.
(-) The bottom heats up to a maximum of 45.1 °C / 113 F, compared to the average of 36.7 °C / 98 F
(+) In idle usage, the average temperature for the upper side is 23.3 °C / 74 F, compared to the device average of 29.5 °C / 85 F.
(+) The palmrests and touchpad are cooler than skin temperature with a maximum of 29.8 °C / 85.6 F and are therefore cool to the touch.
(-) The average temperature of the palmrest area of similar devices was 27.7 °C / 81.9 F (-2.1 °C / -3.7 F).
Lenovo ThinkPad T470-20HD002HGE audio analysis
(±) | speaker loudness is average but good (80.4 dB)
Bass 100 - 315 Hz
(-) | nearly no bass - on average 16.6% lower than median
(±) | linearity of bass is average (8.8% delta to prev. frequency)
Mids 400 - 2000 Hz
(+) | balanced mids - only 4.3% away from median
(+) | mids are linear (6.7% delta to prev. frequency)
Highs 2 - 16 kHz
(±) | higher highs - on average 5.4% higher than median
(±) | linearity of highs is average (13.3% delta to prev. frequency)
Overall 100 - 16.000 Hz
(±) | linearity of overall sound is average (18.7% difference to median)
Compared to same class
» 29% of all tested devices in this class were better, 6% similar, 65% worse
» The best had a delta of 7%, average was 22%, worst was 53%
Compared to all devices tested
» 37% of all tested devices were better, 8% similar, 55% worse
» The best had a delta of 4%, average was 25%, worst was 134%
Lenovo ThinkPad E470-20H2S00400 audio analysis
(+) | speakers can play relatively loud (84.8 dB)
Bass 100 - 315 Hz
(-) | nearly no bass - on average 15.7% lower than median
(±) | linearity of bass is average (11.2% delta to prev. frequency)
Mids 400 - 2000 Hz
(±) | higher mids - on average 9% higher than median
(±) | linearity of mids is average (11.1% delta to prev. frequency)
Highs 2 - 16 kHz
(±) | higher highs - on average 5.1% higher than median
(±) | linearity of highs is average (10.5% delta to prev. frequency)
Overall 100 - 16.000 Hz
(±) | linearity of overall sound is average (23.8% difference to median)
Compared to same class
» 65% of all tested devices in this class were better, 10% similar, 26% worse
» The best had a delta of 7%, average was 22%, worst was 53%
Compared to all devices tested
» 67% of all tested devices were better, 7% similar, 26% worse
» The best had a delta of 4%, average was 25%, worst was 134%
| desligado | |
| Ocioso | |
| Carga |
|
| Lenovo ThinkPad T470-20HD002HGE i5-7200U, HD Graphics 620, 1920x1080 | Lenovo ThinkPad T460-20FN003LGE 6200U, HD Graphics 520, 1920x1080 | Lenovo ThinkPad T460s-20F9003SGE 6200U, HD Graphics 520, 1920x1080 | Dell Latitude 14 7000 Series E7470 6600U, HD Graphics 520, 2560x1440 | Lenovo ThinkPad E470-20H2S00400 i5-7200U, GeForce 940MX, 1920x1080 | HP EliteBook 840 G4-Z2V49ET ABD i5-7200U, HD Graphics 620, 1920x1080 | |
|---|---|---|---|---|---|---|
| Power Consumption | -5% | -5% | -32% | -22% | 0% | |
| Idle Minimum * | 3.21 | 3.5 -9% | 3.7 -15% | 5.1 -59% | 2.7 16% | 2.9 10% |
| Idle Average * | 6.15 | 6.7 -9% | 6.8 -11% | 8.5 -38% | 5.5 11% | 5.6 9% |
| Idle Maximum * | 6.82 | 7.3 -7% | 7.3 -7% | 10.1 -48% | 6.5 5% | 8.15 -20% |
| Load Average * | 28.5 | 28.2 1% | 26.3 8% | 35.2 -24% | 44.2 -55% | 30.6 -7% |
| Load Maximum * | 34.5 | 34.6 -0% | 34.6 -0% | 31 10% | 65.2 -89% | 31 10% |
* ... smaller is better
| Lenovo ThinkPad T470-20HD002HGE i5-7200U, HD Graphics 620, 48 Wh | Lenovo ThinkPad T460-20FN003LGE 6200U, HD Graphics 520, 46 Wh | Lenovo ThinkPad T460s-20F9003SGE 6200U, HD Graphics 520, 49 Wh | Dell Latitude 14 7000 Series E7470 6600U, HD Graphics 520, 55 Wh | Lenovo ThinkPad E470-20H2S00400 i5-7200U, GeForce 940MX, 45 Wh | |
|---|---|---|---|---|---|
| Battery Runtime | -17% | -6% | -10% | -11% | |
| H.264 | 623 | 512 -18% | 534 -14% | 503 -19% | |
| WiFi v1.3 | 438 | 338 -23% | 395 -10% | 346 -21% | 326 -26% |
| Load | 110 | 98 -11% | 116 5% | 112 2% | 124 13% |
Pro
Contra
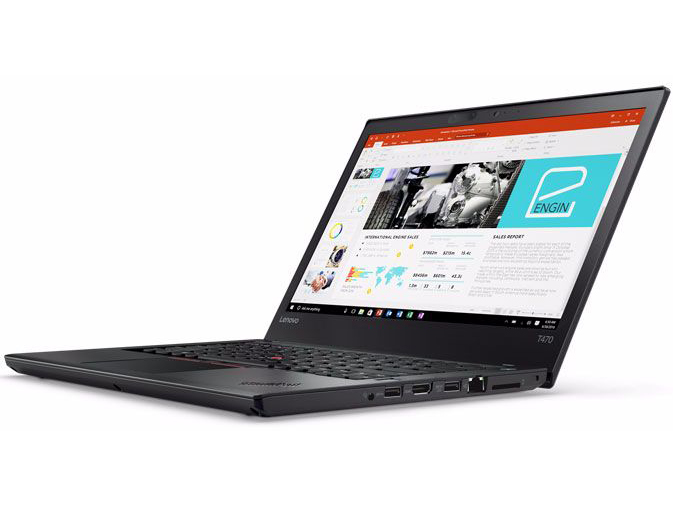
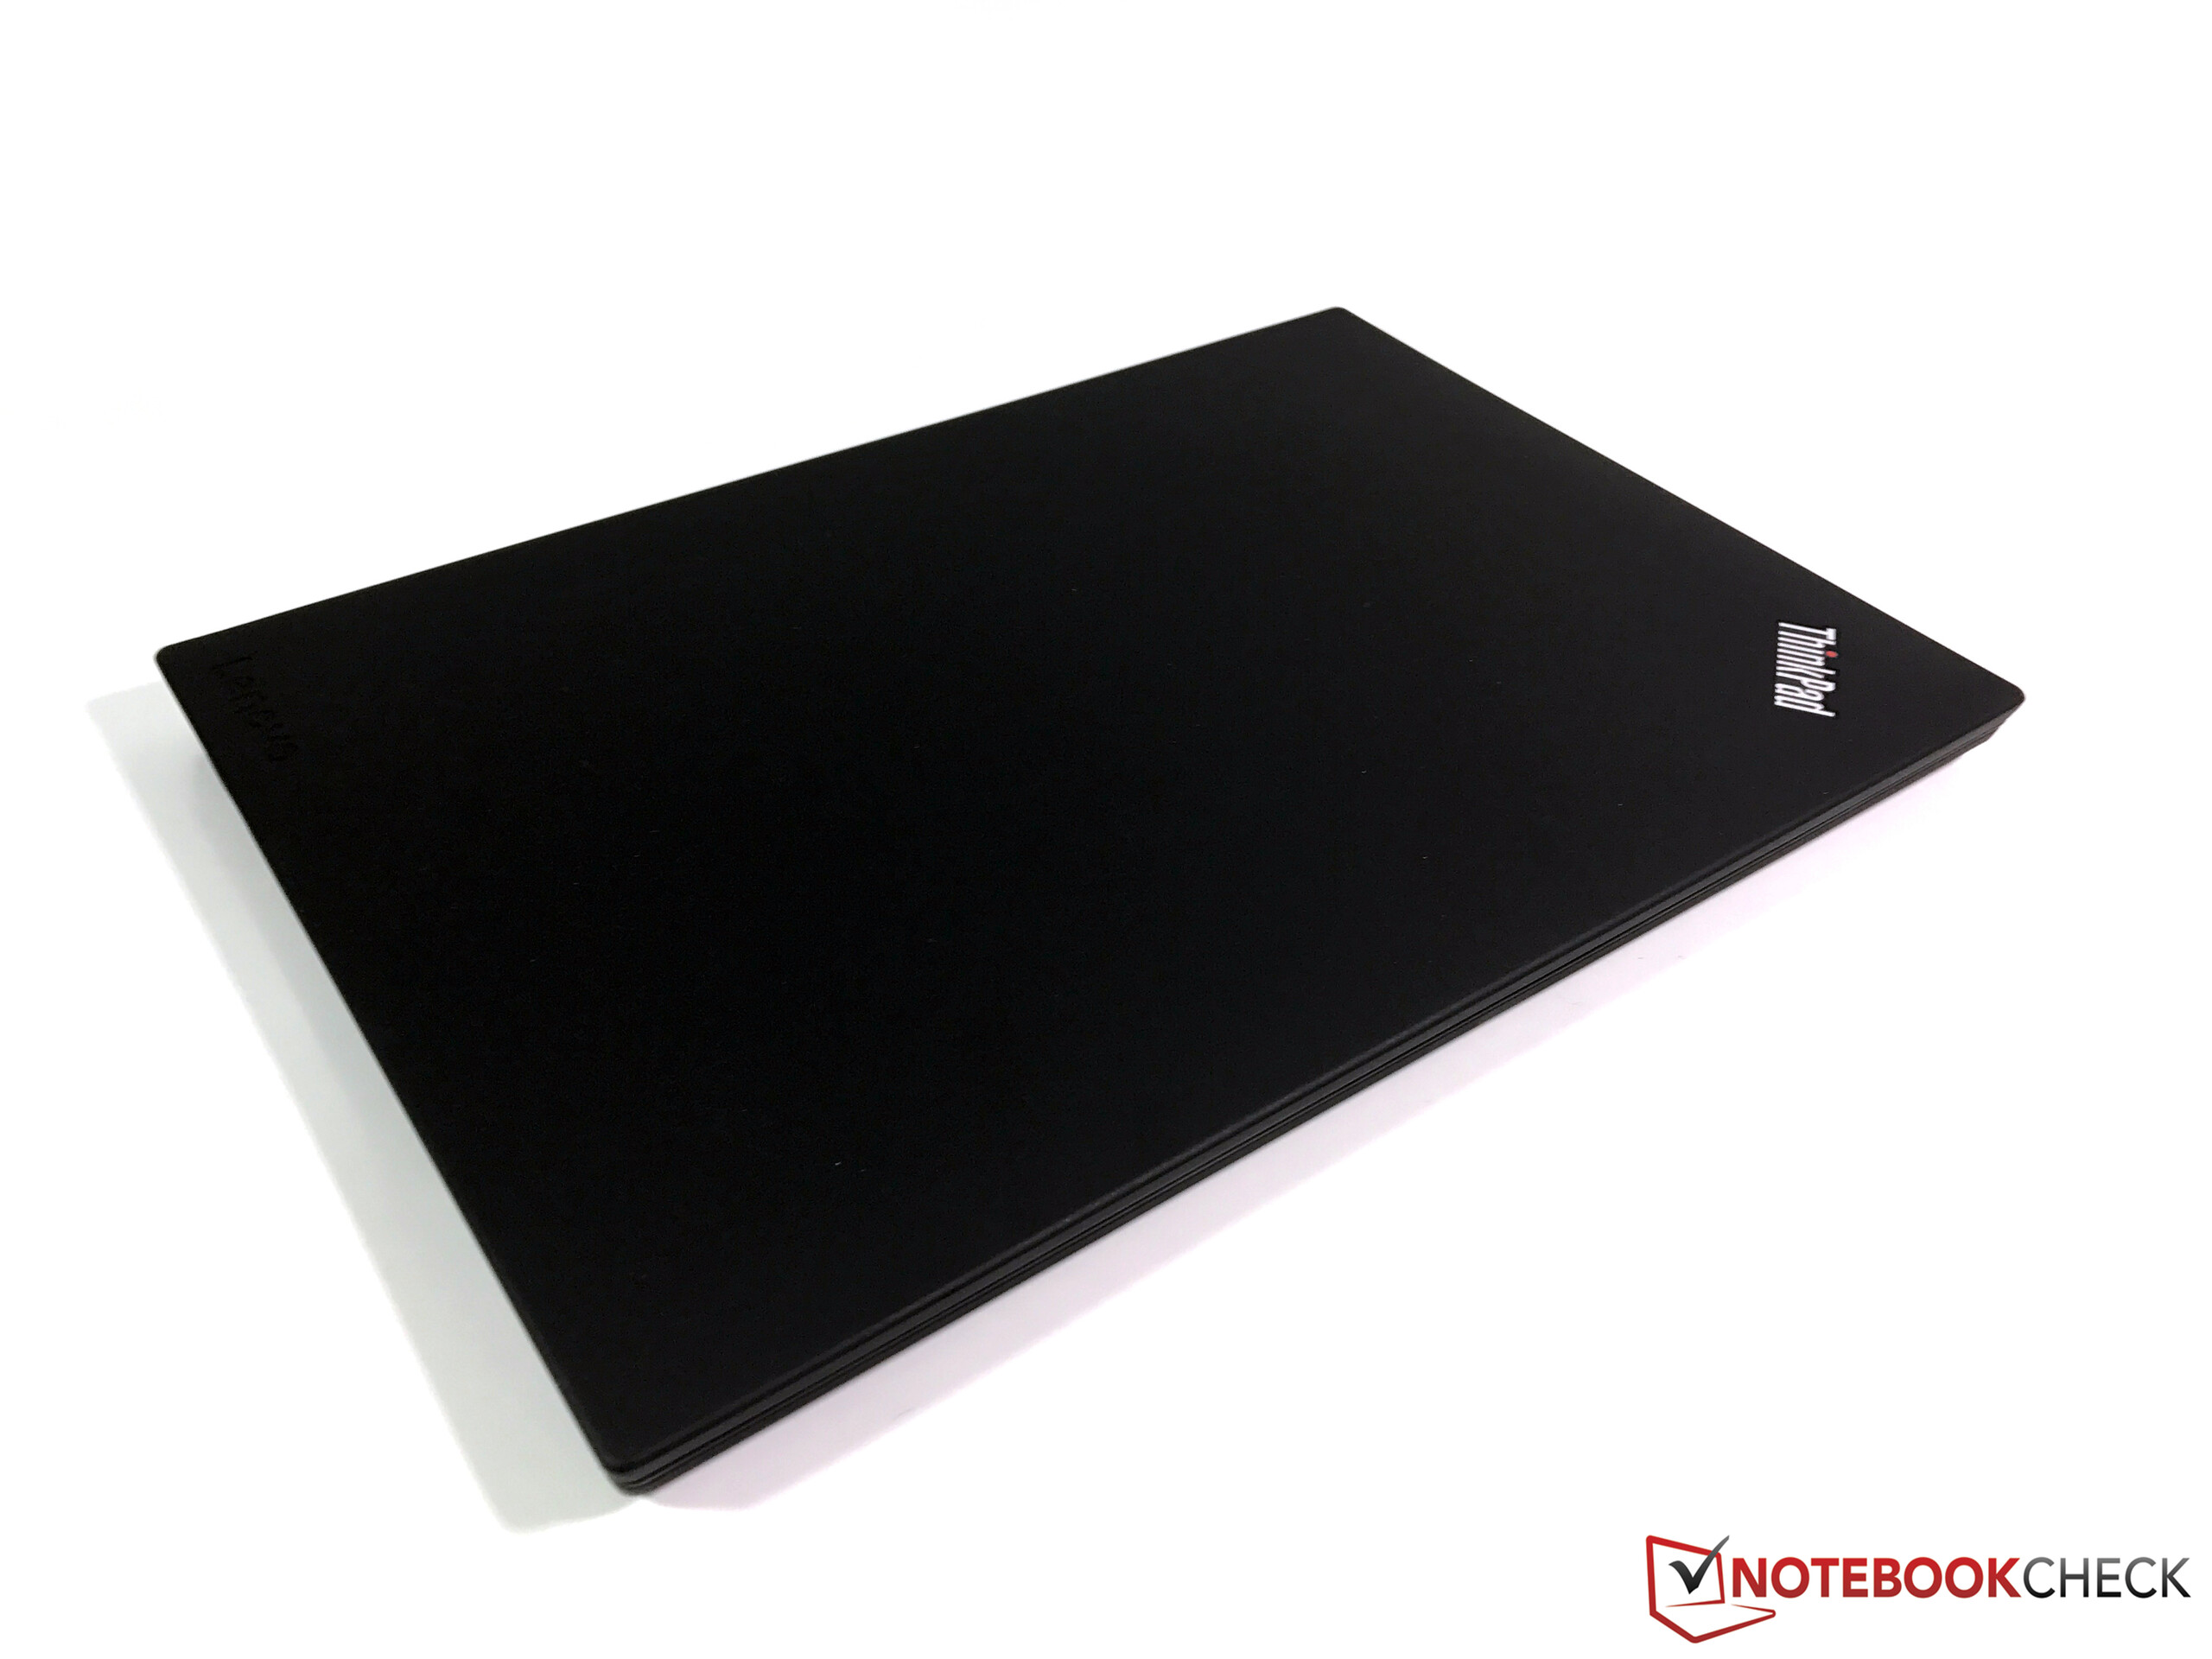
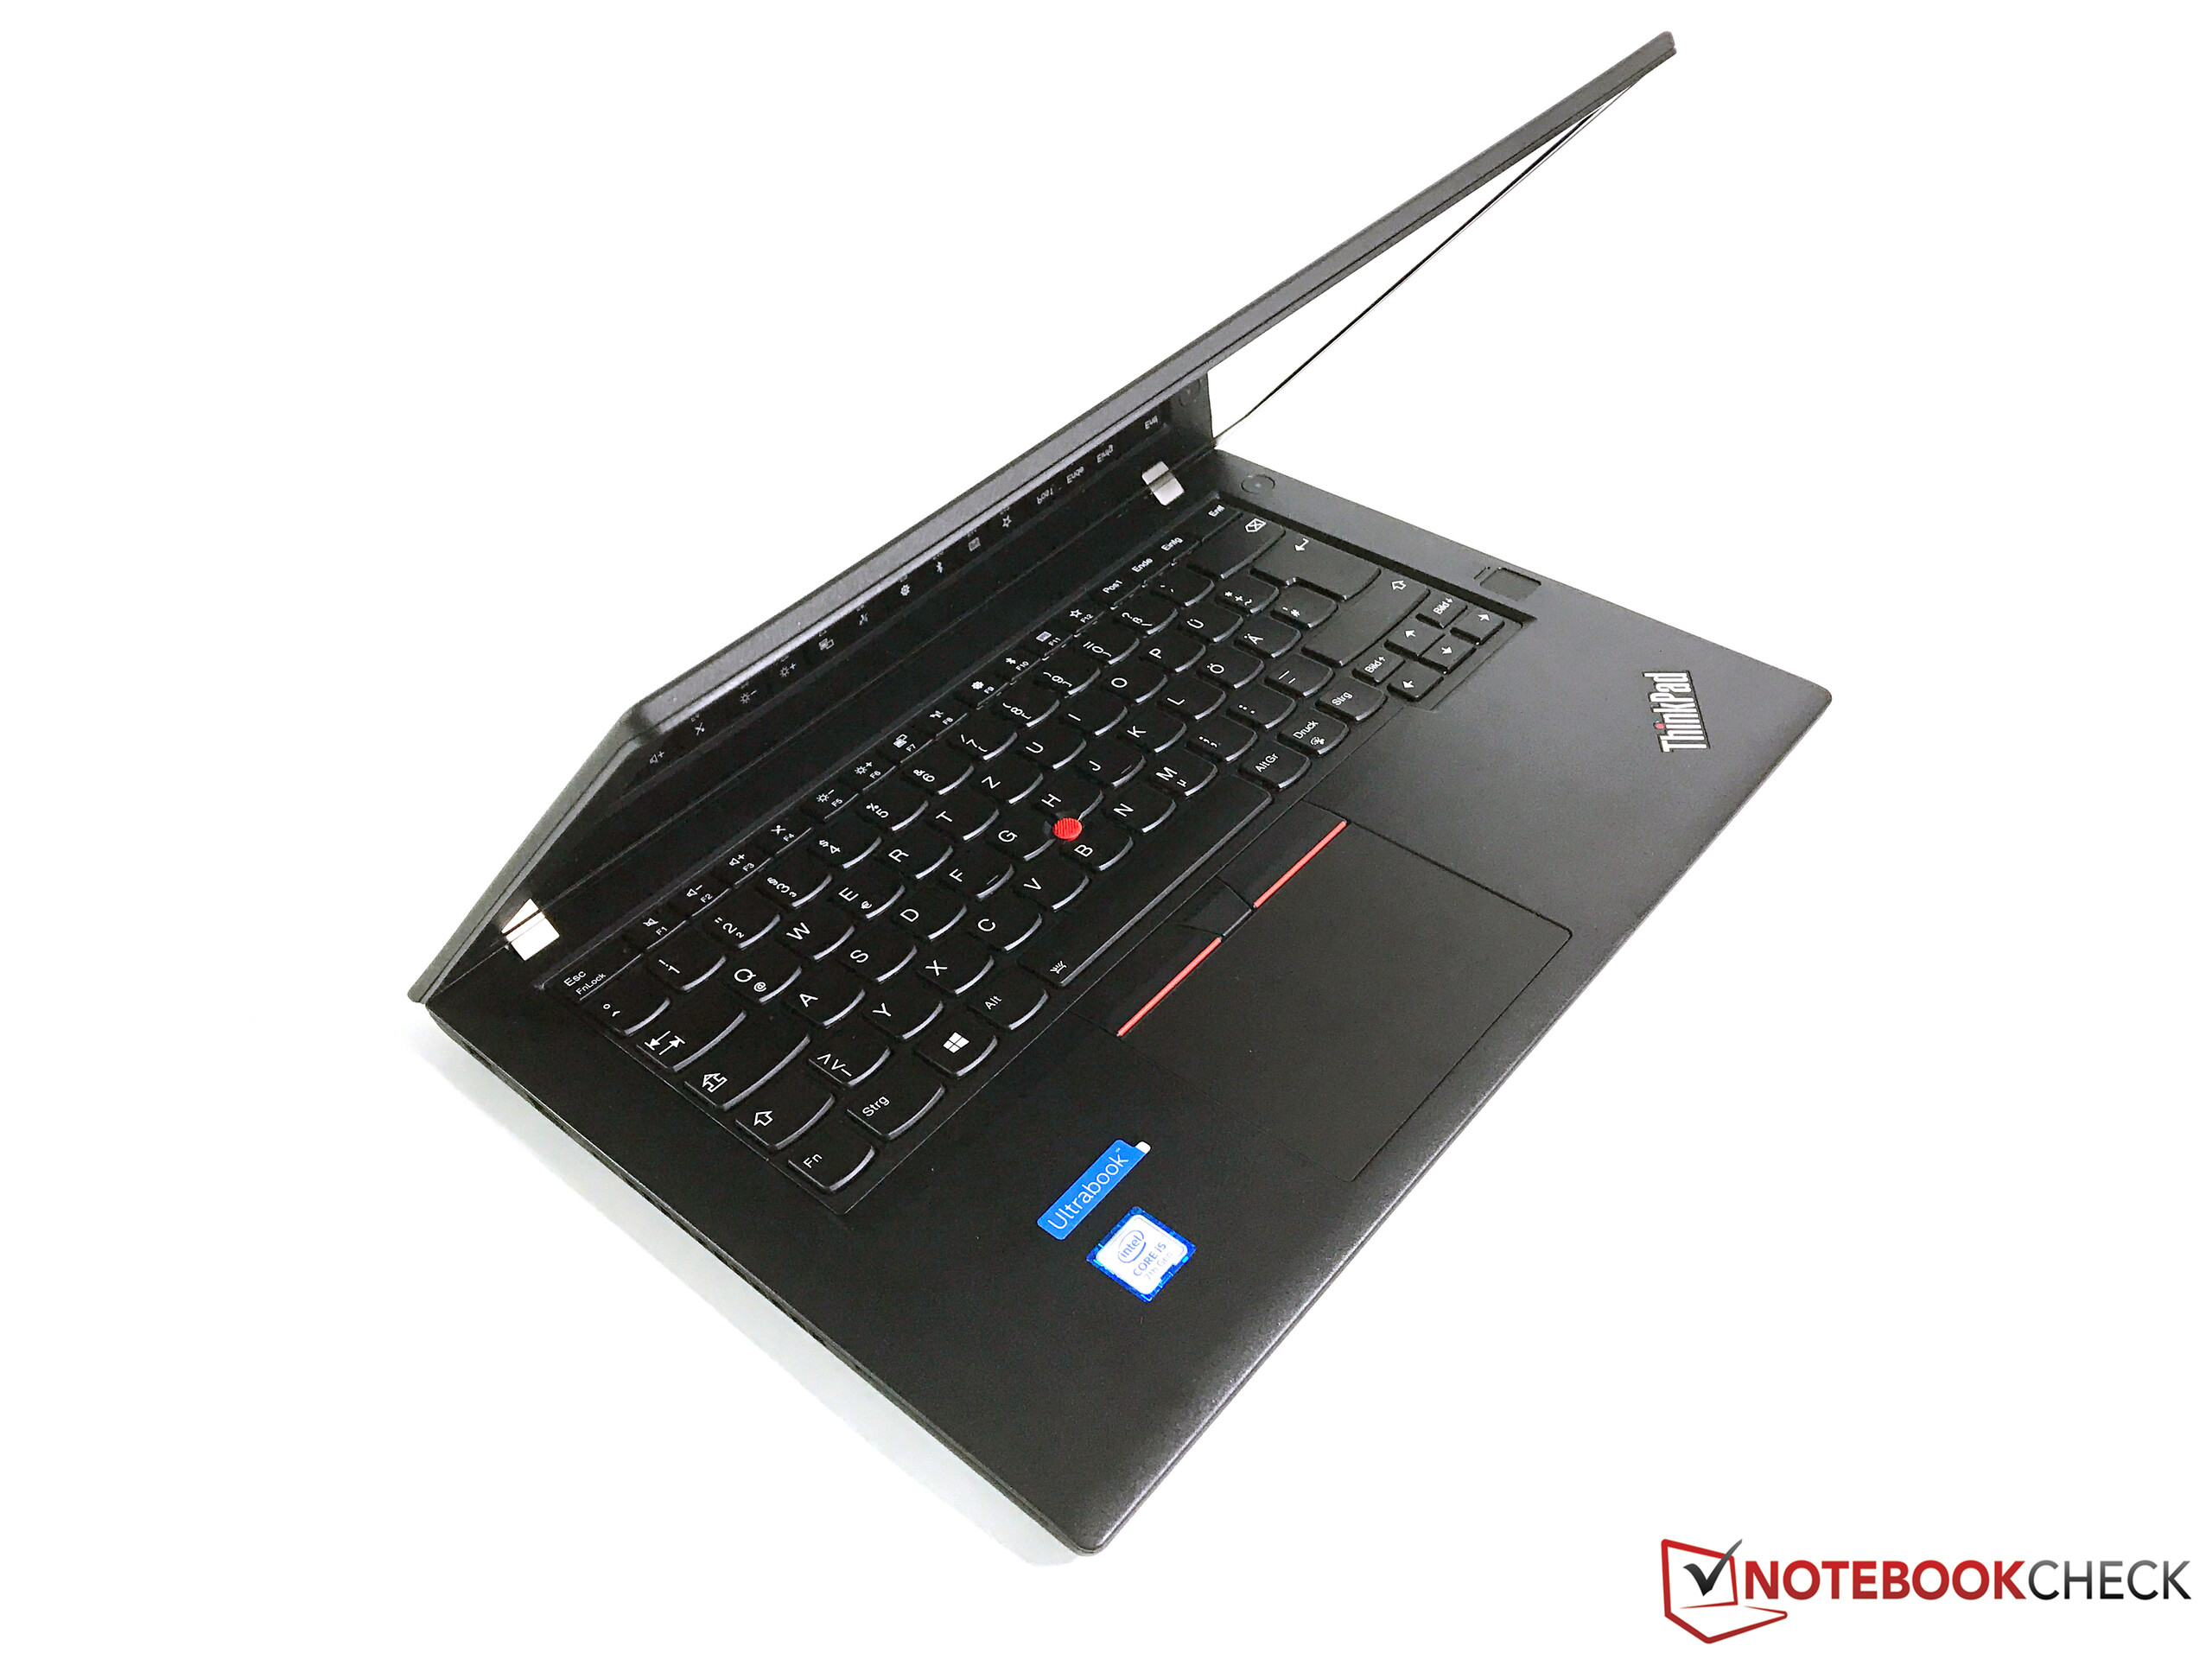
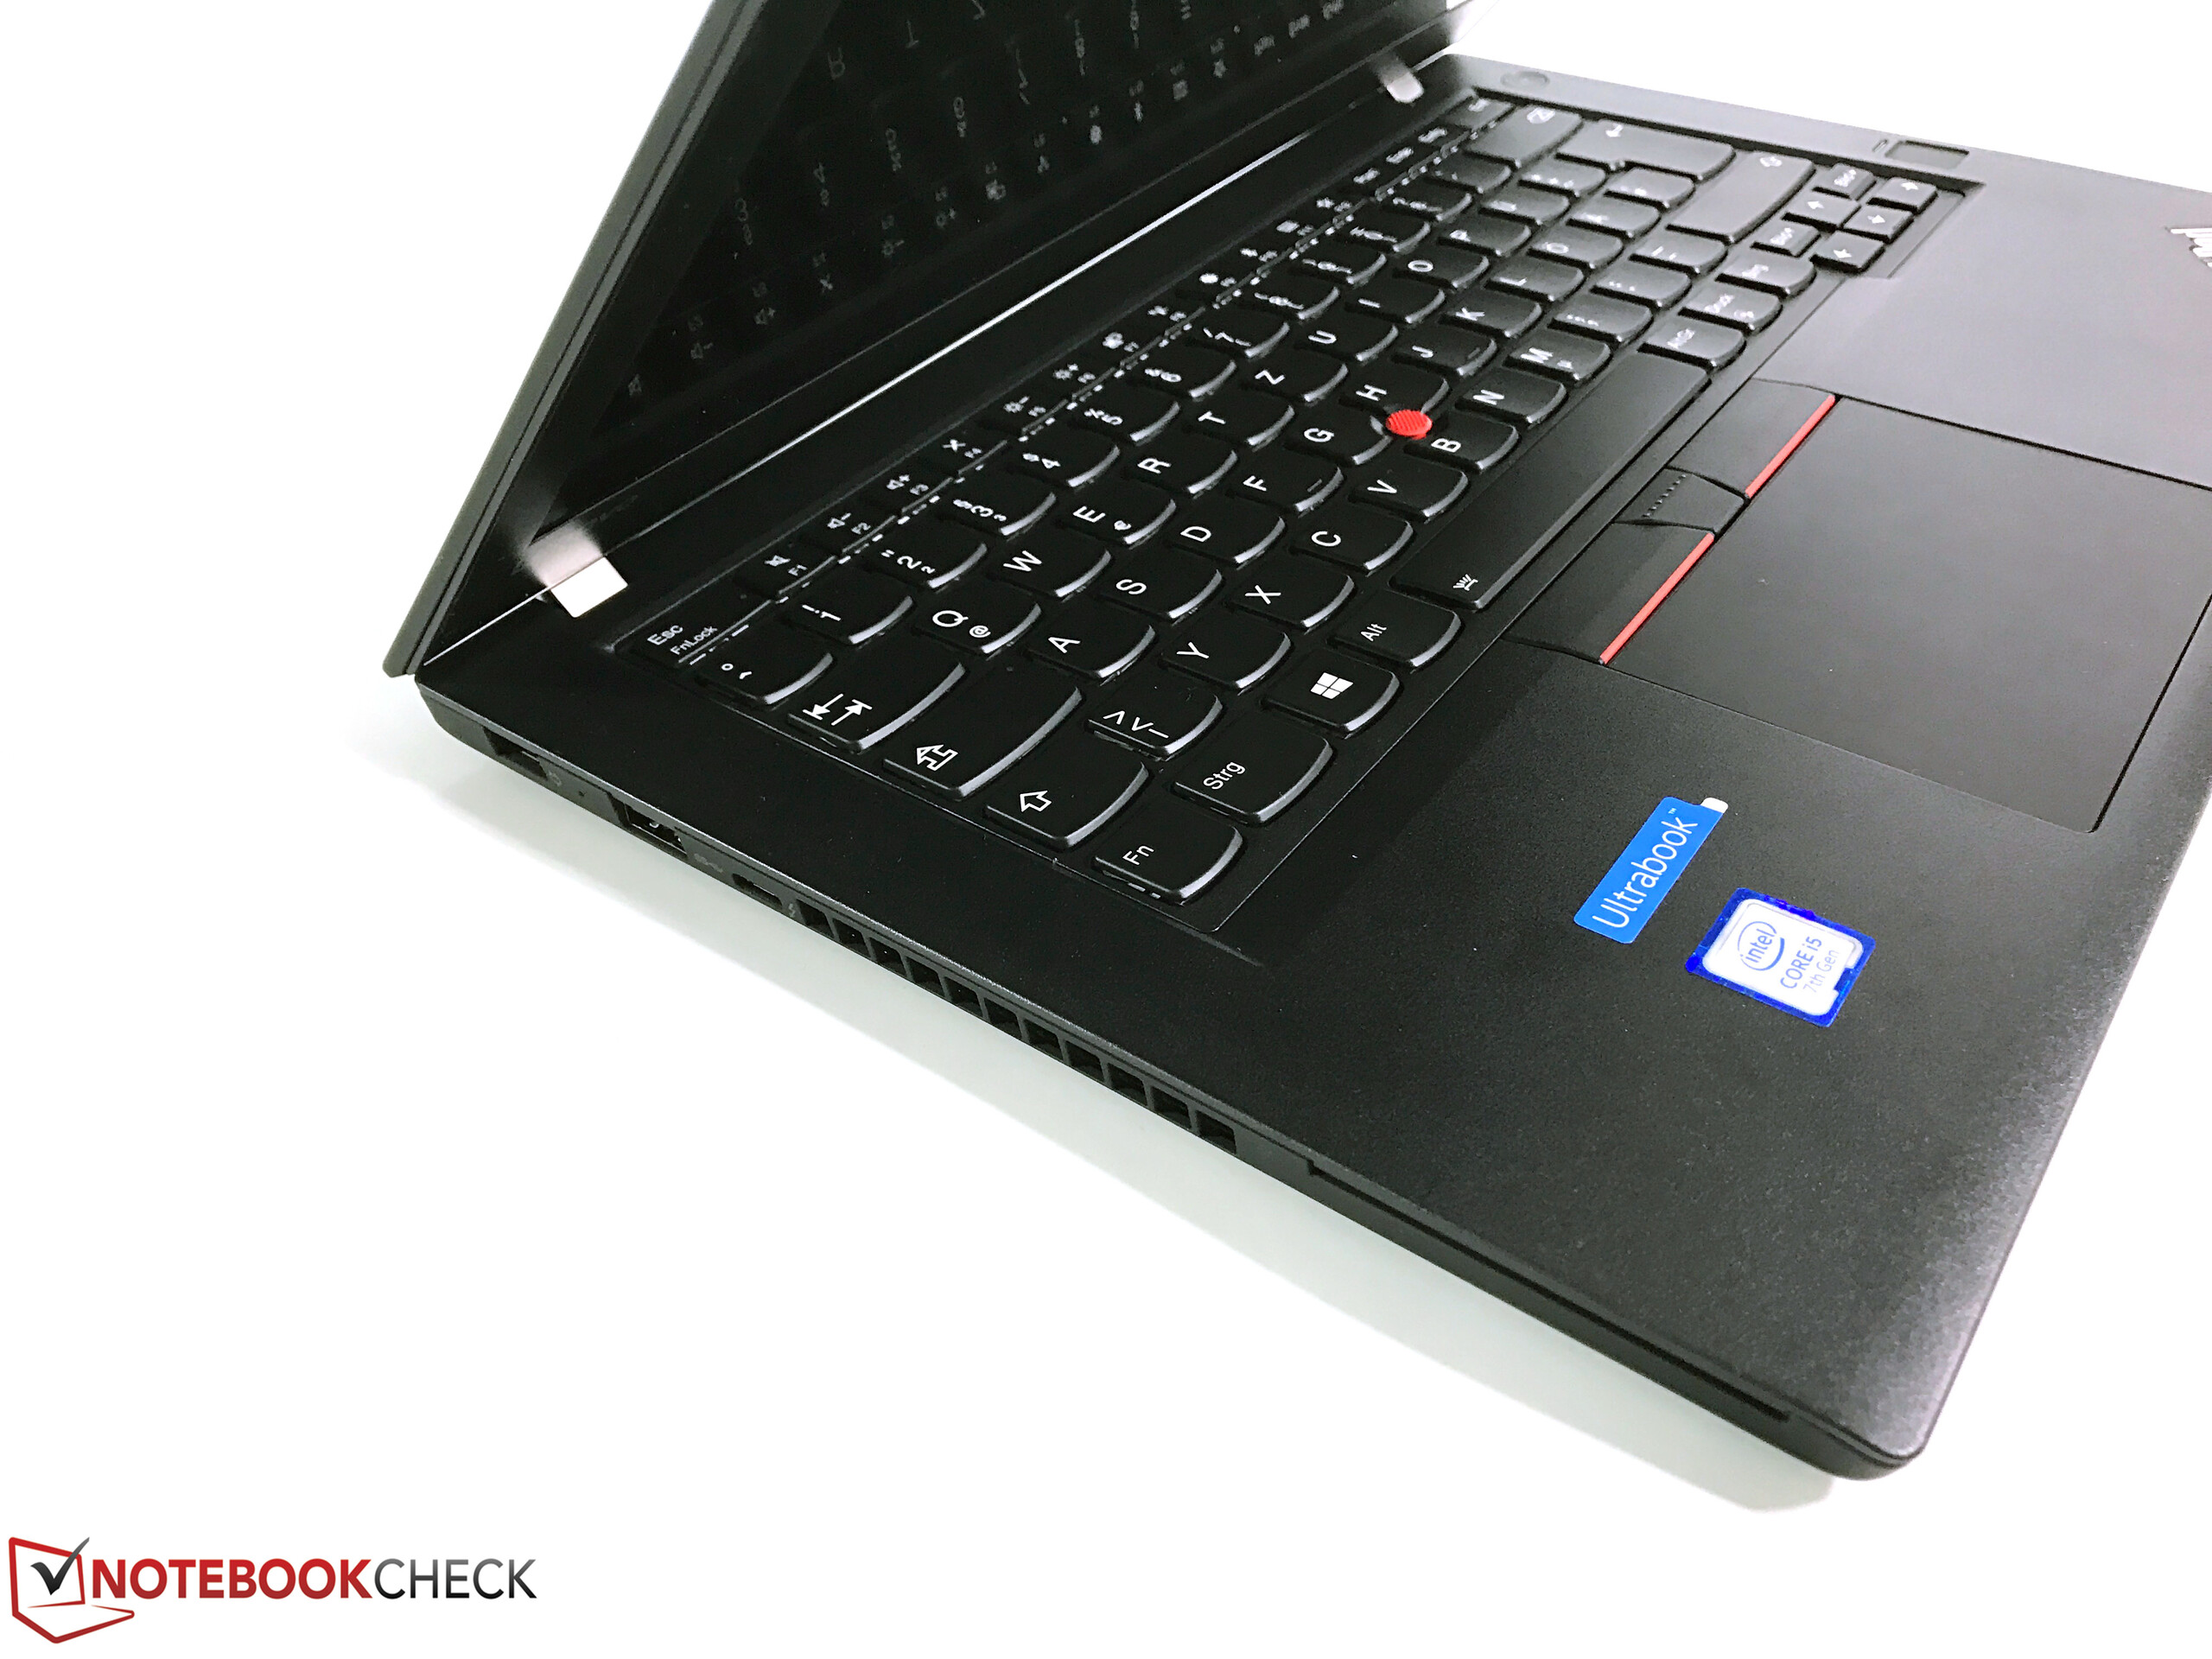
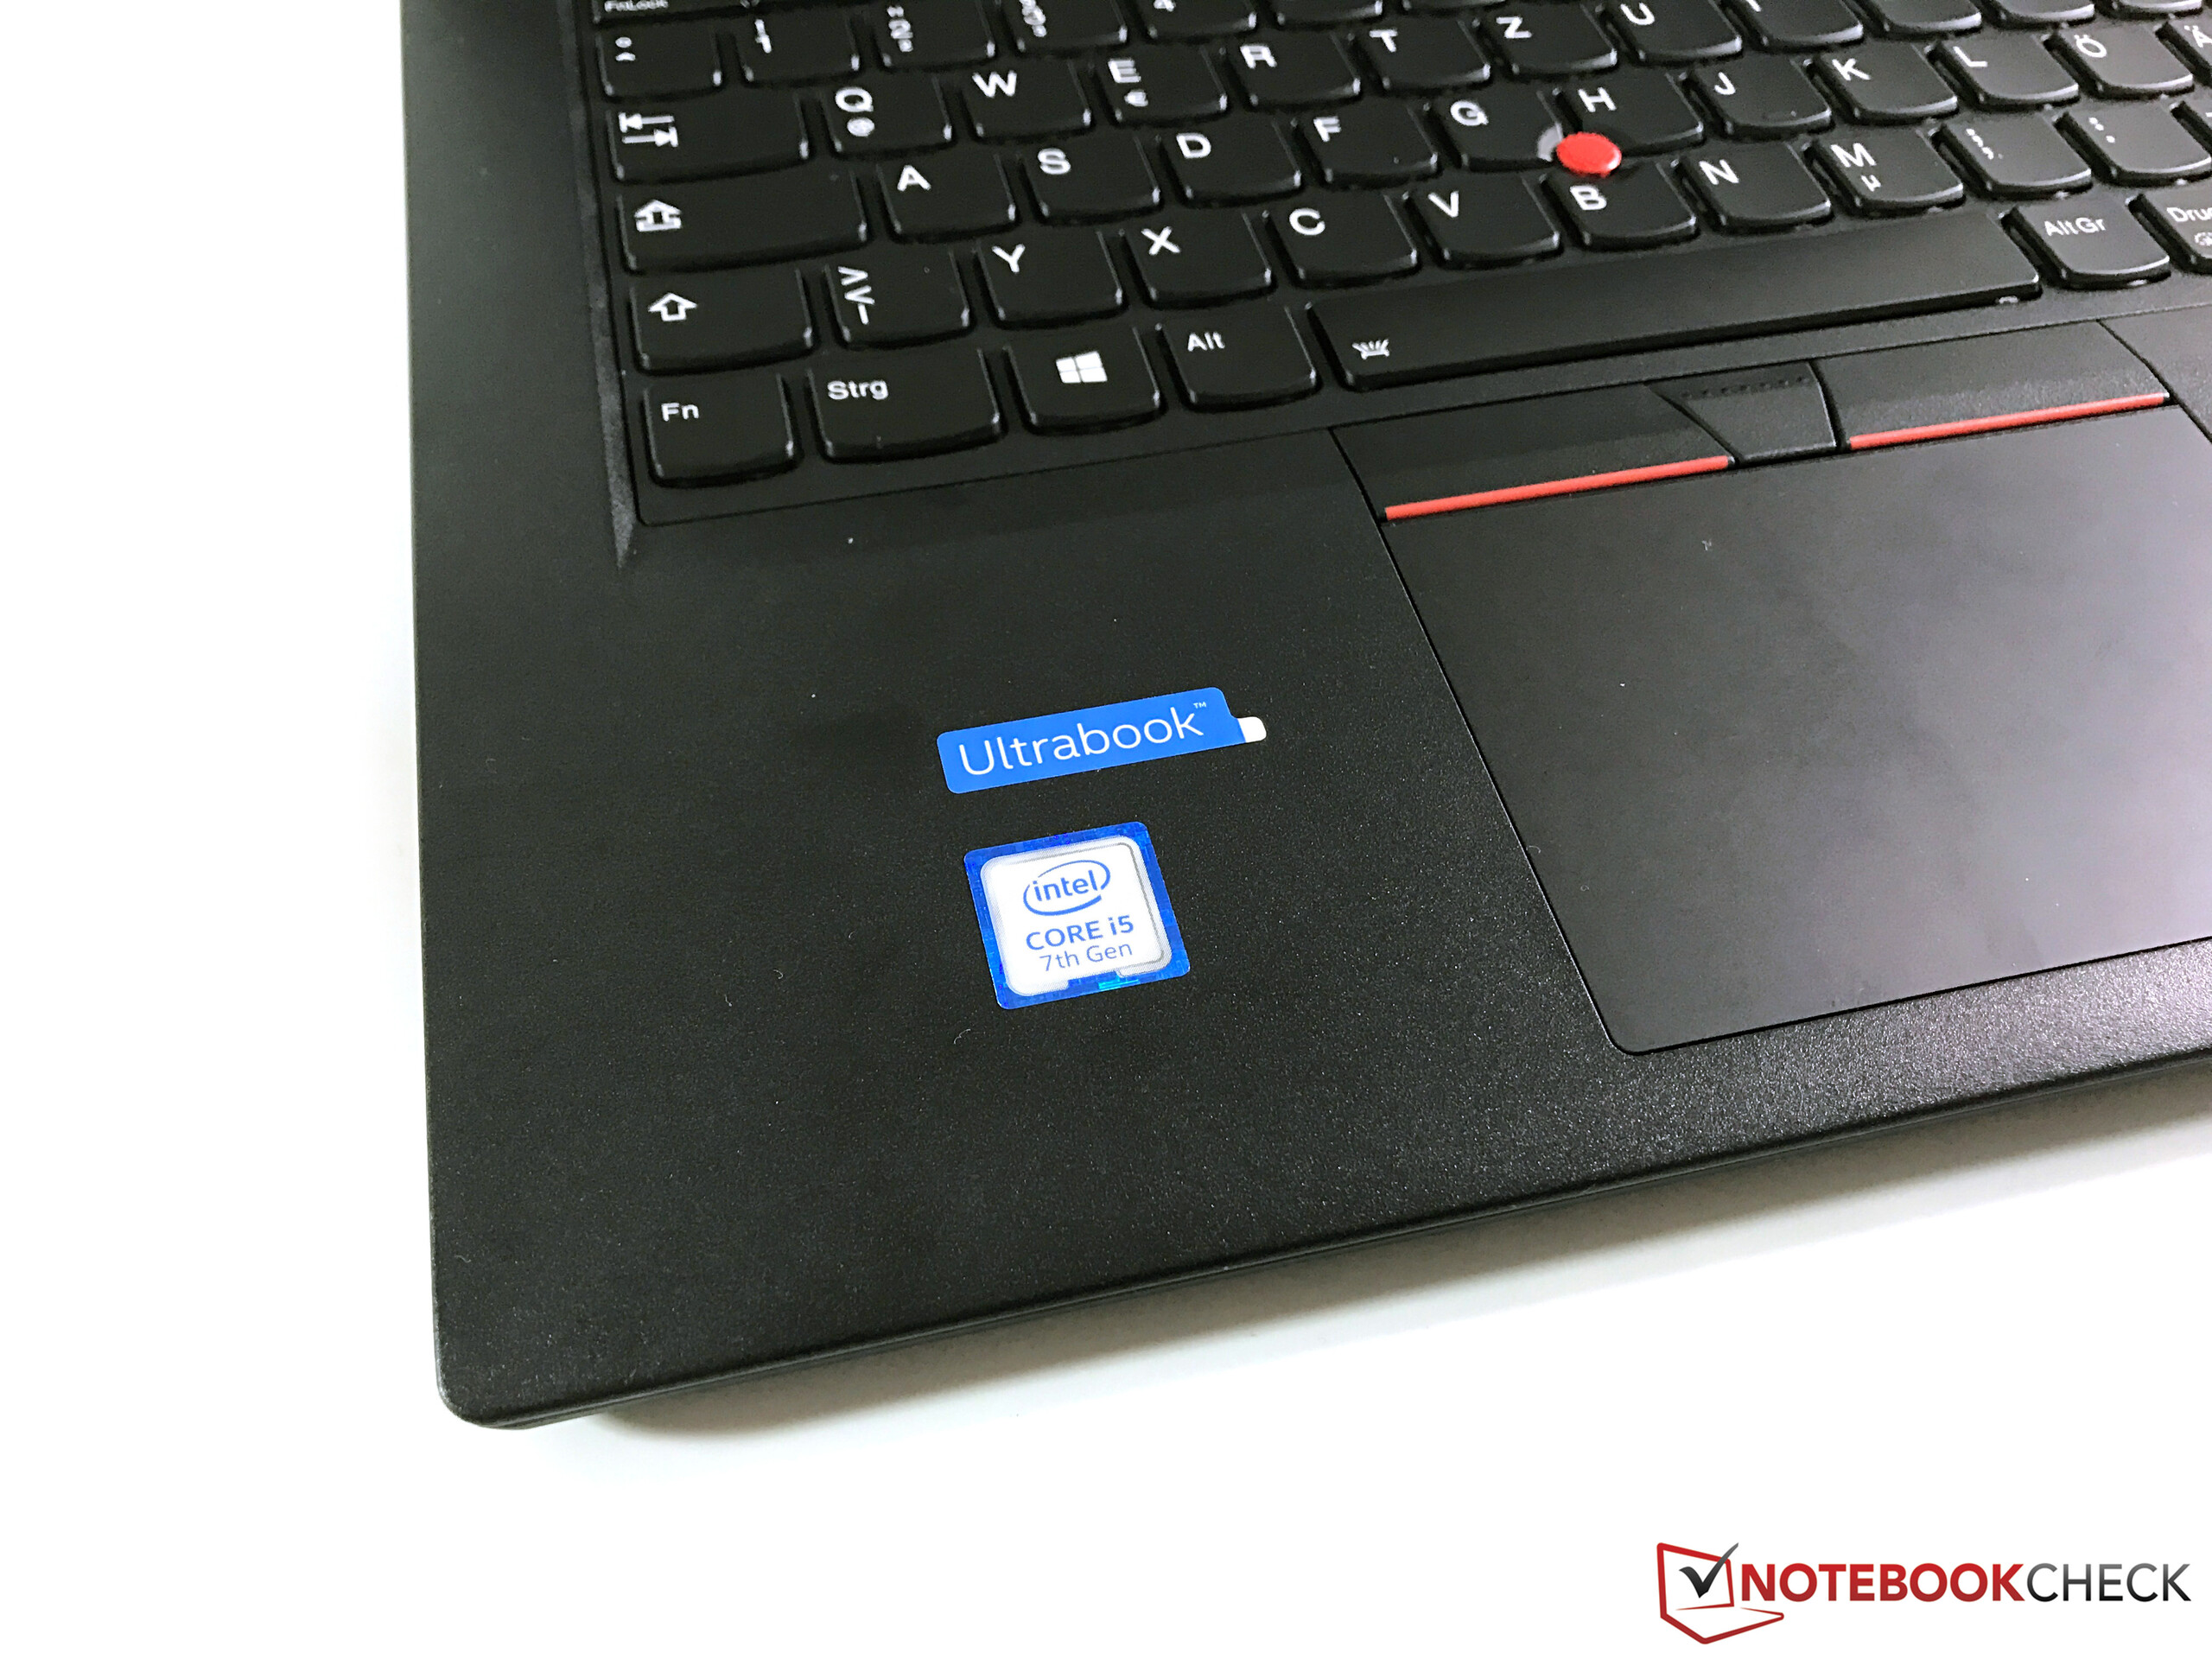
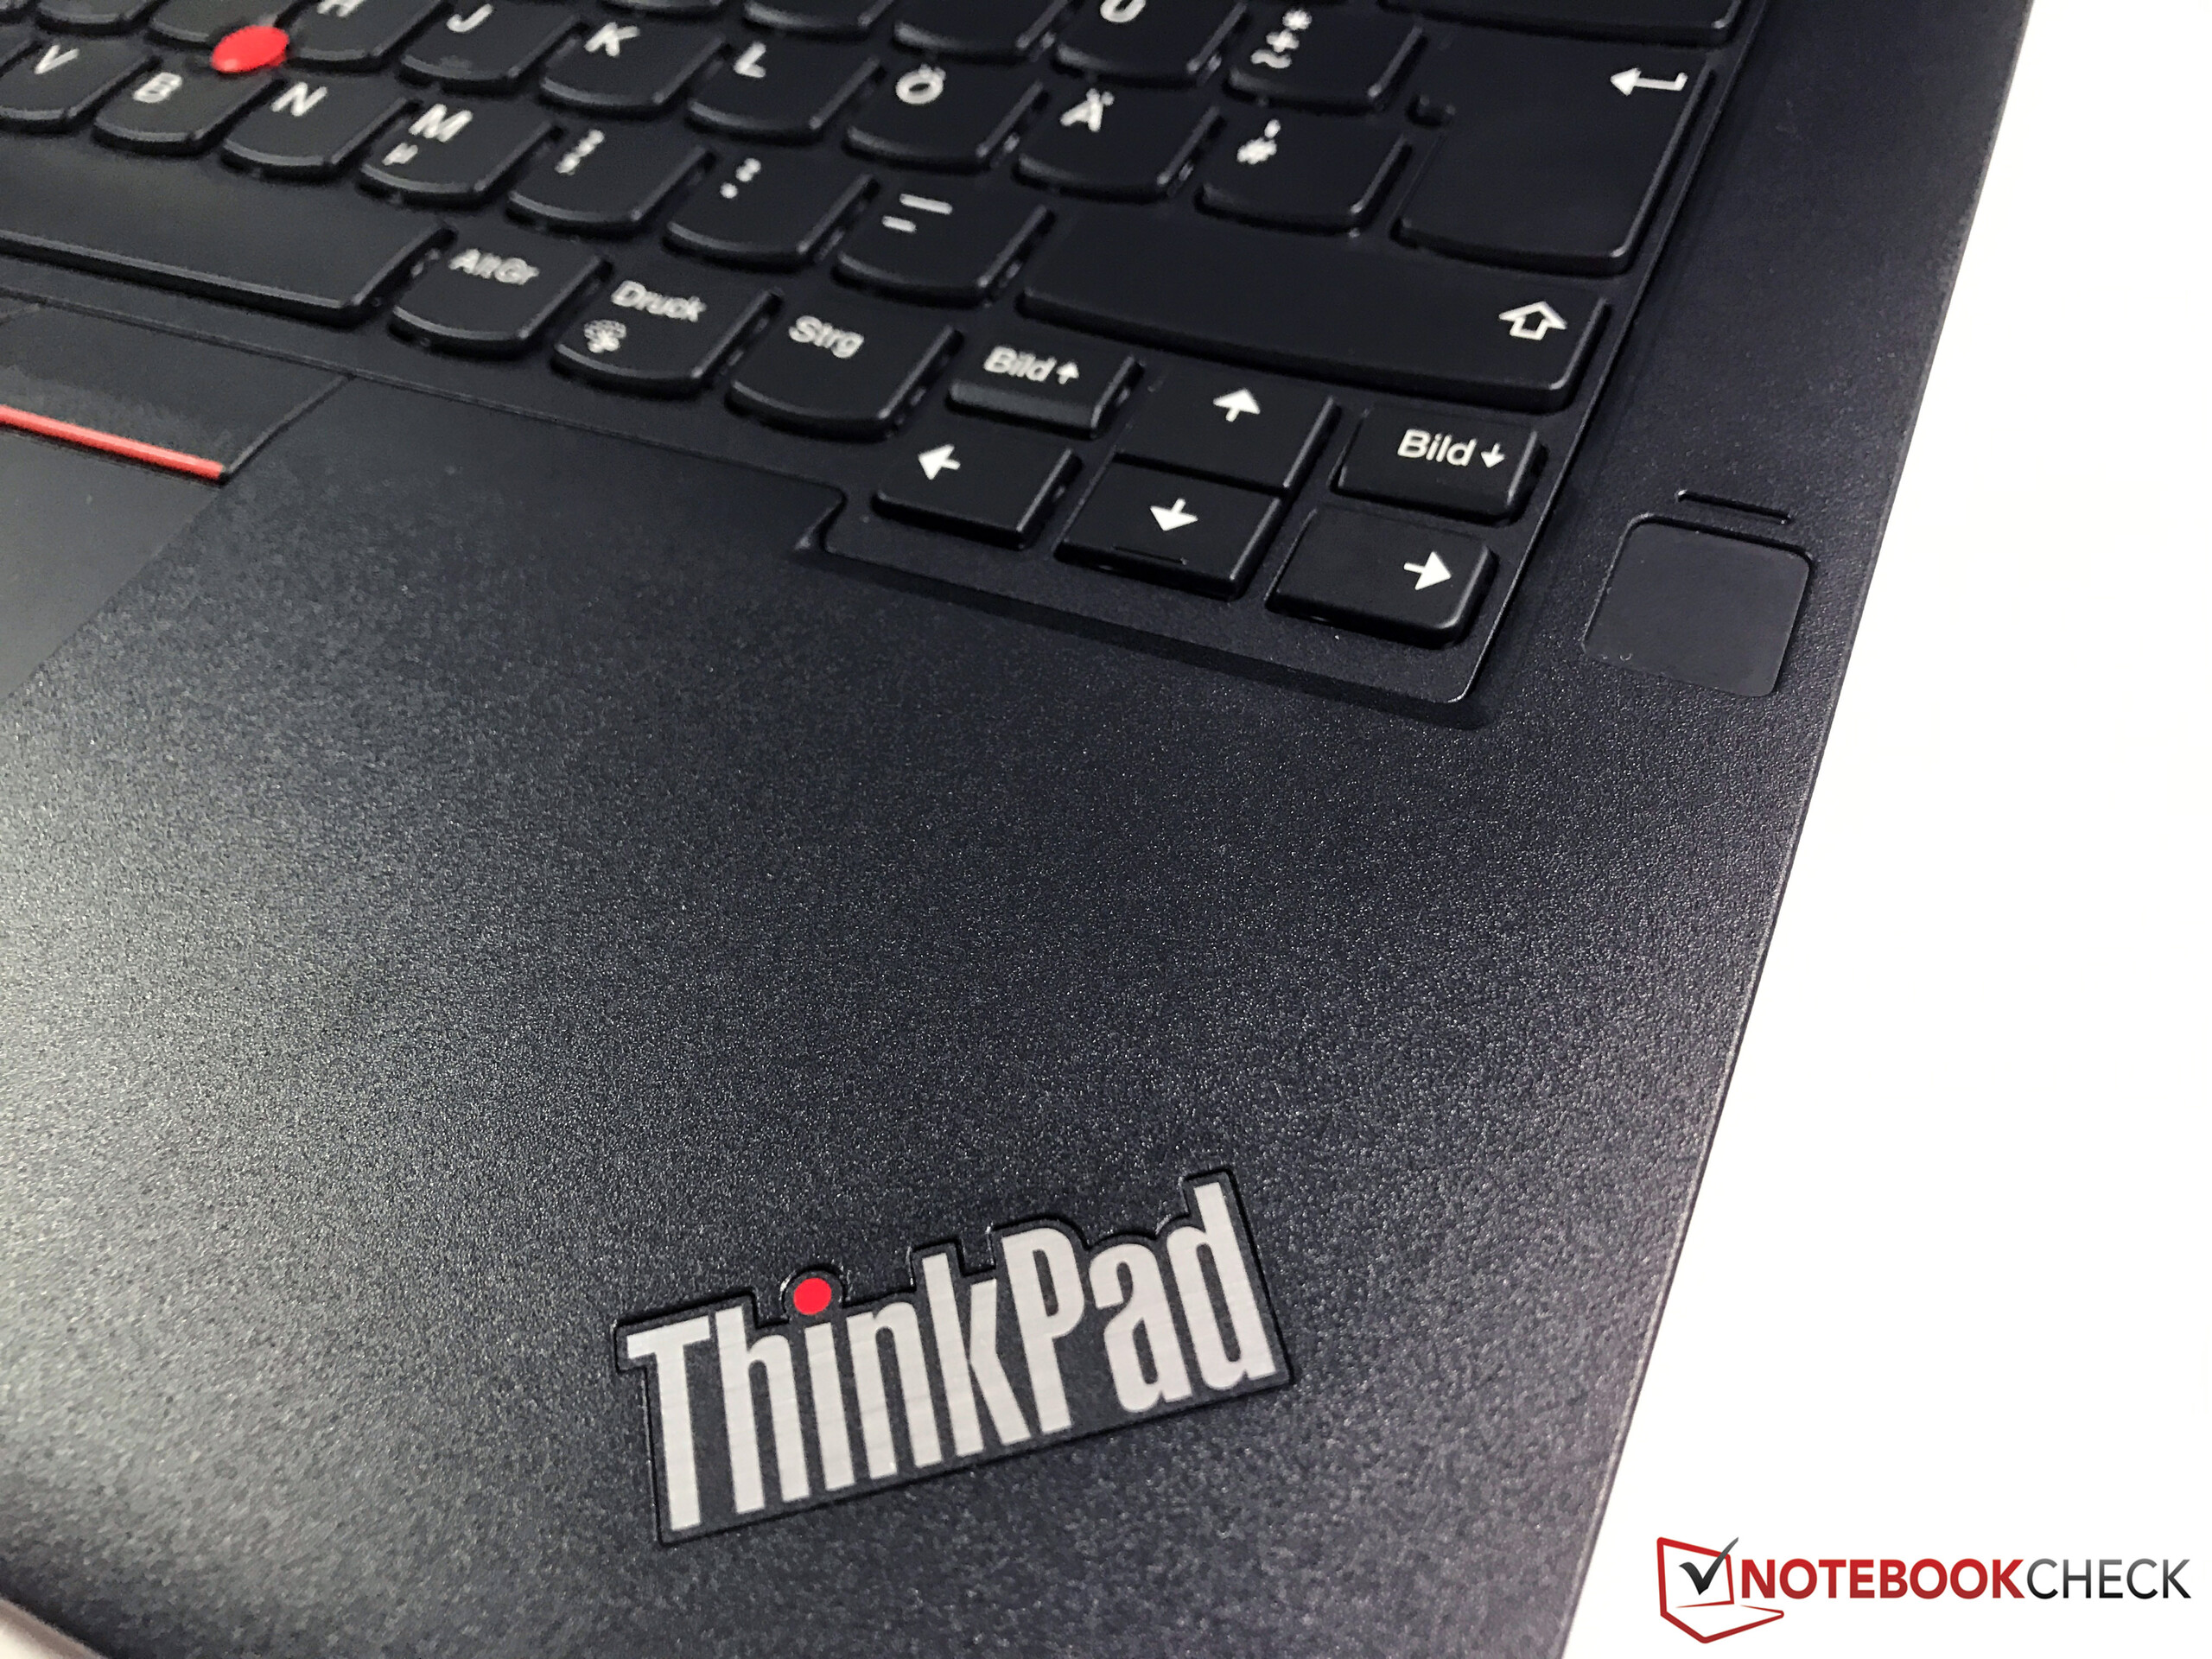
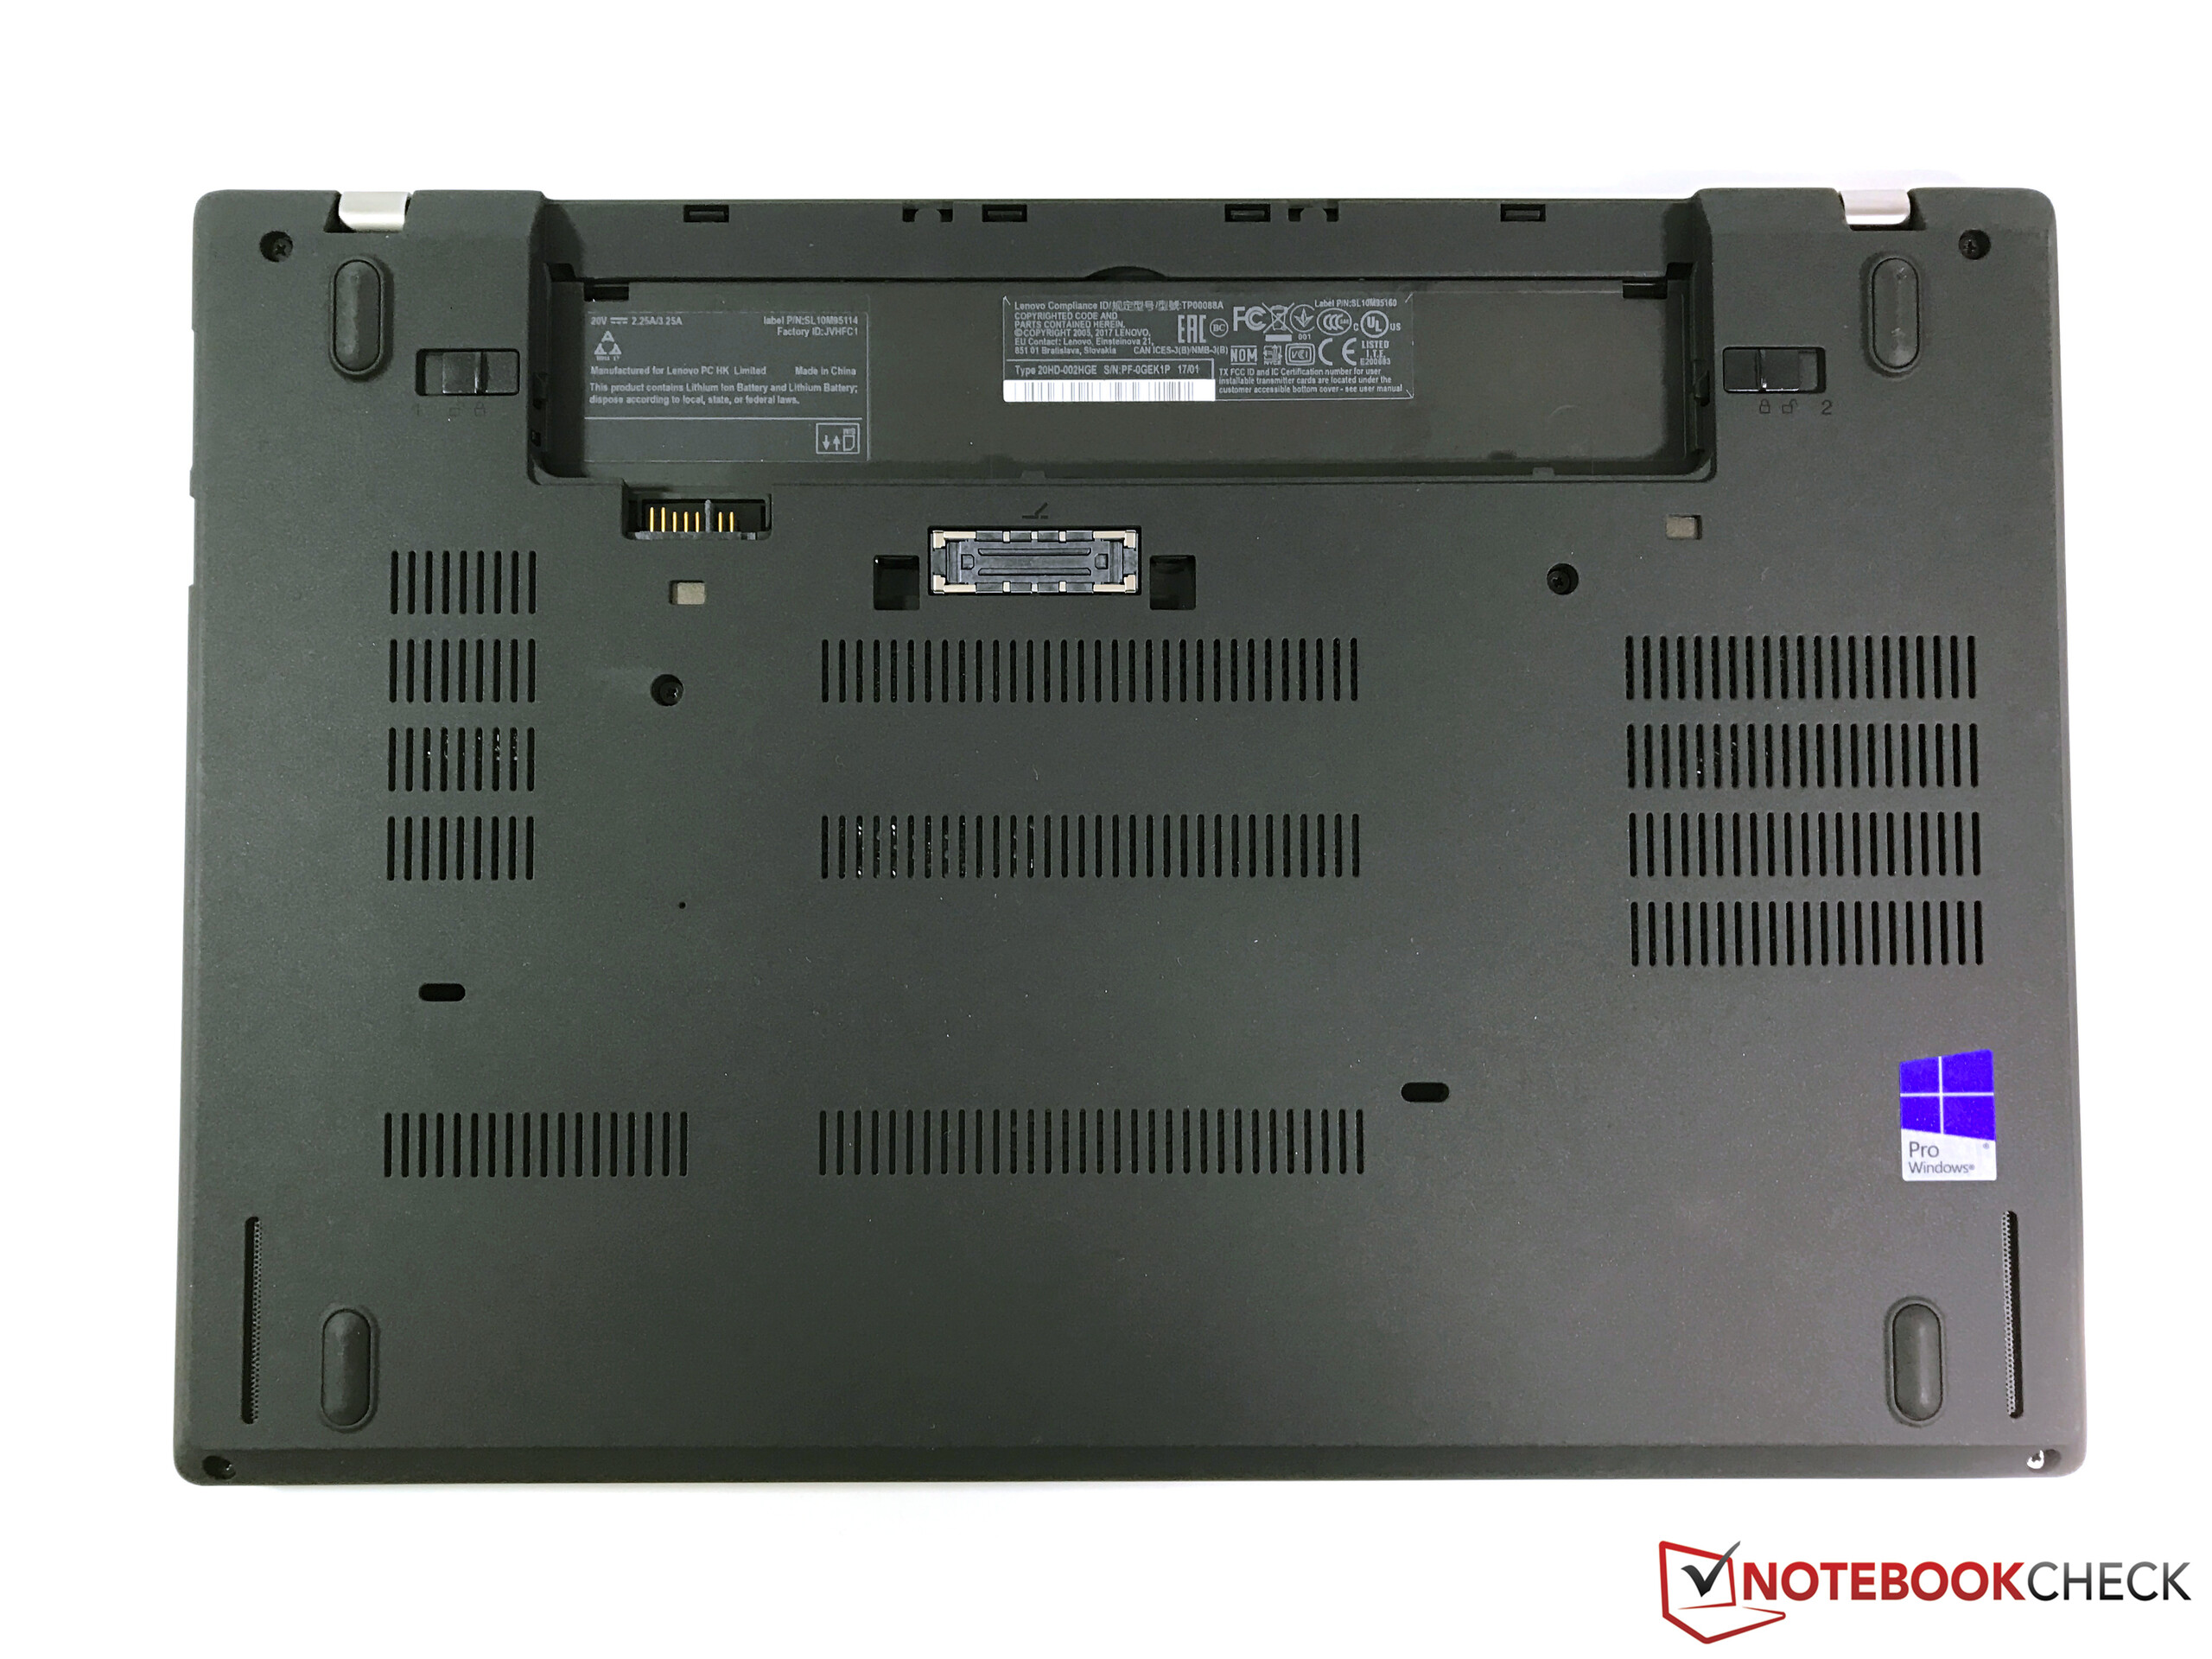
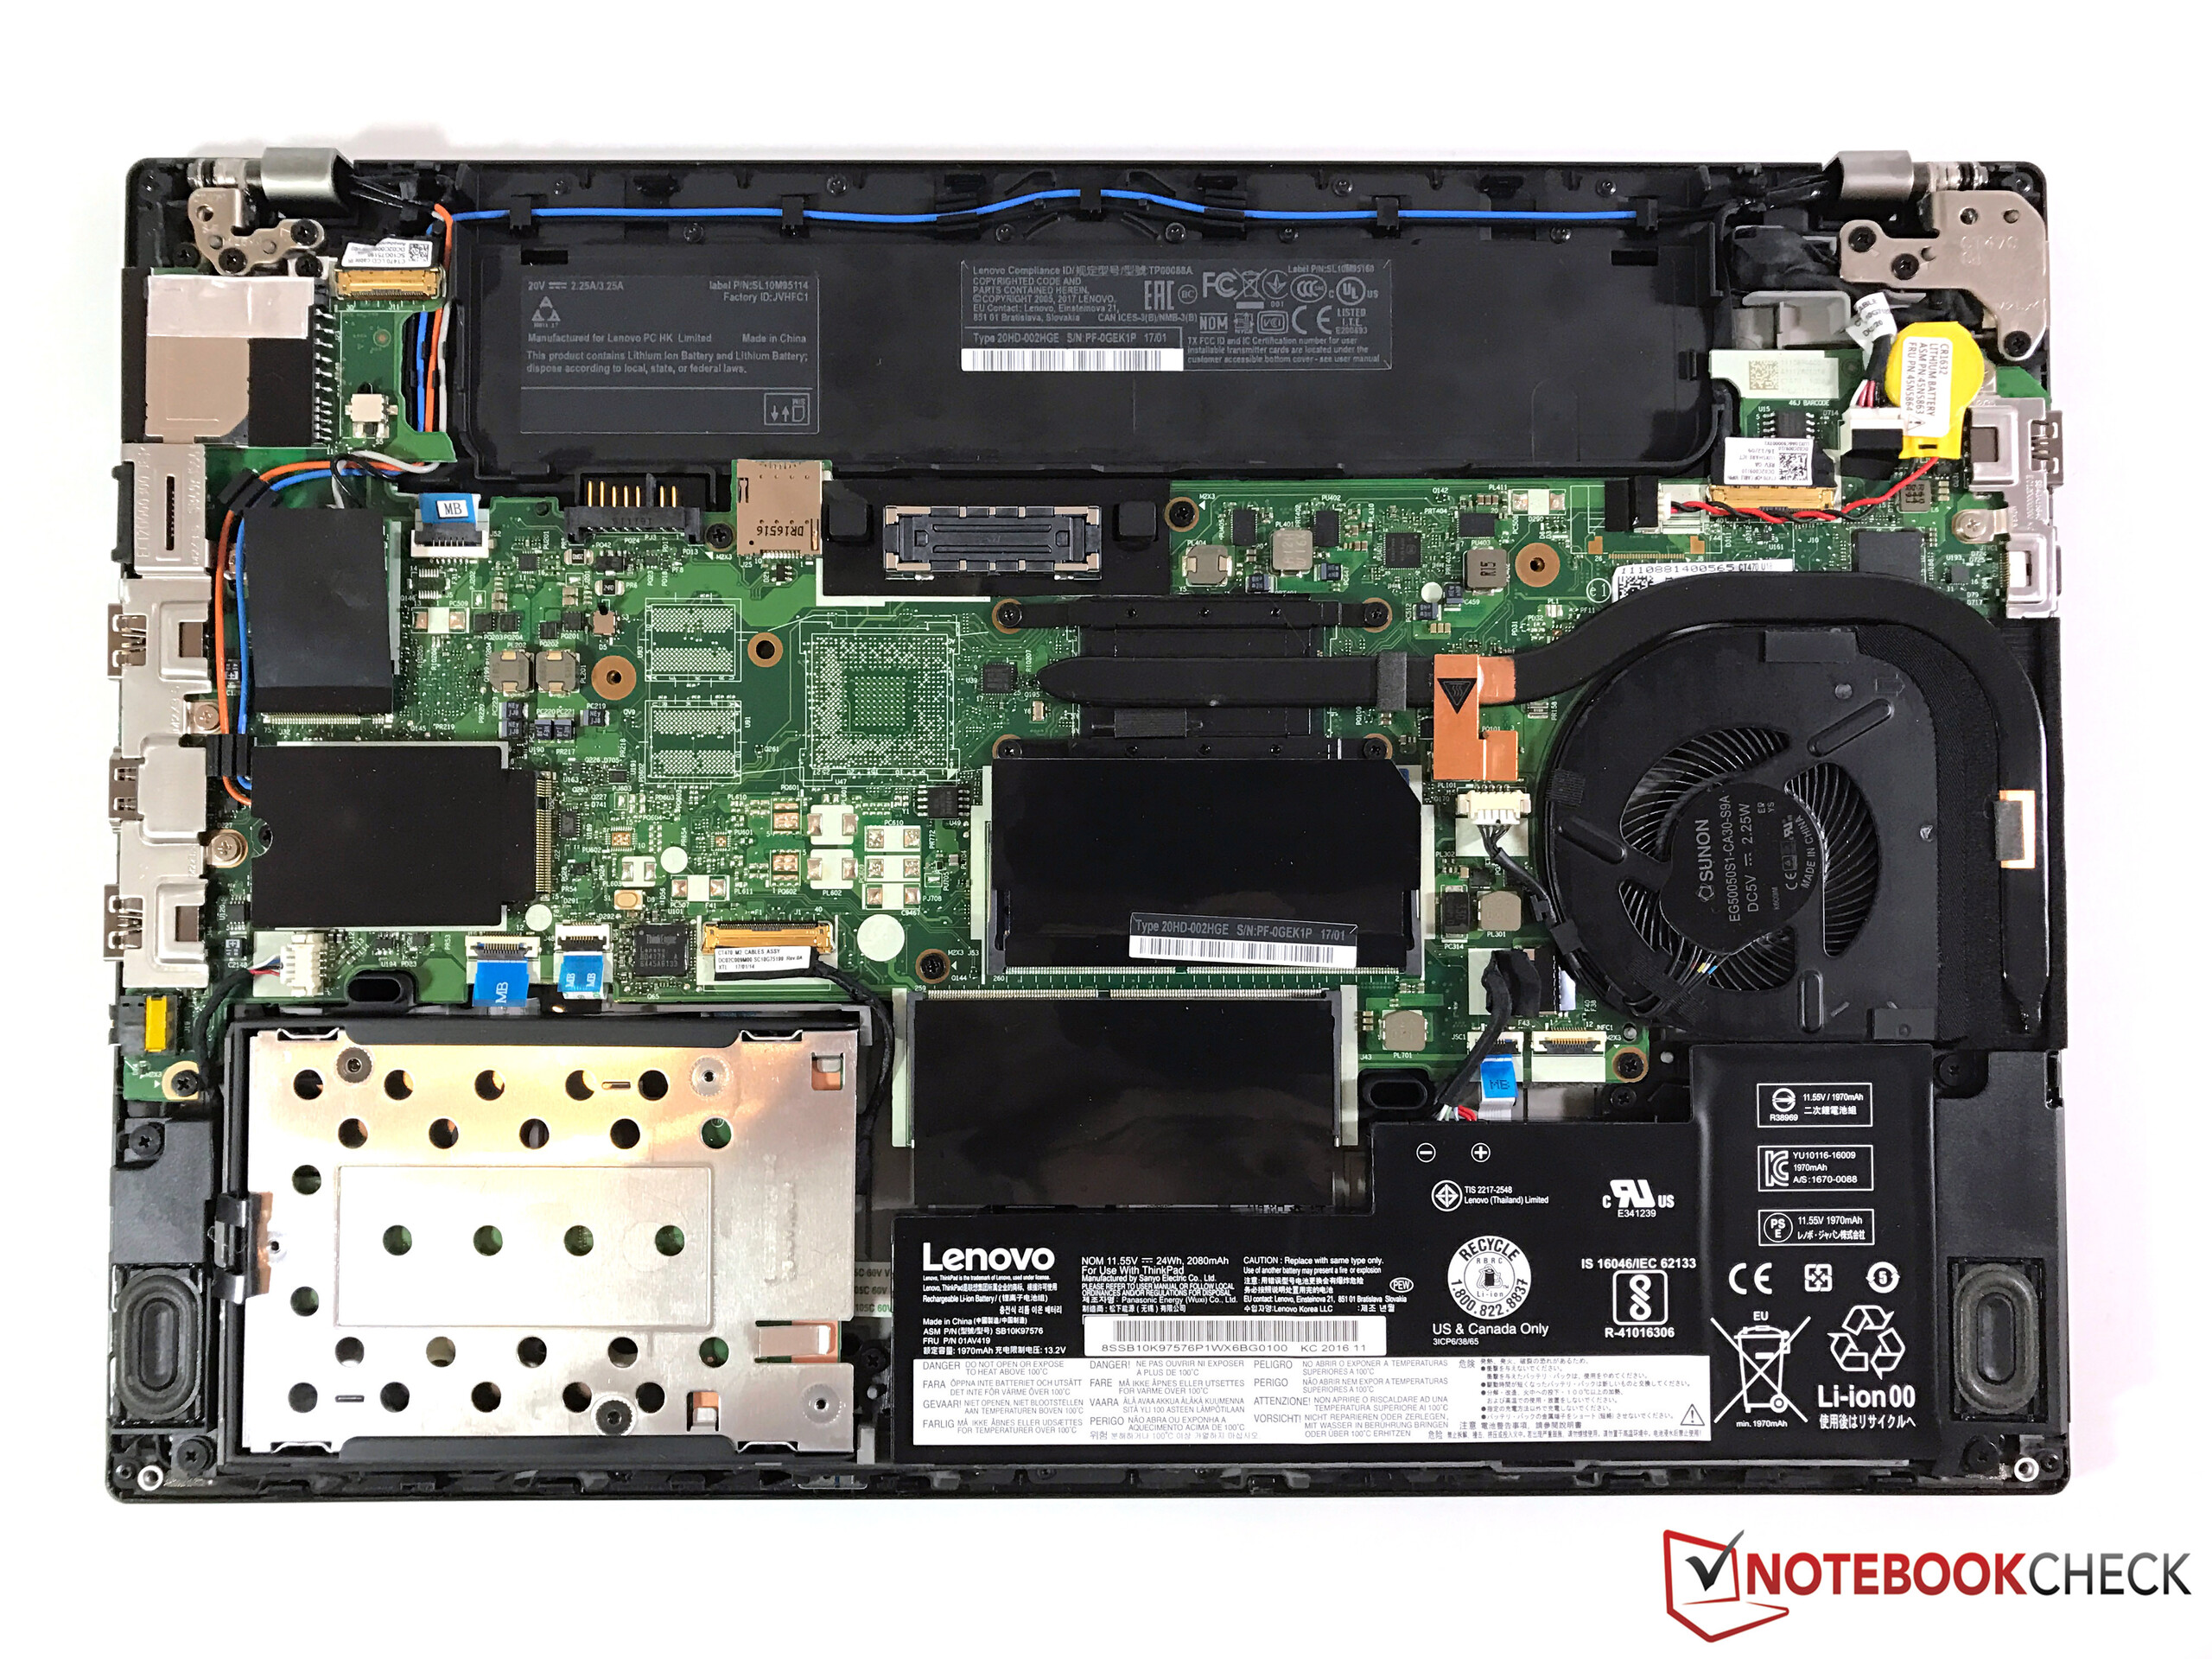
O novo ThinkPad T470 chega com um desempenho convincente em muitas seções, apesar de algumas desvantagens. O novo chassi é apenas um pouco menor e mais leve que antes, mas qualidade de construção e a estabilidade são muito bons. O teclado ainda é um dos melhores dispositivos de entrada no segmento mobile, mas uma iluminação de fundo um pouco mais brilhante seria boa.
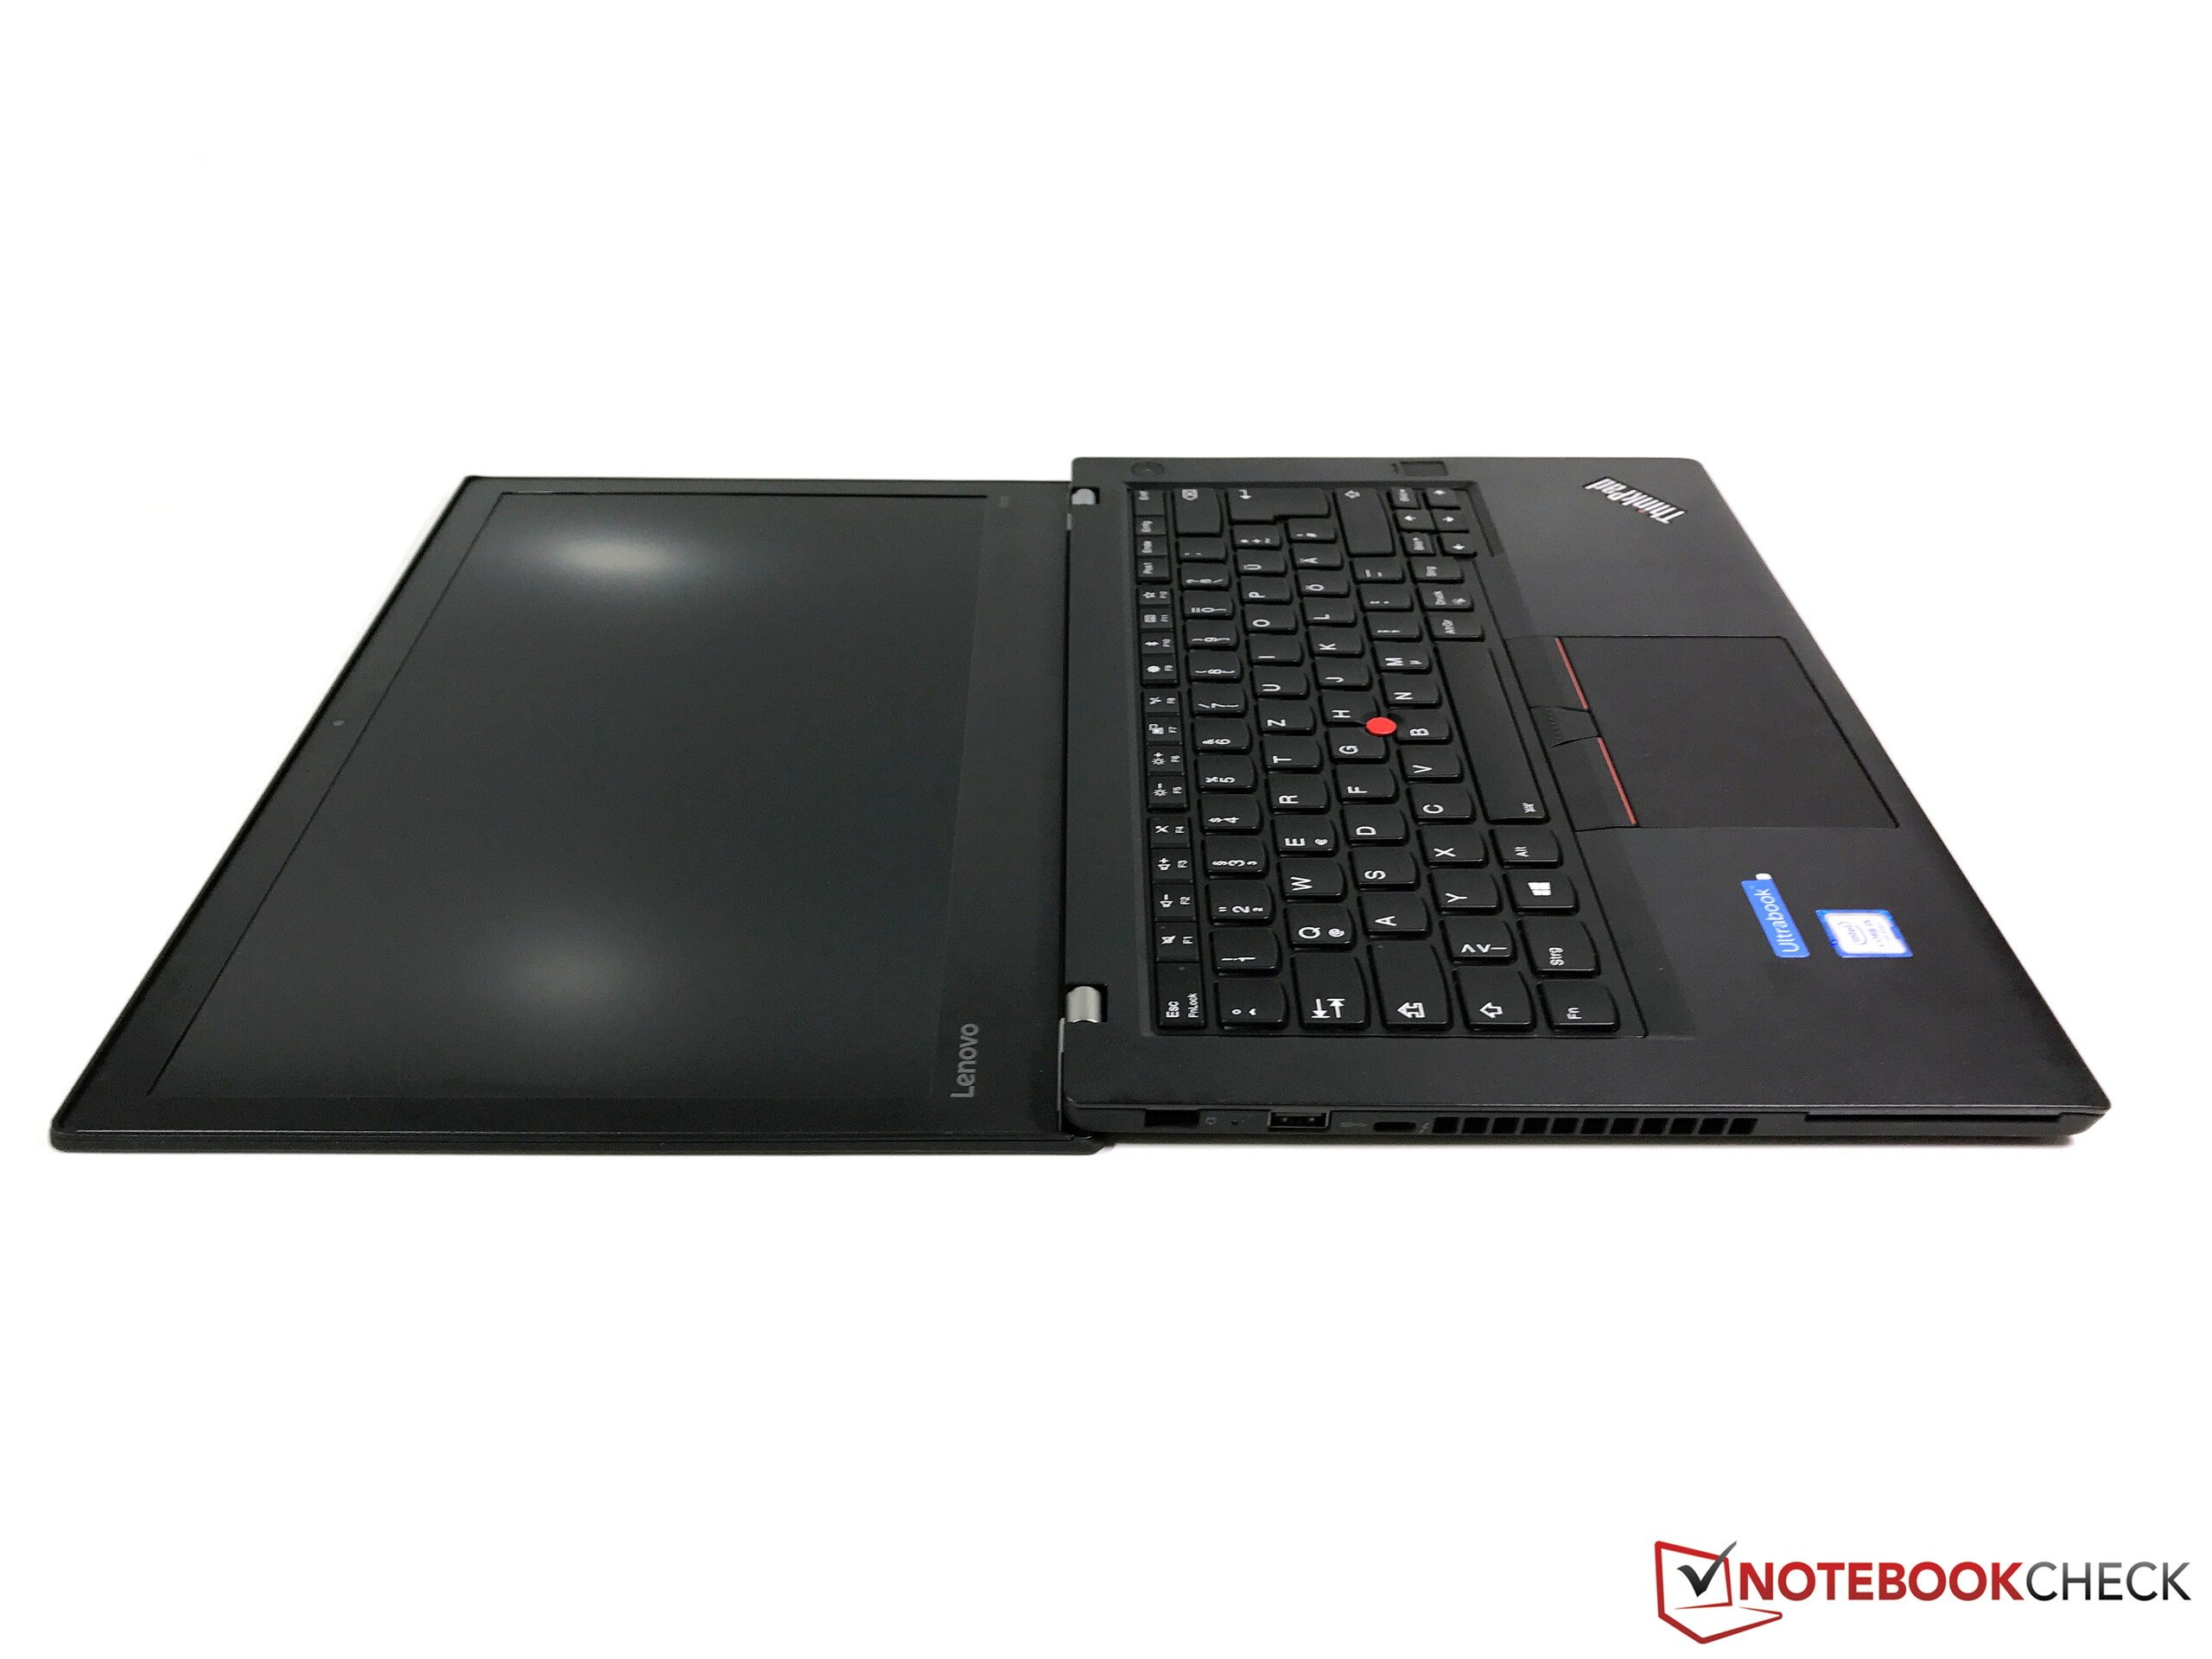
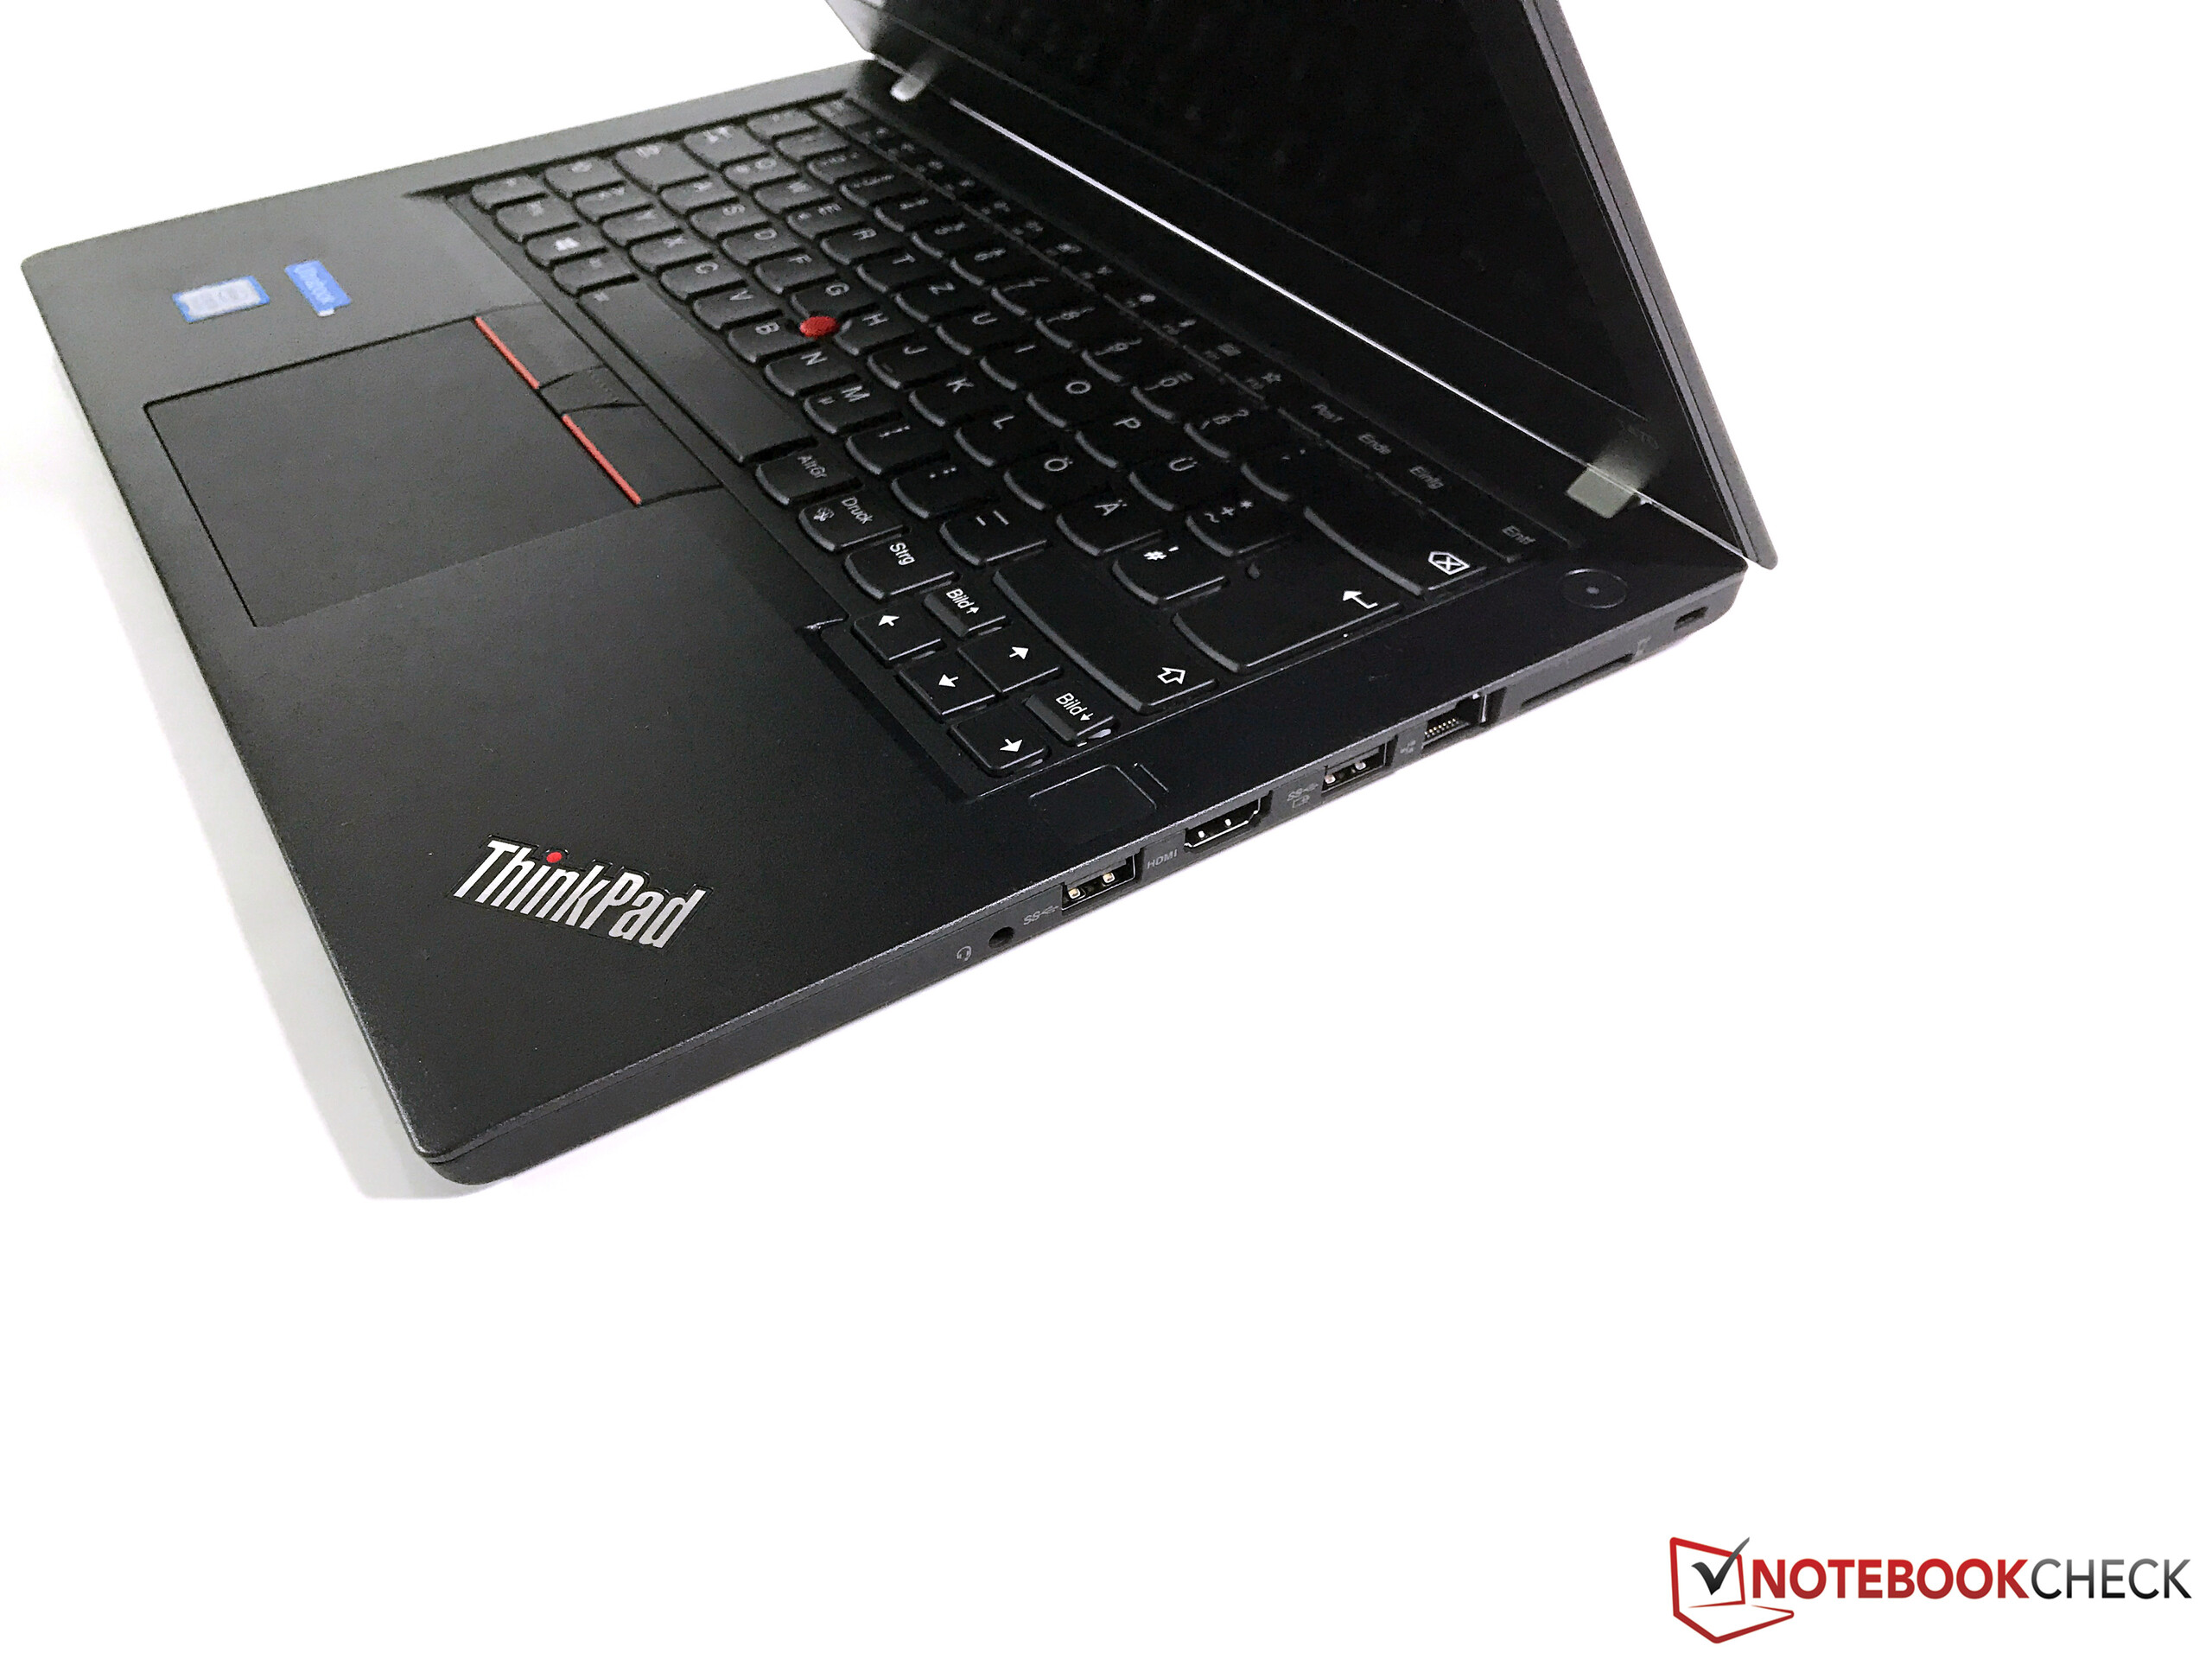
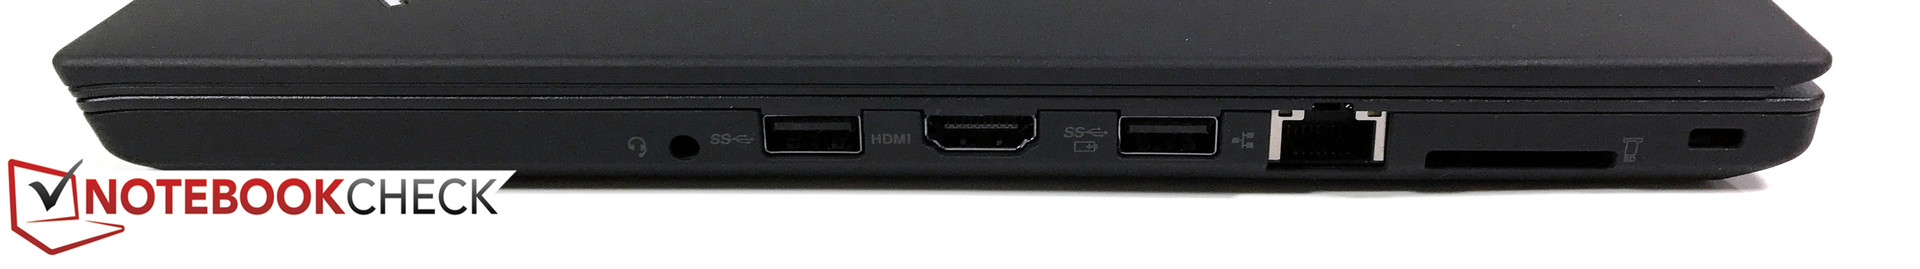
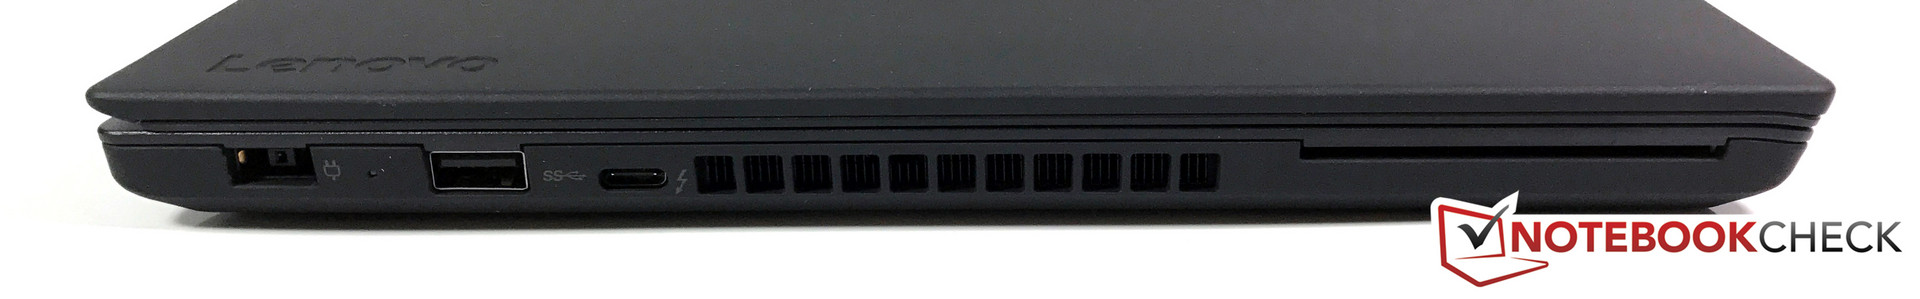
A Lenovo também melhorou a seleção das portas para esta atualização, e implementa todos os padrões importantes, incluindo o Thunderbolt 3. A conectividade é completada com o veloz módulo WiFi e os abrangentes recursos de segurança.
O desempenho do portátil é muito bom e não existem limites nem mesmo sob uso intenso. A Lenovo aumenta o consumo de energia do processador, por isso o processador Core i7 é – em comparação com muitos rivais – uma opção interessante. A solução de resfriamento não tem problemas com o chip ULV.
O Lenovo ThinkPad T470 é um muito bom portátil empresarial. Somente a edição de imagens não é possível no painel devido a sua limitada gama de cores e os desvios de cores comparativamente altos.
A tela ainda é uma das maiores desvantagens, embora a Lenovo tenha melhorado a iluminação, bem como a razão de contraste. Não é apta para a adição de imagens, mais uma vez você provavelmente terá que fazer o upgrade para o mais caro T470s (análise em breve) por este motivo. O ZenBook UX3410 recentemente lançado pela Asus, mostra como é uma boa tela de 14 polegadas. Obviamente preferiríamos um painel melhor, mas também devemos ter em mente o público alvo. A maioria das empresas não utilizará o ThinkPad T470 para a edição de imagens, e se o fizerem, o fariam em combinação com grandes monitores externos. Subjetivamente, no entanto, estamos contentes com o painel.
O último aspecto é o alto preço de mais de 1.600 Euros. No entanto, você também deve considerar a garantia de 3 anos de garantia no local, que normalmente é um upgrade opcional para a concorrência. O SSD NVMe de 512 GB também aumenta o preço. Você pode economizar um pouco de dinheiro com um SSD padrão, e isso não afetará notoriamente o desempenho subjetivo.
No geral, o ThinkPad T470 atualmente é um dos melhores portáteis de escritório graças às baixas emissões, os ótimos dispositivos de entrada, o bom desempenho, e longas durações da bateria. Premiamos este desempenho com o nosso Editor's Choice.
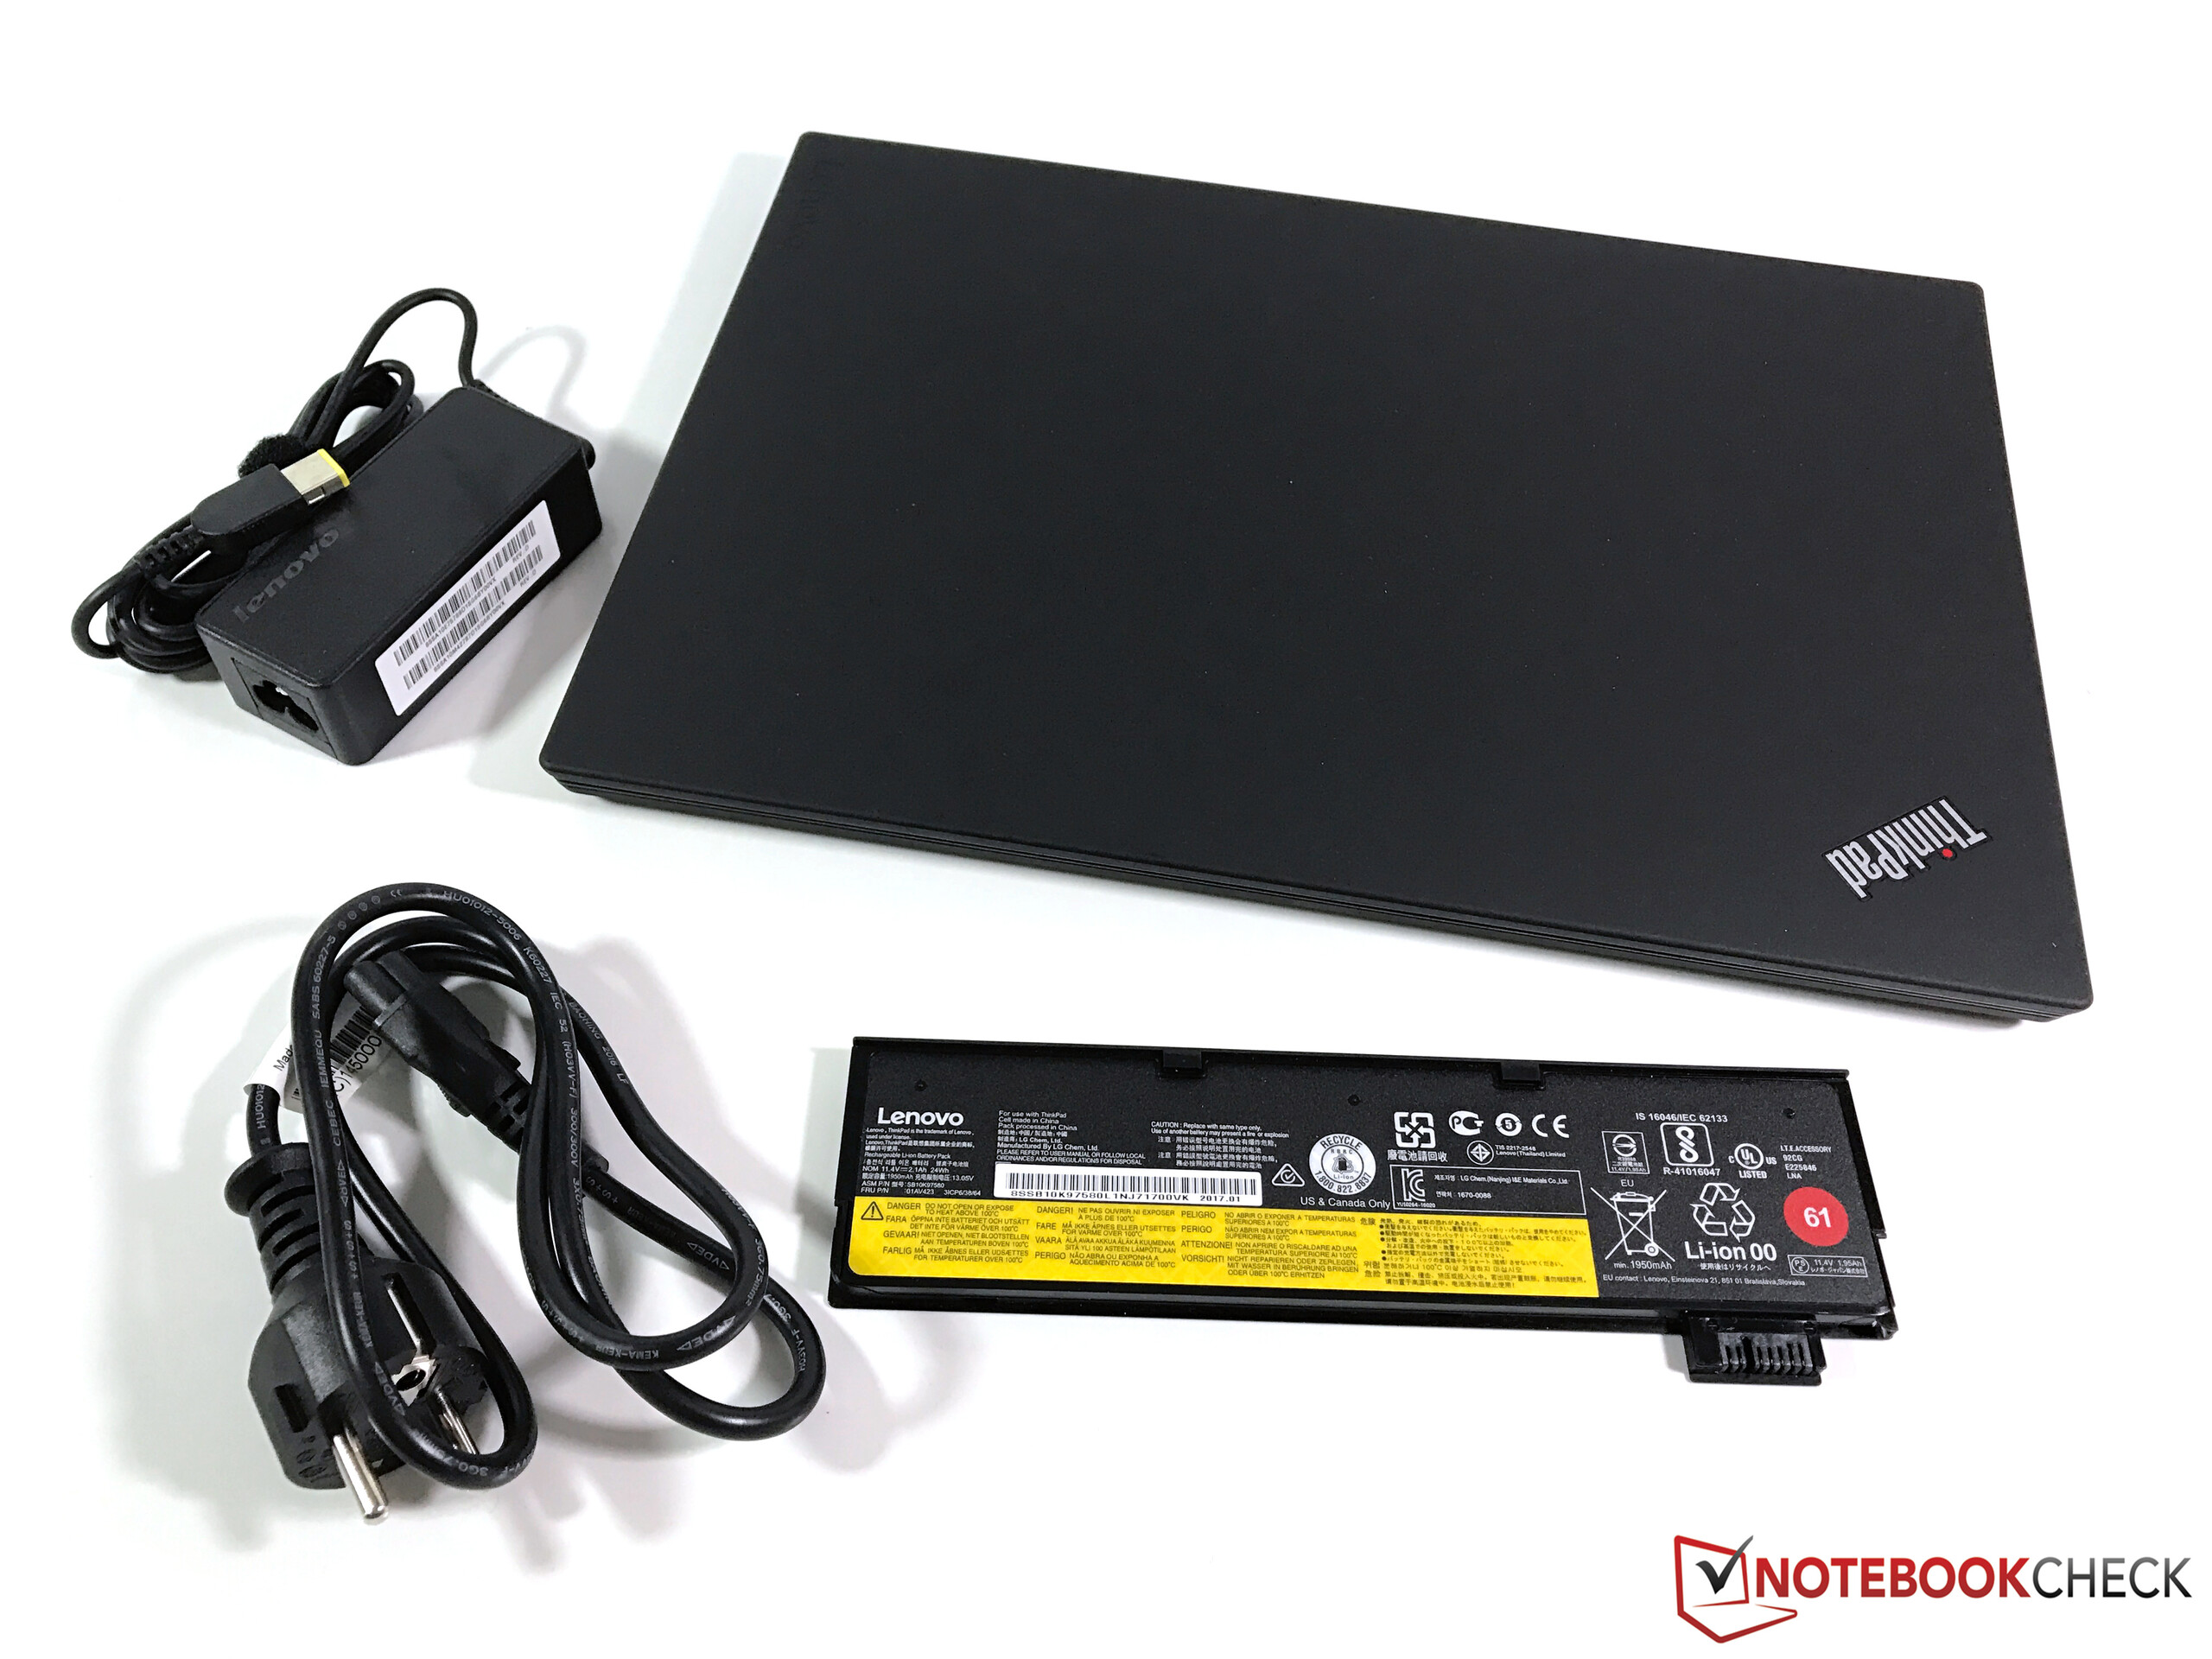
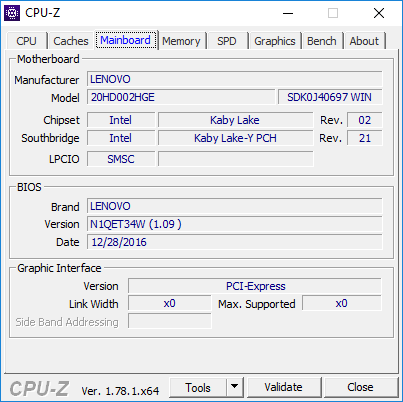
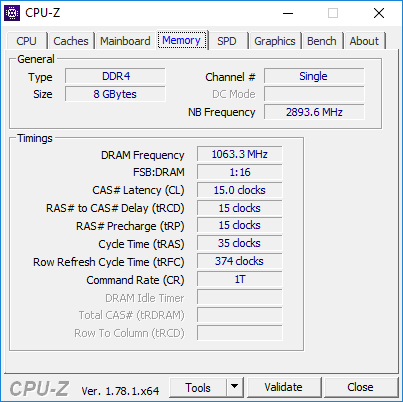
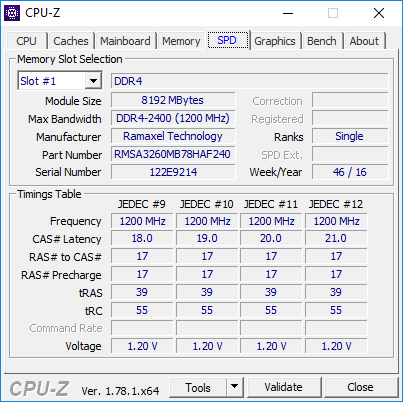
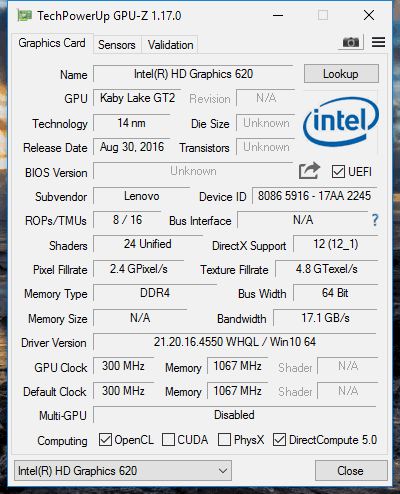
Lenovo ThinkPad T470-20HD002HGE
-
02/26/2017 v6(old)
Andreas Osthoff
Pricecompare
