Deutsch
 English
 Español
 Français
 Italiano
 Nederlands
 Polski
 Português
 Русский
 Türkçe
 Svenska
 Chinese
 Magyar
Breve Análise do Portátil MSI GE66 Raider 10SFS: Premiere pela RTX 2070 Super
Rating | Date | Model | Weight | Height | Size | Resolution | Best Price |
|---|---|---|---|---|---|---|---|
| 84.6 % | 07/2020 | MSI GE66 Raider 10SFS i9-10980HK, GeForce RTX 2070 Super Mobile | 2.4 kg | 23 mm | 15.60" | 1920x1080 | |
| 84.7 % | 12/2019 | MSI GE65 Raider 9SF-049US i9-9880H, GeForce RTX 2070 Mobile | 2.3 kg | 26.9 mm | 15.60" | 1920x1080 | |
| 86 % | 06/2019 | Asus Strix Scar III G531GW i9-9880H, GeForce RTX 2070 Mobile | 2.3 kg | 25 mm | 15.60" | 1920x1080 | |
| 85.9 % | Eurocom Nightsky RX15 i9-9980HK, GeForce RTX 2070 Mobile | 2.5 kg | 29.9 mm | 15.60" | 3840x2160 |

| SD Card Reader | |
| average JPG Copy Test (av. of 3 runs) | |
| MSI GE66 Raider 10SFS (Toshiba Exceria Pro SDXC 64 GB UHS-II) | |
| Eurocom Nightsky RX15 (Toshiba Exceria Pro SDXC 64 GB UHS-II) | |
| Average of class Gaming (19 - 202, n=100, last 2 years) | |
| MSI GE65 Raider 9SF-049US (Toshiba Exceria Pro SDXC 64 GB UHS-II) | |
| maximum AS SSD Seq Read Test (1GB) | |
| Eurocom Nightsky RX15 (Toshiba Exceria Pro SDXC 64 GB UHS-II) | |
| MSI GE66 Raider 10SFS (Toshiba Exceria Pro SDXC 64 GB UHS-II) | |
| Average of class Gaming (26 - 269, n=93, last 2 years) | |
| MSI GE65 Raider 9SF-049US (Toshiba Exceria Pro SDXC 64 GB UHS-II) | |
| Networking | |
| iperf3 transmit AX12 | |
| MSI GE66 Raider 10SFS | |
| Average of class Gaming (885 - 1412, n=5, last 2 years) | |
| Eurocom Nightsky RX15 | |
| Asus Strix Scar III G531GW | |
| iperf3 receive AX12 | |
| MSI GE66 Raider 10SFS | |
| Average of class Gaming (881 - 1700, n=5, last 2 years) | |
| Eurocom Nightsky RX15 | |
| Asus Strix Scar III G531GW | |


| |||||||||||||||||||||||||
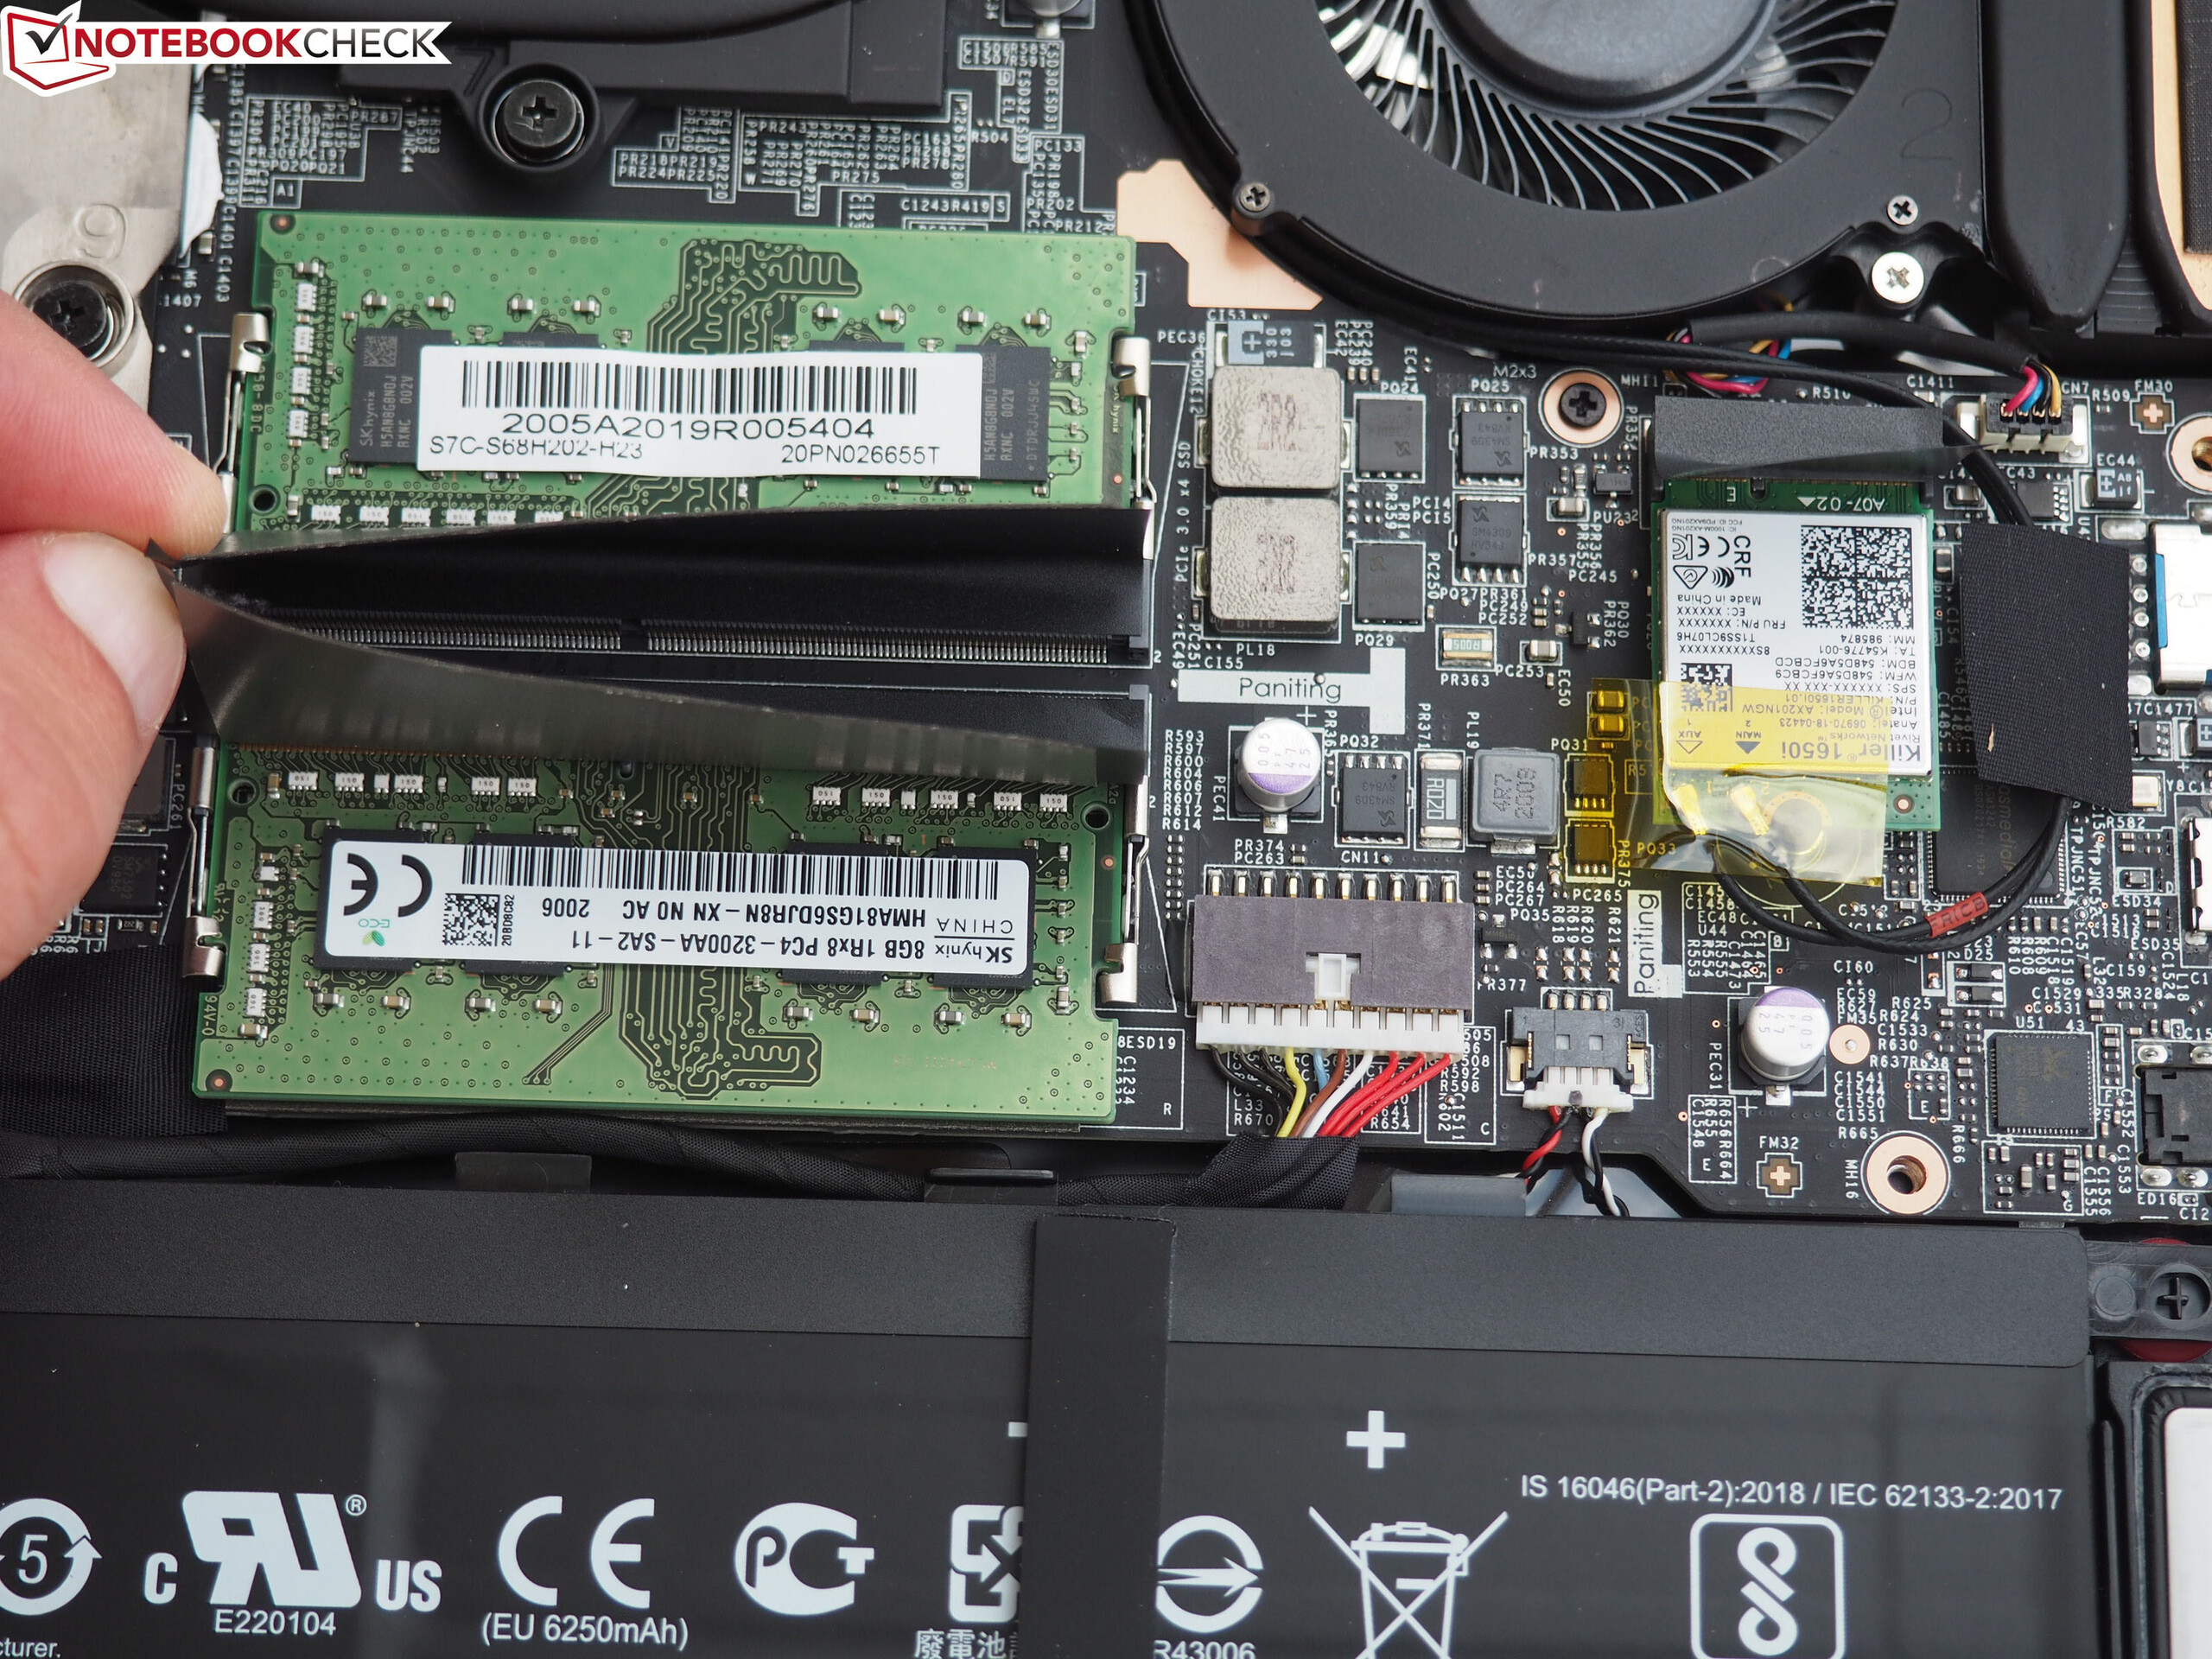
iluminação: 91 %
iluminação com acumulador: 291 cd/m²
Contraste: 1164:1 (Preto: 0.25 cd/m²)
ΔE Color 1.19 | 0.5-29.43 Ø5
ΔE Greyscale 1.9 | 0.57-98 Ø5.3
92% sRGB (Argyll 1.6.3 3D)
70% AdobeRGB 1998 (Argyll 1.6.3 3D)
69.8% AdobeRGB 1998 (Argyll 2.2.0 3D)
99% sRGB (Argyll 2.2.0 3D)
68% Display P3 (Argyll 2.2.0 3D)
Gamma: 2.216
| MSI GE66 Raider 10SFS Sharp LQ156M1JW03 (SHP14C5), IPS-Level, 1920x1080 | MSI GE65 Raider 9SF-049US Sharp LQ156M1JW03, IPS, 1920x1080 | Asus Strix Scar III G531GW Sharp LQ156M1JW09 (SHP14D3), IPS, 1920x1080 | Eurocom Nightsky RX15 Samsung SDCA029, OLED, 3840x2160 | |
|---|---|---|---|---|
| Display | 1% | -3% | 30% | |
| Display P3 Coverage | 68 | 69.3 2% | 66.2 -3% | 99.9 47% |
| sRGB Coverage | 99 | 98.9 0% | 96.5 -3% | 100 1% |
| AdobeRGB 1998 Coverage | 69.8 | 70.7 1% | 67.5 -3% | 99.1 42% |
| Response Times | 3% | -4% | 20% | |
| Response Time Grey 50% / Grey 80% * | 16.4 ? | 13.2 ? 20% | 17.2 ? -5% | 2.4 ? 85% |
| Response Time Black / White * | 10.4 ? | 11.2 ? -8% | 11.2 ? -8% | 2.6 ? 75% |
| PWM Frequency | 23580 ? | 23150 ? -2% | 24040 ? 2% | 59.5 ? -100% |
| Screen | -19% | -14% | -107% | |
| Brightness middle | 291 | 277.4 -5% | 266 -9% | 414.9 43% |
| Brightness | 278 | 264 -5% | 252 -9% | 404 45% |
| Brightness Distribution | 91 | 90 -1% | 88 -3% | 88 -3% |
| Black Level * | 0.25 | 0.24 4% | 0.27 -8% | |
| Contrast | 1164 | 1156 -1% | 985 -15% | |
| Colorchecker dE 2000 * | 1.19 | 1.51 -27% | 1.81 -52% | 7.58 -537% |
| Colorchecker dE 2000 max. * | 3.04 | 4.93 -62% | 3.23 -6% | 14.85 -388% |
| Greyscale dE 2000 * | 1.9 | 3.7 -95% | 2.44 -28% | 2.9 -53% |
| Gamma | 2.216 99% | 2.23 99% | 2.42 91% | 2.05 107% |
| CCT | 7018 93% | 7061 92% | 7005 93% | 6538 99% |
| Color Space (Percent of AdobeRGB 1998) | 70 | 65.1 -7% | 62 -11% | 88.2 26% |
| Color Space (Percent of sRGB) | 92 | 99.1 8% | 97 5% | 100 9% |
| Colorchecker dE 2000 calibrated * | 1.77 | 1.03 | ||
| Total Average (Program / Settings) | -5% /
-11% | -7% /
-10% | -19% /
-51% |
* ... smaller is better
Display Response Times
| ↔ Response Time Black to White | ||
|---|---|---|
| 10.4 ms ... rise ↗ and fall ↘ combined | ↗ 6 ms rise | 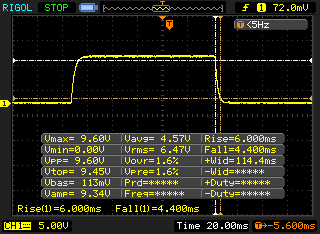 |
| ↘ 4.4 ms fall | ||
| The screen shows good response rates in our tests, but may be too slow for competitive gamers. In comparison, all tested devices range from 0.1 (minimum) to 240 (maximum) ms. » 23 % of all devices are better. This means that the measured response time is better than the average of all tested devices (21.5 ms). | ||
| ↔ Response Time 50% Grey to 80% Grey | ||
| 16.4 ms ... rise ↗ and fall ↘ combined | ↗ 6.8 ms rise | 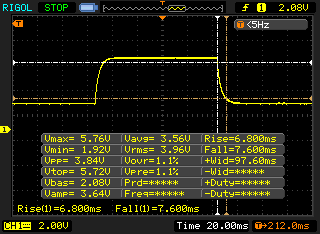 |
| ↘ 7.6 ms fall | ||
| The screen shows good response rates in our tests, but may be too slow for competitive gamers. In comparison, all tested devices range from 0.2 (minimum) to 636 (maximum) ms. » 25 % of all devices are better. This means that the measured response time is better than the average of all tested devices (33.8 ms). | ||
Screen Flickering / PWM (Pulse-Width Modulation)
| Screen flickering / PWM detected | 23580 Hz | ≤ 19 % brightness setting | 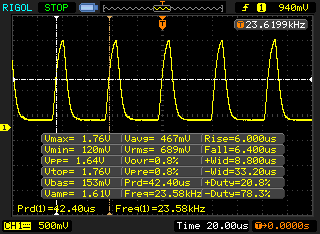 |
The display backlight flickers at 23580 Hz (worst case, e.g., utilizing PWM) Flickering detected at a brightness setting of 19 % and below. There should be no flickering or PWM above this brightness setting. The frequency of 23580 Hz is quite high, so most users sensitive to PWM should not notice any flickering. In comparison: 53 % of all tested devices do not use PWM to dim the display. If PWM was detected, an average of 17933 (minimum: 5 - maximum: 3846000) Hz was measured. | |||
| Cinebench R15 | |
| CPU Single 64Bit | |
| Average of class Gaming (79.2 - 318, n=230, last 2 years) | |
| MSI GE66 Raider 10SFS | |
| Eurocom Nightsky RX15 | |
| MSI GE65 Raider 9SF-049US | |
| Asus Strix Scar III G531GW | |
| CPU Multi 64Bit | |
| Average of class Gaming (400 - 5663, n=231, last 2 years) | |
| Eurocom Nightsky RX15 | |
| MSI GE66 Raider 10SFS | |
| MSI GE65 Raider 9SF-049US | |
| Asus Strix Scar III G531GW | |
| Blender - v2.79 BMW27 CPU | |
| Eurocom Nightsky RX15 | |
| MSI GE66 Raider 10SFS | |
| Average of class Gaming (87 - 1259, n=225, last 2 years) | |
| 7-Zip 18.03 | |
| 7z b 4 -mmt1 | |
| Average of class Gaming (2685 - 7581, n=226, last 2 years) | |
| MSI GE66 Raider 10SFS | |
| Eurocom Nightsky RX15 | |
| 7z b 4 | |
| Average of class Gaming (11386 - 140932, n=226, last 2 years) | |
| MSI GE66 Raider 10SFS | |
| Eurocom Nightsky RX15 | |
| Cinebench R20 | |
| CPU (Single Core) | |
| Average of class Gaming (169 - 855, n=227, last 2 years) | |
| Eurocom Nightsky RX15 | |
| MSI GE66 Raider 10SFS | |
| MSI GE65 Raider 9SF-049US | |
| CPU (Multi Core) | |
| Average of class Gaming (930 - 13769, n=227, last 2 years) | |
| MSI GE66 Raider 10SFS | |
| Eurocom Nightsky RX15 | |
| MSI GE65 Raider 9SF-049US | |
| Geekbench 5.5 | |
| Single-Core | |
| Average of class Gaming (158 - 2193, n=231, last 2 years) | |
| MSI GE66 Raider 10SFS | |
| Multi-Core | |
| Average of class Gaming (1946 - 22200, n=231, last 2 years) | |
| MSI GE66 Raider 10SFS | |
| HWBOT x265 Benchmark v2.2 - 4k Preset | |
| Average of class Gaming (3 - 37.6, n=229, last 2 years) | |
| MSI GE66 Raider 10SFS | |
| Eurocom Nightsky RX15 | |
| LibreOffice - 20 Documents To PDF | |
| MSI GE66 Raider 10SFS | |
| Average of class Gaming (32.8 - 332, n=223, last 2 years) | |
| R Benchmark 2.5 - Overall mean | |
| MSI GE66 Raider 10SFS | |
| Average of class Gaming (0.3609 - 4.47, n=226, last 2 years) | |
* ... smaller is better
| PCMark 10 - Score | |
| Average of class Gaming (5235 - 9852, n=197, last 2 years) | |
| MSI GE65 Raider 9SF-049US | |
| Eurocom Nightsky RX15 | |
| MSI GE66 Raider 10SFS | |
| Asus Strix Scar III G531GW | |
| DPC Latencies / LatencyMon - interrupt to process latency (max), Web, Youtube, Prime95 | |
| MSI GE66 Raider 10SFS | |
* ... smaller is better
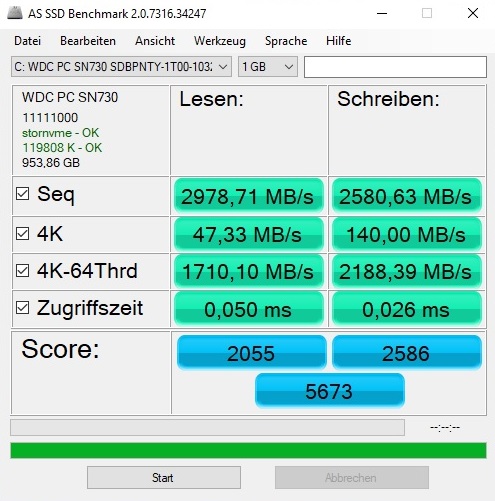
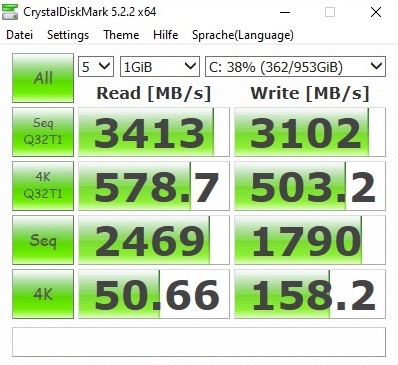
| MSI GE66 Raider 10SFS WDC PC SN730 SDBPNTY-1T00 | MSI GE65 Raider 9SF-049US Samsung SSD PM981 MZVLB1T0HALR | Asus Strix Scar III G531GW Intel SSD 660p 1TB SSDPEKNW010T8 | Eurocom Nightsky RX15 Samsung SSD 970 Pro 512GB | |
|---|---|---|---|---|
| CrystalDiskMark 5.2 / 6 | -9% | -18% | -3% | |
| Write 4K | 158.2 | 125.7 -21% | 135 -15% | 153 -3% |
| Read 4K | 50.7 | 45.04 -11% | 54.9 8% | 60.5 19% |
| Write Seq | 1790 | 2361 32% | 1649 -8% | 1938 8% |
| Read Seq | 2469 | 1987 -20% | 1449 -41% | 1932 -22% |
| Write 4K Q32T1 | 503 | 407.1 -19% | 508 1% | 482.5 -4% |
| Read 4K Q32T1 | 579 | 537 -7% | 559 -3% | 594 3% |
| Write Seq Q32T1 | 3102 | 2398 -23% | 1759 -43% | 2324 -25% |
| Read Seq Q32T1 | 3413 | 3309 -3% | 1826 -46% | 3539 4% |

Continuous load read: DiskSpd Read Loop, Queue Depth 8
| 3DMark 06 Standard Score | 43041 pontos | |
| 3DMark Vantage P Result | 70601 pontos | |
| 3DMark 11 Performance | 24989 pontos | |
| 3DMark Cloud Gate Standard Score | 50695 pontos | |
| 3DMark Fire Strike Score | 19884 pontos | |
| 3DMark Time Spy Score | 8419 pontos | |
Ajuda | ||
| 3DMark | |
| 1920x1080 Fire Strike Graphics | |
| Average of class Gaming (781 - 53059, n=233, last 2 years) | |
| MSI GE66 Raider 10SFS | |
| MSI GE65 Raider 9SF-049US | |
| Eurocom Nightsky RX15 | |
| Asus Strix Scar III G531GW | |
| 2560x1440 Time Spy Graphics | |
| Average of class Gaming (224 - 22547, n=231, last 2 years) | |
| MSI GE66 Raider 10SFS | |
| MSI GE65 Raider 9SF-049US | |
| Eurocom Nightsky RX15 | |
| Asus Strix Scar III G531GW | |
| 2560x1440 Port Royal Graphics | |
| Average of class Gaming (280 - 14457, n=152, last 2 years) | |
| MSI GE66 Raider 10SFS | |
| MSI GE65 Raider 9SF-049US | |
| Eurocom Nightsky RX15 | |
| 3DMark 11 - 1280x720 Performance GPU | |
| Average of class Gaming (1029 - 72070, n=229, last 2 years) | |
| MSI GE66 Raider 10SFS | |
| Eurocom Nightsky RX15 | |
| MSI GE65 Raider 9SF-049US | |
| Asus Strix Scar III G531GW | |
| The Witcher 3 - 1920x1080 Ultra Graphics & Postprocessing (HBAO+) | |
| Average of class Gaming (8.61 - 216, n=225, last 2 years) | |
| MSI GE66 Raider 10SFS | |
| Eurocom Nightsky RX15 | |
| MSI GE65 Raider 9SF-049US | |
| Asus Strix Scar III G531GW | |
| baixo | média | alto | ultra | QHD | 4K | |
| GTA V (2015) | 182 | 177 | 163 | 94 | ||
| The Witcher 3 (2015) | 268 | 161 | 85.1 | 57.6 | ||
| Dota 2 Reborn (2015) | 155 | 141 | 133 | 126 | ||
| Fortnite (2018) | 164 | 156 | 129 | 93.4 | 47.9 | |
| Final Fantasy XV Benchmark (2018) | 121 | 91.1 | 37.7 | |||
| Kingdom Come: Deliverance (2018) | 146 | 119 | 82.5 | 59.7 | 31.1 | |
| X-Plane 11.11 (2018) | 117 | 103 | 87 | |||
| Monster Hunter World (2018) | 130 | 120 | 98.9 | 63.9 | 32.1 | |
| Shadow of the Tomb Raider (2018) | 123 | 118 | 108 | 73 | 37 | |
| Assassin´s Creed Odyssey (2018) | 104 | 90 | 63 | 56 | 36 | |
| Hitman 2 (2018) | 98.8 | 89.7 | 82.5 | 78.8 | 46.4 | |
| Battlefield V (2018) | 166 | 152 | 141 | 110 | 62.7 | |
| Darksiders III (2018) | 166 | 141 | 127 | 88.3 | 44 | |
| Just Cause 4 (2018) | 162 | 119 | 105 | 75 | 41.2 | |
| Apex Legends (2019) | 144 | 144 | 144 | 121 | 66.6 | |
| Far Cry New Dawn (2019) | 111 | 104 | 94 | 89 | 50 | |
| Metro Exodus (2019) | 112 | 82.7 | 65.5 | 54.4 | 31.9 | |
| Dirt Rally 2.0 (2019) | 211 | 178 | 97.7 | 72.4 | ||
| The Division 2 (2019) | 150 | 124 | 87 | 61 | 32 | |
| Anno 1800 (2019) | 116 | 90.4 | 51 | 44 | 23.9 | |
| Rage 2 (2019) | 143 | 121 | 119 | 74.2 | 36.7 | |
| F1 2019 (2019) | 203 | 178 | 170 | 116 | 73 | |
| Control (2019) | 107 | 80.8 | 52.6 | 25.6 | ||
| Borderlands 3 (2019) | 127 | 92.1 | 70.6 | 49.8 | 26.8 | |
| FIFA 20 (2019) | 280 | 267 | 264 | 262 | 211 | |
| Ghost Recon Breakpoint (2019) | 115 | 101 | 75 | 55 | 32 | |
| GRID 2019 (2019) | 160 | 119 | 80.7 | 70.2 | 47.2 | |
| Call of Duty Modern Warfare 2019 (2019) | 141 | 134 | 107 | 75.3 | 41.6 | |
| Need for Speed Heat (2019) | 105 | 97 | 92.4 | 81.7 | 48.1 | |
| Star Wars Jedi Fallen Order (2019) | 119 | 114 | 108 | 84 | 42.5 | |
| Red Dead Redemption 2 (2019) | 110 | 73.1 | 47.6 | 38.1 | 24.8 | |
| Escape from Tarkov (2020) | 121 | 121 | 121 | 81 | 41.4 | |
| Hunt Showdown (2020) | 136 | 113 | 74 | 34.1 | ||
| Doom Eternal (2020) | 198 | 176 | 170 | 118 | 61.6 | |
| Gears Tactics (2020) | 215 | 144 | 103 | 64.5 | 33.3 |
Barulho
| Ocioso |
| 30 / 35 / 44 dB |
| Carga |
| 53 / 55 dB |
 | ||
30 dB silencioso 40 dB(A) audível 50 dB(A) ruidosamente alto |
||
min: | ||
| MSI GE66 Raider 10SFS i9-10980HK, GeForce RTX 2070 Super Mobile | MSI GE65 Raider 9SF-049US i9-9880H, GeForce RTX 2070 Mobile | Asus Strix Scar III G531GW i9-9880H, GeForce RTX 2070 Mobile | Eurocom Nightsky RX15 i9-9980HK, GeForce RTX 2070 Mobile | Average of class Gaming | |
|---|---|---|---|---|---|
| Noise | 7% | 1% | 8% | 18% | |
| off / environment * | 30 | 28.8 4% | 29 3% | 28.2 6% | 24.1 ? 20% |
| Idle Minimum * | 30 | 33 -10% | 30 -0% | 28.2 6% | 25.6 ? 15% |
| Idle Average * | 35 | 33 6% | 37 -6% | 28.2 19% | 27.4 ? 22% |
| Idle Maximum * | 44 | 33.1 25% | 39 11% | 31.7 28% | 30.8 ? 30% |
| Load Average * | 53 | 38 28% | 54 -2% | 53.7 -1% | 43 ? 19% |
| Witcher 3 ultra * | 53 | 52.9 -0% | 54 -2% | 53.7 -1% | |
| Load Maximum * | 55 | 57.8 -5% | 54 2% | 53.7 2% | 53.4 ? 3% |
* ... smaller is better
(-) The maximum temperature on the upper side is 49 °C / 120 F, compared to the average of 40.4 °C / 105 F, ranging from 21.2 to 68.8 °C for the class Gaming.
(-) The bottom heats up to a maximum of 52 °C / 126 F, compared to the average of 43.2 °C / 110 F
(+) In idle usage, the average temperature for the upper side is 29.1 °C / 84 F, compared to the device average of 33.8 °C / 93 F.
(-) Playing The Witcher 3, the average temperature for the upper side is 41.1 °C / 106 F, compared to the device average of 33.8 °C / 93 F.
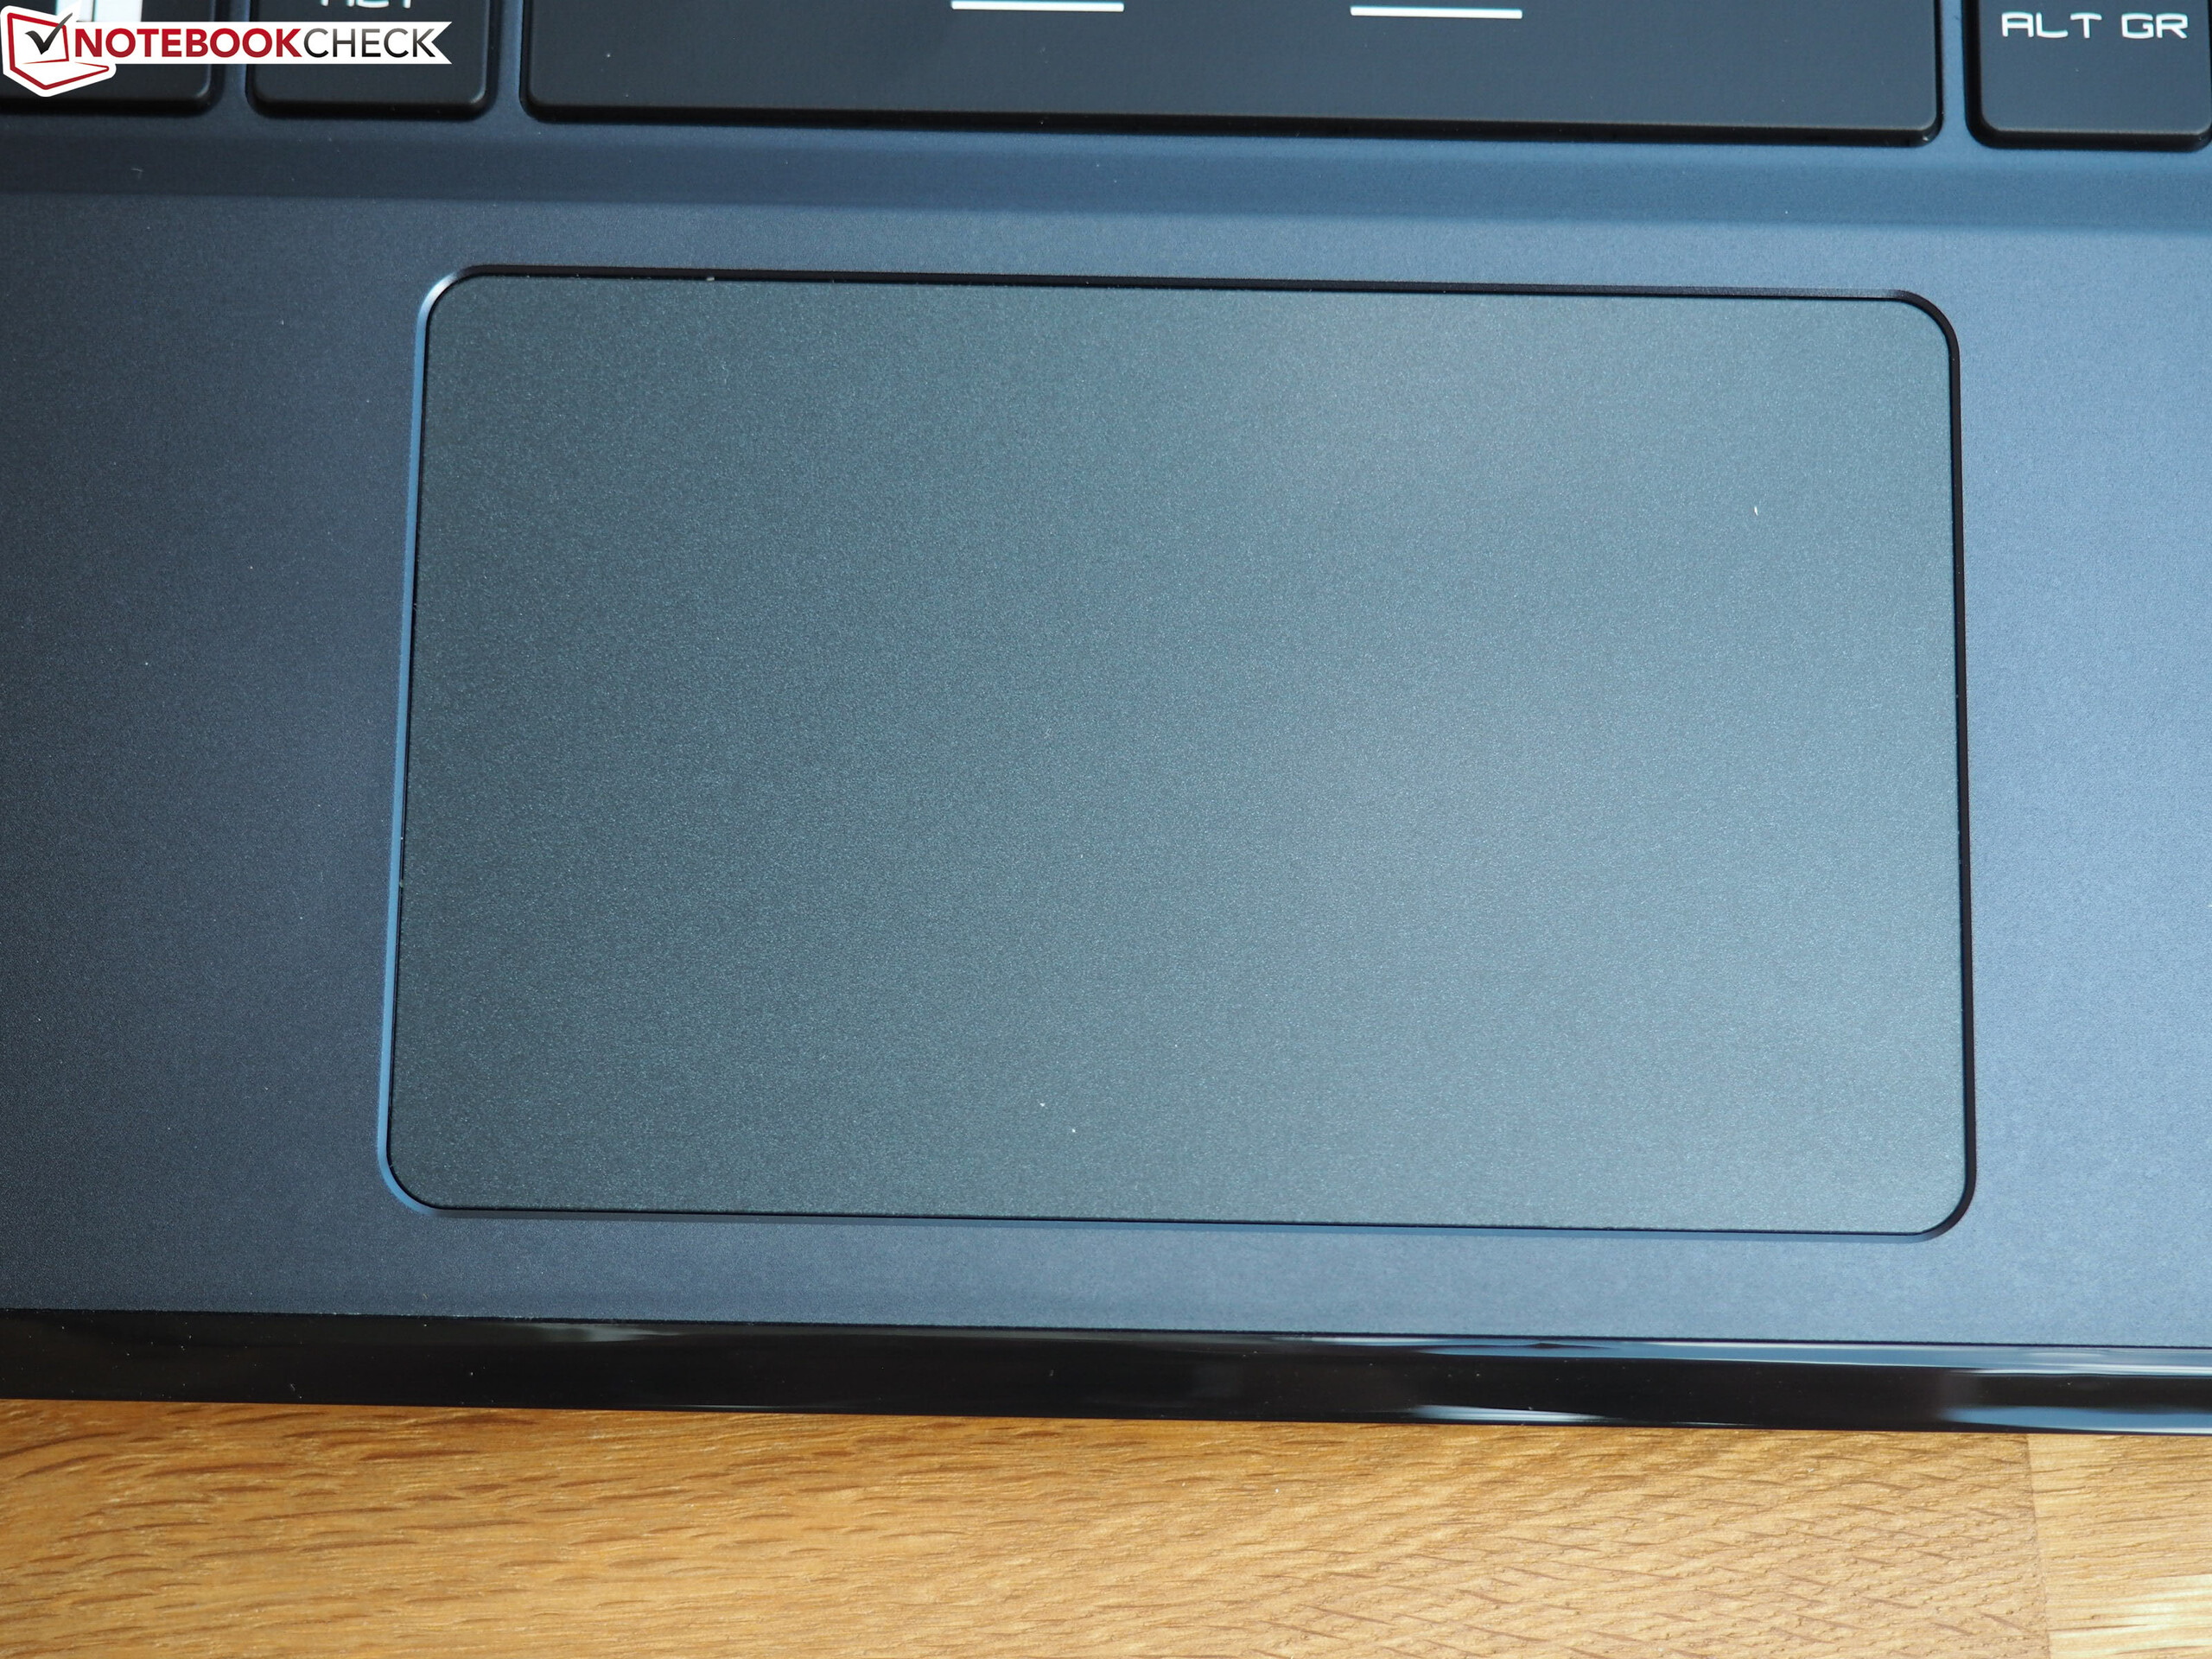
(+) The palmrests and touchpad are reaching skin temperature as a maximum (34 °C / 93.2 F) and are therefore not hot.
(-) The average temperature of the palmrest area of similar devices was 28.9 °C / 84 F (-5.1 °C / -9.2 F).
| MSI GE66 Raider 10SFS i9-10980HK, GeForce RTX 2070 Super Mobile | MSI GE65 Raider 9SF-049US i9-9880H, GeForce RTX 2070 Mobile | Asus Strix Scar III G531GW i9-9880H, GeForce RTX 2070 Mobile | Eurocom Nightsky RX15 i9-9980HK, GeForce RTX 2070 Mobile | Average of class Gaming | |
|---|---|---|---|---|---|
| Heat | -3% | -0% | -4% | 3% | |
| Maximum Upper Side * | 49 | 45 8% | 51 -4% | 40.2 18% | 46 ? 6% |
| Maximum Bottom * | 52 | 53 -2% | 49 6% | 53 -2% | 49.5 ? 5% |
| Idle Upper Side * | 30 | 31.2 -4% | 30 -0% | 34.2 -14% | 31.4 ? -5% |
| Idle Bottom * | 34 | 39 -15% | 35 -3% | 39.6 -16% | 32.5 ? 4% |
* ... smaller is better
MSI GE66 Raider 10SFS audio analysis
(+) | speakers can play relatively loud (84 dB)
Bass 100 - 315 Hz
(-) | nearly no bass - on average 32.4% lower than median
(+) | bass is linear (5.9% delta to prev. frequency)
Mids 400 - 2000 Hz
(±) | higher mids - on average 7.4% higher than median
(±) | linearity of mids is average (8.9% delta to prev. frequency)
Highs 2 - 16 kHz
(±) | higher highs - on average 5.3% higher than median
(±) | linearity of highs is average (8.9% delta to prev. frequency)
Overall 100 - 16.000 Hz
(±) | linearity of overall sound is average (26.7% difference to median)
Compared to same class
» 92% of all tested devices in this class were better, 2% similar, 7% worse
» The best had a delta of 6%, average was 18%, worst was 132%
Compared to all devices tested
» 79% of all tested devices were better, 4% similar, 17% worse
» The best had a delta of 4%, average was 25%, worst was 134%
MSI GE65 Raider 9SF-049US audio analysis
(+) | speakers can play relatively loud (93 dB)
Bass 100 - 315 Hz
(-) | nearly no bass - on average 20.5% lower than median
(±) | linearity of bass is average (8.8% delta to prev. frequency)
Mids 400 - 2000 Hz
(+) | balanced mids - only 3.3% away from median
(+) | mids are linear (4.6% delta to prev. frequency)
Highs 2 - 16 kHz
(+) | balanced highs - only 1.4% away from median
(+) | highs are linear (5% delta to prev. frequency)
Overall 100 - 16.000 Hz
(±) | linearity of overall sound is average (15.6% difference to median)
Compared to same class
» 33% of all tested devices in this class were better, 6% similar, 61% worse
» The best had a delta of 6%, average was 18%, worst was 132%
Compared to all devices tested
» 19% of all tested devices were better, 4% similar, 77% worse
» The best had a delta of 4%, average was 25%, worst was 134%
| desligado | |
| Ocioso | |
| Carga |
|
| MSI GE66 Raider 10SFS i9-10980HK, GeForce RTX 2070 Super Mobile | MSI GE65 Raider 9SF-049US i9-9880H, GeForce RTX 2070 Mobile | Asus Strix Scar III G531GW i9-9880H, GeForce RTX 2070 Mobile | Eurocom Nightsky RX15 i9-9980HK, GeForce RTX 2070 Mobile | Average of class Gaming | |
|---|---|---|---|---|---|
| Power Consumption | -26% | -95% | -34% | -33% | |
| Idle Minimum * | 6 | 15 -150% | 29 -383% | 12.6 -110% | 13.7 ? -128% |
| Idle Average * | 14 | 18.5 -32% | 32 -129% | 21.4 -53% | 19.1 ? -36% |
| Idle Maximum * | 25 | 20.2 19% | 37 -48% | 34.4 -38% | 26.8 ? -7% |
| Load Average * | 108 | 110.9 -3% | 157 -45% | 123.2 -14% | 110.9 ? -3% |
| Witcher 3 ultra * | 195 | 187.3 4% | 173 11% | 192.4 1% | |
| Load Maximum * | 280 | 260 7% | 217 22% | 246.6 12% | 250 ? 11% |
* ... smaller is better
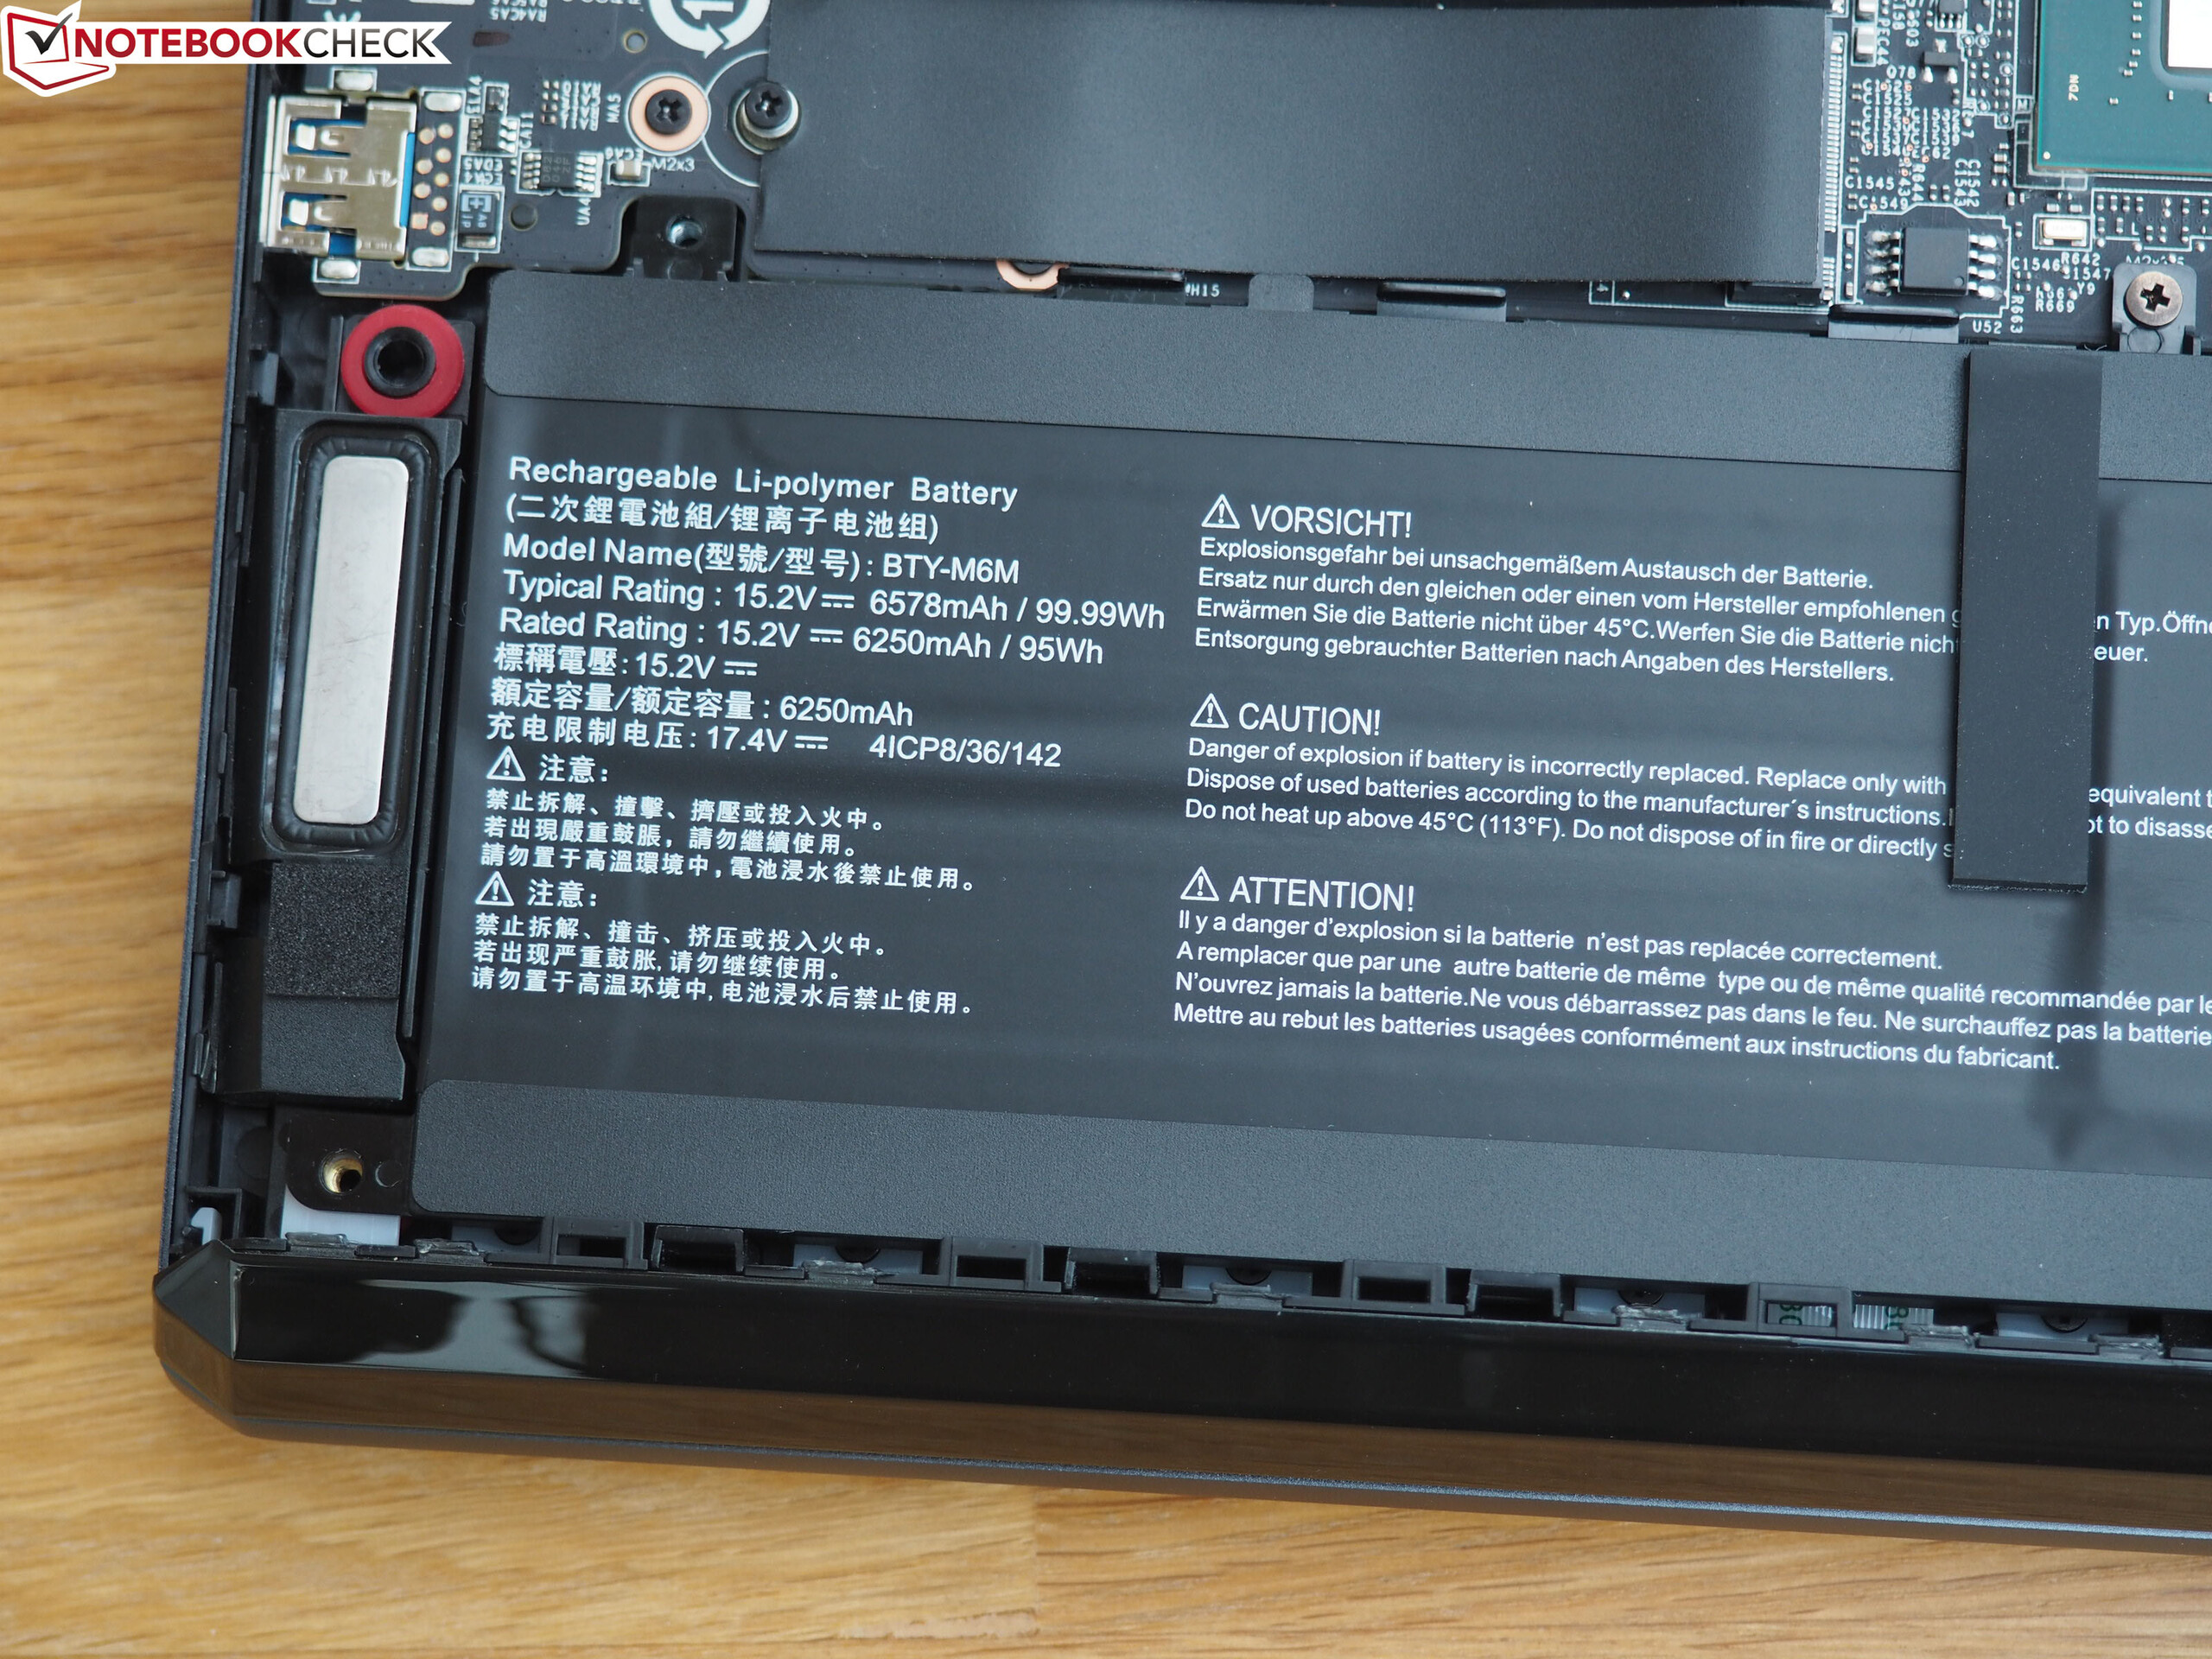
| MSI GE66 Raider 10SFS i9-10980HK, GeForce RTX 2070 Super Mobile, 99.99 Wh | MSI GE65 Raider 9SF-049US i9-9880H, GeForce RTX 2070 Mobile, 51 Wh | Asus Strix Scar III G531GW i9-9880H, GeForce RTX 2070 Mobile, 66 Wh | Eurocom Nightsky RX15 i9-9980HK, GeForce RTX 2070 Mobile, 62 Wh | Average of class Gaming | |
|---|---|---|---|---|---|
| Battery Runtime | -42% | -34% | -43% | 0% | |
| Reader / Idle | 454 | 371 -18% | 328 -28% | 544 ? 20% | |
| WiFi v1.3 | 364 | 216 -41% | 177 -51% | 206 -43% | 368 ? 1% |
| Load | 106 | 35 -67% | 81 -24% | 84.2 ? -21% |
Pro
Contra

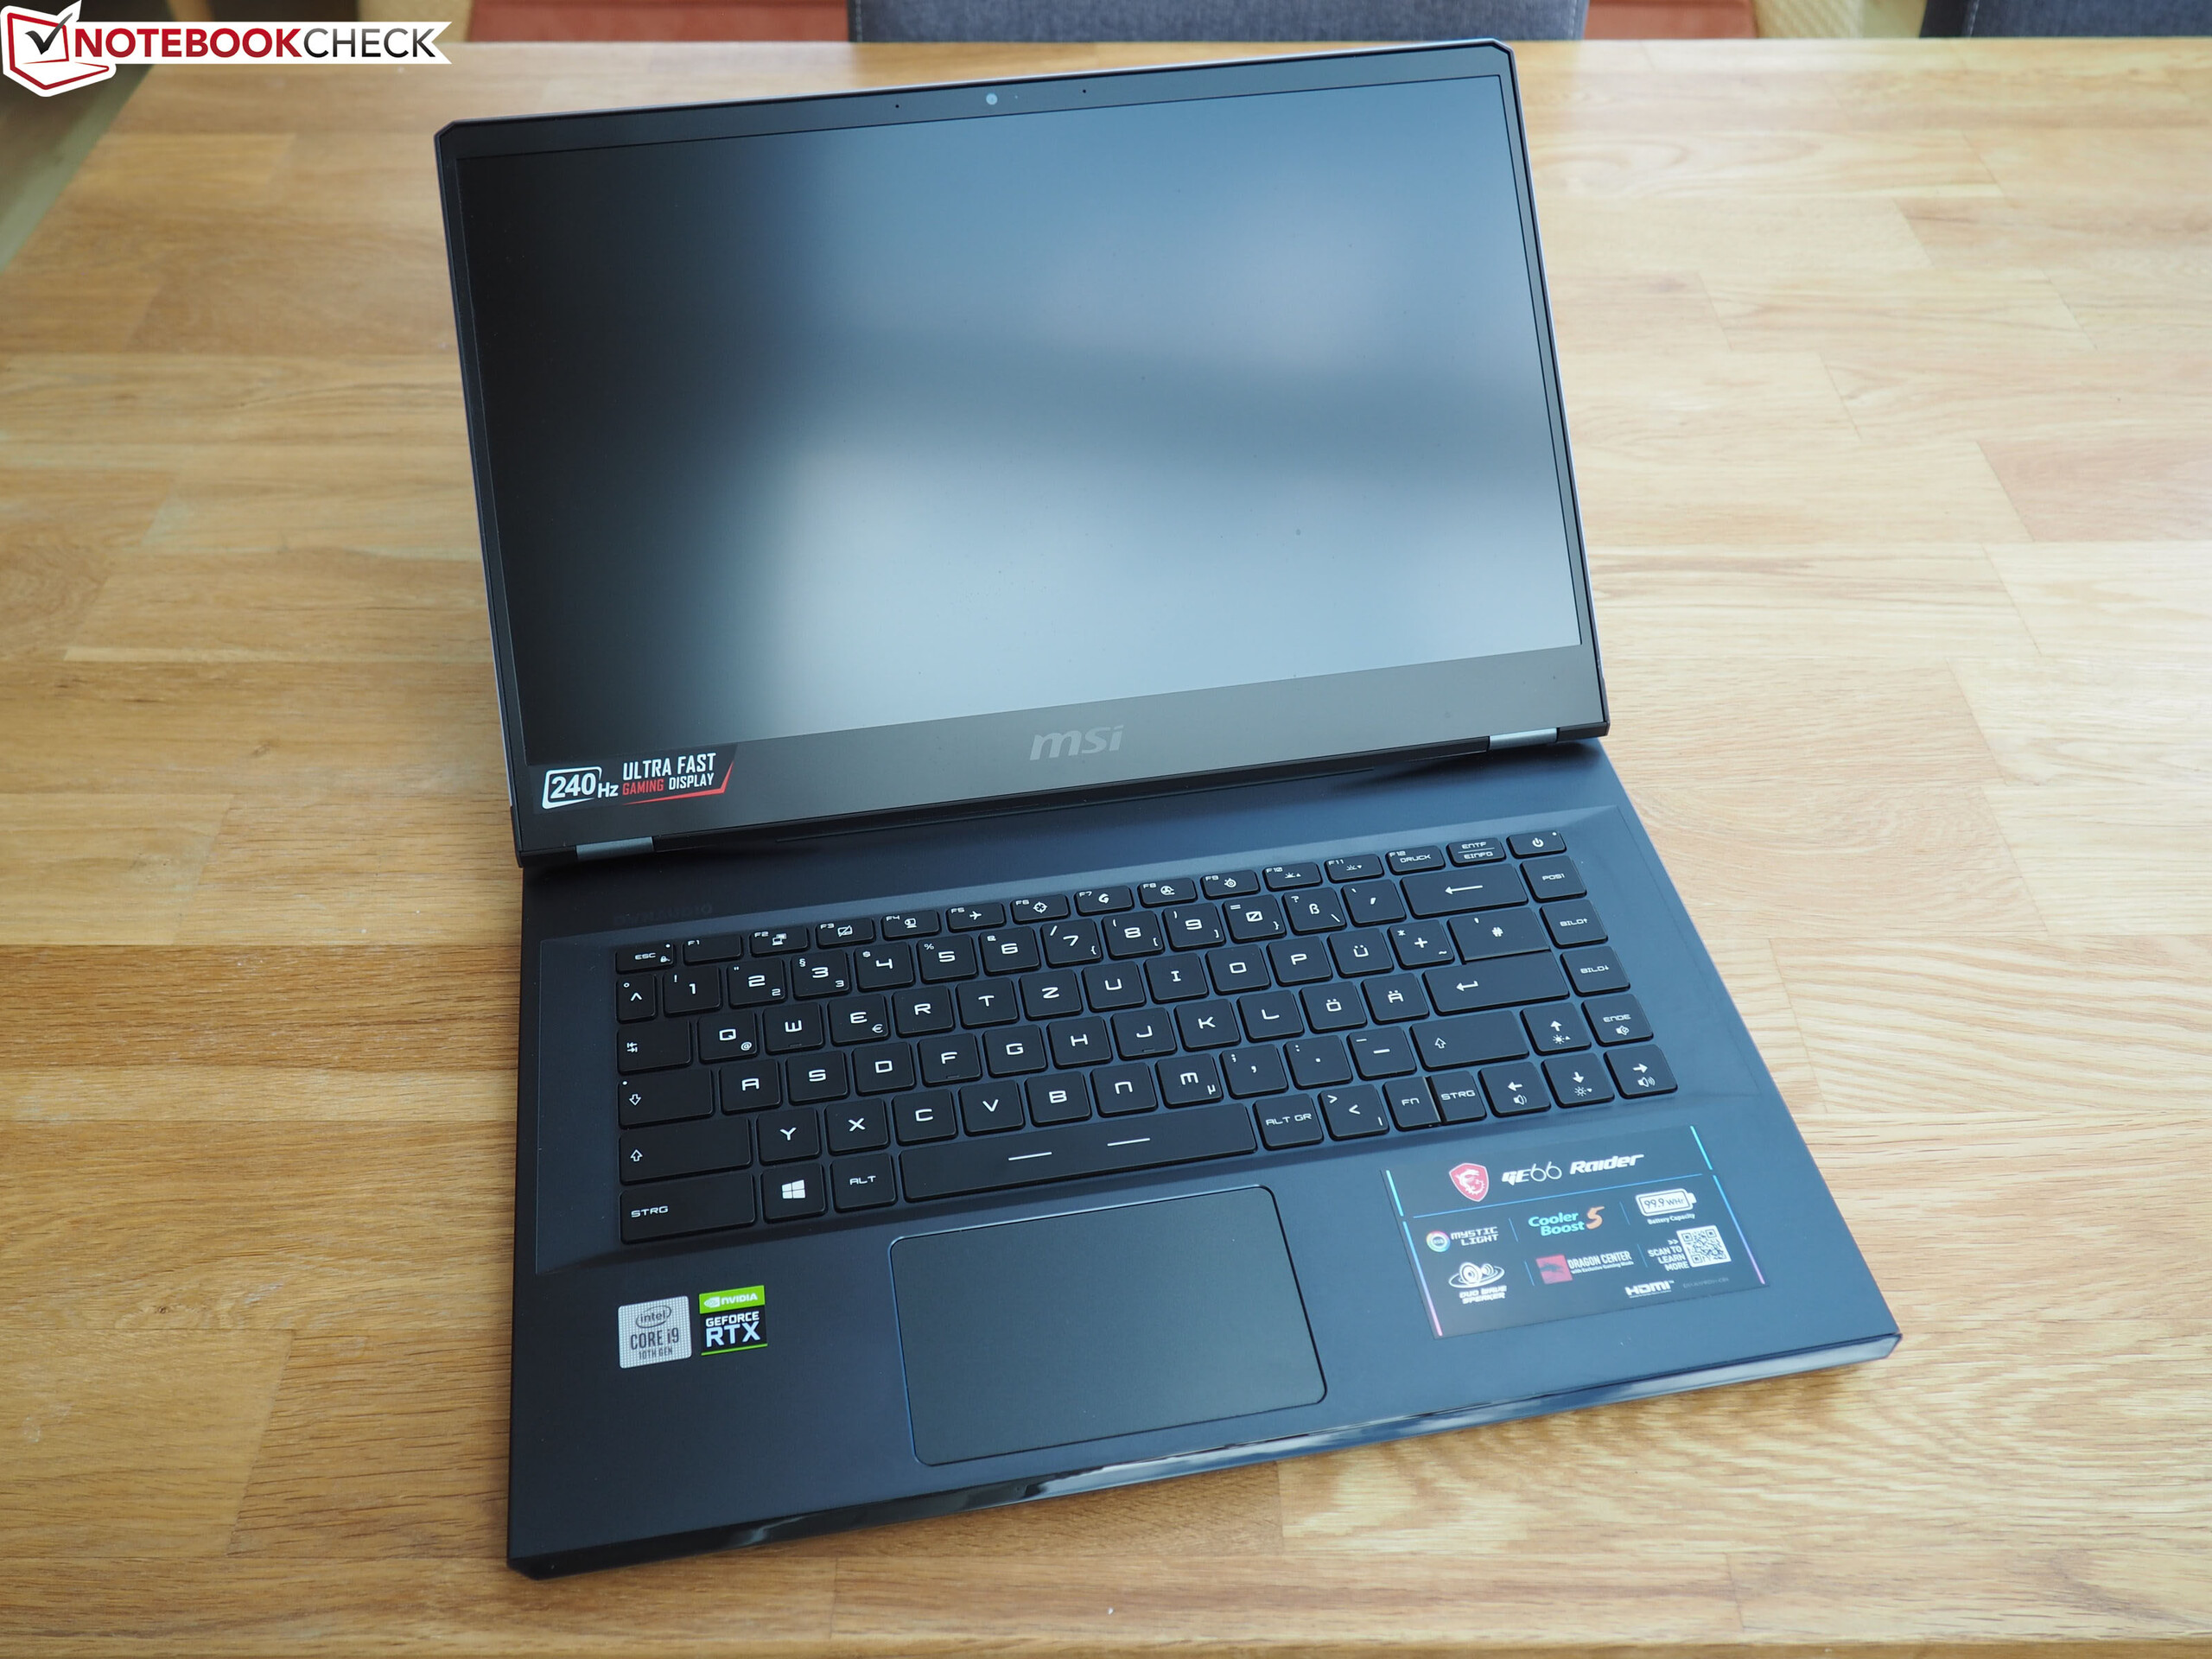
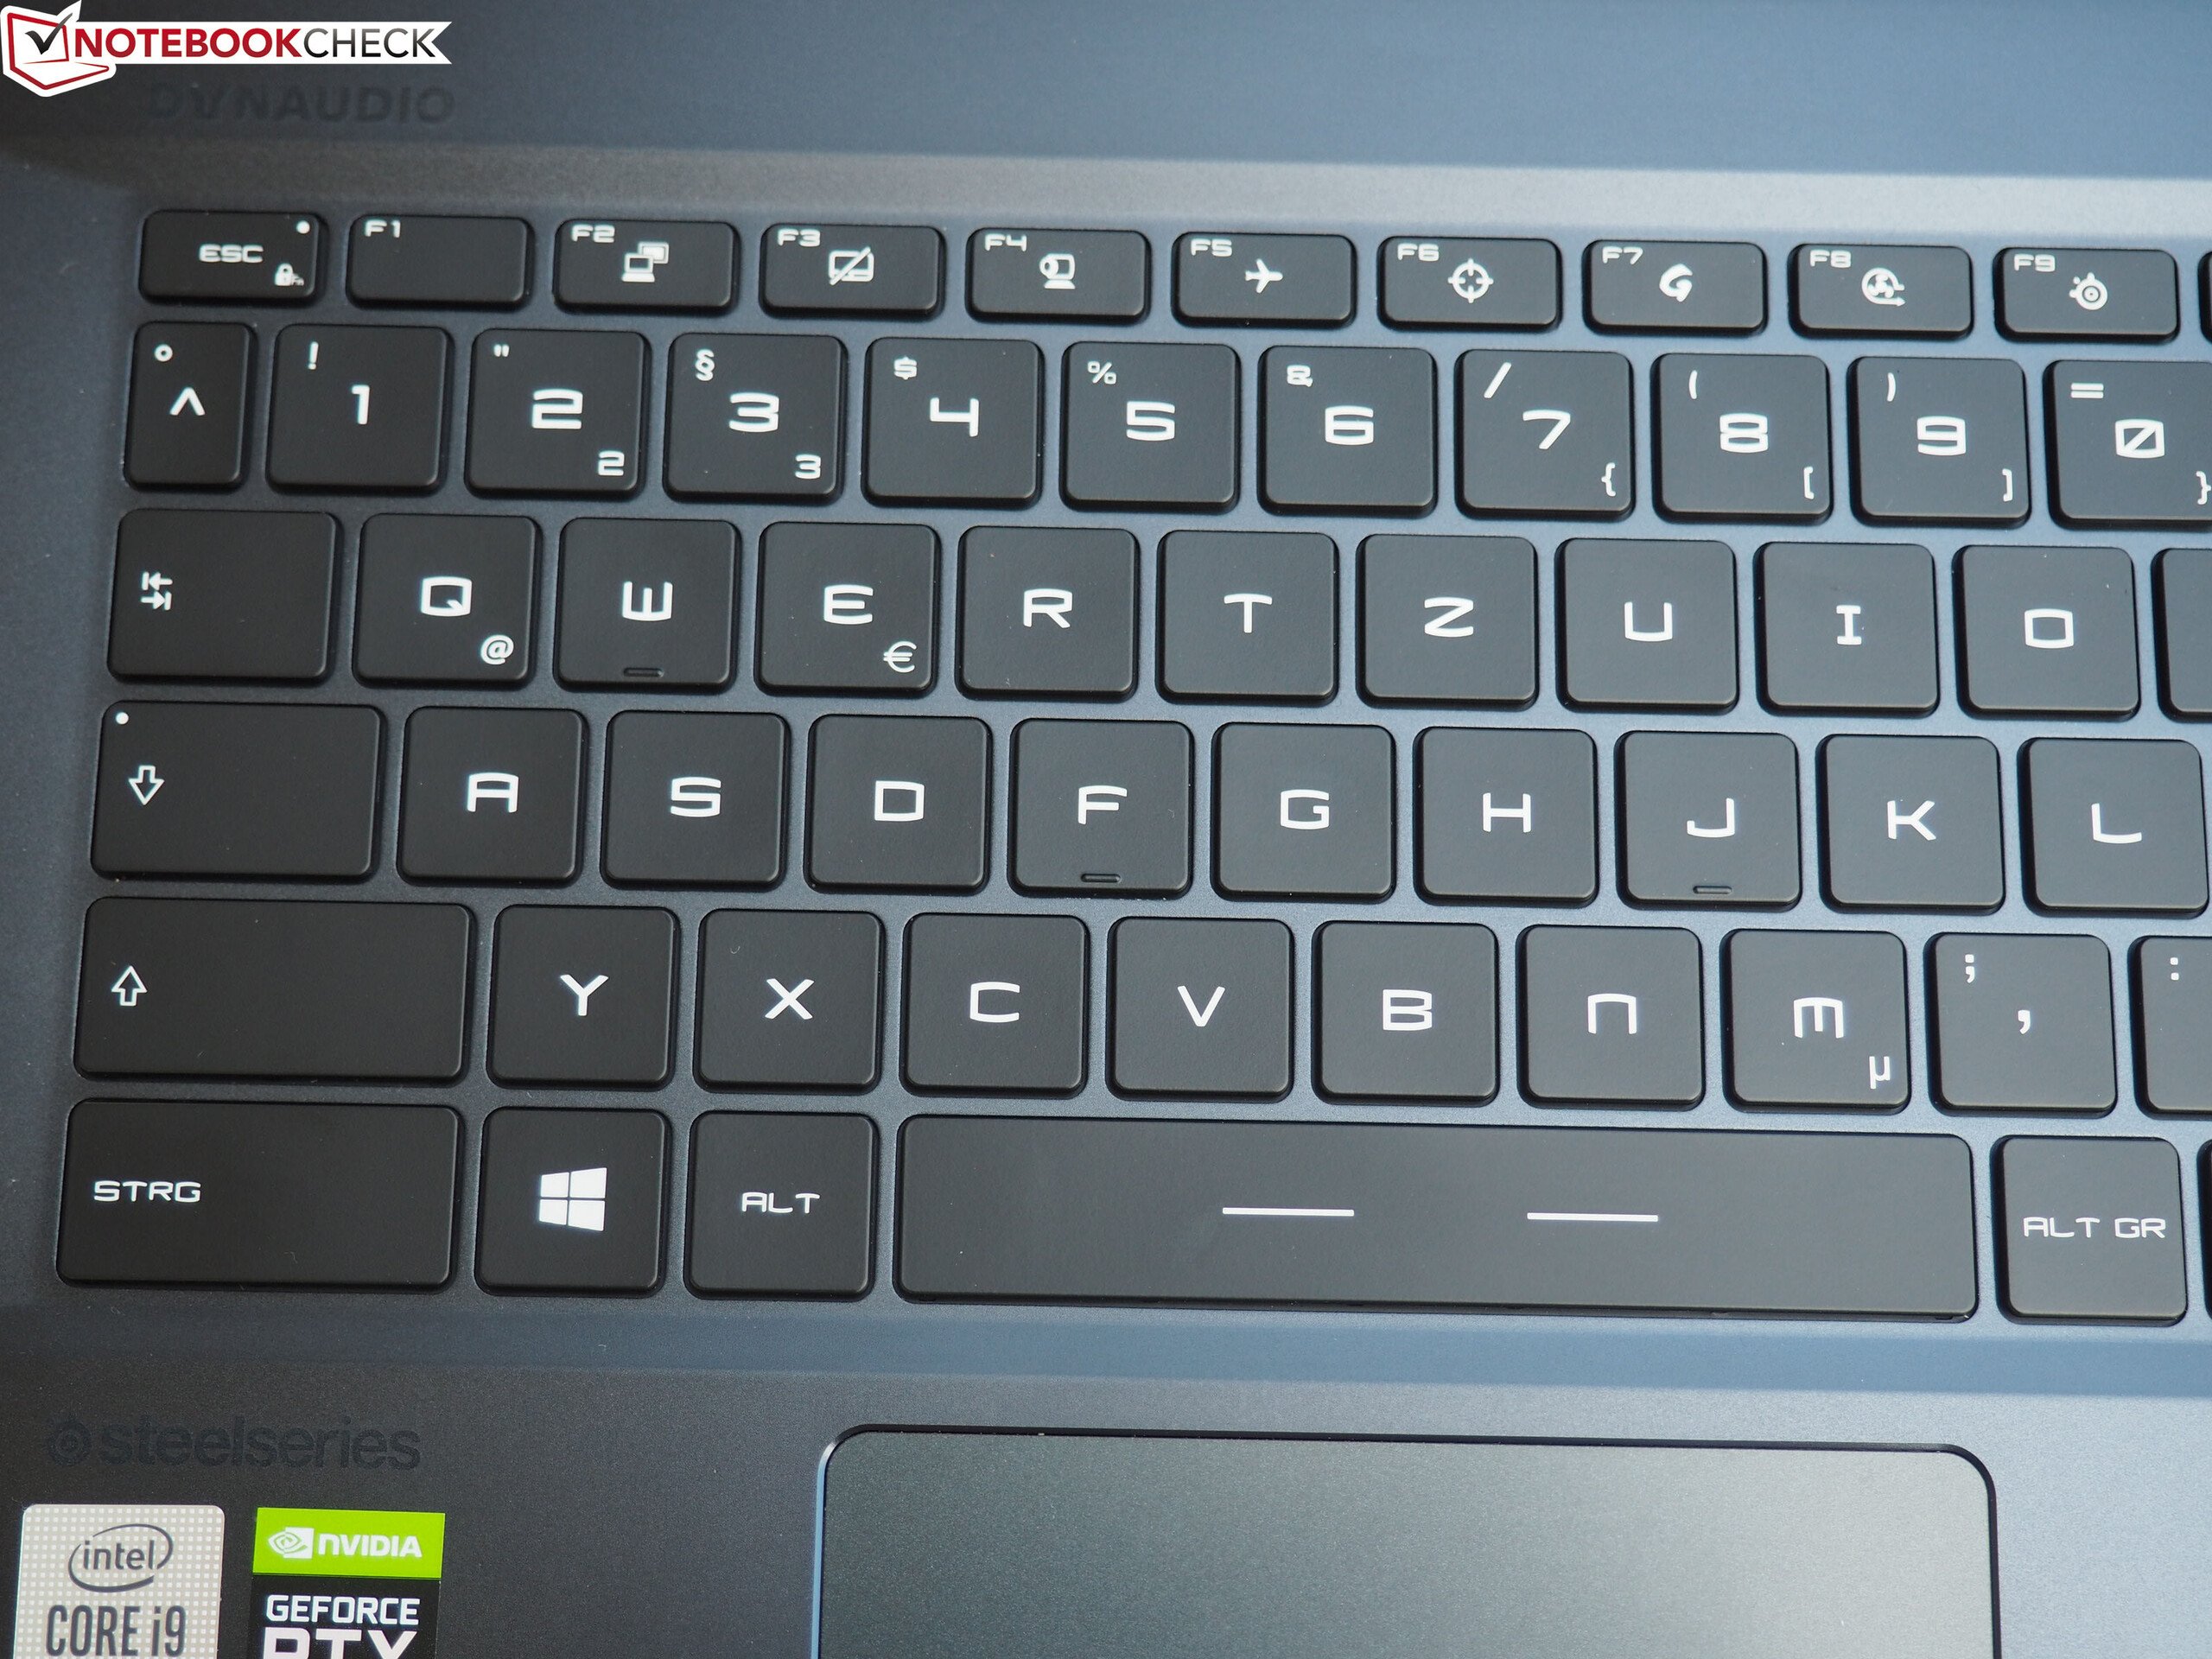
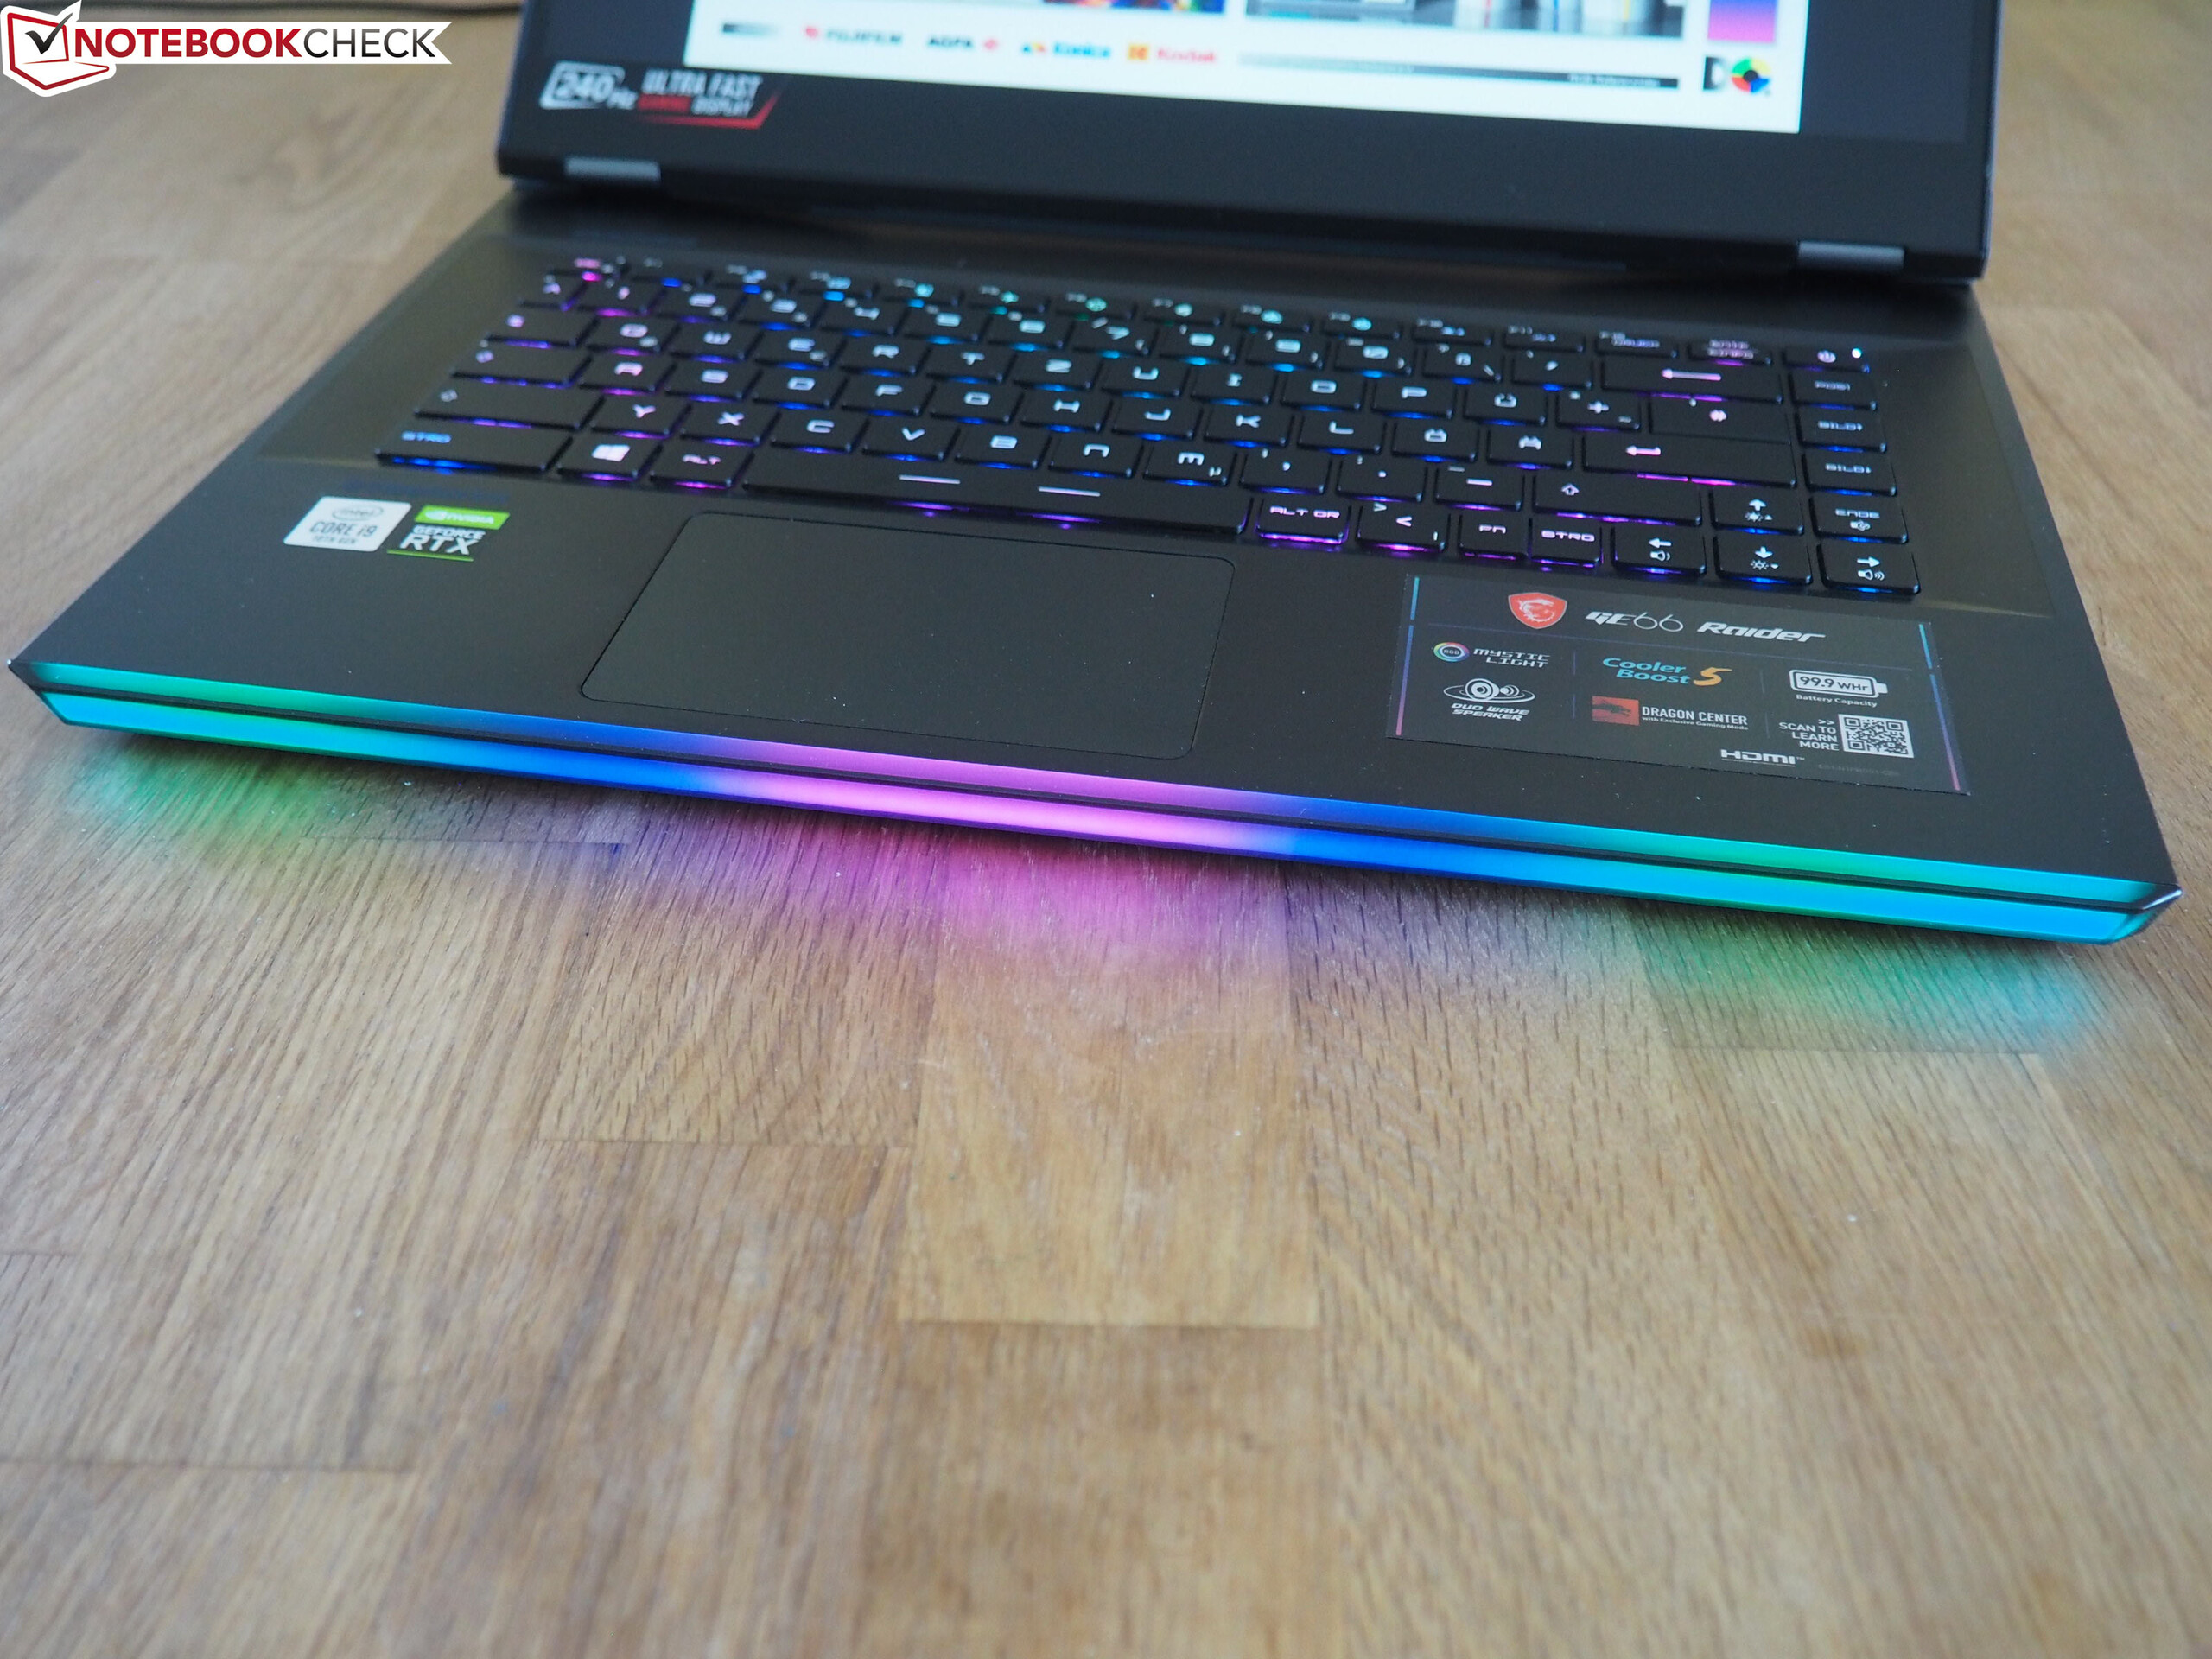
Com o GE66 Raider 10SFS, a MSI oferece um dispositivo gamer compacto de 15 polegadas e de alto desempenho, que não apenas agrada os fãs da iluminação (tiras de LED na frente), mas também aos fanáticos das telas rápidas.
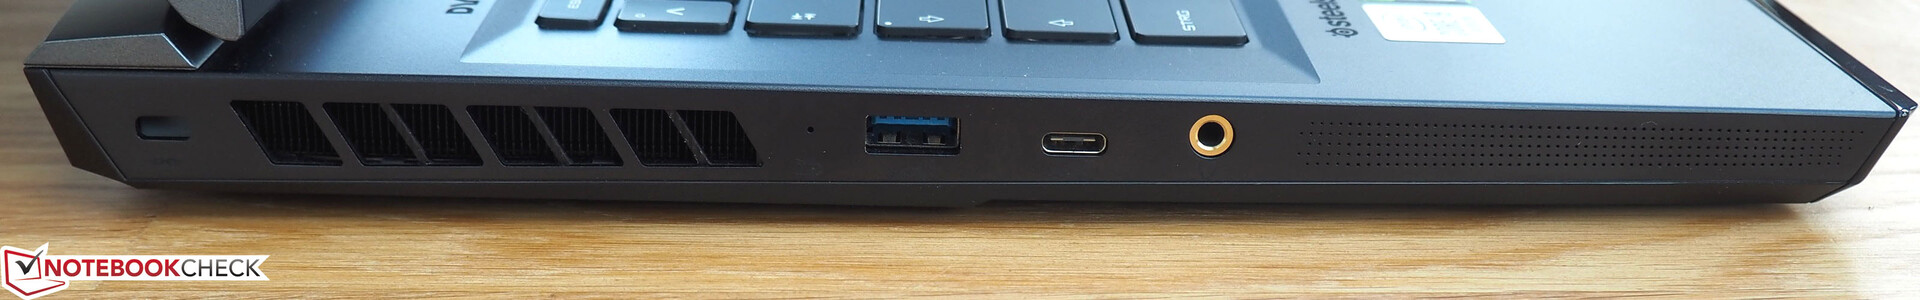
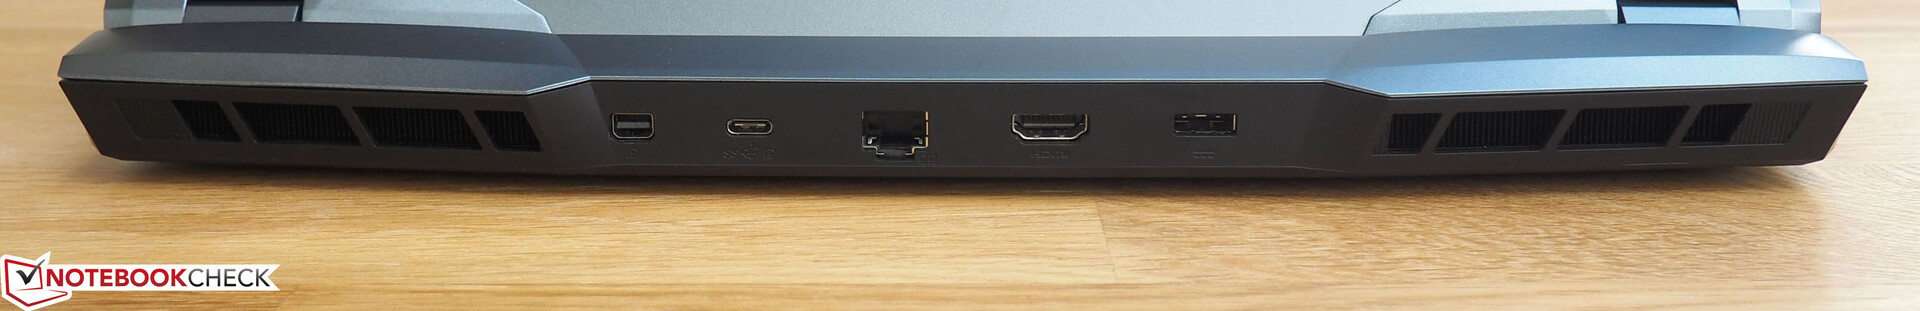
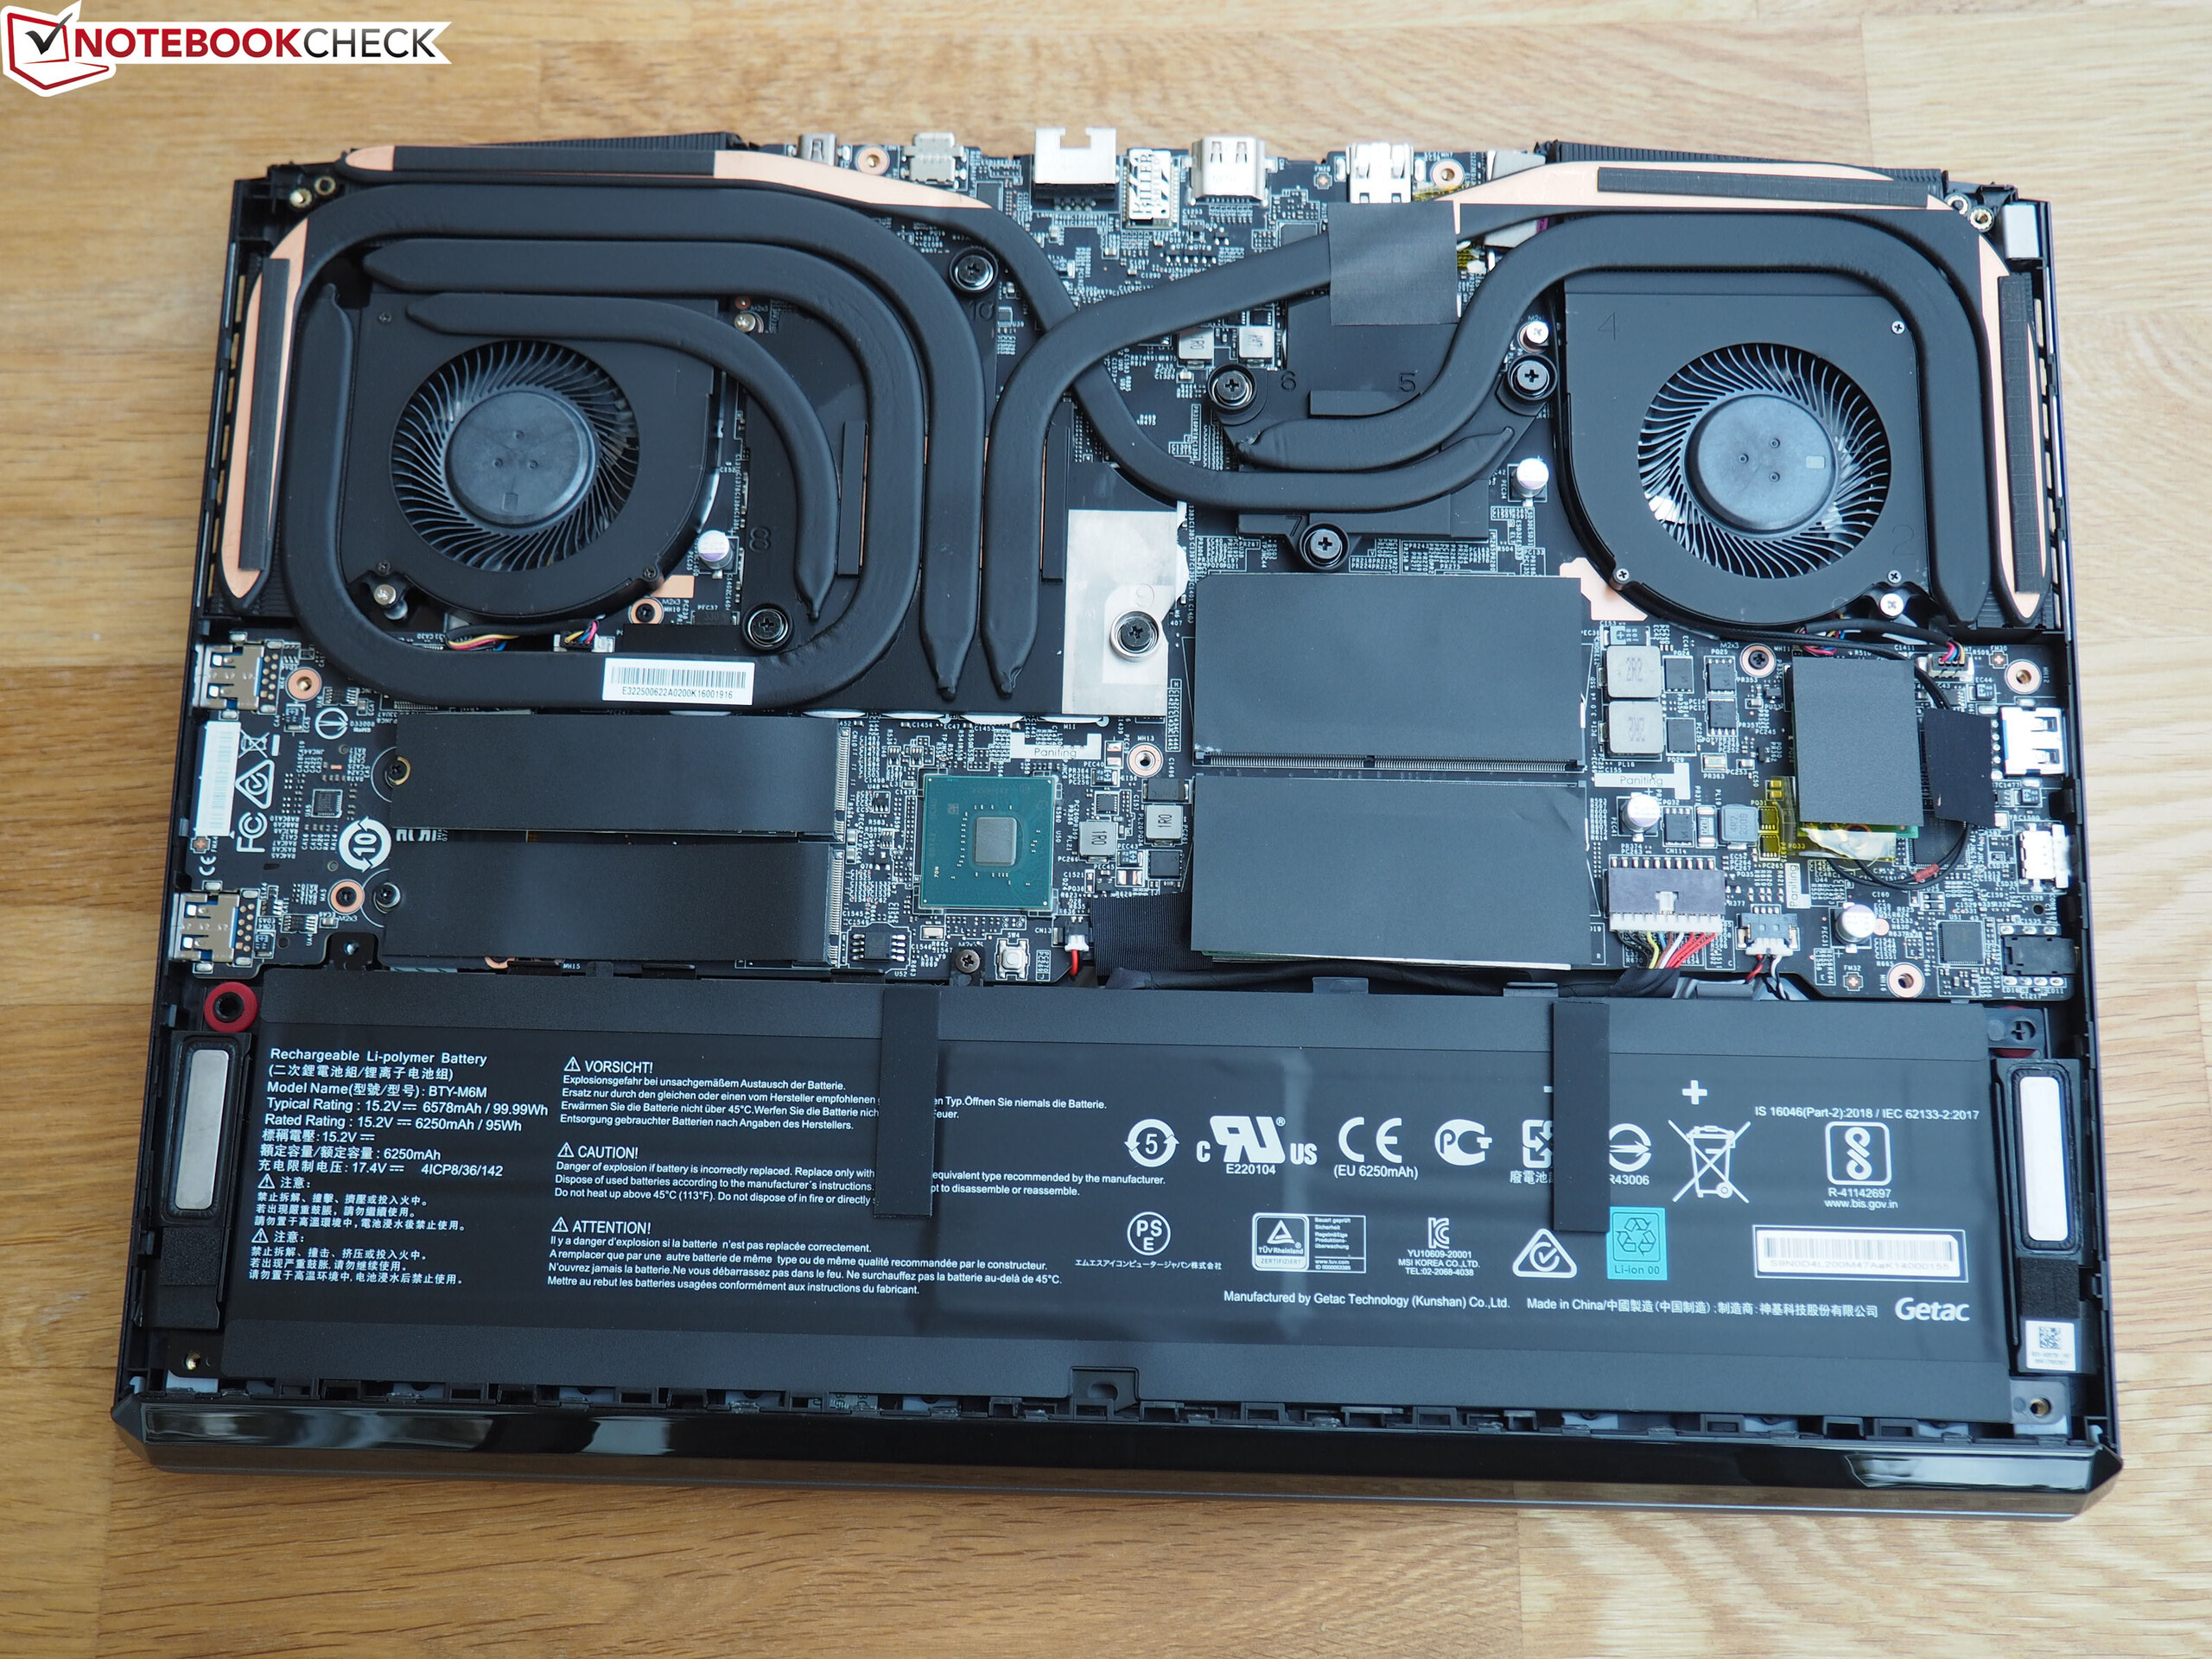
A tela de 240 Hz pode ser um pouco mais brilhante, mas de outra forma convence em quase todas as categorias. Você também não precisa se preocupar com a potência 3D. A versão Super da GeForce RTX 2070 traz altos níveis de desempenho. Outros pontos de venda são a bateria de 99 Wh, a ampla conectividade (onde infelizmente não há porta Thunderbolt 3) e o excelente chassi.
Não é o suficiente para um "Muito Bom" como uma classificação geral devido ao desenvolvimento de ruído acentuado, à webcam modesta e aos fracos alto-falantes.
MSI GE66 Raider 10SFS
-
07/05/2020 v7
Florian Glaser
Pricecompare