 Deutsch
 English
 Español
 Français
 Italiano
 Nederlands
 Polski
 Português
 Русский
 Türkçe
 Svenska
 Chinese
 Magyar
Breve Análise do Portátil MSI GT63 Titan 8RG-046 (i7-8750H, GTX 1080, FHD)


| SD Card Reader | |
| average JPG Copy Test (av. of 3 runs) | |
| Asus Chimera G703GI (Toshiba Exceria Pro SDXC 64 GB UHS-II) | |
| Average of class Gaming (19 - 202, n=100, last 2 years) | |
| Lenovo Legion Y520-15IKBA-80WY001VGE (Toshiba Exceria Pro SDXC 64 GB UHS-II) | |
| Dell G5 15 5587 (Toshiba Exceria Pro SDXC 64 GB UHS-II) | |
| MSI GT63 Titan 8RG-046 (Toshiba Exceria Pro SDXC 64 GB UHS-II) | |
| maximum AS SSD Seq Read Test (1GB) | |
| Asus Chimera G703GI (Toshiba Exceria Pro SDXC 64 GB UHS-II) | |
| Average of class Gaming (26 - 269, n=93, last 2 years) | |
| Lenovo Legion Y520-15IKBA-80WY001VGE (Toshiba Exceria Pro SDXC 64 GB UHS-II) | |
| Dell G5 15 5587 (Toshiba Exceria Pro SDXC 64 GB UHS-II) | |
| MSI GT63 Titan 8RG-046 (Toshiba Exceria Pro SDXC 64 GB UHS-II) | |
| Networking | |
| iperf3 transmit AX12 | |
| Average of class Gaming (885 - 1412, n=5, last 2 years) | |
| Acer Predator Helios 500 PH517-51-79BY | |
| Asus Chimera G703GI | |
| Razer Blade 15 2018 | |
| Asus ROG GU501GM-BI7N8 | |
| Dell G5 15 5587 | |
| MSI GT63 Titan 8RG-046 | |
| Alienware 15 R3 Max-Q | |
| Lenovo Legion Y520-15IKBA-80WY001VGE | |
| iperf3 receive AX12 | |
| Average of class Gaming (881 - 1700, n=5, last 2 years) | |
| Alienware 15 R3 Max-Q | |
| Razer Blade 15 2018 | |
| Asus Chimera G703GI | |
| Acer Predator Helios 500 PH517-51-79BY | |
| Asus ROG GU501GM-BI7N8 | |
| MSI GT63 Titan 8RG-046 | |
| Dell G5 15 5587 | |
| Lenovo Legion Y520-15IKBA-80WY001VGE | |
| |||||||||||||||||||||||||
iluminação: 80 %
iluminação com acumulador: 307.1 cd/m²
Contraste: 830:1 (Preto: 0.37 cd/m²)
ΔE Color 2.53 | 0.5-29.43 Ø5, calibrated: 2.82
ΔE Greyscale 1.7 | 0.57-98 Ø5.3
100% sRGB (Argyll 1.6.3 3D)
76% AdobeRGB 1998 (Argyll 1.6.3 3D)
85.7% AdobeRGB 1998 (Argyll 2.2.0 3D)
99.9% sRGB (Argyll 2.2.0 3D)
91.3% Display P3 (Argyll 2.2.0 3D)
Gamma: 2.194
| MSI GT63 Titan 8RG-046 N156HHE-GA1, TN, 15.60, 1920x1080 | Asus ROG GU501GM-BI7N8 AU Optronics AUO45ED, IPS, 15.60, 1920x1080 | Razer Blade 15 2018 LGD05C0, IPS, 15.60, 1920x1080 | Lenovo Legion Y520-15IKBA-80WY001VGE LG Philips LGD0533, IPS, 15.60, 1920x1080 | Alienware 15 R3 Max-Q LG Philips LP156WF6 (LGD049B), IPS, 15.60, 1920x1080 | Dell G5 15 5587 LGD053F, 156WF6, IPS, 15.60, 1920x1080 | Asus Chimera G703GI B173HAN03.2 (AUO329D), IPS, 17.30, 1920x1080 | Acer Predator Helios 500 PH517-51-79BY AUO_B173HAN03, IPS, 17.30, 1920x1080 | |
|---|---|---|---|---|---|---|---|---|
| Display | -22% | -20% | -50% | -25% | -52% | -19% | -20% | |
| Display P3 Coverage | 91.3 | 63.4 -31% | 64.3 -30% | 39.53 -57% | 64.3 -30% | 38.13 -58% | 65.8 -28% | 64.4 -29% |
| sRGB Coverage | 99.9 | 87.7 -12% | 93.7 -6% | 59.2 -41% | 82.9 -17% | 56.8 -43% | 92.6 -7% | 91.3 -9% |
| AdobeRGB 1998 Coverage | 85.7 | 65.5 -24% | 40.86 -52% | 60.6 -29% | 39.47 -54% | 67 -22% | 65.6 -23% | |
| Response Times | -322% | -106% | -256% | -259% | -304% | -31% | -61% | |
| Response Time Grey 50% / Grey 80% * | 8.4 ? | 30.8 ? -267% | 17.2 ? -105% | 42 ? -400% | 40 ? -376% | 33 ? -293% | 6.4 ? 24% | 14 ? -67% |
| Response Time Black / White * | 5.8 ? | 27.6 ? -376% | 12 ? -107% | 27 ? -366% | 28 ? -383% | 24 ? -314% | 10.8 ? -86% | 9 ? -55% |
| PWM Frequency | 25510 ? | 24900 ? -2% | 21100 ? -17% | |||||
| Screen | -21% | -3% | -68% | -38% | -69% | -2% | -47% | |
| Brightness middle | 307.1 | 286.7 -7% | 290 -6% | 243 -21% | 306 0% | 229 -25% | 285 -7% | 335 9% |
| Brightness | 276 | 281 2% | 281 2% | 231 -16% | 297 8% | 224 -19% | 275 0% | 300 9% |
| Brightness Distribution | 80 | 92 15% | 82 3% | 87 9% | 89 11% | 87 9% | 82 3% | 82 3% |
| Black Level * | 0.37 | 0.39 -5% | 0.3 19% | 0.24 35% | 0.28 24% | 0.28 24% | 0.22 41% | 0.7 -89% |
| Contrast | 830 | 735 -11% | 967 17% | 1013 22% | 1093 32% | 818 -1% | 1295 56% | 479 -42% |
| Colorchecker dE 2000 * | 2.53 | 4.17 -65% | 2.85 -13% | 6.36 -151% | 5.45 -115% | 6.1 -141% | 3.18 -26% | 4.99 -97% |
| Colorchecker dE 2000 max. * | 4.66 | 7.22 -55% | 6.27 -35% | 12.76 -174% | 9.45 -103% | 12.2 -162% | 5.99 -29% | 9.32 -100% |
| Colorchecker dE 2000 calibrated * | 2.82 | 1.39 51% | 6.51 -131% | 6.12 -117% | 1.73 39% | 1.93 32% | ||
| Greyscale dE 2000 * | 1.7 | 2.5 -47% | 2.4 -41% | 5.63 -231% | 4.9 -188% | 5.68 -234% | 2.93 -72% | 5.2 -206% |
| Gamma | 2.194 100% | 2.274 97% | 2.34 94% | 2.47 89% | 2.49 88% | 2.4 92% | 2.45 90% | 2.49 88% |
| CCT | 6893 94% | 6885 94% | 6718 97% | 7411 88% | 7062 92% | 6989 93% | 7165 91% | 7719 84% |
| Color Space (Percent of AdobeRGB 1998) | 76 | 57 -25% | 60 -21% | 38 -50% | 54 -29% | 36 -53% | 60 -21% | 59 -22% |
| Color Space (Percent of sRGB) | 100 | 87 -13% | 94 -6% | 59 -41% | 83 -17% | 57 -43% | 93 -7% | 91 -9% |
| Total Average (Program / Settings) | -122% /
-64% | -43% /
-19% | -125% /
-98% | -107% /
-77% | -142% /
-95% | -17% /
-9% | -43% /
-43% |
* ... smaller is better
Display Response Times
| ↔ Response Time Black to White | ||
|---|---|---|
| 5.8 ms ... rise ↗ and fall ↘ combined | ↗ 4.4 ms rise | 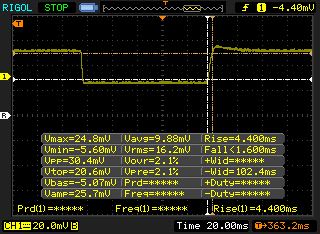 |
| ↘ 1.4 ms fall | ||
| The screen shows very fast response rates in our tests and should be very well suited for fast-paced gaming. In comparison, all tested devices range from 0.1 (minimum) to 240 (maximum) ms. » 13 % of all devices are better. This means that the measured response time is better than the average of all tested devices (21.5 ms). | ||
| ↔ Response Time 50% Grey to 80% Grey | ||
| 8.4 ms ... rise ↗ and fall ↘ combined | ↗ 4.4 ms rise | 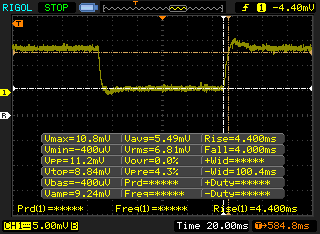 |
| ↘ 4 ms fall | ||
| The screen shows fast response rates in our tests and should be suited for gaming. In comparison, all tested devices range from 0.2 (minimum) to 636 (maximum) ms. » 17 % of all devices are better. This means that the measured response time is better than the average of all tested devices (33.7 ms). | ||
Screen Flickering / PWM (Pulse-Width Modulation)
| Screen flickering / PWM detected | 25510 Hz | ≤ 34 % brightness setting | 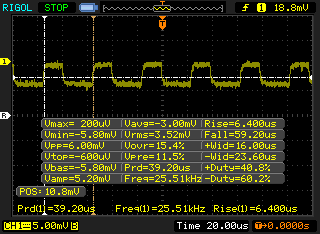 |
The display backlight flickers at 25510 Hz (worst case, e.g., utilizing PWM) Flickering detected at a brightness setting of 34 % and below. There should be no flickering or PWM above this brightness setting. The frequency of 25510 Hz is quite high, so most users sensitive to PWM should not notice any flickering. In comparison: 53 % of all tested devices do not use PWM to dim the display. If PWM was detected, an average of 17924 (minimum: 5 - maximum: 3846000) Hz was measured. | |||
| Cinebench R15 | |
| CPU Single 64Bit | |
| Average of class Gaming (79.2 - 318, n=230, last 2 years) | |
| Asus Chimera G703GI | |
| MSI GT63 Titan 8RG-046 | |
| Acer Predator Helios 500 PH517-51-79BY | |
| Razer Blade 15 2018 | |
| Dell G5 15 5587 | |
| Average Intel Core i7-8750H (163 - 177, n=86) | |
| Alienware 15 R3 Max-Q | |
| Dell Inspiron 15 7000 7577 4K | |
| Lenovo Legion Y520-15IKBA-80WY001VGE | |
| CPU Multi 64Bit | |
| Average of class Gaming (400 - 5663, n=231, last 2 years) | |
| Asus Chimera G703GI | |
| Average Intel Core i7-8750H (863 - 1251, n=93) | |
| MSI GT63 Titan 8RG-046 | |
| Acer Predator Helios 500 PH517-51-79BY | |
| Razer Blade 15 2018 | |
| Alienware 15 R3 Max-Q | |
| Dell G5 15 5587 | |
| Dell Inspiron 15 7000 7577 4K | |
| Lenovo Legion Y520-15IKBA-80WY001VGE | |
| PCMark 8 Home Score Accelerated v2 | 5445 pontos | |
| PCMark 8 Work Score Accelerated v2 | 5574 pontos | |
| PCMark 10 Score | 5961 pontos | |
Ajuda | ||
| MSI GT63 Titan 8RG-046 CUK Cyclone 500GB M.2 NVMe | Asus ROG GU501GM-BI7N8 Kingston RBUSNS8154P3128GJ | Razer Blade 15 2018 Samsung PM961 NVMe MZVLW512HMJP | Alienware 15 R3 Max-Q LiteOn CX2-8B256 | Asus Chimera G703GI 2x Intel 760p 512 GB + 1x Samsung SM961 512 GB (RAID) | Acer Predator Helios 500 PH517-51-79BY SK hynix SSD Canvas SC300 HFS256GD9MNE-6200A | |
|---|---|---|---|---|---|---|
| AS SSD | -96% | 18% | -12% | 67% | -28% | |
| Copy Game MB/s | 419.3 | 572 | 590 | |||
| Copy Program MB/s | 269.2 | 332 | 337 | |||
| Copy ISO MB/s | 773 | 1266 | 868 | |||
| Score Total | 3040 | 900 -70% | 3806 25% | 2328 -23% | 4843 59% | |
| Score Write | 902 | 345 -62% | 1450 61% | 894 -1% | 1855 106% | 812 -10% |
| Score Read | 1433 | 377 -74% | 1584 11% | 989 -31% | 1999 39% | 859 -40% |
| Access Time Write * | 0.042 | 0.058 -38% | 0.038 10% | 0.032 24% | 0.026 38% | 0.054 -29% |
| Access Time Read * | 0.05 | 0.278 -456% | 0.051 -2% | 0.063 -26% | 0.03 40% | |
| 4K-64 Write | 648 | 237 -63% | 1204 86% | 710 10% | 1303 101% | 647 0% |
| 4K-64 Read | 1144 | 270.3 -76% | 1300 14% | 741 -35% | 1453 27% | 723 -37% |
| 4K Write | 87.7 | 67.1 -23% | 93.6 7% | 119.3 36% | 141.3 61% | 80.7 -8% |
| 4K Read | 49.17 | 22.62 -54% | 46.45 -6% | 42.73 -13% | 57.4 17% | 38.57 -22% |
| Seq Write | 1665 | 404.7 -76% | 1521 -9% | 645 -61% | 4110 147% | 838 -50% |
| Seq Read | 2399 | 841 -65% | 2376 -1% | 2058 -14% | 4886 104% | 972 -59% |
* ... smaller is better

| 3DMark 11 | |
| 1280x720 Performance GPU | |
| Average of class Gaming (1029 - 72070, n=229, last 2 years) | |
| Asus Chimera G703GI | |
| MSI GT63 Titan 8RG-046 | |
| Average NVIDIA GeForce GTX 1080 Mobile (24868 - 31412, n=26) | |
| Alienware 15 R3 Max-Q | |
| Razer Blade 15 2018 | |
| Asus ROG GU501GM-BI7N8 | |
| Dell G5 15 5587 | |
| Dell Inspiron 15 7000 7577 4K | |
| Lenovo Legion Y520-15IKBA-80WY001VGE | |
| 1280x720 Performance Combined | |
| Average of class Gaming (1251 - 26759, n=228, last 2 years) | |
| Asus Chimera G703GI | |
| Average NVIDIA GeForce GTX 1080 Mobile (7533 - 16949, n=26) | |
| MSI GT63 Titan 8RG-046 | |
| Alienware 15 R3 Max-Q | |
| Asus ROG GU501GM-BI7N8 | |
| Dell Inspiron 15 7000 7577 4K | |
| Dell G5 15 5587 | |
| Razer Blade 15 2018 | |
| Lenovo Legion Y520-15IKBA-80WY001VGE | |
| 3DMark | |
| 1280x720 Cloud Gate Standard Graphics | |
| Asus Chimera G703GI | |
| Average of class Gaming (15902 - 193851, n=142, last 2 years) | |
| MSI GT63 Titan 8RG-046 | |
| Average NVIDIA GeForce GTX 1080 Mobile (88432 - 143992, n=24) | |
| Alienware 15 R3 Max-Q | |
| Razer Blade 15 2018 | |
| Dell G5 15 5587 | |
| Asus ROG GU501GM-BI7N8 | |
| Dell Inspiron 15 7000 7577 4K | |
| Lenovo Legion Y520-15IKBA-80WY001VGE | |
| 1920x1080 Fire Strike Graphics | |
| Average of class Gaming (781 - 53059, n=233, last 2 years) | |
| Asus Chimera G703GI | |
| Average NVIDIA GeForce GTX 1080 Mobile (18879 - 23091, n=24) | |
| MSI GT63 Titan 8RG-046 | |
| Alienware 15 R3 Max-Q | |
| Acer Predator Helios 500 PH517-51-79BY | |
| Razer Blade 15 2018 | |
| Asus ROG GU501GM-BI7N8 | |
| Dell G5 15 5587 | |
| Dell Inspiron 15 7000 7577 4K | |
| Lenovo Legion Y520-15IKBA-80WY001VGE | |
| 3DMark 11 Performance | 19463 pontos | |
| 3DMark Cloud Gate Standard Score | 35776 pontos | |
| 3DMark Fire Strike Score | 17582 pontos | |
Ajuda | ||
| Rise of the Tomb Raider | |
| 1024x768 Lowest Preset (sort by value) | |
| MSI GT63 Titan 8RG-046 | |
| Asus ROG GU501GM-BI7N8 | |
| Lenovo Legion Y520-15IKBA-80WY001VGE | |
| Dell G5 15 5587 | |
| Average NVIDIA GeForce GTX 1080 Mobile (148.8 - 261, n=3) | |
| 1366x768 Medium Preset AF:2x (sort by value) | |
| MSI GT63 Titan 8RG-046 | |
| Asus ROG GU501GM-BI7N8 | |
| Lenovo Legion Y520-15IKBA-80WY001VGE | |
| Dell G5 15 5587 | |
| Average NVIDIA GeForce GTX 1080 Mobile (139 - 218, n=3) | |
| 1920x1080 High Preset AA:FX AF:4x (sort by value) | |
| MSI GT63 Titan 8RG-046 | |
| Asus ROG GU501GM-BI7N8 | |
| Lenovo Legion Y520-15IKBA-80WY001VGE | |
| Dell G5 15 5587 | |
| Acer Predator Helios 500 PH517-51-79BY | |
| Average NVIDIA GeForce GTX 1080 Mobile (115.3 - 153.8, n=4) | |
| 1920x1080 Very High Preset AA:FX AF:16x (sort by value) | |
| MSI GT63 Titan 8RG-046 | |
| Asus ROG GU501GM-BI7N8 | |
| Lenovo Legion Y520-15IKBA-80WY001VGE | |
| Dell Inspiron 15 7000 7577 4K | |
| Dell G5 15 5587 | |
| Acer Predator Helios 500 PH517-51-79BY | |
| Average NVIDIA GeForce GTX 1080 Mobile (100.5 - 126.1, n=10) | |
| BioShock Infinite | |
| 1280x720 Very Low Preset (sort by value) | |
| MSI GT63 Titan 8RG-046 | |
| Asus ROG GU501GM-BI7N8 | |
| Lenovo Legion Y520-15IKBA-80WY001VGE | |
| Alienware 15 R3 Max-Q | |
| Dell G5 15 5587 | |
| Average NVIDIA GeForce GTX 1080 Mobile (221 - 380, n=5) | |
| 1366x768 Medium Preset (sort by value) | |
| MSI GT63 Titan 8RG-046 | |
| Asus ROG GU501GM-BI7N8 | |
| Lenovo Legion Y520-15IKBA-80WY001VGE | |
| Alienware 15 R3 Max-Q | |
| Dell G5 15 5587 | |
| Average NVIDIA GeForce GTX 1080 Mobile (192.8 - 321, n=5) | |
| 1366x768 High Preset (sort by value) | |
| MSI GT63 Titan 8RG-046 | |
| Asus ROG GU501GM-BI7N8 | |
| Lenovo Legion Y520-15IKBA-80WY001VGE | |
| Alienware 15 R3 Max-Q | |
| Dell G5 15 5587 | |
| Average NVIDIA GeForce GTX 1080 Mobile (181.4 - 303, n=5) | |
| 1920x1080 Ultra Preset, DX11 (DDOF) (sort by value) | |
| MSI GT63 Titan 8RG-046 | |
| Asus ROG GU501GM-BI7N8 | |
| Lenovo Legion Y520-15IKBA-80WY001VGE | |
| Dell Inspiron 15 7000 7577 4K | |
| Alienware 15 R3 Max-Q | |
| Dell G5 15 5587 | |
| Average NVIDIA GeForce GTX 1080 Mobile (151 - 181.2, n=12) | |
| Metro: Last Light | |
| 1024x768 Low (DX10) AF:4x (sort by value) | |
| MSI GT63 Titan 8RG-046 | |
| Average NVIDIA GeForce GTX 1080 Mobile () | |
| 1366x768 Medium (DX10) AF:4x (sort by value) | |
| MSI GT63 Titan 8RG-046 | |
| Average NVIDIA GeForce GTX 1080 Mobile () | |
| 1366x768 High (DX11) AF:16x (sort by value) | |
| MSI GT63 Titan 8RG-046 | |
| Average NVIDIA GeForce GTX 1080 Mobile () | |
| 1920x1080 Very High (DX11) AF:16x (sort by value) | |
| MSI GT63 Titan 8RG-046 | |
| Dell Inspiron 15 7000 7577 4K | |
| Average NVIDIA GeForce GTX 1080 Mobile (110.2 - 141.1, n=7) | |
| The Witcher 3 - 1920x1080 Ultra Graphics & Postprocessing (HBAO+) (sort by value) | |
| MSI GT63 Titan 8RG-046 | |
| Asus ROG GU501GM-BI7N8 | |
| Razer Blade 15 2018 | |
| Lenovo Legion Y520-15IKBA-80WY001VGE | |
| Dell Inspiron 15 7000 7577 4K | |
| Alienware 15 R3 Max-Q | |
| Dell G5 15 5587 | |
| Asus Chimera G703GI | |
| Acer Predator Helios 500 PH517-51-79BY | |
| Average NVIDIA GeForce GTX 1080 Mobile (61.7 - 78.1, n=23) | |
| Average of class Gaming (8.61 - 216, n=225, last 2 years) | |
| baixo | média | alto | ultra | |
| BioShock Infinite (2013) | 309 | 270 | 259 | 169 |
| Metro: Last Light (2013) | 128 | 131 | 129 | 117 |
| The Witcher 3 (2015) | 72 | |||
| Rise of the Tomb Raider (2016) | 210 | 166 | 131 | 120 |
Barulho
| Ocioso |
| 31.4 / 31.4 / 32.2 dB |
| Carga |
| 35.5 / 50.8 dB |
 | ||
30 dB silencioso 40 dB(A) audível 50 dB(A) ruidosamente alto |
||
min: | ||
| MSI GT63 Titan 8RG-046 GeForce GTX 1080 Mobile, i7-8750H, CUK Cyclone 500GB M.2 NVMe | Asus ROG GU501GM-BI7N8 GeForce GTX 1060 Mobile, i7-8750H, Kingston RBUSNS8154P3128GJ | Razer Blade 15 2018 GeForce GTX 1070 Max-Q, i7-8750H, Samsung PM961 NVMe MZVLW512HMJP | Alienware 15 R3 Max-Q GeForce GTX 1080 Max-Q, i7-7820HK, LiteOn CX2-8B256 | Dell G5 15 5587 GeForce GTX 1060 Max-Q, i5-8300H, SK hynix SC311 M.2 | Asus Chimera G703GI GeForce GTX 1080 Mobile, i9-8950HK, 2x Intel 760p 512 GB + 1x Samsung SM961 512 GB (RAID) | Acer Predator Helios 500 PH517-51-79BY GeForce GTX 1070 Mobile, i7-8750H, SK hynix SSD Canvas SC300 HFS256GD9MNE-6200A | |
|---|---|---|---|---|---|---|---|
| Noise | -5% | -5% | -7% | 2% | -14% | -4% | |
| off / environment * | 28 | 28.6 -2% | 29 -4% | 29 -4% | 30.3 -8% | 29 -4% | 30.4 -9% |
| Idle Minimum * | 31.4 | 31.4 -0% | 29 8% | 32 -2% | 31.1 1% | 30 4% | 31.2 1% |
| Idle Average * | 31.4 | 31.4 -0% | 30 4% | 33 -5% | 31.1 1% | 34 -8% | 35.3 -12% |
| Idle Maximum * | 32.2 | 34.2 -6% | 38 -18% | 35 -9% | 34.2 -6% | 42 -30% | 35.3 -10% |
| Load Average * | 35.5 | 42.8 -21% | 46 -30% | 46 -30% | 34.9 2% | 53 -49% | 44.4 -25% |
| Witcher 3 ultra * | 47.6 | 50.9 -7% | 49 -3% | 48 -1% | 42.7 10% | 51 -7% | 41 14% |
| Load Maximum * | 50.8 | 50.9 -0% | 46 9% | 50 2% | 44 13% | 53 -4% | 45.2 11% |
* ... smaller is better
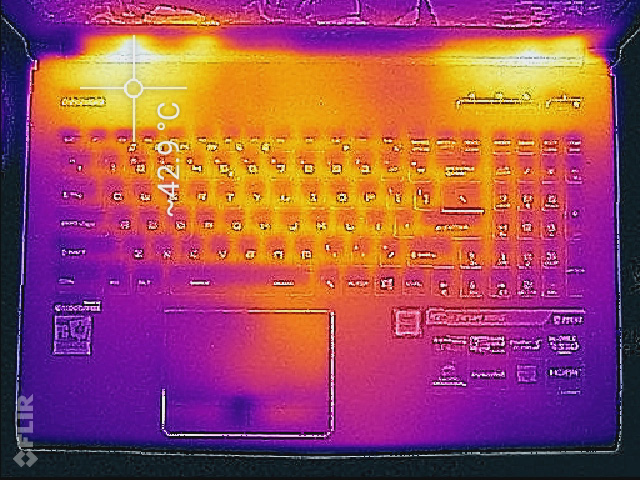
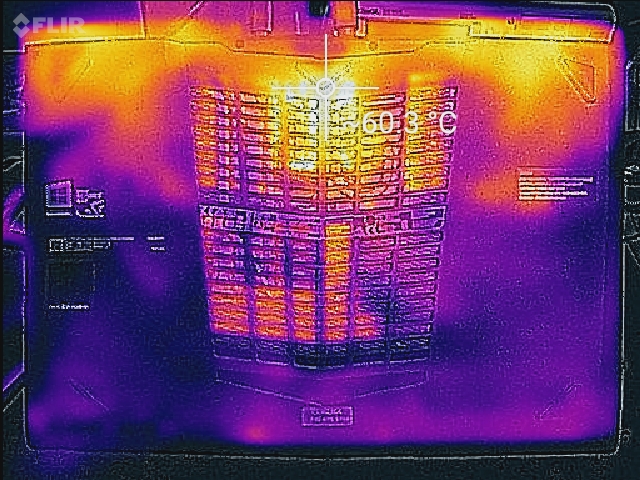
(±) The maximum temperature on the upper side is 41.6 °C / 107 F, compared to the average of 40.4 °C / 105 F, ranging from 21.2 to 68.8 °C for the class Gaming.
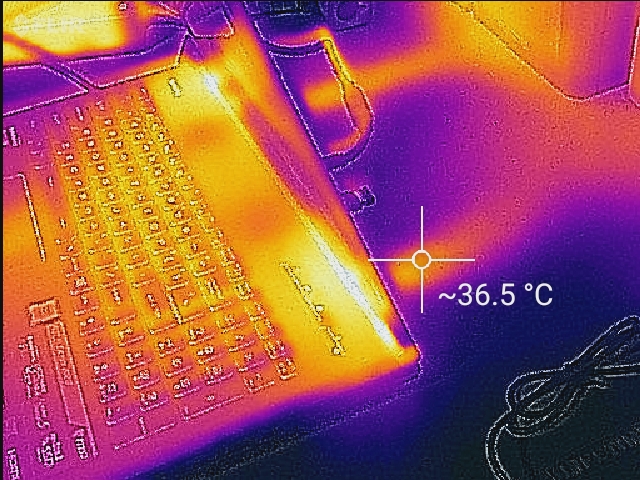
(-) The bottom heats up to a maximum of 54.8 °C / 131 F, compared to the average of 43.2 °C / 110 F
(±) The palmrests and touchpad can get very hot to the touch with a maximum of 37 °C / 98.6 F.
(-) The average temperature of the palmrest area of similar devices was 28.9 °C / 84 F (-8.1 °C / -14.6 F).
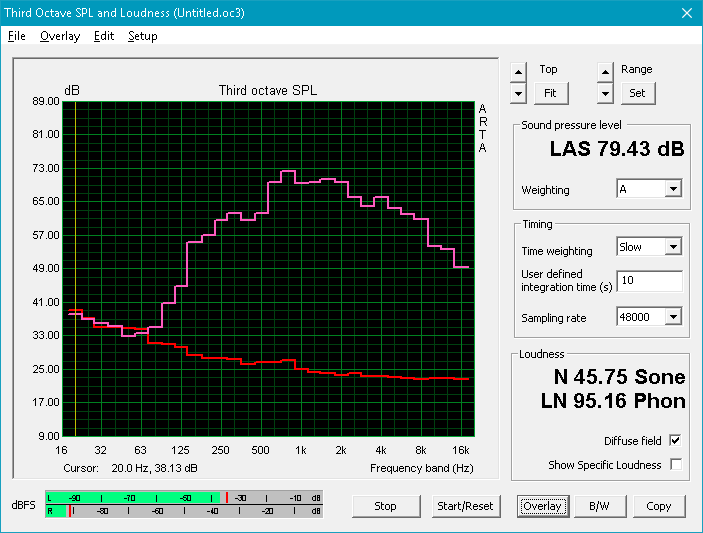
MSI GT63 Titan 8RG-046 audio analysis
(±) | speaker loudness is average but good (79.4 dB)
Bass 100 - 315 Hz
(±) | reduced bass - on average 8.7% lower than median
(±) | linearity of bass is average (12.1% delta to prev. frequency)
Mids 400 - 2000 Hz
(±) | higher mids - on average 6.2% higher than median
(+) | mids are linear (6% delta to prev. frequency)
Highs 2 - 16 kHz
(+) | balanced highs - only 2.9% away from median
(±) | linearity of highs is average (7.3% delta to prev. frequency)
Overall 100 - 16.000 Hz
(±) | linearity of overall sound is average (18.7% difference to median)
Compared to same class
» 59% of all tested devices in this class were better, 8% similar, 34% worse
» The best had a delta of 6%, average was 18%, worst was 132%
Compared to all devices tested
» 37% of all tested devices were better, 8% similar, 55% worse
» The best had a delta of 4%, average was 25%, worst was 134%
Asus Chimera G703GI audio analysis
(+) | speakers can play relatively loud (89 dB)
Bass 100 - 315 Hz
(±) | reduced bass - on average 8.9% lower than median
(+) | bass is linear (6.4% delta to prev. frequency)
Mids 400 - 2000 Hz
(+) | balanced mids - only 3.1% away from median
(+) | mids are linear (2.4% delta to prev. frequency)
Highs 2 - 16 kHz
(+) | balanced highs - only 4.4% away from median
(+) | highs are linear (3.2% delta to prev. frequency)
Overall 100 - 16.000 Hz
(+) | overall sound is linear (11.8% difference to median)
Compared to same class
» 10% of all tested devices in this class were better, 4% similar, 87% worse
» The best had a delta of 6%, average was 18%, worst was 132%
Compared to all devices tested
» 6% of all tested devices were better, 2% similar, 92% worse
» The best had a delta of 4%, average was 25%, worst was 134%
| desligado | |
| Ocioso | |
| Carga |
|
| MSI GT63 Titan 8RG-046 i7-8750H, GeForce GTX 1080 Mobile, CUK Cyclone 500GB M.2 NVMe, TN, 1920x1080, 15.60 | Asus ROG GU501GM-BI7N8 i7-8750H, GeForce GTX 1060 Mobile, Kingston RBUSNS8154P3128GJ, IPS, 1920x1080, 15.60 | Razer Blade 15 2018 i7-8750H, GeForce GTX 1070 Max-Q, Samsung PM961 NVMe MZVLW512HMJP, IPS, 1920x1080, 15.60 | Alienware 15 R3 Max-Q i7-7820HK, GeForce GTX 1080 Max-Q, LiteOn CX2-8B256, IPS, 1920x1080, 15.60 | Dell G5 15 5587 i5-8300H, GeForce GTX 1060 Max-Q, SK hynix SC311 M.2, IPS, 1920x1080, 15.60 | Asus Chimera G703GI i9-8950HK, GeForce GTX 1080 Mobile, 2x Intel 760p 512 GB + 1x Samsung SM961 512 GB (RAID), IPS, 1920x1080, 17.30 | Acer Predator Helios 500 PH517-51-79BY i7-8750H, GeForce GTX 1070 Mobile, SK hynix SSD Canvas SC300 HFS256GD9MNE-6200A, IPS, 1920x1080, 17.30 | |
|---|---|---|---|---|---|---|---|
| Power Consumption | 31% | 30% | 12% | 53% | -33% | 0% | |
| Idle Minimum * | 26.4 | 12.35 53% | 14 47% | 22 17% | 4.9 81% | 29 -10% | 20.4 23% |
| Idle Average * | 30 | 19.98 33% | 17 43% | 26 13% | 8.5 72% | 37 -23% | 26.5 12% |
| Idle Maximum * | 30.6 | 25.44 17% | 21 31% | 33 -8% | 9.1 70% | 46 -50% | 37 -21% |
| Load Average * | 90.4 | 94.28 -4% | 95 -5% | 86 5% | 90.7 -0% | 156 -73% | 129 -43% |
| Witcher 3 ultra * | 255.6 | 132.9 48% | 141 45% | 159 38% | 110 57% | 252 1% | 186 27% |
| Load Maximum * | 224.4 | 140.63 37% | 179 20% | 215 4% | 144 36% | 314 -40% | 216 4% |
* ... smaller is better
| MSI GT63 Titan 8RG-046 i7-8750H, GeForce GTX 1080 Mobile, 75.24 Wh | Asus ROG GU501GM-BI7N8 i7-8750H, GeForce GTX 1060 Mobile, 55 Wh | Razer Blade 15 2018 i7-8750H, GeForce GTX 1070 Max-Q, 80 Wh | Alienware 15 R3 Max-Q i7-7820HK, GeForce GTX 1080 Max-Q, 99 Wh | Dell G5 15 5587 i5-8300H, GeForce GTX 1060 Max-Q, 56 Wh | Asus Chimera G703GI i9-8950HK, GeForce GTX 1080 Mobile, 71 Wh | Acer Predator Helios 500 PH517-51-79BY i7-8750H, GeForce GTX 1070 Mobile, 72 Wh | |
|---|---|---|---|---|---|---|---|
| Battery Runtime | 24% | 66% | 65% | 102% | -33% | -10% | |
| WiFi v1.3 | 194 | 240 24% | 322 66% | 321 65% | 391 102% | 130 -33% | 174 -10% |
| Reader / Idle | 271 | 382 | 424 | 705 | 169 | 253 | |
| Load | 45 | 72 | 113 | 133 | 51 | 88 | |
| Witcher 3 ultra | 66 |
Pro
Contra


Para o desempenho bruto dos jogos, o MSI GT63 Titan 8RG faz o truque. O design pode não ter mudado, mas a velocidade geral só melhorou desde a última vez que avaliamos o GT62VR um par de anos atrás. Seu gerenciamento térmico é visivelmente melhor que o de seu antecessor, e o desempenho gráfico é absolutamente garantido. Sim, é grande, é pesado e é um pouco barulhento, mas é um clássico substituto de desktop.
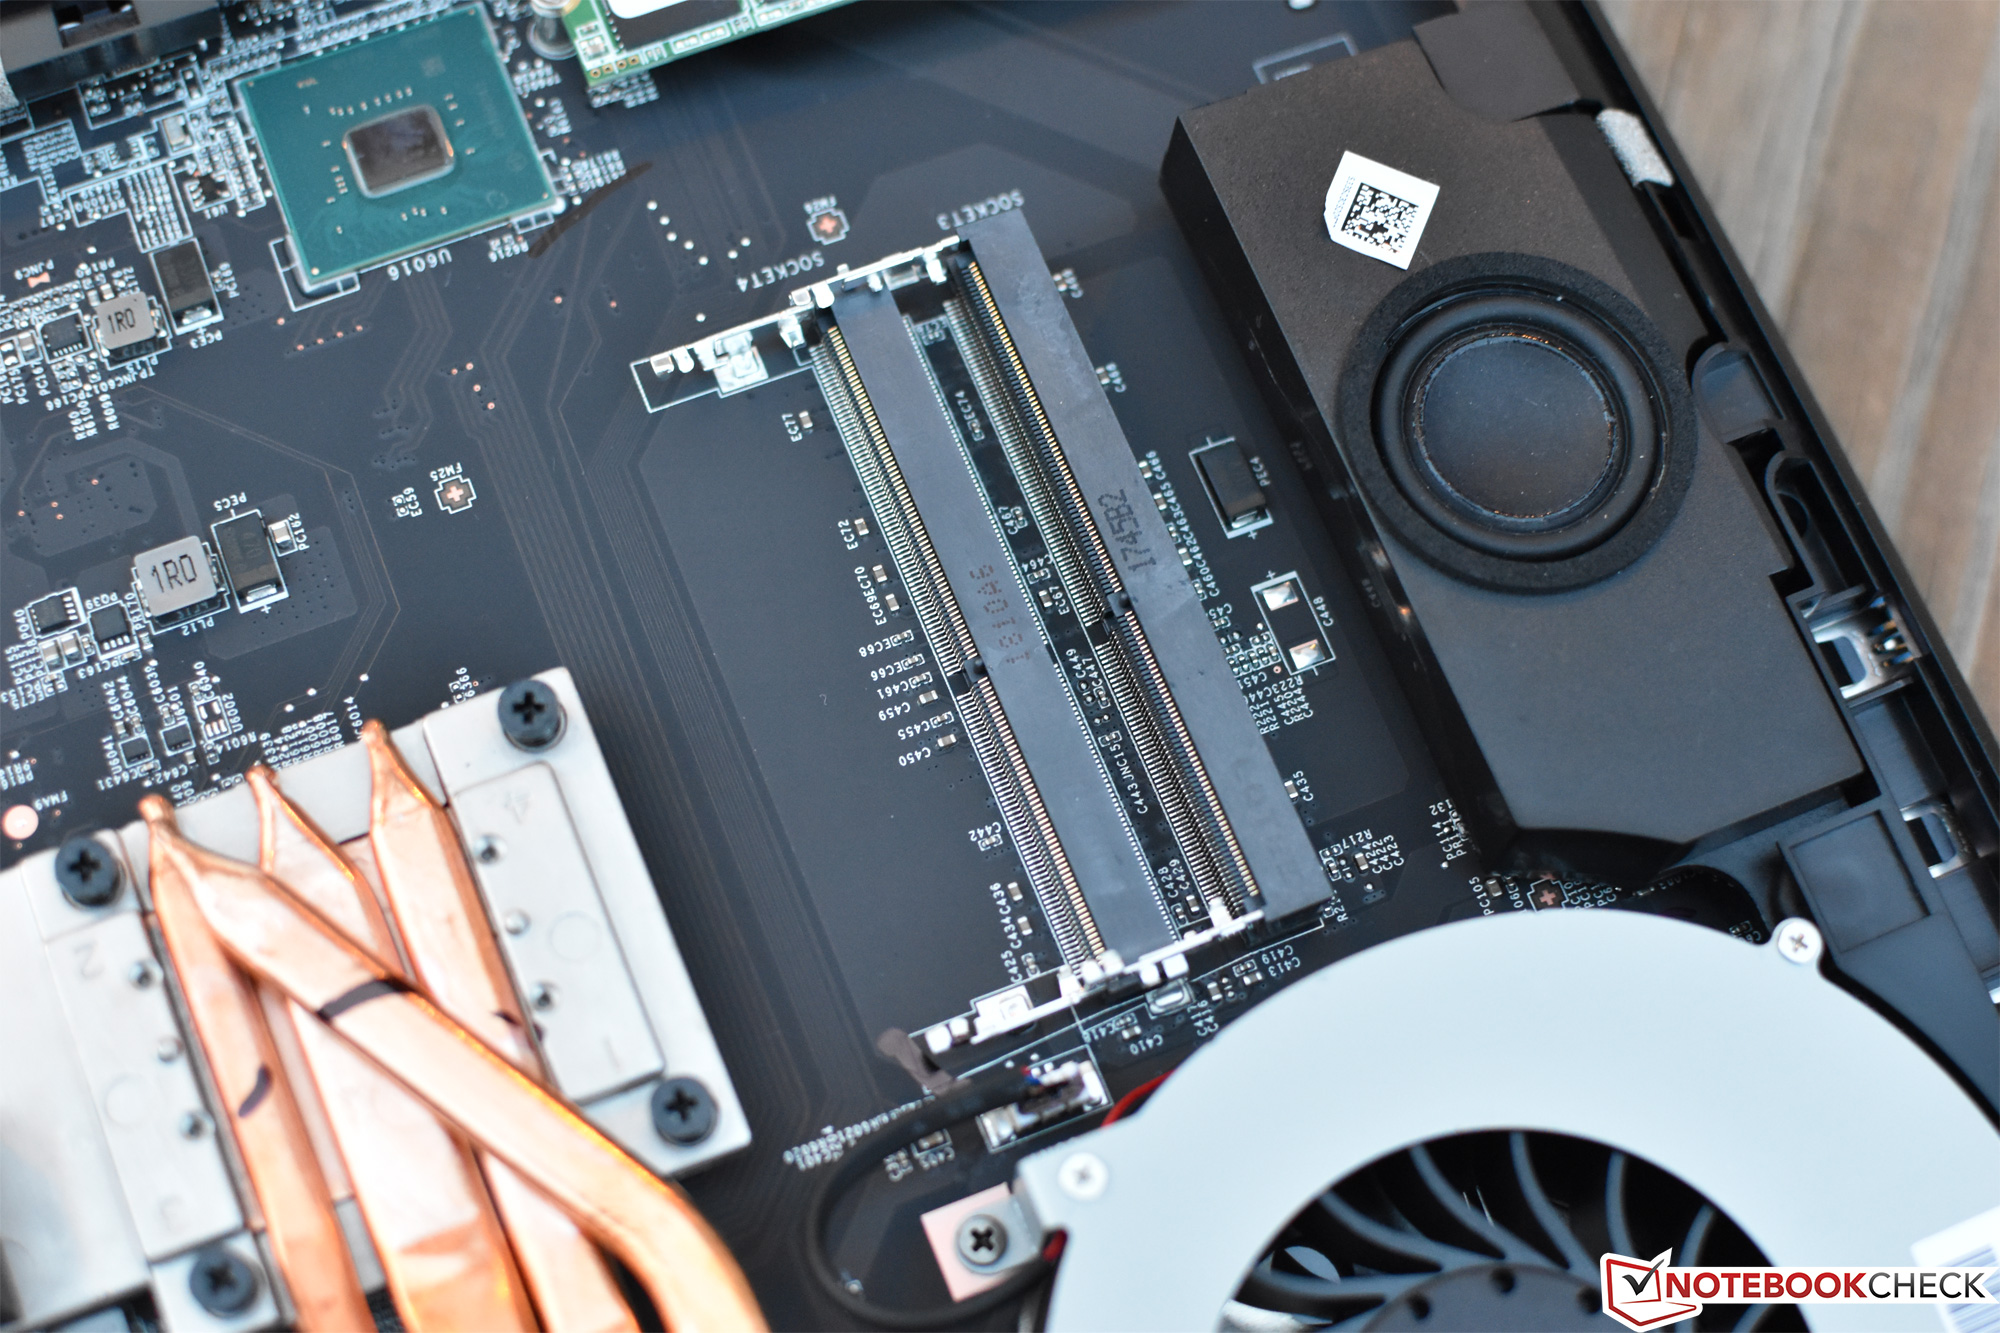
Além disso, só temos algumas outras queixas significativas. Idealmente, esperamos ver mais de um slot M.2 em uma máquina desse tamanho e classe para preparar o caminho para as opções de RAID ou até mesmo para três unidades de armazenamento separadas. Os botões do touchpad são barulhentos e irritantes (especialmente o botão esquerdo na nossa unidade de teste). E, embora seja uma queixa menor, o posicionamento de algumas das principais portas na parte traseira da unidade é um pouco inconveniente em alguns casos.
Sim, é grande, é pesado e é um pouco barulhento, mas o MSI GT63 Titan 8RG é um clássico substituto de desktop.
Mas será que vale a pena optar por este dispositivo de $2.639 sobre seus inúmeros concorrentes? Em comparação, enquanto ainda não tivemos a oportunidade de avaliar o Alienware 15 R4, o R3 oferece não apenas um, mas três slots SSD M.2 (dois dos quais são slots 2280 de tamanho completo) e, embora suas temperaturas de superfície em todo o teclado sejam mais altas, é, no geral uma máquina muito bem balanceada. O Logotipos da Asus e ROG. e o Acer Predator Helios 500 também oferecem um segundo slot M.2 e um ótimo desempenho, mas o esforço combina com o valor do GT63. Para aqueles dispostos a trocar um pouco de poder por portabilidade, a moderna categoria de dispositivos de jogos finos e leves oferece o MSI GS60, ASUS ROG GU501GM, e o Razer Blade 15, todos os quais apresentam seus próprios conjuntos de prós e contras. E finalmente, para aqueles com um orçamento, o Dell Inspiron 15 7000 (e o mais novo Dell G5 15) e as máquinas da série Lenovo Y500 podem ser um ótimo lugar para começar.
MSI GT63 Titan 8RG-046
-
07/02/2018 v6(old)
Steve Schardein
Pricecompare
