 Deutsch
 English
 Español
 Français
 Italiano
 Nederlands
 Polski
 Português
 Русский
 Türkçe
 Svenska
 Chinese
 Magyar
Breve Análise do Portátil Microsoft Surface Book (Core i7, 940M)
| |||||||||||||||||||||||||
iluminação: 88 %
iluminação com acumulador: 438 cd/m²
Contraste: 1752:1 (Preto: 0.25 cd/m²)
ΔE Color 2.06 | 0.5-29.43 Ø5
ΔE Greyscale 2.87 | 0.57-98 Ø5.3
96% sRGB (Argyll 1.6.3 3D)
64% AdobeRGB 1998 (Argyll 1.6.3 3D)
68% AdobeRGB 1998 (Argyll 2.2.0 3D)
96% sRGB (Argyll 2.2.0 3D)
66.3% Display P3 (Argyll 2.2.0 3D)
Gamma: 2.44
| Microsoft Surface Book Core i7 13.50, 3000x2000 | Apple MacBook Pro Retina 13 inch 2015-03 13.30, 2560x1600 | Toshiba KIRA-10D 13.30, 1920x1080 | Microsoft Surface Pro 4, Core i5, 128GB 12.30, 2736x1824 | Dell XPS 13 9343 Core i7 13.30, 3200x1800 | HP Spectre x360 13-4104ng 13.30, 2560x1440 | HP Spectre x2 12-a003ng K3D42EA 12.00, 1920x1080 | |
|---|---|---|---|---|---|---|---|
| Display | -0% | 3% | -1% | -6% | -1% | -23% | |
| Display P3 Coverage | 66.3 | 65.9 -1% | 69.1 4% | 65 -2% | 62.6 -6% | 66.8 1% | 52.9 -20% |
| sRGB Coverage | 96 | 97 1% | 98.2 2% | 96.5 1% | 89.8 -6% | 92.8 -3% | 71.8 -25% |
| AdobeRGB 1998 Coverage | 68 | 67.4 -1% | 71 4% | 67 -1% | 64.2 -6% | 67.3 -1% | 52.6 -23% |
| Response Times | -5% | 41% | 2% | ||||
| Response Time Grey 50% / Grey 80% * | 39 ? | 46 ? -18% | 24 ? 38% | 47 ? -21% | |||
| Response Time Black / White * | 34 ? | 31.2 ? 8% | 19 ? 44% | 26 ? 24% | |||
| PWM Frequency | 50 ? | ||||||
| Screen | -9% | -11% | -20% | -28% | -34% | -59% | |
| Brightness middle | 438 | 361 -18% | 334 -24% | 413 -6% | 232 -47% | 324 -26% | 353 -19% |
| Brightness | 414 | 342 -17% | 316 -24% | 396 -4% | 231 -44% | 324 -22% | 347 -16% |
| Brightness Distribution | 88 | 81 -8% | 92 5% | 87 -1% | 82 -7% | 90 2% | 91 3% |
| Black Level * | 0.25 | 0.361 -44% | 0.29 -16% | 0.36 -44% | 0.25 -0% | 0.34 -36% | 0.44 -76% |
| Contrast | 1752 | 1000 -43% | 1152 -34% | 1147 -35% | 928 -47% | 953 -46% | 802 -54% |
| Colorchecker dE 2000 * | 2.06 | 1.82 12% | 2.27 -10% | 3.09 -50% | 3.63 -76% | 4.36 -112% | 6.09 -196% |
| Greyscale dE 2000 * | 2.87 | 1.8 37% | 2.47 14% | 3.92 -37% | 2.57 10% | 4.62 -61% | 6.24 -117% |
| Gamma | 2.44 90% | 2.49 88% | 2.36 93% | 2.3 96% | 2.17 101% | 2.18 101% | 2.41 91% |
| CCT | 6820 95% | 6417 101% | 6872 95% | 7333 89% | 6422 101% | 6857 95% | 7238 90% |
| Color Space (Percent of AdobeRGB 1998) | 64 | 61.9 -3% | 64 0% | 61 -5% | 58 -9% | 60 -6% | 46 -28% |
| Color Space (Percent of sRGB) | 96 | 96.9 1% | 97 1% | 93 -3% | 71 -26% | ||
| Colorchecker dE 2000 max. * | 3.26 | ||||||
| Total Average (Program / Settings) | -5% /
-7% | -4% /
-7% | -9% /
-14% | -17% /
-22% | 2% /
-17% | -27% /
-42% |
* ... smaller is better
Display Response Times
| ↔ Response Time Black to White | ||
|---|---|---|
| 34 ms ... rise ↗ and fall ↘ combined | ↗ 10 ms rise | 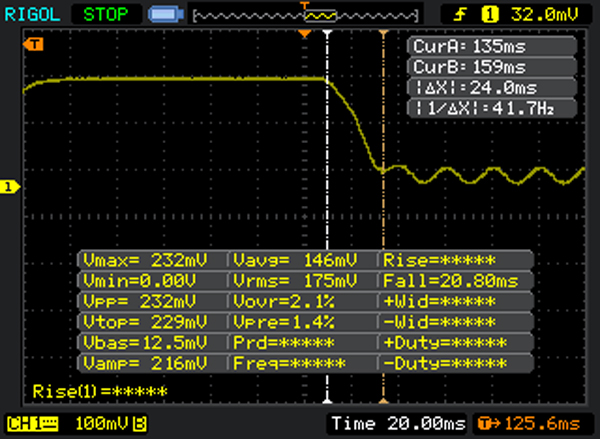 |
| ↘ 24 ms fall | ||
| The screen shows slow response rates in our tests and will be unsatisfactory for gamers. In comparison, all tested devices range from 0.1 (minimum) to 240 (maximum) ms. » 89 % of all devices are better. This means that the measured response time is worse than the average of all tested devices (21.5 ms). | ||
| ↔ Response Time 50% Grey to 80% Grey | ||
| 39 ms ... rise ↗ and fall ↘ combined | ↗ 24 ms rise | 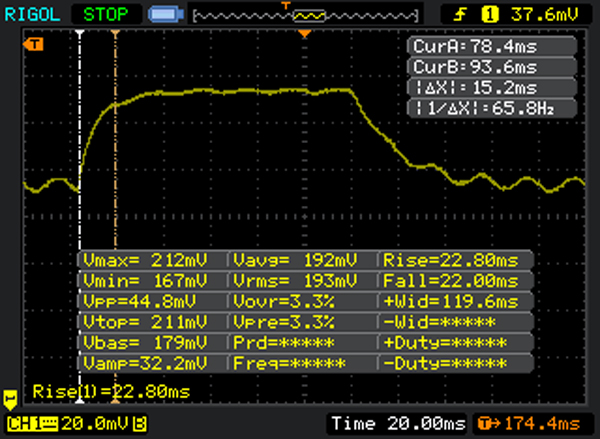 |
| ↘ 15 ms fall | ||
| The screen shows slow response rates in our tests and will be unsatisfactory for gamers. In comparison, all tested devices range from 0.2 (minimum) to 636 (maximum) ms. » 53 % of all devices are better. This means that the measured response time is worse than the average of all tested devices (33.7 ms). | ||
Screen Flickering / PWM (Pulse-Width Modulation)
| Screen flickering / PWM not detected | ||
In comparison: 53 % of all tested devices do not use PWM to dim the display. If PWM was detected, an average of 17900 (minimum: 5 - maximum: 3846000) Hz was measured. | ||
| PCMark 7 | |
| Score (sort by value) | |
| Microsoft Surface Book Core i7 | |
| Microsoft Surface Book Core i5 | |
| Microsoft Surface Pro 4, Core m3 | |
| Microsoft Surface Pro 4, Core i5, 128GB | |
| Microsoft Surface Pro 4 Core i7 | |
| HP EliteBook Folio 1040 G2 | |
| Apple MacBook Pro Retina 13 inch 2015-03 | |
| Toshiba KIRA-10D | |
| HP Spectre x360 13-4104ng | |
| HP Spectre x360 13-4104ng | |
| Productivity (sort by value) | |
| Microsoft Surface Book Core i7 | |
| Microsoft Surface Book Core i5 | |
| Microsoft Surface Pro 4, Core i5, 128GB | |
| Microsoft Surface Pro 4 Core i7 | |
| HP EliteBook Folio 1040 G2 | |
| Apple MacBook Pro Retina 13 inch 2015-03 | |
| HP Spectre x360 13-4104ng | |
| HP Spectre x360 13-4104ng | |
| PCMark 7 Score | 5178 pontos | |
| PCMark 8 Home Score Accelerated v2 | 2947 pontos | |
| PCMark 8 Creative Score Accelerated v2 | 3755 pontos | |
| PCMark 8 Work Score Accelerated v2 | 3782 pontos | |
Ajuda | ||
| Microsoft Surface Book Core i7 13.50, 3000x2000 | Microsoft Surface Book Core i5 13.50, 3000x2000 | Microsoft Surface Pro 4 Core i7 12.30, 2736x1824 | HP EliteBook Folio 1040 G2 14.00, 1920x1080 | Apple MacBook Pro Retina 13 inch 2015-03 13.30, 2560x1600 | Toshiba KIRA-10D 13.30, 1920x1080 | Dell XPS 13 9343 Core i7 13.30, 3200x1800 | HP Spectre x2 12-a003ng K3D42EA 12.00, 1920x1080 | |
|---|---|---|---|---|---|---|---|---|
| AS SSD | -14% | -15% | -50% | -29% | -47% | -48% | -60% | |
| Seq Read | 1342 | 1223 -9% | 1312 -2% | 480.7 -64% | 1233 -8% | 515 -62% | 515 -62% | 439.1 -67% |
| Seq Write | 545 | 275.2 -50% | 274.8 -50% | 250.1 -54% | 616 13% | 467.6 -14% | 233.4 -57% | 216.9 -60% |
| 4K Read | 37.25 | 34.31 -8% | 33.47 -10% | 25.98 -30% | 20.6 -45% | 21.74 -42% | 26.28 -29% | 23.12 -38% |
| 4K Write | 109 | 85 -22% | 89.2 -18% | 84.4 -23% | 30.2 -72% | 78.8 -28% | 91.7 -16% | 49.2 -55% |
| 4K-64 Read | 919 | 1409 53% | 1280 39% | 356.1 -61% | 891 -3% | 352.6 -62% | 359 -61% | 265.6 -71% |
| 4K-64 Write | 520 | 281.4 -46% | 268.7 -48% | 182.7 -65% | 221.2 -57% | 149.7 -71% | 181 -65% | 151.8 -71% |
| CrystalDiskMark 3.0 | -27% | -39% | -1% | -31% | -40% | -52% | ||
| Read Seq | 953 | 834 -12% | 499.9 -48% | 1403 47% | 530 -44% | 527 -45% | 410.1 -57% | |
| Write Seq | 592 | 304 -49% | 264.3 -55% | 657 11% | 474.3 -20% | 237.2 -60% | 316 -47% | |
| Read 512 | 520 | 396.7 -24% | 418.9 -19% | 810 56% | 426.1 -18% | 420.5 -19% | 260.8 -50% | |
| Write 512 | 591 | 304.3 -49% | 264.6 -55% | 648 10% | 445.8 -25% | 241.6 -59% | 241.6 -59% | |
| Read 4k | 42.66 | 40.75 -4% | 28.4 -33% | 20.95 -51% | 23.27 -45% | 28.29 -34% | 27.4 -36% | |
| Write 4k | 136.3 | 106.3 -22% | 101.2 -26% | 32.43 -76% | 90.1 -34% | 103.7 -24% | 53.5 -61% | |
| Total Average (Program / Settings) | -14% /
-14% | -21% /
-21% | -45% /
-44% | -15% /
-15% | -39% /
-39% | -44% /
-44% | -56% /
-56% |

| Microsoft Surface Book Core i7 13.50, 3000x2000 | Microsoft Surface Book i7 Heat Keyboard iGPU 13.50, 3000x2000 | Microsoft Surface Book Core i5 13.50, 3000x2000 | Microsoft Surface Pro 4, Core m3 12.30, 2736x1824 | Microsoft Surface Pro 4, Core i5, 128GB 12.30, 2736x1824 | Microsoft Surface Pro 4 Core i7 12.30, 2736x1824 | HP EliteBook Folio 1040 G2 14.00, 1920x1080 | Apple MacBook Pro Retina 13 inch 2015-03 13.30, 2560x1600 | Dell XPS 13 9343 Core i7 13.30, 3200x1800 | HP Spectre x2 12-a003ng K3D42EA 12.00, 1920x1080 | |
|---|---|---|---|---|---|---|---|---|---|---|
| 3DMark 11 | -32% | -5% | -47% | -35% | -3% | -47% | -28% | -44% | -56% | |
| 1280x720 Performance Physics | 4760 | 4765 0% | 4199 -12% | 3067 -36% | 3984 -16% | 4919 3% | 3692 -22% | 4084 -14% | 3845 -19% | 2604 -45% |
| 1280x720 Performance GPU | 2606 | 1319 -49% | 2548 -2% | 1206 -54% | 1402 -46% | 2450 -6% | 1011 -61% | 1706 -35% | 1115 -57% | 996 -62% |
| 1280x720 Performance | 2761 | 1480 -46% | 2711 -2% | 1344 -51% | 1565 -43% | 2624 -5% | 1133 -59% | 1828 -34% | 1252 -55% | 1098 -60% |
| 3DMark | -34% | -2% | -36% | -19% | 12% | -11% | -14% | -21% | -36% | |
| 1280x720 Cloud Gate Standard Physics | 3745 | 3701 -1% | 3362 -10% | 2238 -40% | 3342 -11% | 3639 -3% | 3185 -15% | 3527 -6% | 3362 -10% | 2304 -38% |
| 1280x720 Ice Storm Standard Physics | 36360 | 31340 -14% | 38206 5% | 25720 -29% | 38764 7% | 44259 22% | 37081 2% | 38688 6% | 38854 7% | 27821 -23% |
| 1280x720 Ice Storm Standard Graphics | 54706 | 22709 -58% | 54088 -1% | 51362 -6% | 56071 2% | 91565 67% | 60003 10% | 60636 11% | 54695 0% | 50126 -8% |
| 1280x720 Cloud Gate Standard Graphics | 11420 | 6274 -45% | 11340 -1% | 6597 -42% | 7455 -35% | 11650 2% | 6585 -42% | 7894 -31% | 6475 -43% | 6298 -45% |
| 1920x1080 Fire Strike Graphics | 2120 | 1010 -52% | 2031 -4% | 810 -62% | 905 -57% | 1477 -30% | 1020 -52% | 834 -61% | 725 -66% | |
| Total Average (Program / Settings) | -33% /
-33% | -4% /
-3% | -42% /
-40% | -27% /
-25% | 5% /
6% | -29% /
-27% | -21% /
-19% | -33% /
-30% | -46% /
-43% |
| 3DMark 11 Performance | 2761 pontos | |
| 3DMark Ice Storm Standard Score | 50418 pontos | |
| 3DMark Cloud Gate Standard Score | 7505 pontos | |
| 3DMark Fire Strike Score | 1952 pontos | |
Ajuda | ||
| Microsoft Surface Book Core i7 13.50, 3000x2000 | Microsoft Surface Book Core i5 13.50, 3000x2000 | Microsoft Surface Pro 4 Core i7 12.30, 2736x1824 | HP EliteBook Folio 1040 G2 14.00, 1920x1080 | Apple MacBook Pro Retina 13 inch 2015-03 13.30, 2560x1600 | Toshiba KIRA-10D 13.30, 1920x1080 | Dell XPS 13 9343 Core i7 13.30, 3200x1800 | HP Spectre x360 13-4104ng 13.30, 2560x1440 | |
|---|---|---|---|---|---|---|---|---|
| Noise | 3% | 3% | 4% | -1% | -2% | -3% | 3% | |
| off / environment * | 31.3 | |||||||
| Idle Minimum * | 31.3 | 29.5 6% | 28.4 9% | 29.6 5% | 29 7% | 29.6 5% | 29.6 5% | 29.6 5% |
| Idle Average * | 31.3 | 29.6 5% | 28.6 9% | 29.6 5% | 29 7% | 29.6 5% | 29.6 5% | 29.6 5% |
| Idle Maximum * | 31.3 | 29.7 5% | 28.7 8% | 32.2 -3% | 29 7% | 30.7 2% | 33.2 -6% | 34.6 -11% |
| Load Average * | 38 | 37.5 1% | 40.8 -7% | 36.4 4% | 42.5 -12% | 43.9 -16% | 43.2 -14% | 34.7 9% |
| Load Maximum * | 40.5 | 40.9 -1% | 41.4 -2% | 36.4 10% | 45.6 -13% | 43.9 -8% | 43.2 -7% | 37.9 6% |
* ... smaller is better
Barulho
| Ocioso |
| 31.3 / 31.3 / 31.3 dB |
| Carga |
| 38 / 40.5 dB |
 | ||
30 dB silencioso 40 dB(A) audível 50 dB(A) ruidosamente alto |
||
min: | ||
| Microsoft Surface Book Core i7 13.50, 3000x2000 | Microsoft Surface Book Core i5 13.50, 3000x2000 | Microsoft Surface Pro 4, Core i5, 128GB 12.30, 2736x1824 | Microsoft Surface Pro 4 Core i7 12.30, 2736x1824 | HP EliteBook Folio 1040 G2 14.00, 1920x1080 | Apple MacBook Pro Retina 13 inch 2015-03 13.30, 2560x1600 | Toshiba KIRA-10D 13.30, 1920x1080 | Dell XPS 13 9343 Core i7 13.30, 3200x1800 | HP Spectre x2 12-a003ng K3D42EA 12.00, 1920x1080 | |
|---|---|---|---|---|---|---|---|---|---|
| Heat | 13% | -21% | 12% | 10% | 7% | 13% | 14% | 2% | |
| Maximum Upper Side * | 47.4 | 44.2 7% | 52.3 -10% | 45.4 4% | 35.9 24% | 45.1 5% | 42.2 11% | 43.4 8% | 43.5 8% |
| Maximum Bottom * | 50.2 | 41.2 18% | 51.4 -2% | 43.2 14% | 42.4 16% | 39.6 21% | 34.4 31% | 37 26% | 42 16% |
| Idle Upper Side * | 30.4 | 26 14% | 43.2 -42% | 25.2 17% | 28.5 6% | 28.5 6% | 26.2 14% | 25.9 15% | 33 -9% |
| Idle Bottom * | 27.4 | 23.8 13% | 36 -31% | 24 12% | 29 -6% | 28.3 -3% | 28.5 -4% | 25.1 8% | 29.3 -7% |
* ... smaller is better
Heat Tablet
(-) The maximum temperature on the upper side is 47.4 °C / 117 F, compared to the average of 35.3 °C / 96 F, ranging from 19.6 to 55.7 °C for the class Convertible.
(-) The bottom heats up to a maximum of 50.2 °C / 122 F, compared to the average of 36.8 °C / 98 F
(+) In idle usage, the average temperature for the upper side is 26.6 °C / 80 F, compared to the device average of 30.2 °C / 86 F.
(-) The palmrests and touchpad can get very hot to the touch with a maximum of 47.35 °C / 117.2 F.
(-) The average temperature of the palmrest area of similar devices was 28.1 °C / 82.6 F (-19.3 °C / -34.6 F).
Heat Keyboard with Maxwell Geforce
(+) The maximum temperature on the upper side is 39.6 °C / 103 F, compared to the average of 35.3 °C / 96 F, ranging from 19.6 to 55.7 °C for the class Convertible.
(±) The bottom heats up to a maximum of 40.7 °C / 105 F, compared to the average of 36.8 °C / 98 F
(+) The palmrests and touchpad are cooler than skin temperature with a maximum of 28.6 °C / 83.5 F and are therefore cool to the touch.
(±) The average temperature of the palmrest area of similar devices was 28.1 °C / 82.6 F (-0.5 °C / -0.9 F).
| Microsoft Surface Book Core i7 13.50, 3000x2000 | Microsoft Surface Pro 4, Core i5, 128GB 12.30, 2736x1824 | HP EliteBook Folio 1040 G2 14.00, 1920x1080 | Apple MacBook Pro Retina 13 inch 2015-03 13.30, 2560x1600 | Toshiba KIRA-10D 13.30, 1920x1080 | Dell XPS 13 9343 Core i7 13.30, 3200x1800 | HP Spectre x360 13-4104ng 13.30, 2560x1440 | HP Spectre x2 12-a003ng K3D42EA 12.00, 1920x1080 | |
|---|---|---|---|---|---|---|---|---|
| Power Consumption | 29% | 40% | 13% | 41% | 8% | 30% | 35% | |
| Idle Minimum * | 4.5 | 4.4 2% | 3.2 29% | 2.8 38% | 2.6 42% | 6.6 -47% | 3.9 13% | 4.5 -0% |
| Idle Average * | 9.8 | 9 8% | 6.5 34% | 7.8 20% | 6.3 36% | 9.3 5% | 7.4 24% | 7.7 21% |
| Idle Maximum * | 12.2 | 10.7 12% | 7.4 39% | 8.1 34% | 6.5 47% | 11 10% | 9.2 25% | 8.3 32% |
| Load Average * | 46 | 19.6 57% | 25.6 44% | 52.4 -14% | 30.9 33% | 32.2 30% | 28.1 39% | 19.8 57% |
| Load Maximum * | 56 | 19.9 64% | 26.1 53% | 62.8 -12% | 30.9 45% | 33.2 41% | 27.6 51% | 20.6 63% |
* ... smaller is better
| desligado | |
| Ocioso | |
| Carga |
|
Pro
Contra
Ele se esforça bastante e consegue um ponto a mais que o seu irmão Core i5 da nossa primeira análise do Surface Book. O fator decisivo foi a duração amis longa, porque não conseguimos encontrar vantagens da versão i7/512 GB no que diz respeito ao processador e desempenho dos aplicativos. O grande SSD consegue maiores velocidades de escritura, que é, pelo menos, um aspecto. O aquecimento é maior comparado com o modelo i5, mas o pousa palmas permanece confortavelmente frio. Nossas medições de consumo foram realizadas para o Surface Book pela primeira vez nesta análise.
Chippy de nossa equipe de editorial de vídeos mostrou em seu Power Director Renders Test (Intel Quick Sync) que o Surface Book i7 é quase 30% mais veloz que os rivais Lenovo Miix 700 (core m3), HP Spectre X2 (Core m7) e Microsoft Surface Pro 3 (Haswell Core i5). O motivo: O resfriamento ativo garante uma alta utilização do Turbo inclusive durante o teste de estresse, enquanto que os sistemas sem ventoinha devem reduzir suas velocidades. O poderoso Surface Book – não importa se o Core i5 ou i7 – é, portanto, adequado parar aplicativos especiais e focados no processador que também devem ser utilizados durante viagens de vez em quando (desempenho pleno com energia da bateria).
Se você deseja economizar cada minuto durante a renderização, então o Surface Book certamente é a melhor opção. Ele fornece o desempenho de CPU de um pequeno portátil multimídia e consegue superar concorrentes de tamanho similar, como o MacBook Pro 13 ou Dell XPS 13. Você terá que decidir por si mesmo se isto valo os 2.000 até quase 3.000 Euros (~$2198 a $3298). mas o Surface Book é definitivamente uma boa opção para os entusiastas da tecnologia.
Todos os detalhes do Surface Book estão disponíveis na análise da versão Core i5: Microsoft Surface Book Core i5.
Nota: Ajustamos a avaliação do Surface Book i5 devido a uma nova versão de avaliação. Graças à maior sub-avaliação da conectividade, a avaliação final é vai de 85 a 86%.
Esta é uma versão reduzida da análise original. Você pode ler a análise completa em inglês aqui.
Microsoft Surface Book Core i7
-
04/27/2016 v5.1(old)
Sebastian Jentsch
Pricecompare
