Deutsch
 English
 Español
 Français
 Italiano
 Nederlands
 Polski
 Português
 Русский
 Türkçe
 Svenska
 Chinese
 Magyar
Breve Análise do Portátil Schenker Technologies Key 15 (Clevo P955HP6)

| SD Card Reader | |
| average JPG Copy Test (av. of 3 runs) | |
| SCHENKER Key 15 (Toshiba Exceria Pro SDXC 64 GB UHS-II) | |
| Dell XPS 15 9560 (i7-7700HQ, UHD) (Toshiba Exceria Pro SDXC 64 GB UHS-II) | |
| Average of class Multimedia (17.6 - 205, n=66, last 2 years) | |
| Gigabyte Aero 15 (Toshiba Exceria Pro SDXC 64 GB UHS-II) | |
| Asus Zenbook Pro UX550VE-DB71T (Toshiba Exceria Pro SDXC 64 GB UHS-II) | |
| Acer Aspire VN7-593G-73HP V15 Nitro BE | |
| maximum AS SSD Seq Read Test (1GB) | |
| Dell XPS 15 9560 (i7-7700HQ, UHD) (Toshiba Exceria Pro SDXC 64 GB UHS-II) | |
| SCHENKER Key 15 (Toshiba Exceria Pro SDXC 64 GB UHS-II) | |
| Average of class Multimedia (16.8 - 266, n=62, last 2 years) | |
| Asus Zenbook Pro UX550VE-DB71T (Toshiba Exceria Pro SDXC 64 GB UHS-II) | |
| Gigabyte Aero 15 (Toshiba Exceria Pro SDXC 64 GB UHS-II) | |
| Acer Aspire VN7-593G-73HP V15 Nitro BE | |


| |||||||||||||||||||||||||
iluminação: 84 %
iluminação com acumulador: 285 cd/m²
Contraste: 1018:1 (Preto: 0.28 cd/m²)
ΔE Color 4.09 | 0.5-29.43 Ø5
ΔE Greyscale 4.39 | 0.57-98 Ø5.3
92% sRGB (Argyll 1.6.3 3D)
60% AdobeRGB 1998 (Argyll 1.6.3 3D)
67.6% AdobeRGB 1998 (Argyll 2.2.0 3D)
92.4% sRGB (Argyll 2.2.0 3D)
66.7% Display P3 (Argyll 2.2.0 3D)
Gamma: 2.32
| SCHENKER Key 15 AUO22EB, IPS, 3840x2160 | Gigabyte Aero 15 N156HCA-EA1 (CMN15D7), IPS, 1920x1080 | Acer Aspire VN7-593G-73HP V15 Nitro BE LG Display LP156WF6-SPP1, AH-IPS, Normally Black, Transmissive, 1920x1080 | Asus Zenbook Pro UX550VE-DB71T N156HCE-EN1 (CMN15E8), IPS, 1920x1080 | Dell XPS 15 9560 (i7-7700HQ, UHD) IGZO IPS, 3840x2160 | |
|---|---|---|---|---|---|
| Display | -1% | -6% | -3% | 30% | |
| Display P3 Coverage | 66.7 | 65.2 -2% | 65.8 -1% | 64.3 -4% | 89.7 34% |
| sRGB Coverage | 92.4 | 92.5 0% | 85.1 -8% | 90.4 -2% | 100 8% |
| AdobeRGB 1998 Coverage | 67.6 | 66.5 -2% | 62.2 -8% | 65.3 -3% | 100 48% |
| Response Times | 2% | 1% | 1% | -25% | |
| Response Time Grey 50% / Grey 80% * | 48 ? | 42.8 ? 11% | 41 ? 15% | 43.2 ? 10% | 57.2 ? -19% |
| Response Time Black / White * | 30 ? | 32 ? -7% | 34 ? -13% | 32.8 ? -9% | 39.2 ? -31% |
| PWM Frequency | 26000 ? | 25510 ? | 962 | ||
| Screen | -9% | -5% | -19% | 2% | |
| Brightness middle | 285 | 320 12% | 322 13% | 288.2 1% | 370.1 30% |
| Brightness | 293 | 316 8% | 297 1% | 266 -9% | 356 22% |
| Brightness Distribution | 84 | 90 7% | 86 2% | 75 -11% | 87 4% |
| Black Level * | 0.28 | 0.36 -29% | 0.31 -11% | 0.3 -7% | 0.37 -32% |
| Contrast | 1018 | 889 -13% | 1039 2% | 961 -6% | 1000 -2% |
| Colorchecker dE 2000 * | 4.09 | 4.62 -13% | 4.73 -16% | 5.5 -34% | 5.3 -30% |
| Colorchecker dE 2000 max. * | 7.94 | 9.75 -23% | 12.37 -56% | 11.3 -42% | 9.9 -25% |
| Greyscale dE 2000 * | 4.39 | 6 -37% | 2.99 32% | 7.9 -80% | 4.6 -5% |
| Gamma | 2.32 95% | 2.46 89% | 2.32 95% | 2.09 105% | 2.31 95% |
| CCT | 6706 97% | 6761 96% | 6905 94% | 6559 99% | 6284 103% |
| Color Space (Percent of AdobeRGB 1998) | 60 | 60 0% | 56 -7% | 58.5 -2% | 88.3 47% |
| Color Space (Percent of sRGB) | 92 | 92 0% | 85 -8% | 90 -2% | 100 9% |
| Total Average (Program / Settings) | -3% /
-6% | -3% /
-4% | -7% /
-13% | 2% /
4% |
* ... smaller is better
Display Response Times
| ↔ Response Time Black to White | ||
|---|---|---|
| 30 ms ... rise ↗ and fall ↘ combined | ↗ 16 ms rise | 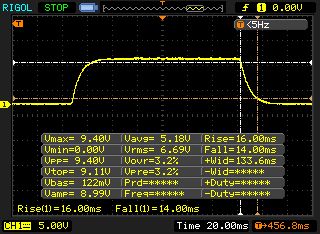 |
| ↘ 14 ms fall | ||
| The screen shows slow response rates in our tests and will be unsatisfactory for gamers. In comparison, all tested devices range from 0.1 (minimum) to 240 (maximum) ms. » 77 % of all devices are better. This means that the measured response time is worse than the average of all tested devices (21.5 ms). | ||
| ↔ Response Time 50% Grey to 80% Grey | ||
| 48 ms ... rise ↗ and fall ↘ combined | ↗ 23.6 ms rise | 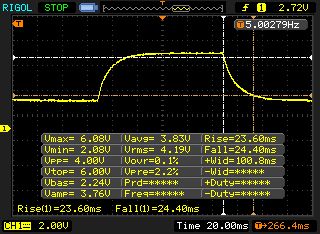 |
| ↘ 24.4 ms fall | ||
| The screen shows slow response rates in our tests and will be unsatisfactory for gamers. In comparison, all tested devices range from 0.2 (minimum) to 636 (maximum) ms. » 80 % of all devices are better. This means that the measured response time is worse than the average of all tested devices (33.7 ms). | ||
Screen Flickering / PWM (Pulse-Width Modulation)
| Screen flickering / PWM not detected | 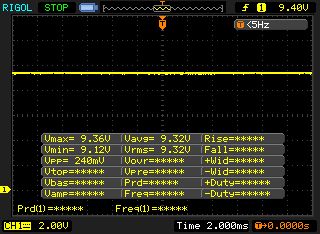 | ||
In comparison: 53 % of all tested devices do not use PWM to dim the display. If PWM was detected, an average of 17900 (minimum: 5 - maximum: 3846000) Hz was measured. | |||


| PCMark 8 Home Score Accelerated v2 | 3499 pontos | |
| PCMark 8 Work Score Accelerated v2 | 4328 pontos | |
| PCMark 10 Score | 4493 pontos | |
Ajuda | ||
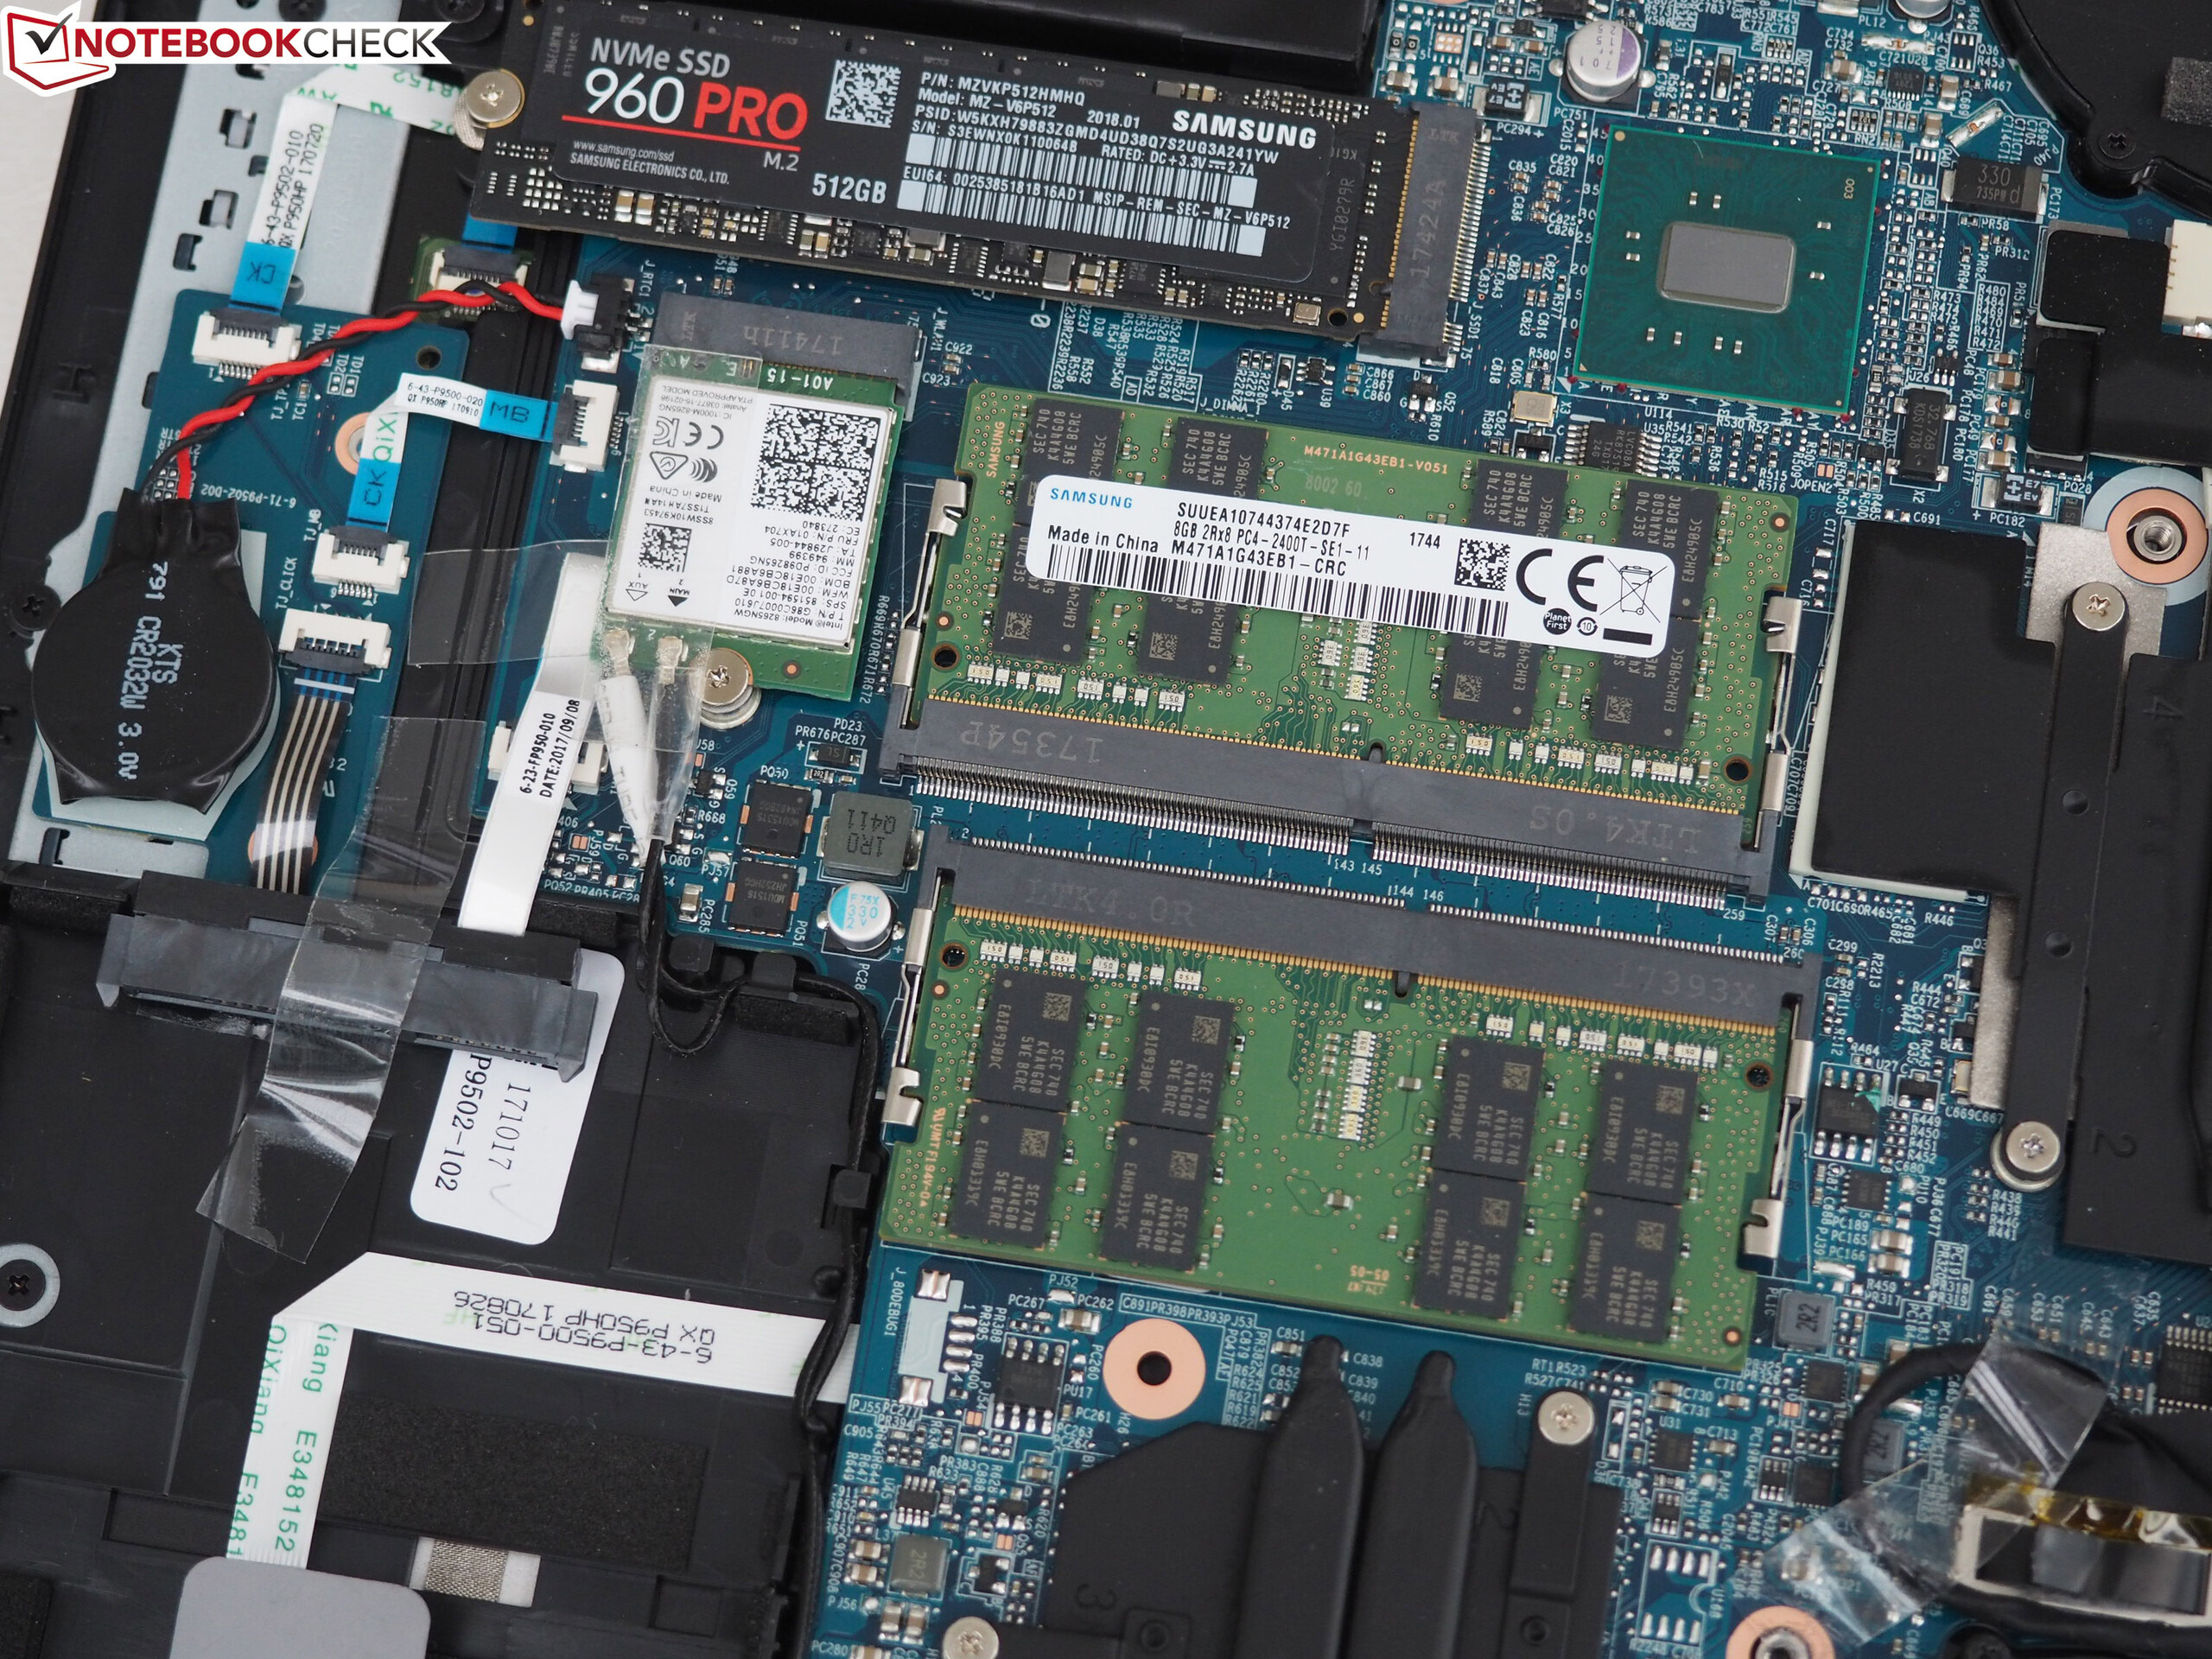
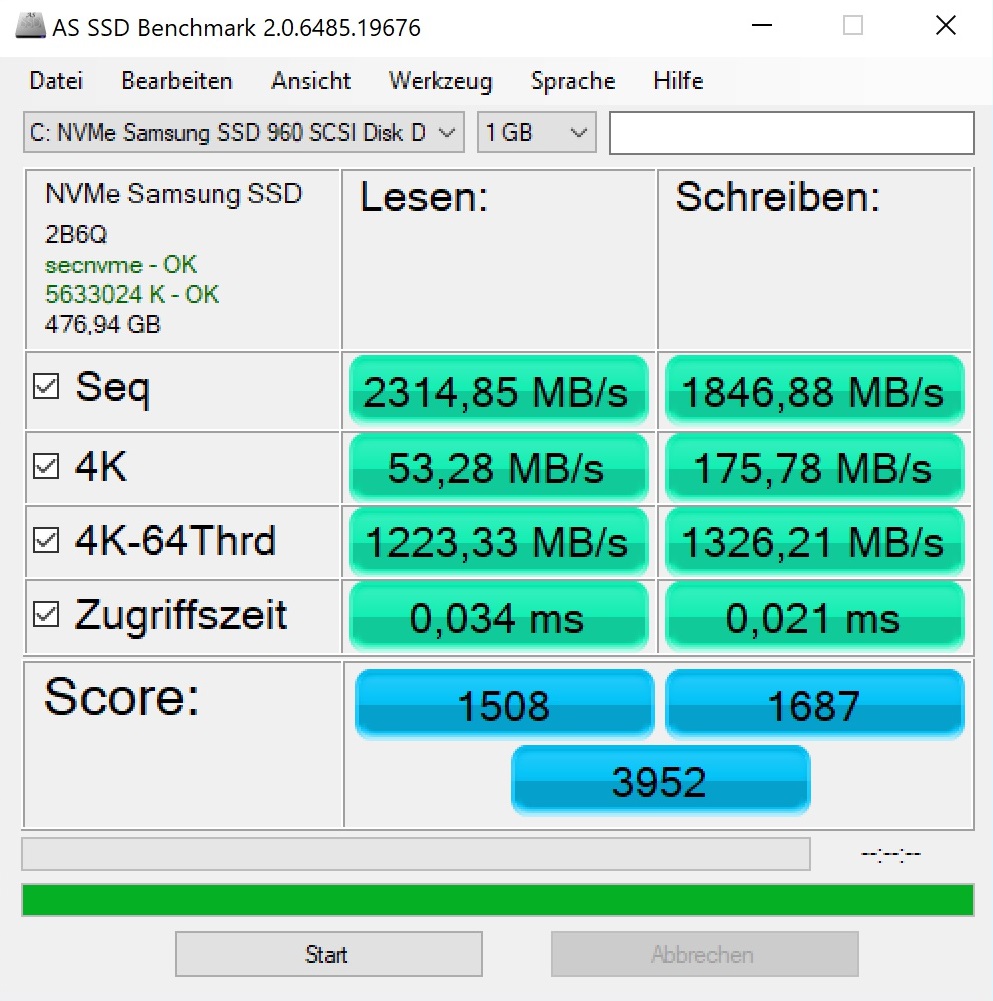
| SCHENKER Key 15 Samsung SSD 960 Pro 512 GB m.2 | Gigabyte Aero 15 Lite-On CX2-8B512-Q11 | Acer Aspire VN7-593G-73HP V15 Nitro BE Seagate Mobile HDD 1TB ST1000LM035 | Asus Zenbook Pro UX550VE-DB71T Samsung PM961 NVMe MZVLW512HMJP | Dell XPS 15 9560 (i7-7700HQ, UHD) Lite-On CX2-8B512-Q11 | Average Samsung SSD 960 Pro 512 GB m.2 | |
|---|---|---|---|---|---|---|
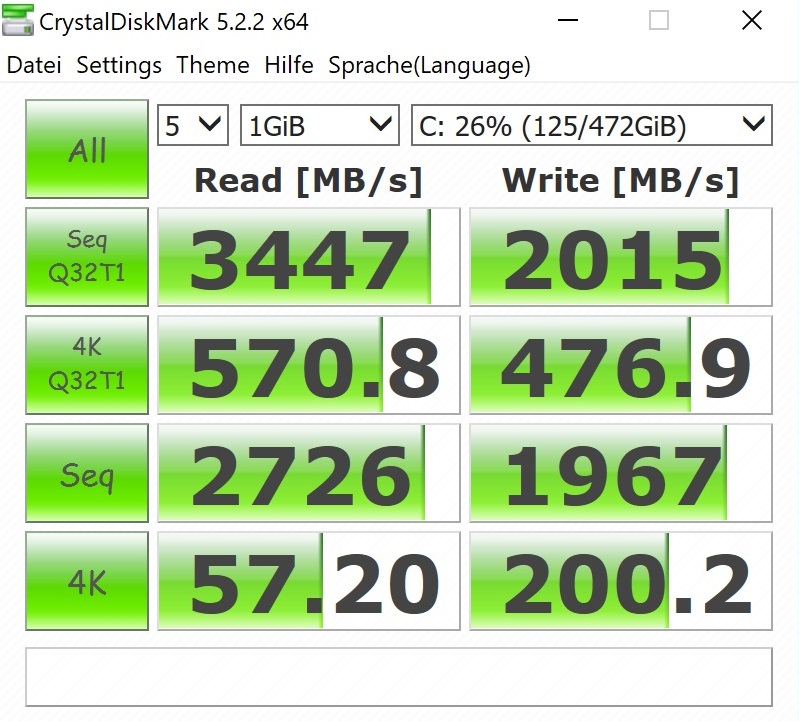
| AS SSD | -12% | -28% | -5% | |||
| Seq Read | 2315 | 2208 -5% | 2026 -12% | 2551 ? 10% | ||
| Seq Write | 1847 | 1475 -20% | 1207 -35% | 1918 ? 4% | ||
| 4K Read | 53.3 | 51 -4% | 41.34 -22% | 45.1 ? -15% | ||
| 4K Write | 175.8 | 112.8 -36% | 112.2 -36% | 136.4 ? -22% | ||
| Score Read | 1508 | 1541 2% | 1206 -20% | 1460 ? -3% | ||
| Score Write | 1687 | 1421 -16% | 1022 -39% | 1639 ? -3% | ||
| Score Total | 3952 | 3721 -6% | 2810 -29% | 3820 ? -3% |

| 3DMark 11 Performance | 12633 pontos | |
| 3DMark Cloud Gate Standard Score | 25268 pontos | |
| 3DMark Fire Strike Score | 9744 pontos | |
| 3DMark Time Spy Score | 3748 pontos | |
Ajuda | ||
| The Witcher 3 | |
| 1920x1080 Ultra Graphics & Postprocessing (HBAO+) | |
| Average of class Multimedia (8 - 143.2, n=99, last 2 years) | |
| SCHENKER Key 15 | |
| Average NVIDIA GeForce GTX 1060 Mobile (24 - 42.3, n=60) | |
| Acer Aspire VN7-593G-73HP V15 Nitro BE | |
| Gigabyte Aero 15 | |
| Asus Zenbook Pro UX550VE-DB71T | |
| Dell XPS 15 9560 (i7-7700HQ, UHD) | |
| 1920x1080 High Graphics & Postprocessing (Nvidia HairWorks Off) | |
| Average of class Multimedia (11.2 - 290, n=92, last 2 years) | |
| SCHENKER Key 15 | |
| Gigabyte Aero 15 | |
| Acer Aspire VN7-593G-73HP V15 Nitro BE | |
| Average NVIDIA GeForce GTX 1060 Mobile (52.6 - 80.6, n=49) | |
| Dell XPS 15 9560 (i7-7700HQ, UHD) | |
| baixo | média | alto | ultra | 4K | |
| The Witcher 3 (2015) | 73.9 | 40.2 | 26.1 | ||
| Wolfenstein II: The New Colossus (2017) | 78 | 72.2 | 27.1 | ||
| Fortnite (2018) | 99.6 | 77.5 | 22.7 | ||
| Final Fantasy XV Benchmark (2018) | 37.2 | 16.4 | |||
| Kingdom Come: Deliverance (2018) | 60.3 | 43.9 | 13.9 |
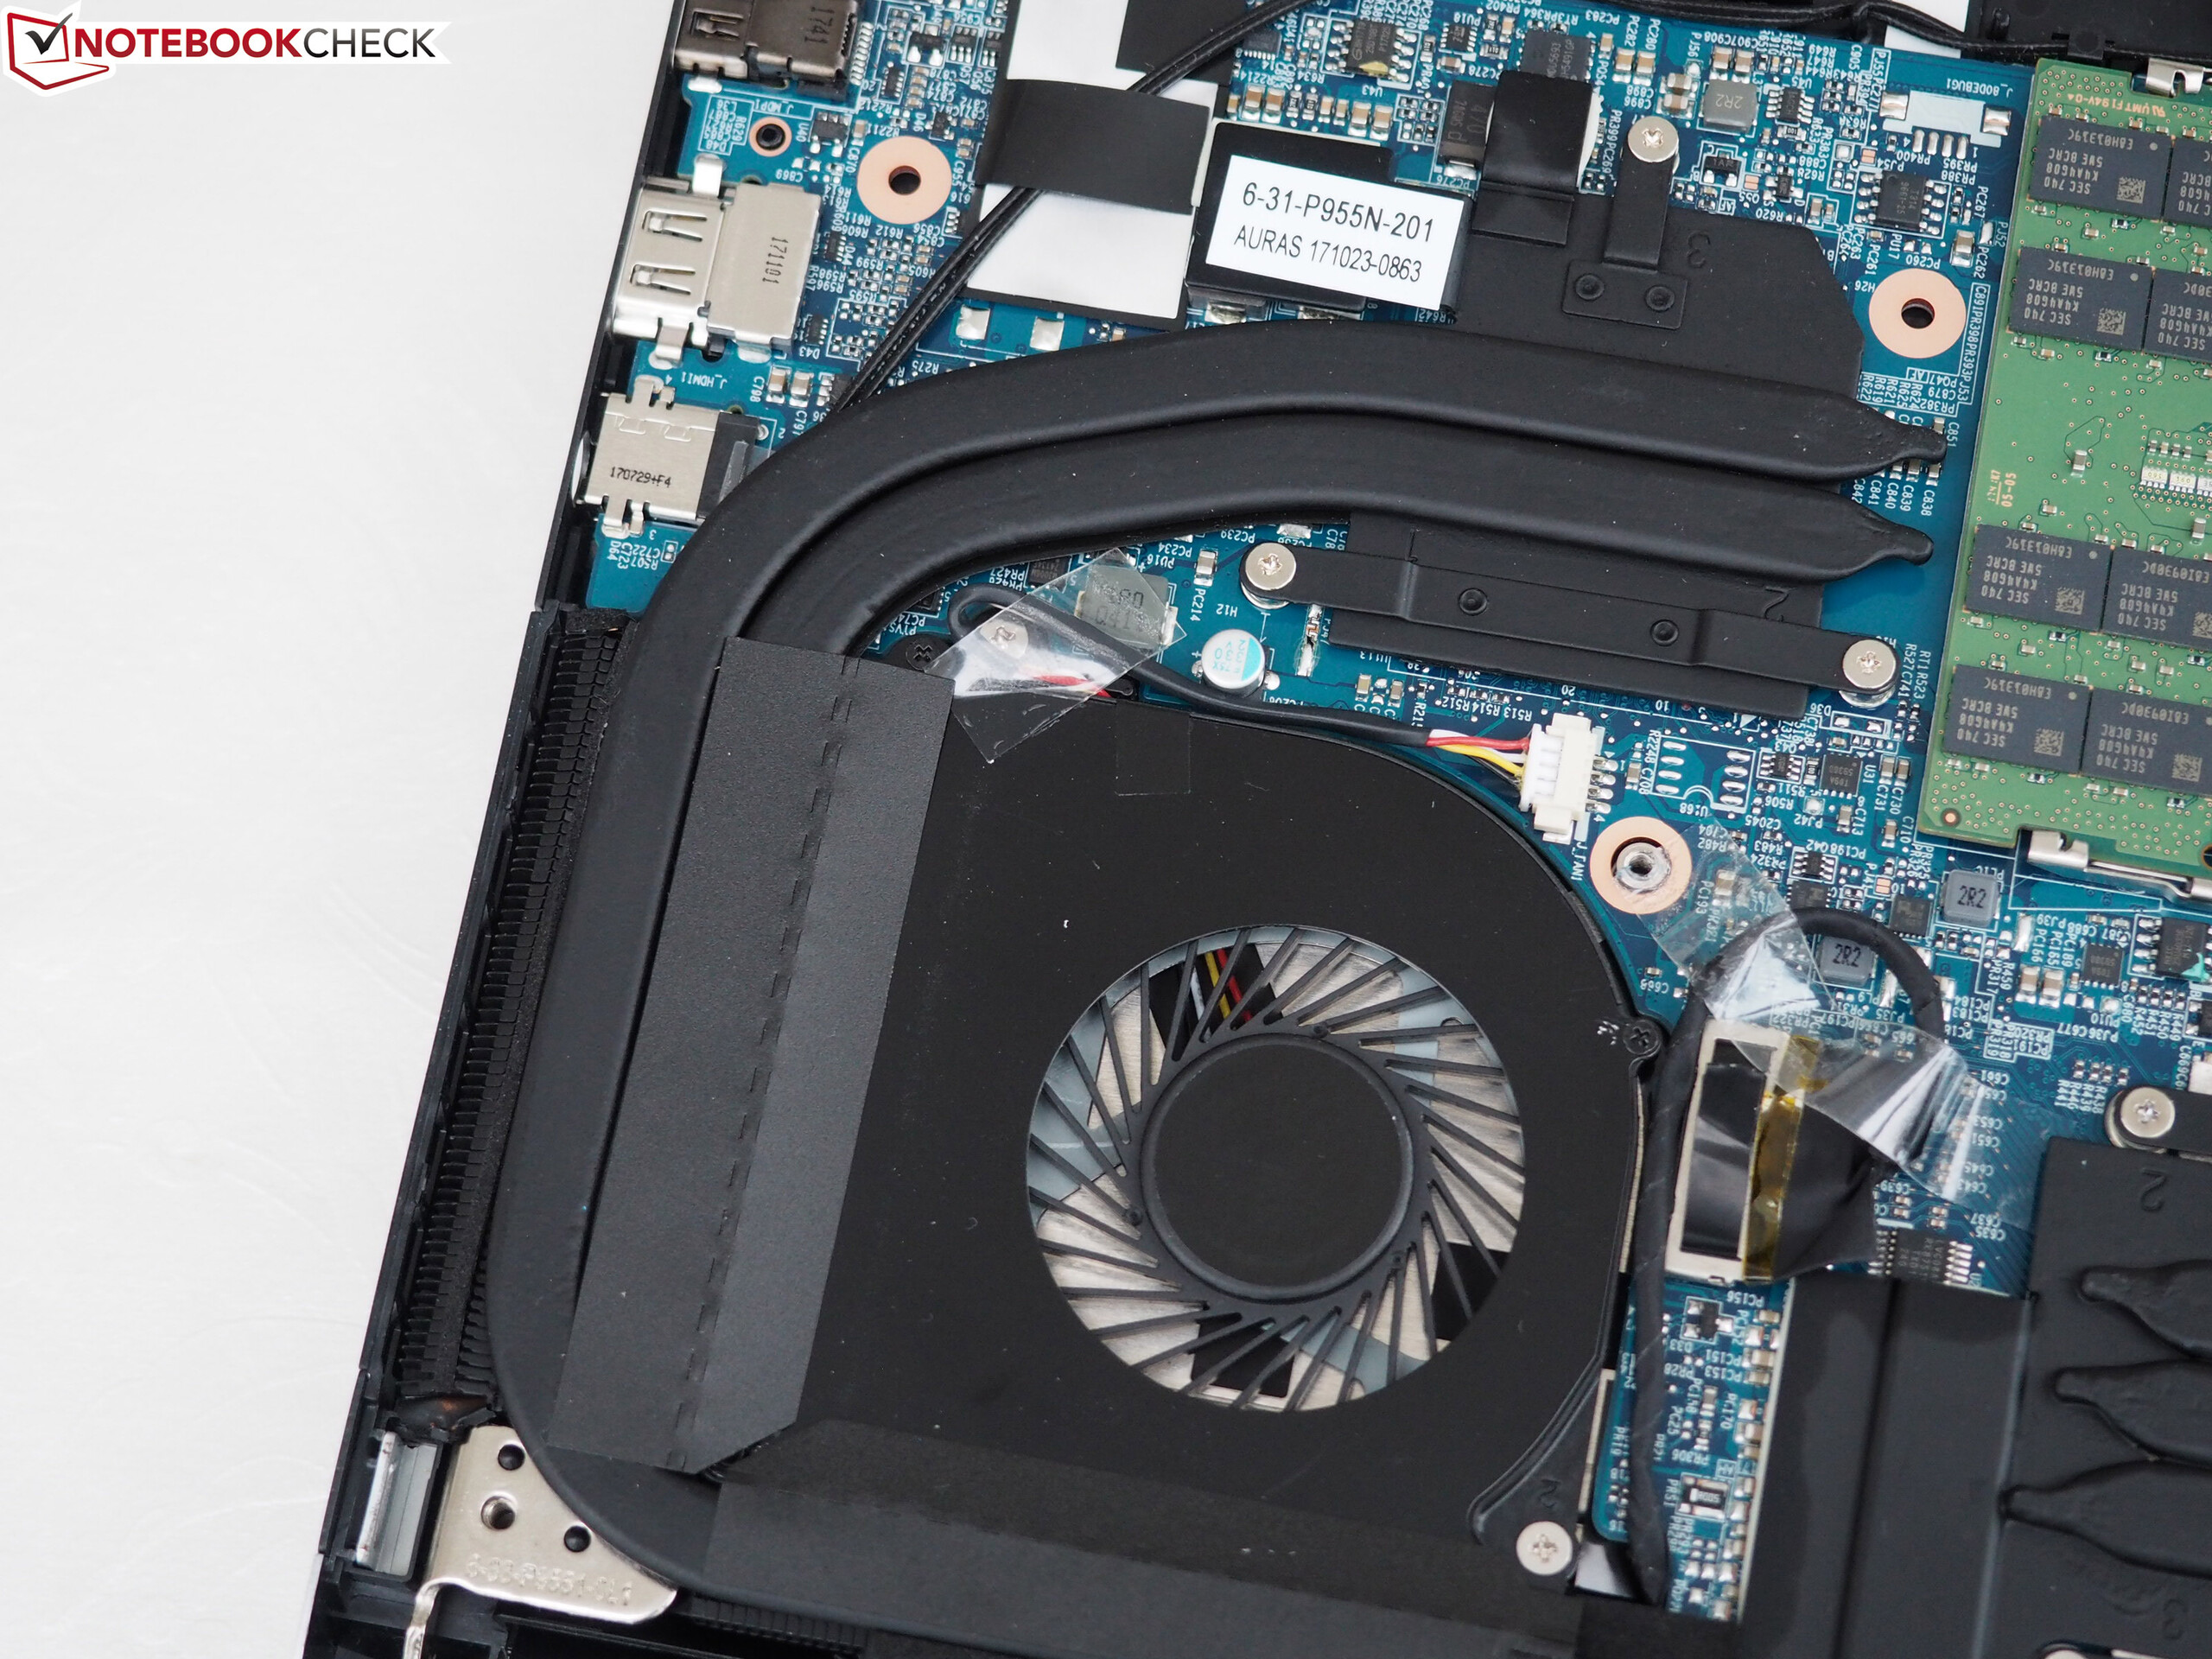
Barulho
| Ocioso |
| 31 / 32 / 39 dB |
| Carga |
| 47 / 54 dB |
 | ||
30 dB silencioso 40 dB(A) audível 50 dB(A) ruidosamente alto |
||
min: | ||
| SCHENKER Key 15 GeForce GTX 1060 Mobile, i7-7700HQ | Gigabyte Aero 15 GeForce GTX 1060 Mobile, i7-7700HQ | Acer Aspire VN7-593G-73HP V15 Nitro BE GeForce GTX 1060 Mobile, i7-7700HQ | Asus Zenbook Pro UX550VE-DB71T GeForce GTX 1050 Ti Mobile, i7-7700HQ | Dell XPS 15 9560 (i7-7700HQ, UHD) GeForce GTX 1050 Mobile, i7-7700HQ | |
|---|---|---|---|---|---|
| Noise | 5% | 8% | 8% | 6% | |
| off / environment * | 29 | 31 -7% | 30.4 -5% | 28.3 2% | 28.4 2% |
| Idle Minimum * | 31 | 32 -3% | 30.9 -0% | 30.4 2% | 29 6% |
| Idle Average * | 32 | 33 -3% | 30.9 3% | 31 3% | 29 9% |
| Idle Maximum * | 39 | 34 13% | 31.5 19% | 31.2 20% | 32.2 17% |
| Load Average * | 47 | 39 17% | 40.7 13% | 43.3 8% | 47.1 -0% |
| Witcher 3 ultra * | 49 | 43 12% | 45.5 7% | 46.2 6% | 52 -6% |
| Load Maximum * | 54 | 50 7% | 43.9 19% | 46.2 14% | 47.1 13% |
* ... smaller is better
(-) The maximum temperature on the upper side is 55 °C / 131 F, compared to the average of 36.9 °C / 98 F, ranging from 21.1 to 71 °C for the class Multimedia.
(-) The bottom heats up to a maximum of 56 °C / 133 F, compared to the average of 39.1 °C / 102 F
(+) In idle usage, the average temperature for the upper side is 22 °C / 72 F, compared to the device average of 31.2 °C / 88 F.
(±) Playing The Witcher 3, the average temperature for the upper side is 36 °C / 97 F, compared to the device average of 31.2 °C / 88 F.
(+) The palmrests and touchpad are reaching skin temperature as a maximum (35 °C / 95 F) and are therefore not hot.
(-) The average temperature of the palmrest area of similar devices was 28.8 °C / 83.8 F (-6.2 °C / -11.2 F).
| SCHENKER Key 15 GeForce GTX 1060 Mobile, i7-7700HQ | Gigabyte Aero 15 GeForce GTX 1060 Mobile, i7-7700HQ | Acer Aspire VN7-593G-73HP V15 Nitro BE GeForce GTX 1060 Mobile, i7-7700HQ | Asus Zenbook Pro UX550VE-DB71T GeForce GTX 1050 Ti Mobile, i7-7700HQ | Dell XPS 15 9560 (i7-7700HQ, UHD) GeForce GTX 1050 Mobile, i7-7700HQ | |
|---|---|---|---|---|---|
| Heat | -5% | -10% | 4% | 4% | |
| Maximum Upper Side * | 55 | 56 -2% | 51.9 6% | 43.2 21% | 48.8 11% |
| Maximum Bottom * | 56 | 61 -9% | 54.6 2% | 49.8 11% | 42.6 24% |
| Idle Upper Side * | 23 | 25 -9% | 29.1 -27% | 24.8 -8% | 26 -13% |
| Idle Bottom * | 24 | 24 -0% | 29.3 -22% | 26 -8% | 25.4 -6% |
* ... smaller is better
SCHENKER Key 15 audio analysis
(-) | not very loud speakers (71 dB)
Bass 100 - 315 Hz
(-) | nearly no bass - on average 19.2% lower than median
(±) | linearity of bass is average (7.3% delta to prev. frequency)
Mids 400 - 2000 Hz
(±) | higher mids - on average 7.9% higher than median
(±) | linearity of mids is average (10.8% delta to prev. frequency)
Highs 2 - 16 kHz
(+) | balanced highs - only 2.7% away from median
(+) | highs are linear (6.2% delta to prev. frequency)
Overall 100 - 16.000 Hz
(±) | linearity of overall sound is average (29.9% difference to median)
Compared to same class
» 94% of all tested devices in this class were better, 2% similar, 3% worse
» The best had a delta of 5%, average was 18%, worst was 45%
Compared to all devices tested
» 86% of all tested devices were better, 3% similar, 11% worse
» The best had a delta of 4%, average was 25%, worst was 134%
Gigabyte Aero 15 audio analysis
(±) | speaker loudness is average but good (79 dB)
Bass 100 - 315 Hz
(-) | nearly no bass - on average 23.3% lower than median
(±) | linearity of bass is average (10.7% delta to prev. frequency)
Mids 400 - 2000 Hz
(+) | balanced mids - only 1.8% away from median
(+) | mids are linear (4.1% delta to prev. frequency)
Highs 2 - 16 kHz
(+) | balanced highs - only 2.6% away from median
(+) | highs are linear (5.1% delta to prev. frequency)
Overall 100 - 16.000 Hz
(±) | linearity of overall sound is average (18.3% difference to median)
Compared to same class
» 50% of all tested devices in this class were better, 8% similar, 43% worse
» The best had a delta of 5%, average was 18%, worst was 45%
Compared to all devices tested
» 34% of all tested devices were better, 8% similar, 58% worse
» The best had a delta of 4%, average was 25%, worst was 134%
| desligado | |
| Ocioso | |
| Carga |
|
| SCHENKER Key 15 GeForce GTX 1060 Mobile, i7-7700HQ | Gigabyte Aero 15 GeForce GTX 1060 Mobile, i7-7700HQ | Acer Aspire VN7-593G-73HP V15 Nitro BE GeForce GTX 1060 Mobile, i7-7700HQ | Asus Zenbook Pro UX550VE-DB71T GeForce GTX 1050 Ti Mobile, i7-7700HQ | Dell XPS 15 9560 (i7-7700HQ, UHD) GeForce GTX 1050 Mobile, i7-7700HQ | |
|---|---|---|---|---|---|
| Power Consumption | -23% | -2% | 22% | -21% | |
| Idle Minimum * | 7 | 12 -71% | 7.2 -3% | 6.3 10% | 11.9 -70% |
| Idle Average * | 10 | 15 -50% | 10.5 -5% | 7.9 21% | 17.1 -71% |
| Idle Maximum * | 18 | 20 -11% | 16 11% | 8.1 55% | 17.3 4% |
| Load Average * | 82 | 82 -0% | 82 -0% | 84.9 -4% | 94.7 -15% |
| Witcher 3 ultra * | 111 | 111 -0% | 124 -12% | 96.3 13% | 104.8 6% |
| Load Maximum * | 154 | 161 -5% | 155 -1% | 102.4 34% | 122 21% |
* ... smaller is better
| SCHENKER Key 15 GeForce GTX 1060 Mobile, i7-7700HQ, 55 Wh | Gigabyte Aero 15 GeForce GTX 1060 Mobile, i7-7700HQ, 94.24 Wh | Acer Aspire VN7-593G-73HP V15 Nitro BE GeForce GTX 1060 Mobile, i7-7700HQ, 69 Wh | Asus Zenbook Pro UX550VE-DB71T GeForce GTX 1050 Ti Mobile, i7-7700HQ, 73 Wh | Dell XPS 15 9560 (i7-7700HQ, UHD) GeForce GTX 1050 Mobile, i7-7700HQ, 97 Wh | Average of class Multimedia | |
|---|---|---|---|---|---|---|
| Battery Runtime | 68% | 48% | 76% | 64% | 123% | |
| Reader / Idle | 481 | 638 33% | 501 4% | 1023 113% | 831 73% | 933 ? 94% |
| H.264 | 216 | 464 115% | 710 ? 229% | |||
| WiFi v1.3 | 240 | 422 76% | 357 49% | 532 122% | 434 81% | 572 ? 138% |
| Load | 75 | 112 49% | 144 92% | 70 -7% | 103 37% | 97.7 ? 30% |
Pro
Contra
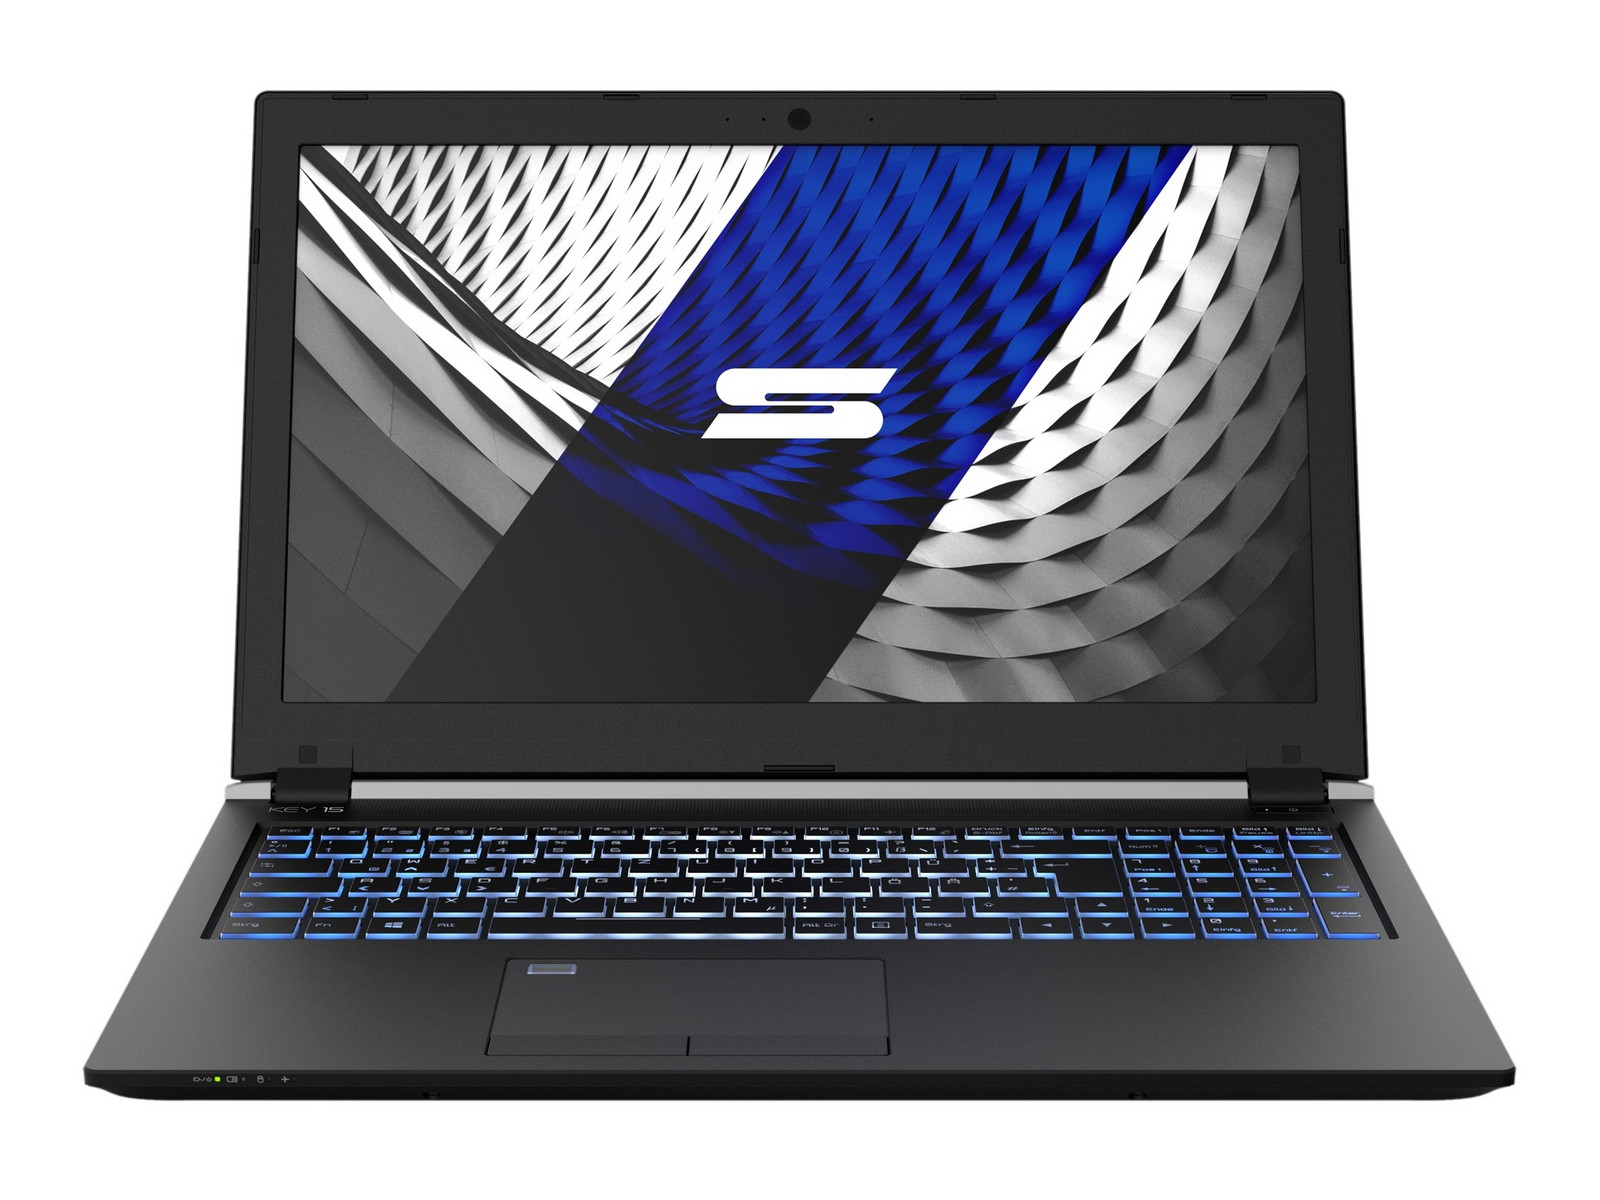
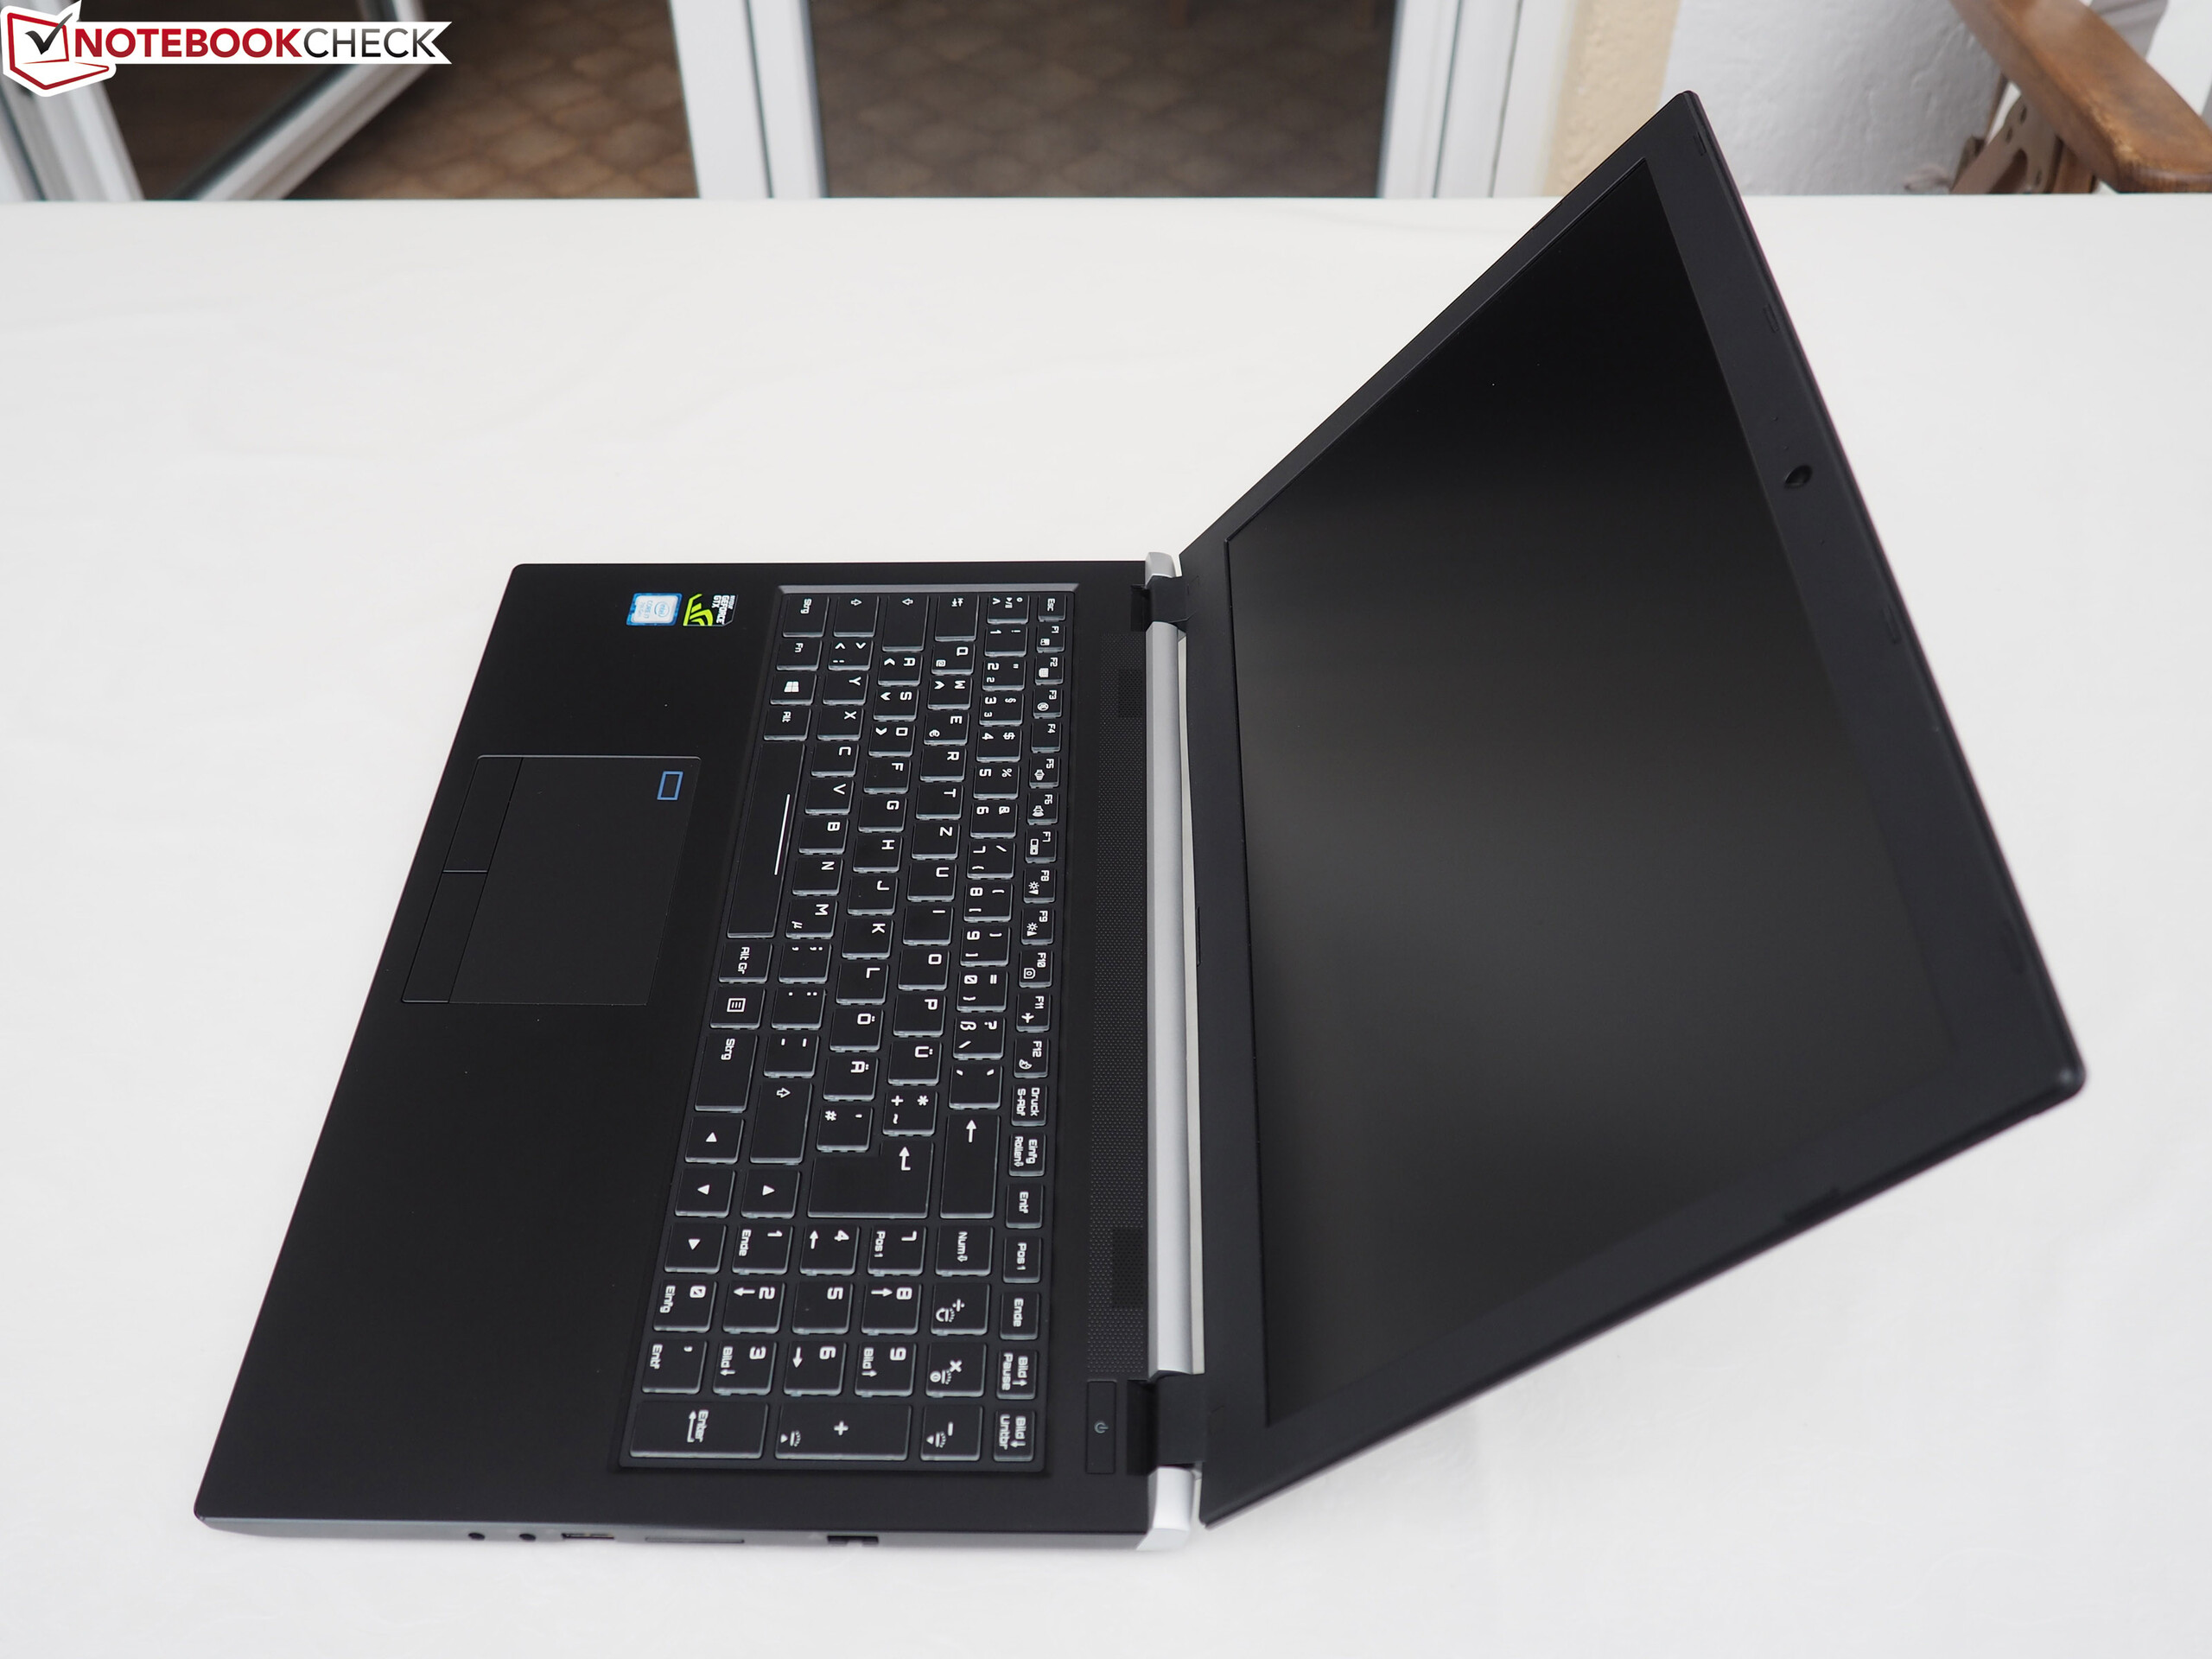
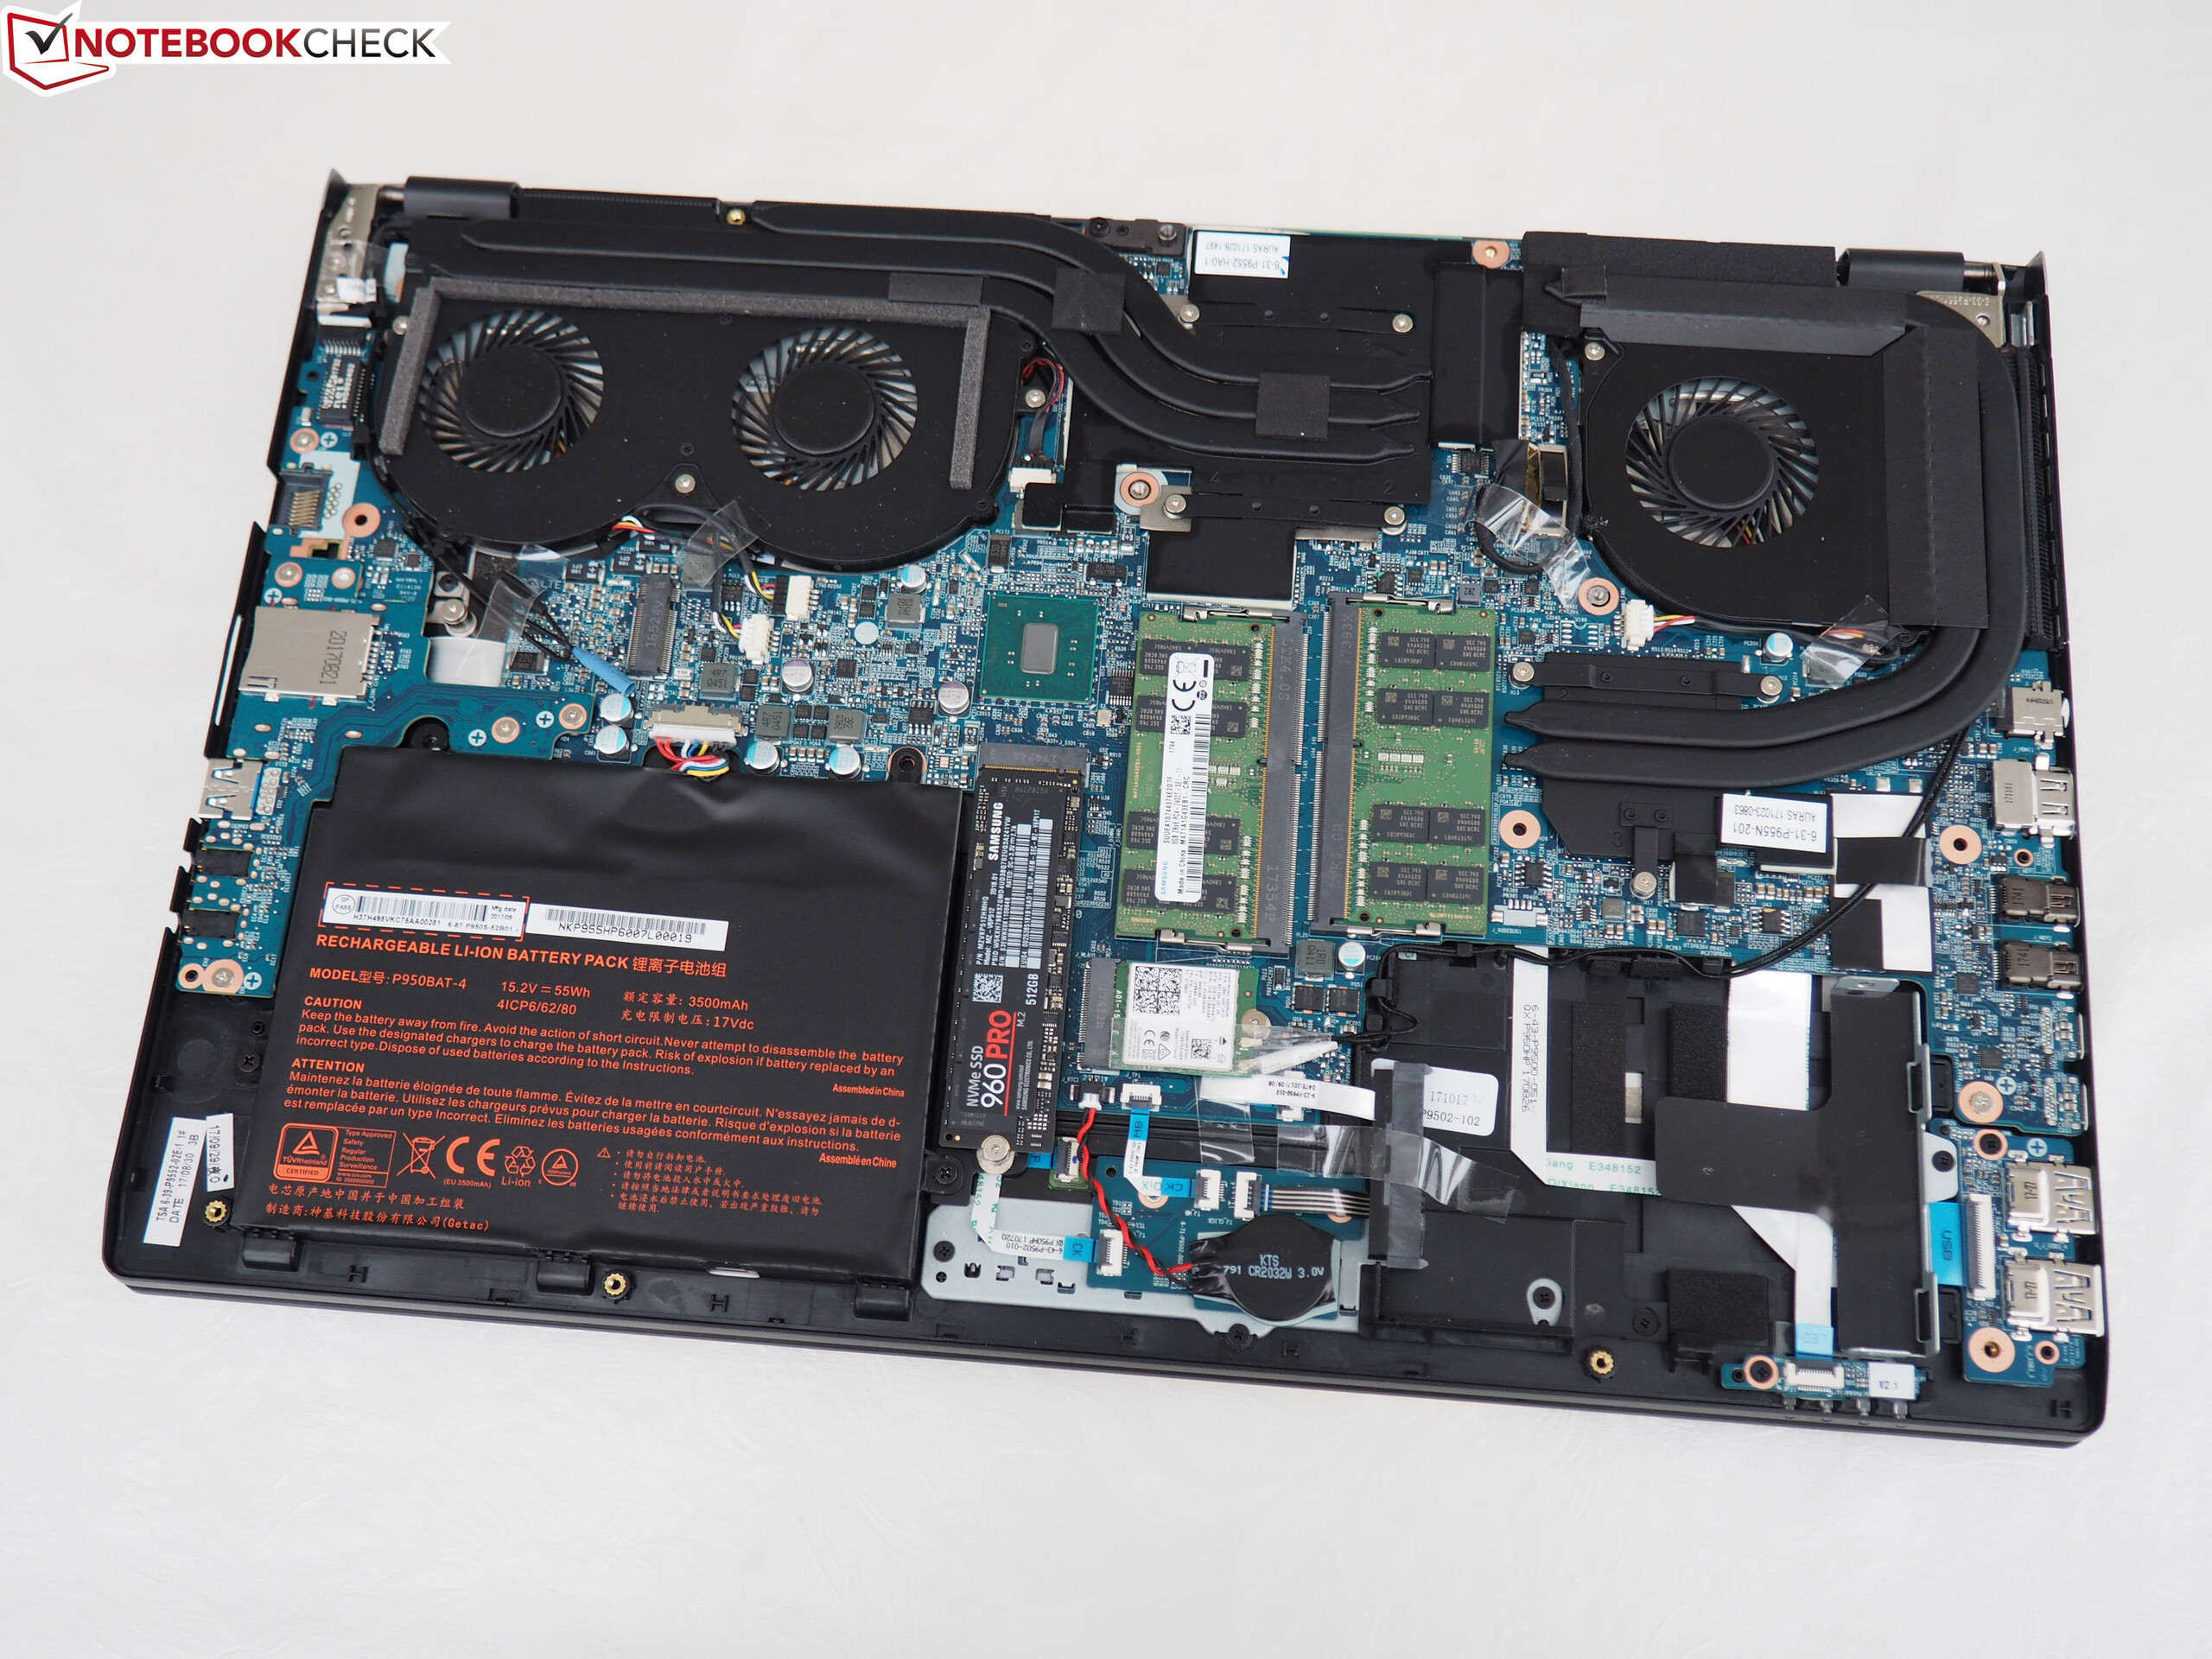
Os portáteis multimídia são muito comuns. No entanto, se deve ser uma carcaça de metal elegante e fina com um desempenho decente, inúmeros produtos no classificam. O Key 15 da Schenker Technologies, por outro lado, cumpre todos os critérios e avanços para ser um poli funcional de sucesso.
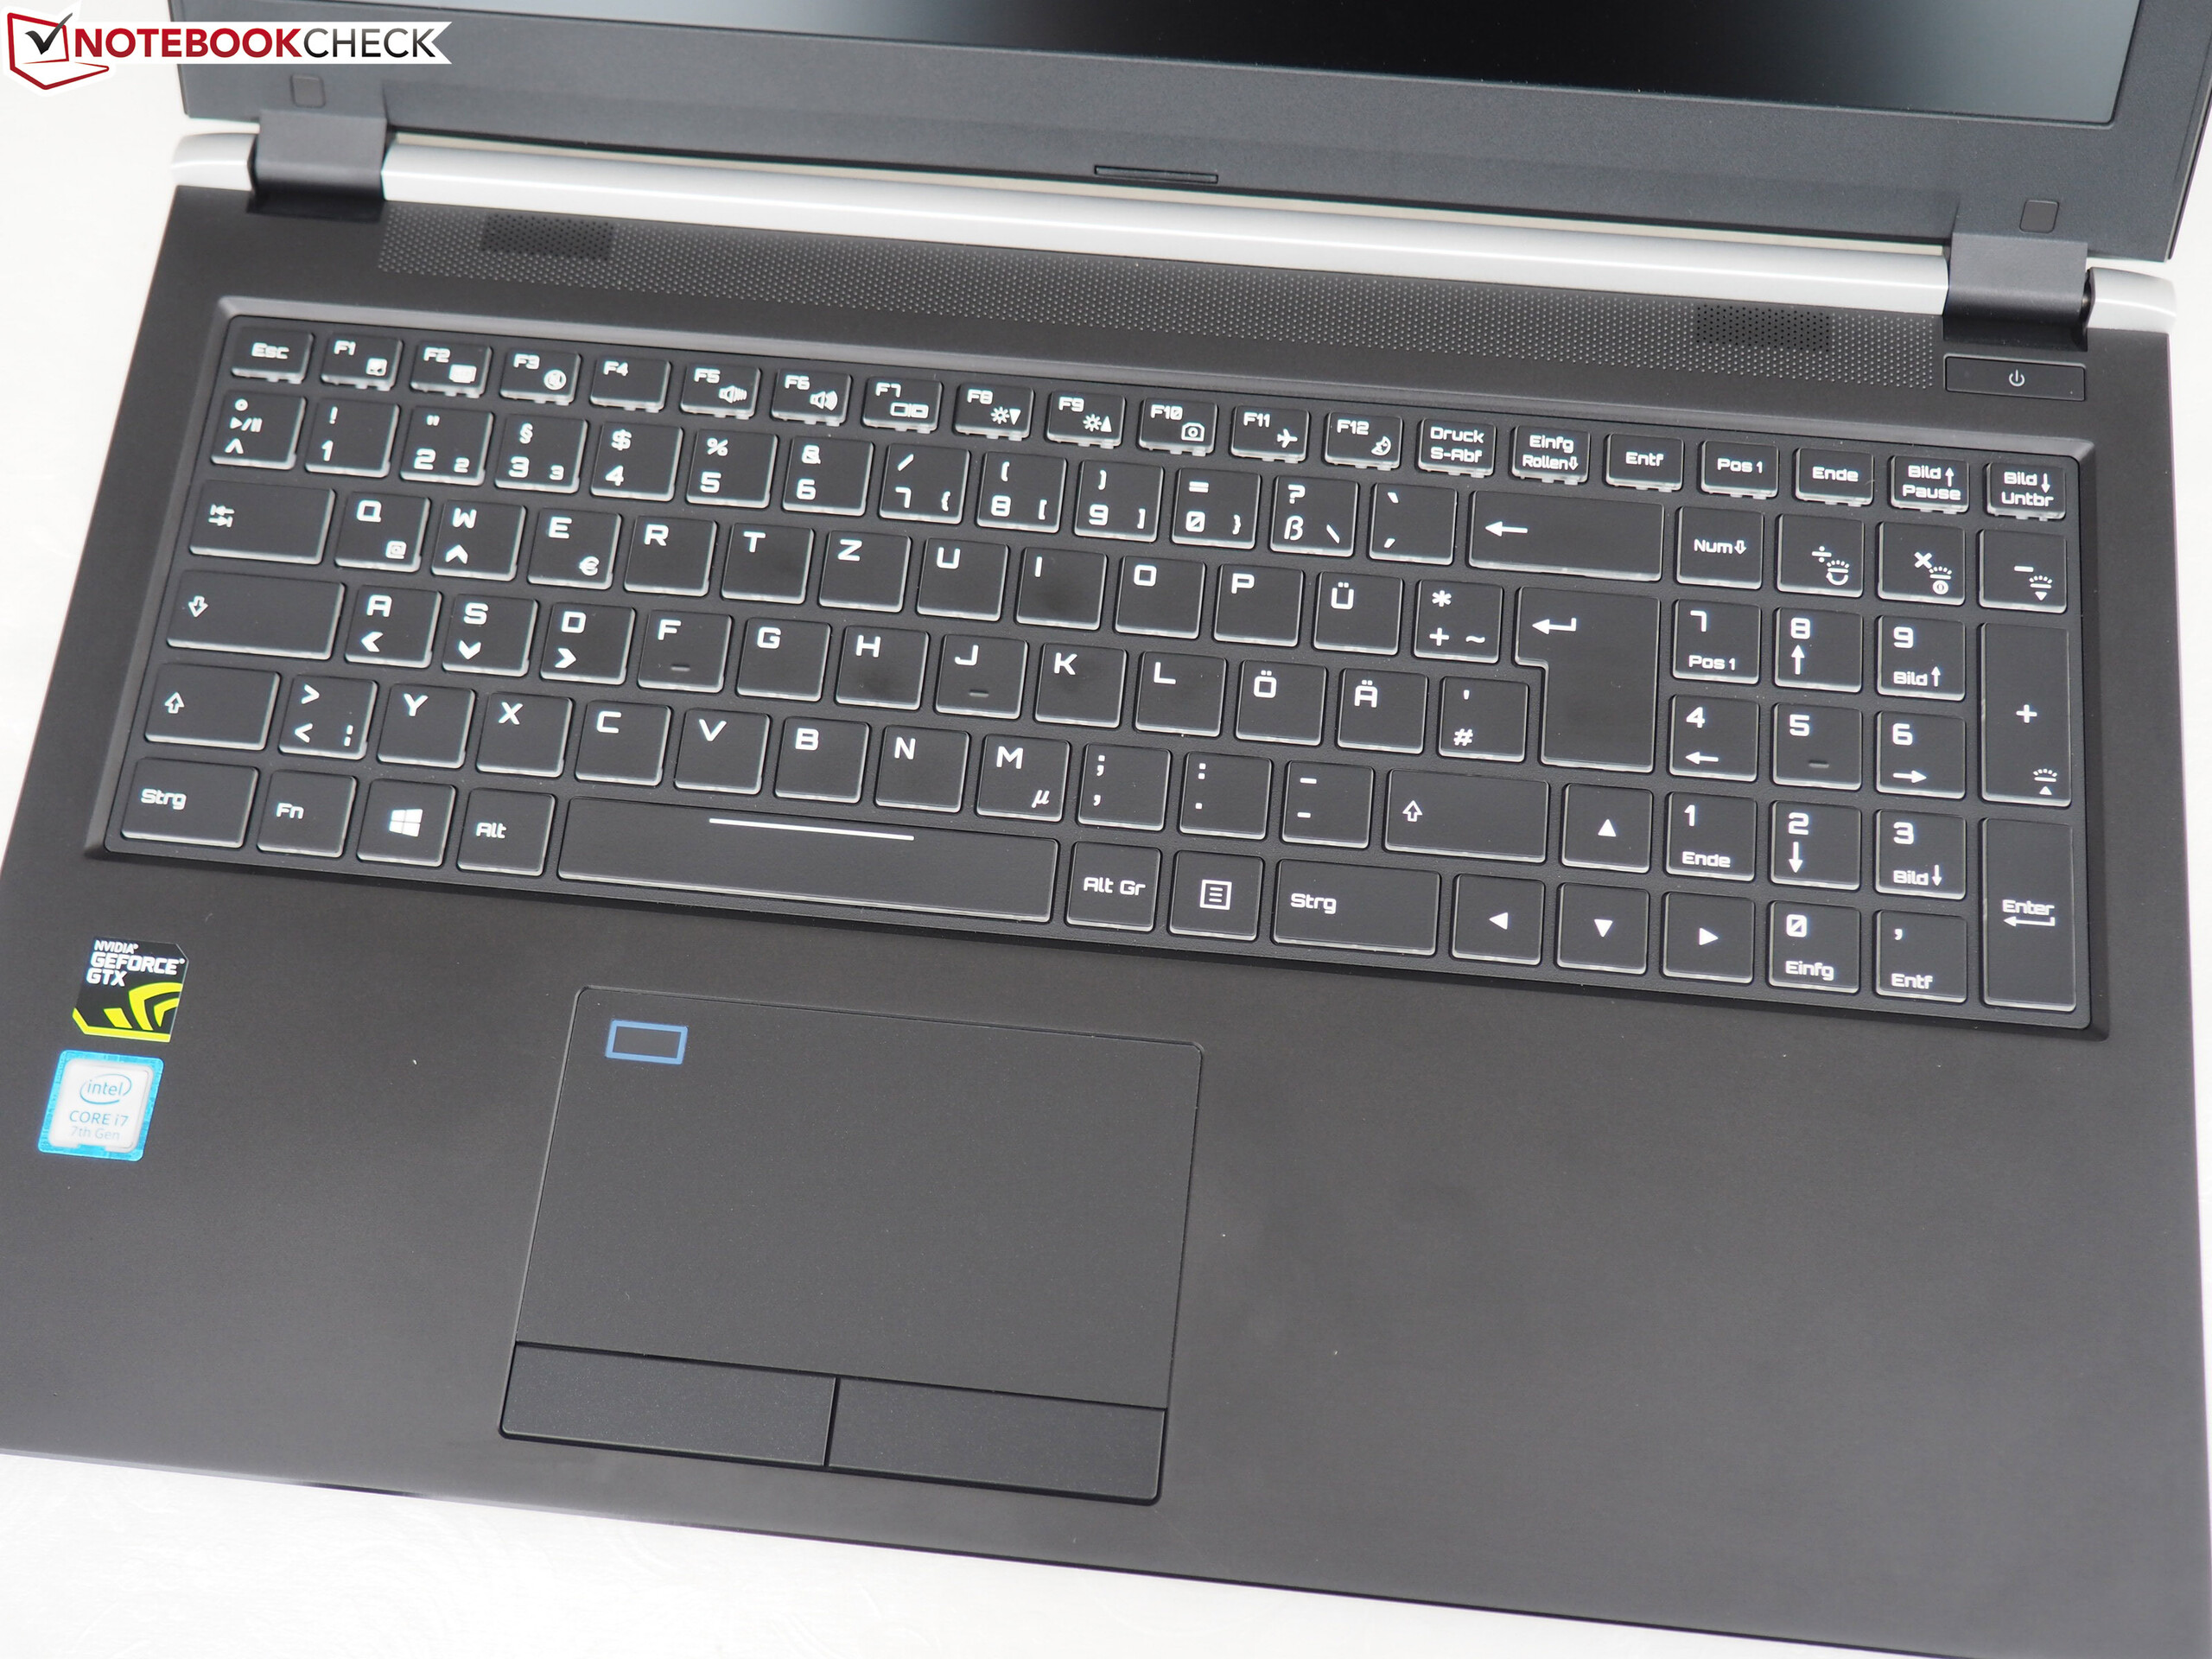
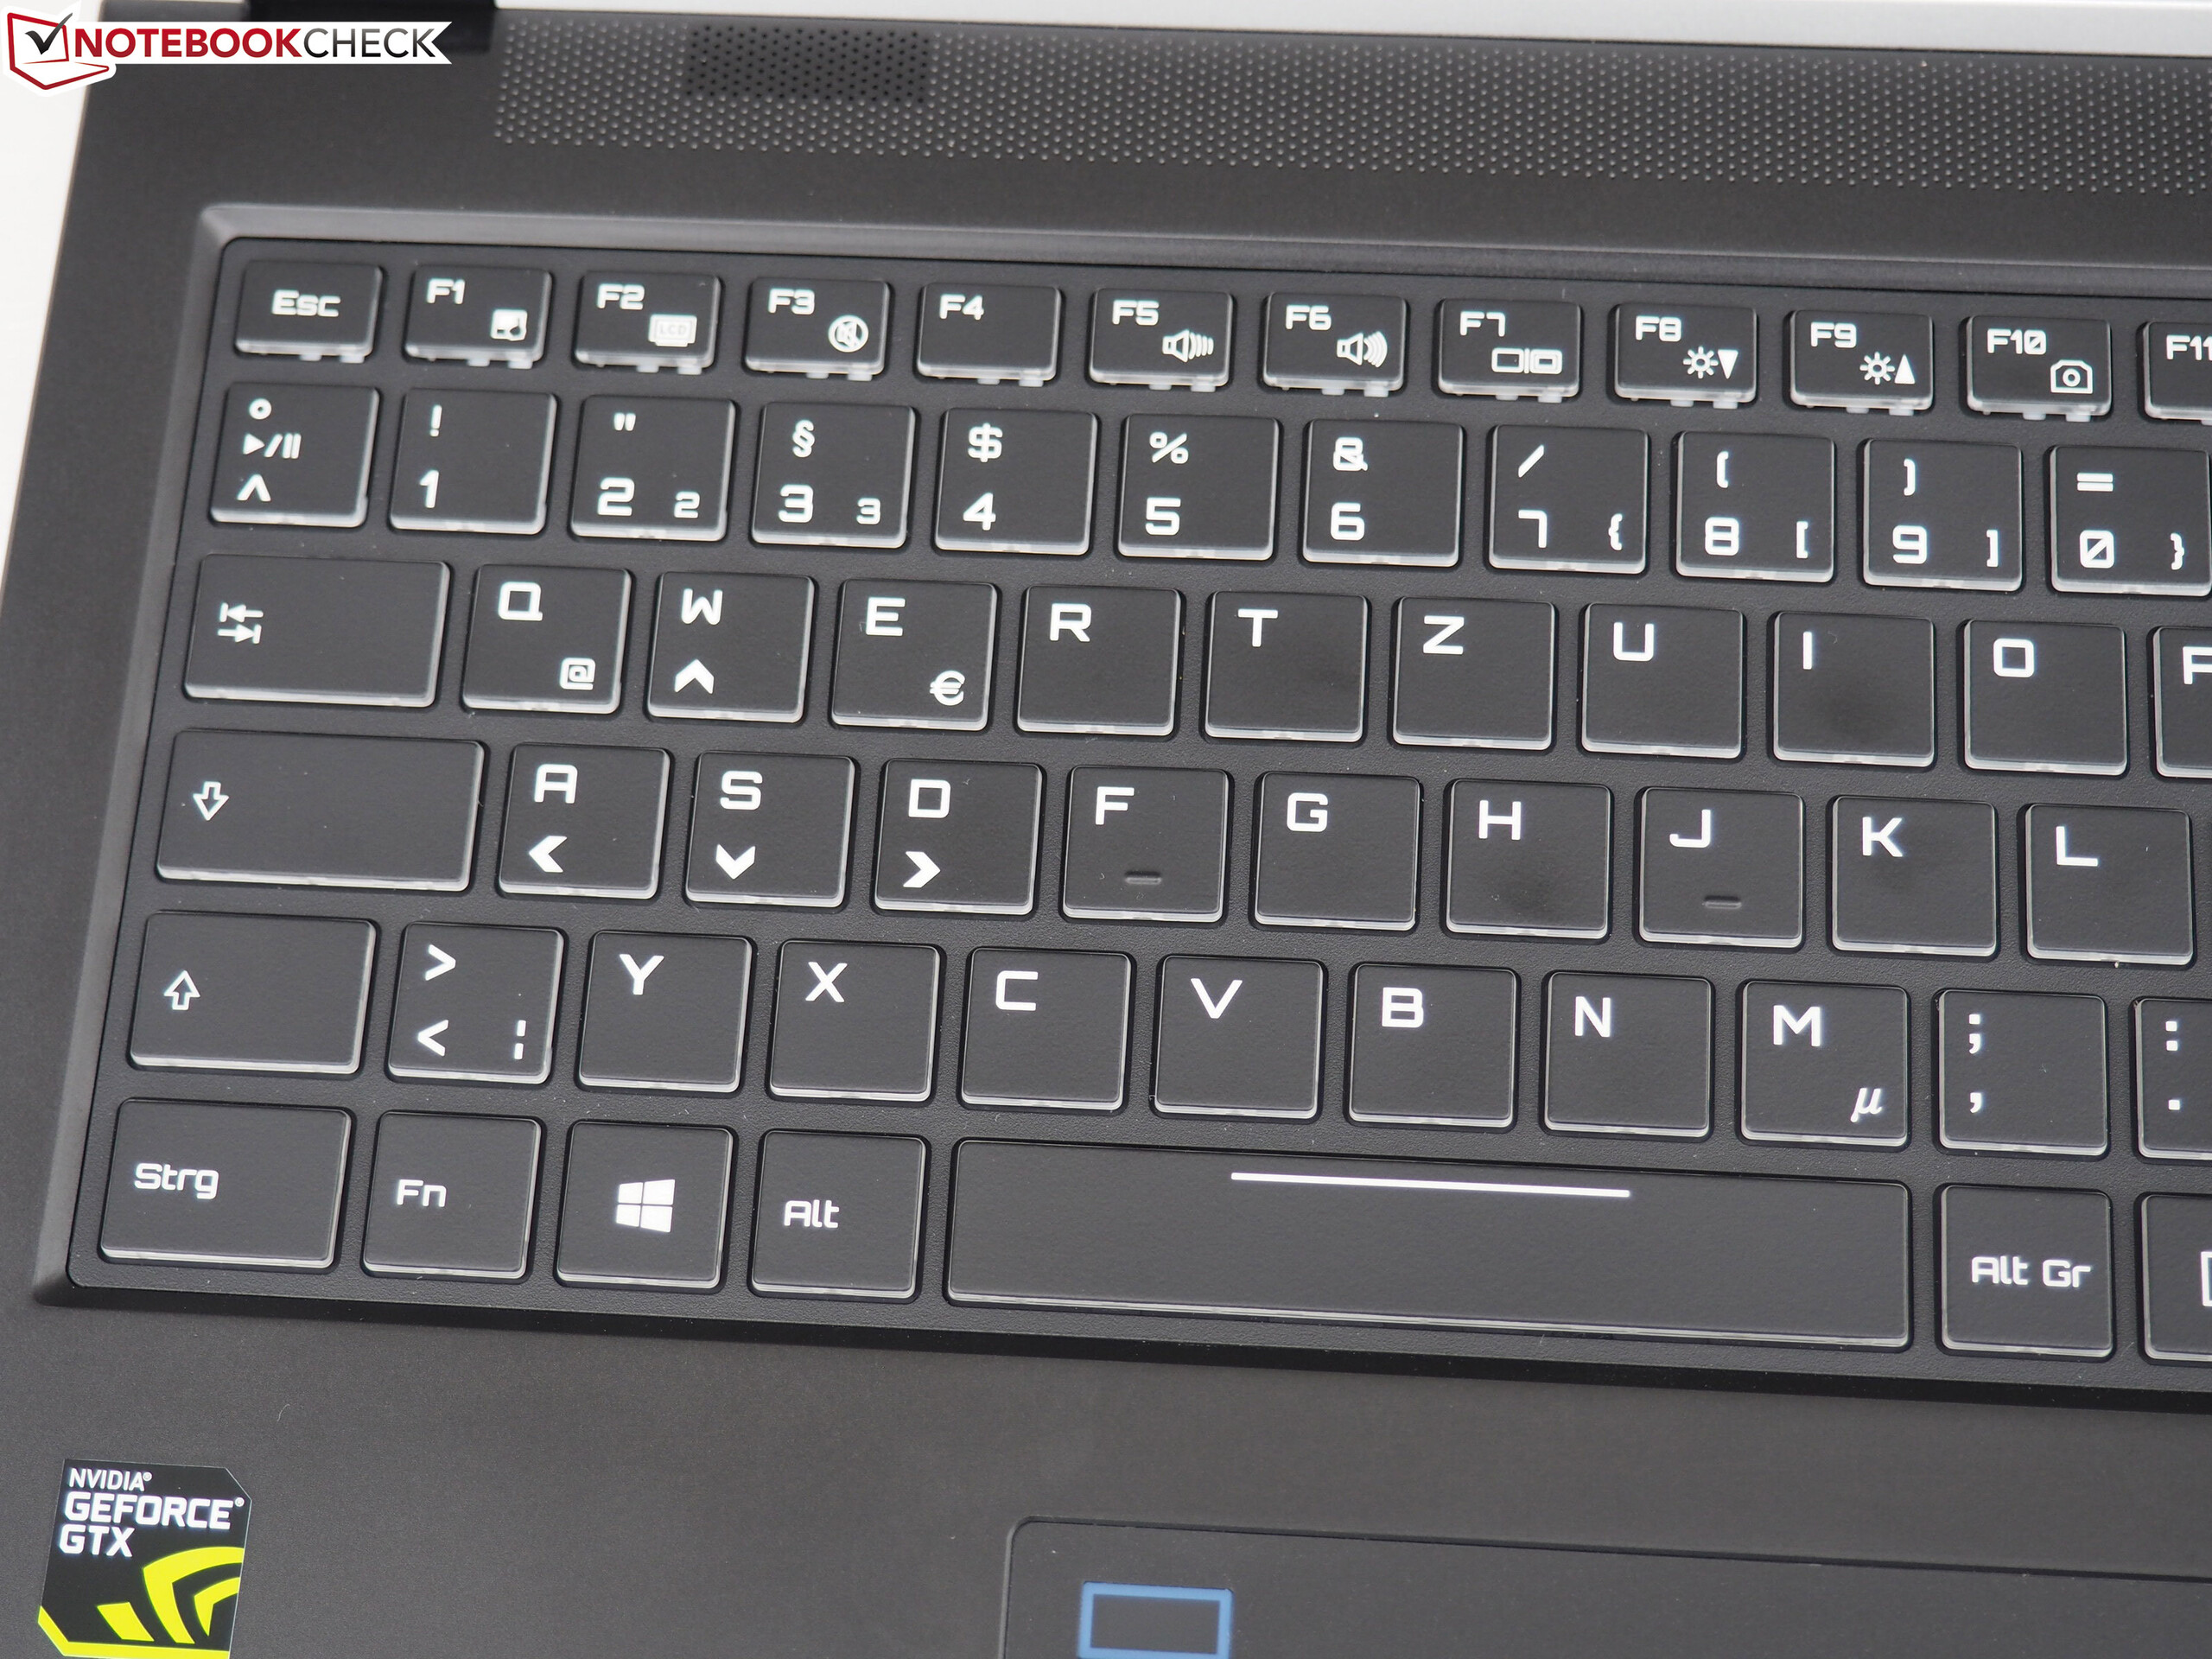
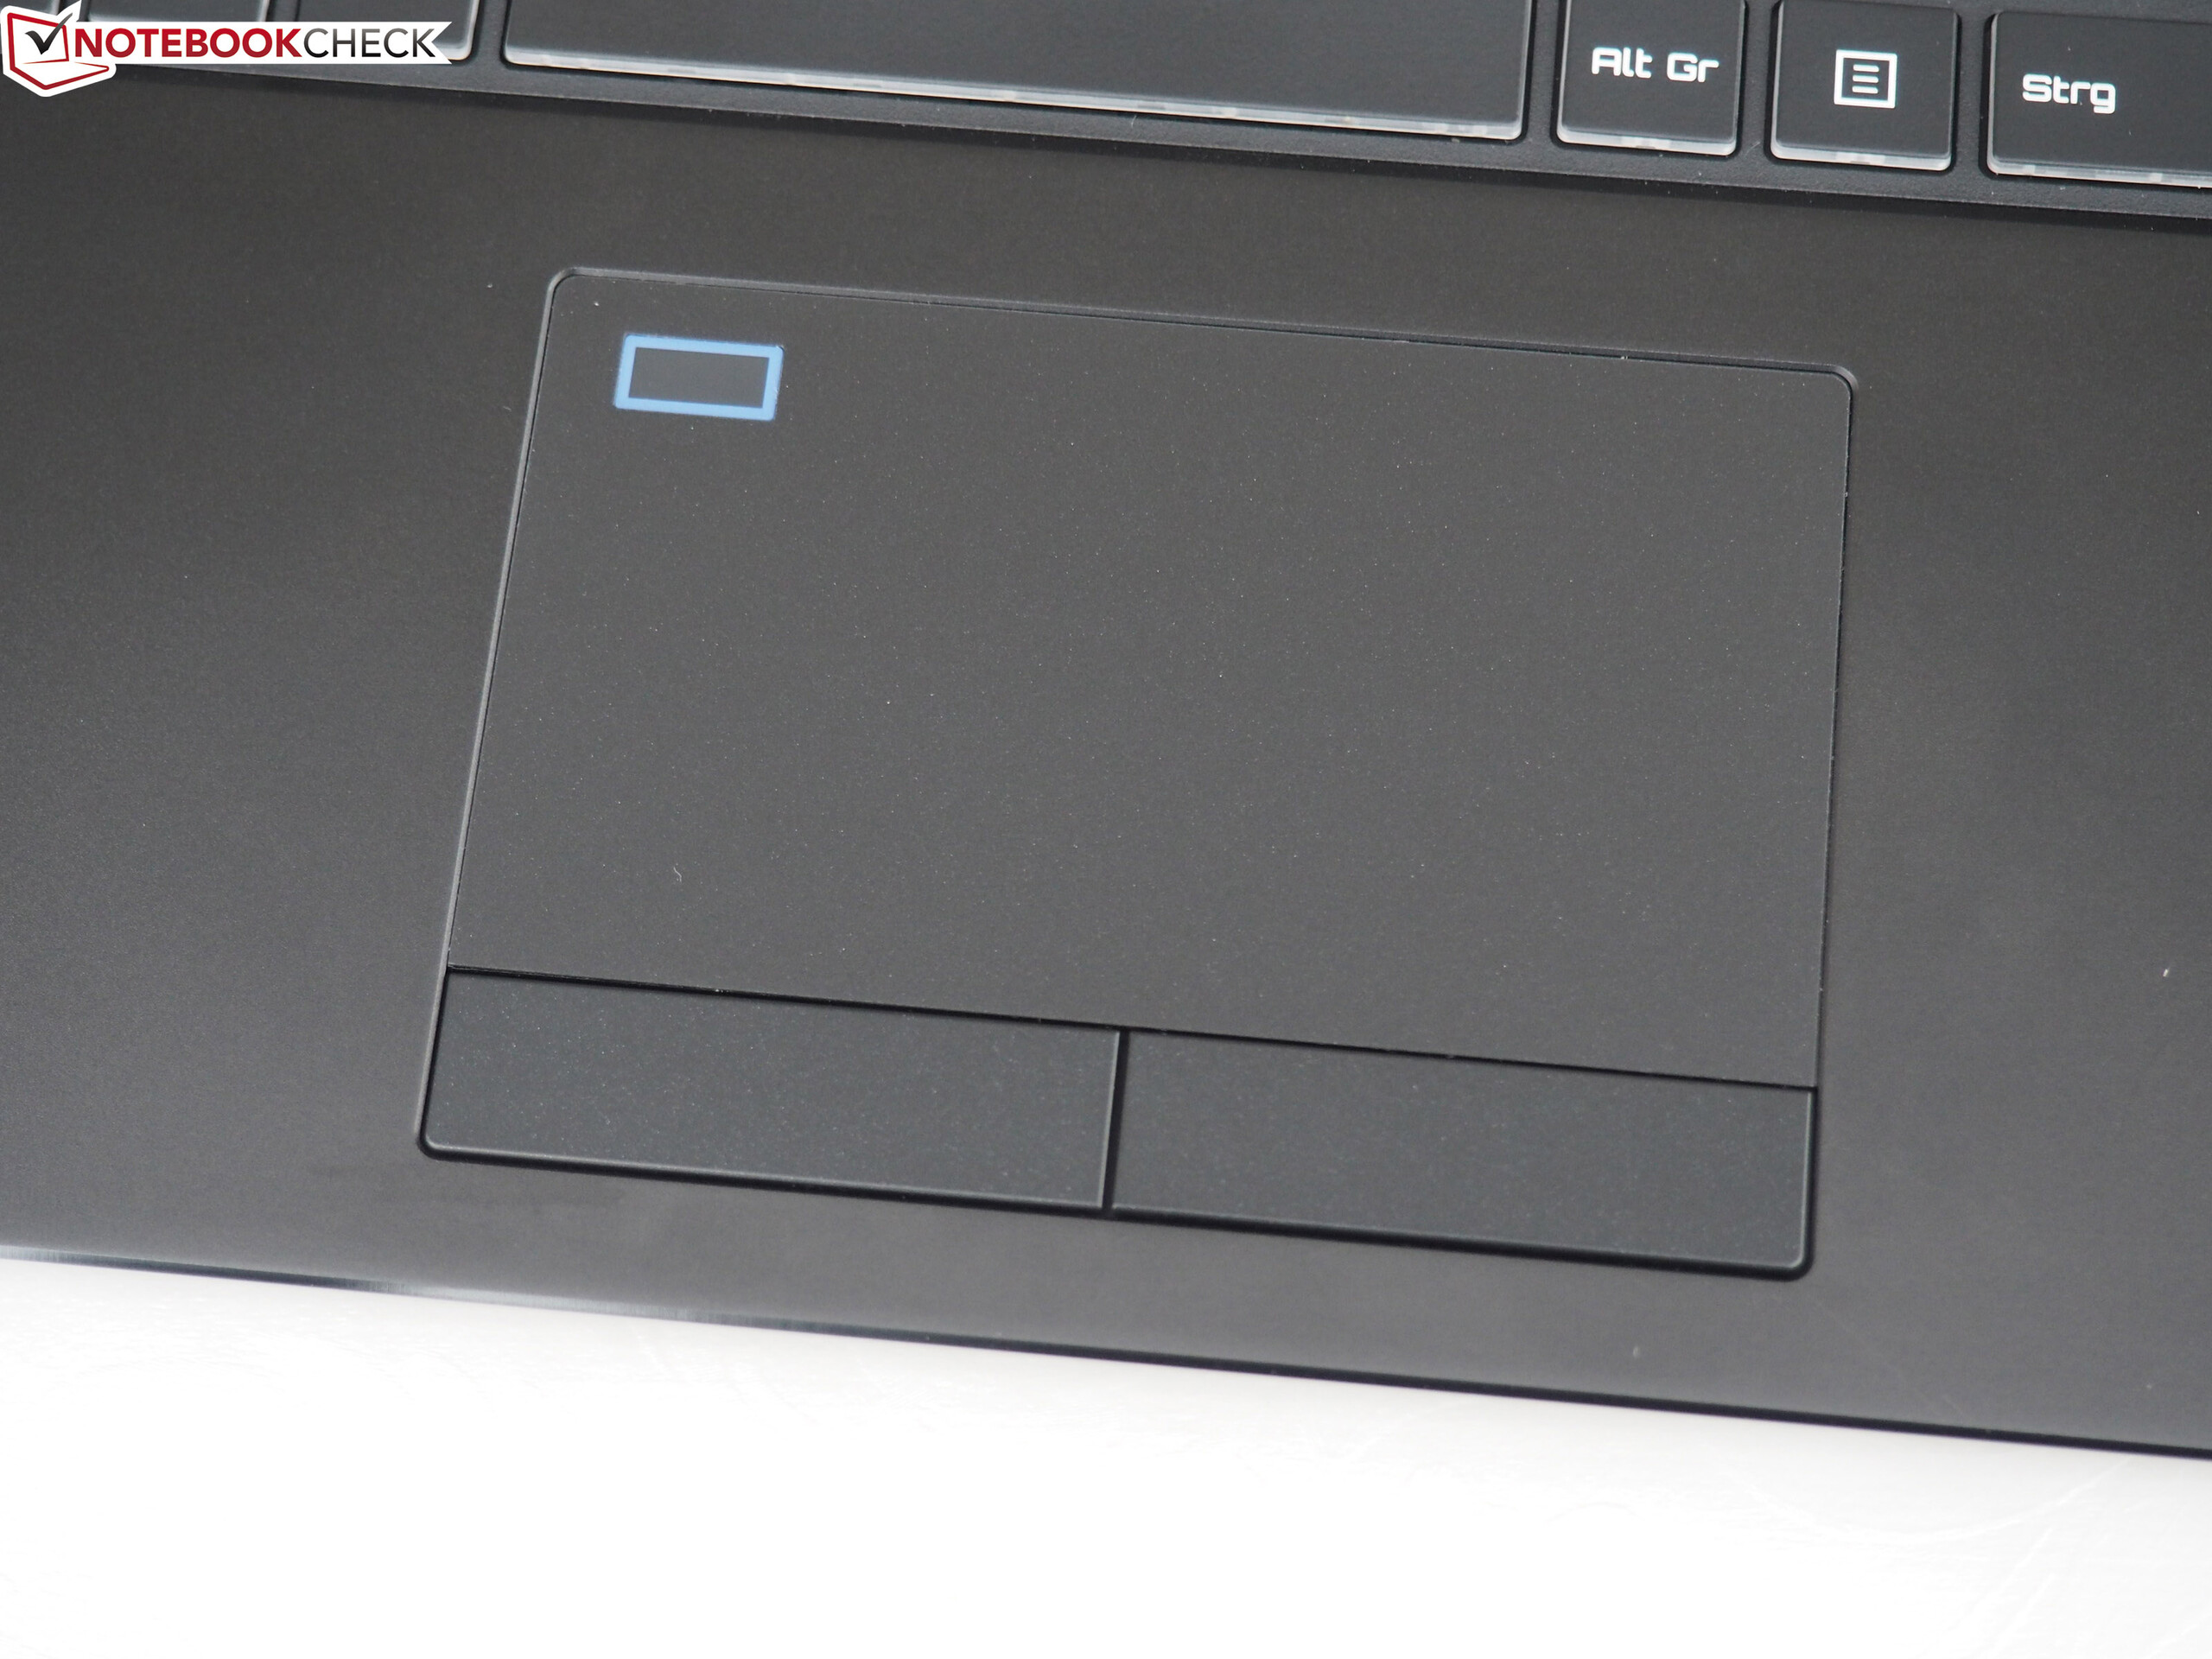
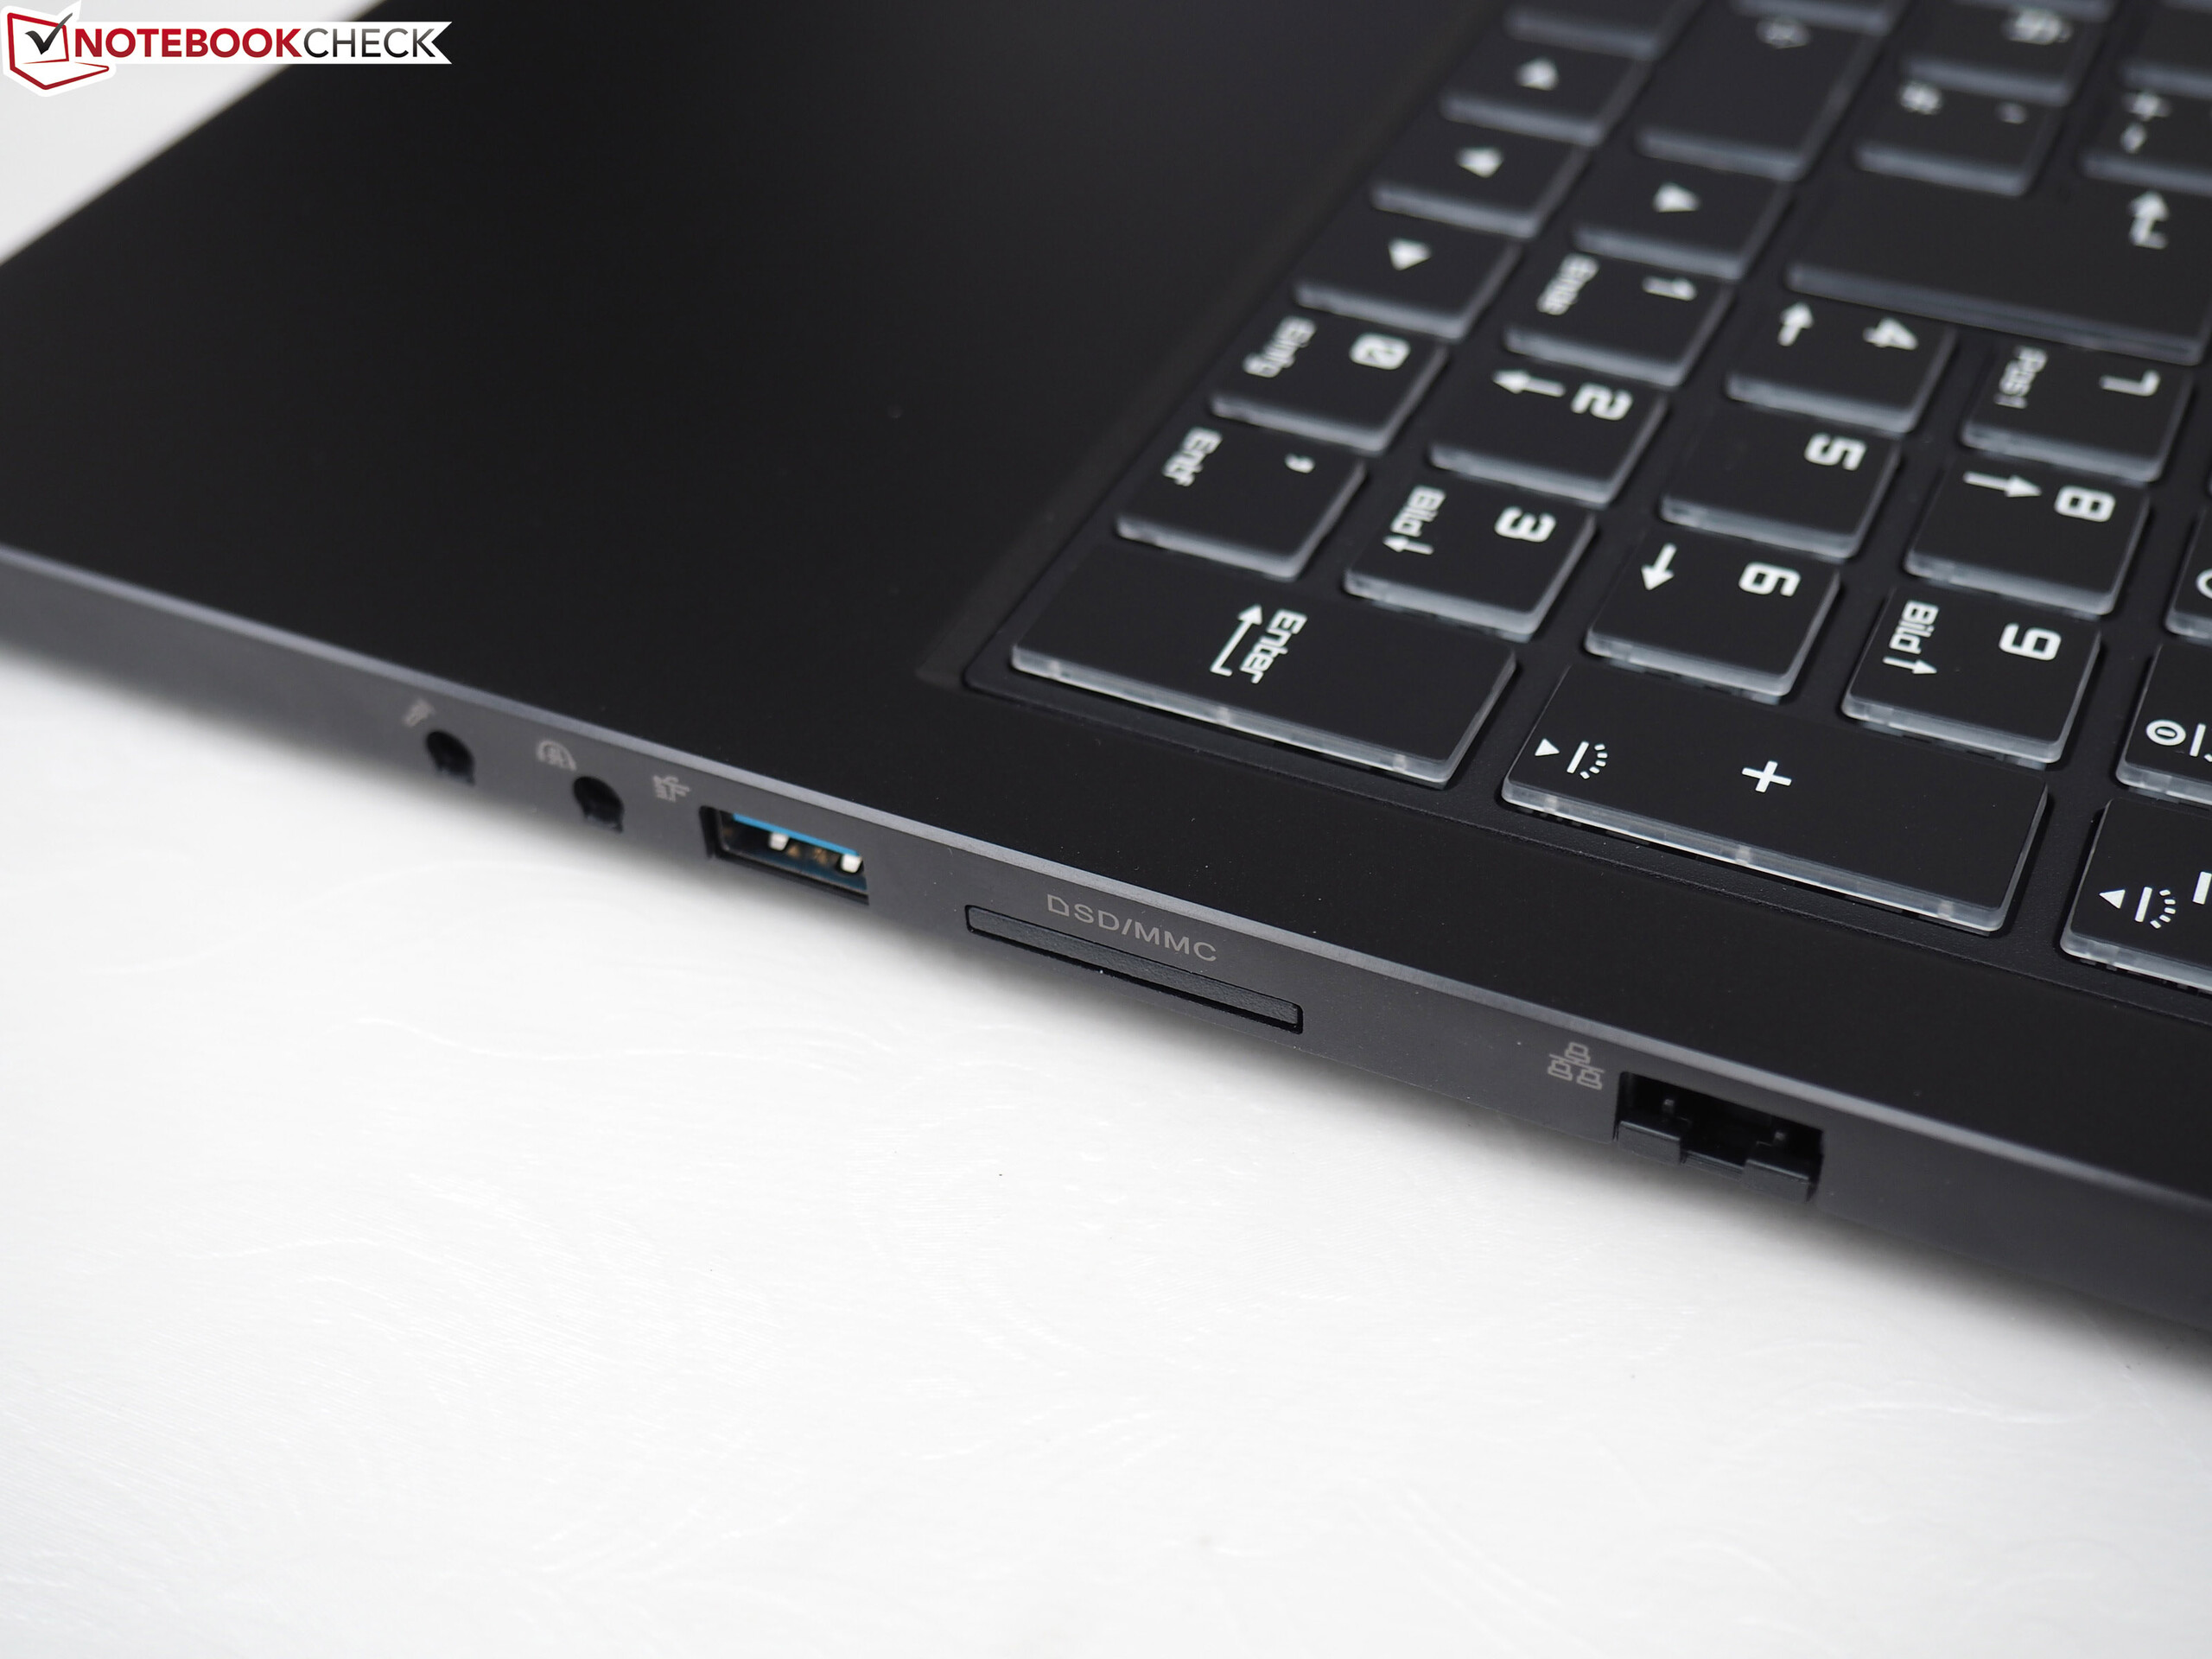
Do lado positivo, está principalmente o baixo peso, o que torna o transporte muito confortável. Só de olhar para o aparelho de 15 polegadas, você dificilmente esperaria o hardware poderoso. Mas o sistema também pode ser um portátil de gama alta. Você raramente pode encontrar tanto desempenho em tão pouco espaço. A maioria dos compradores deve estar satisfeito com as conexões, dispositivos de entrada e tela.
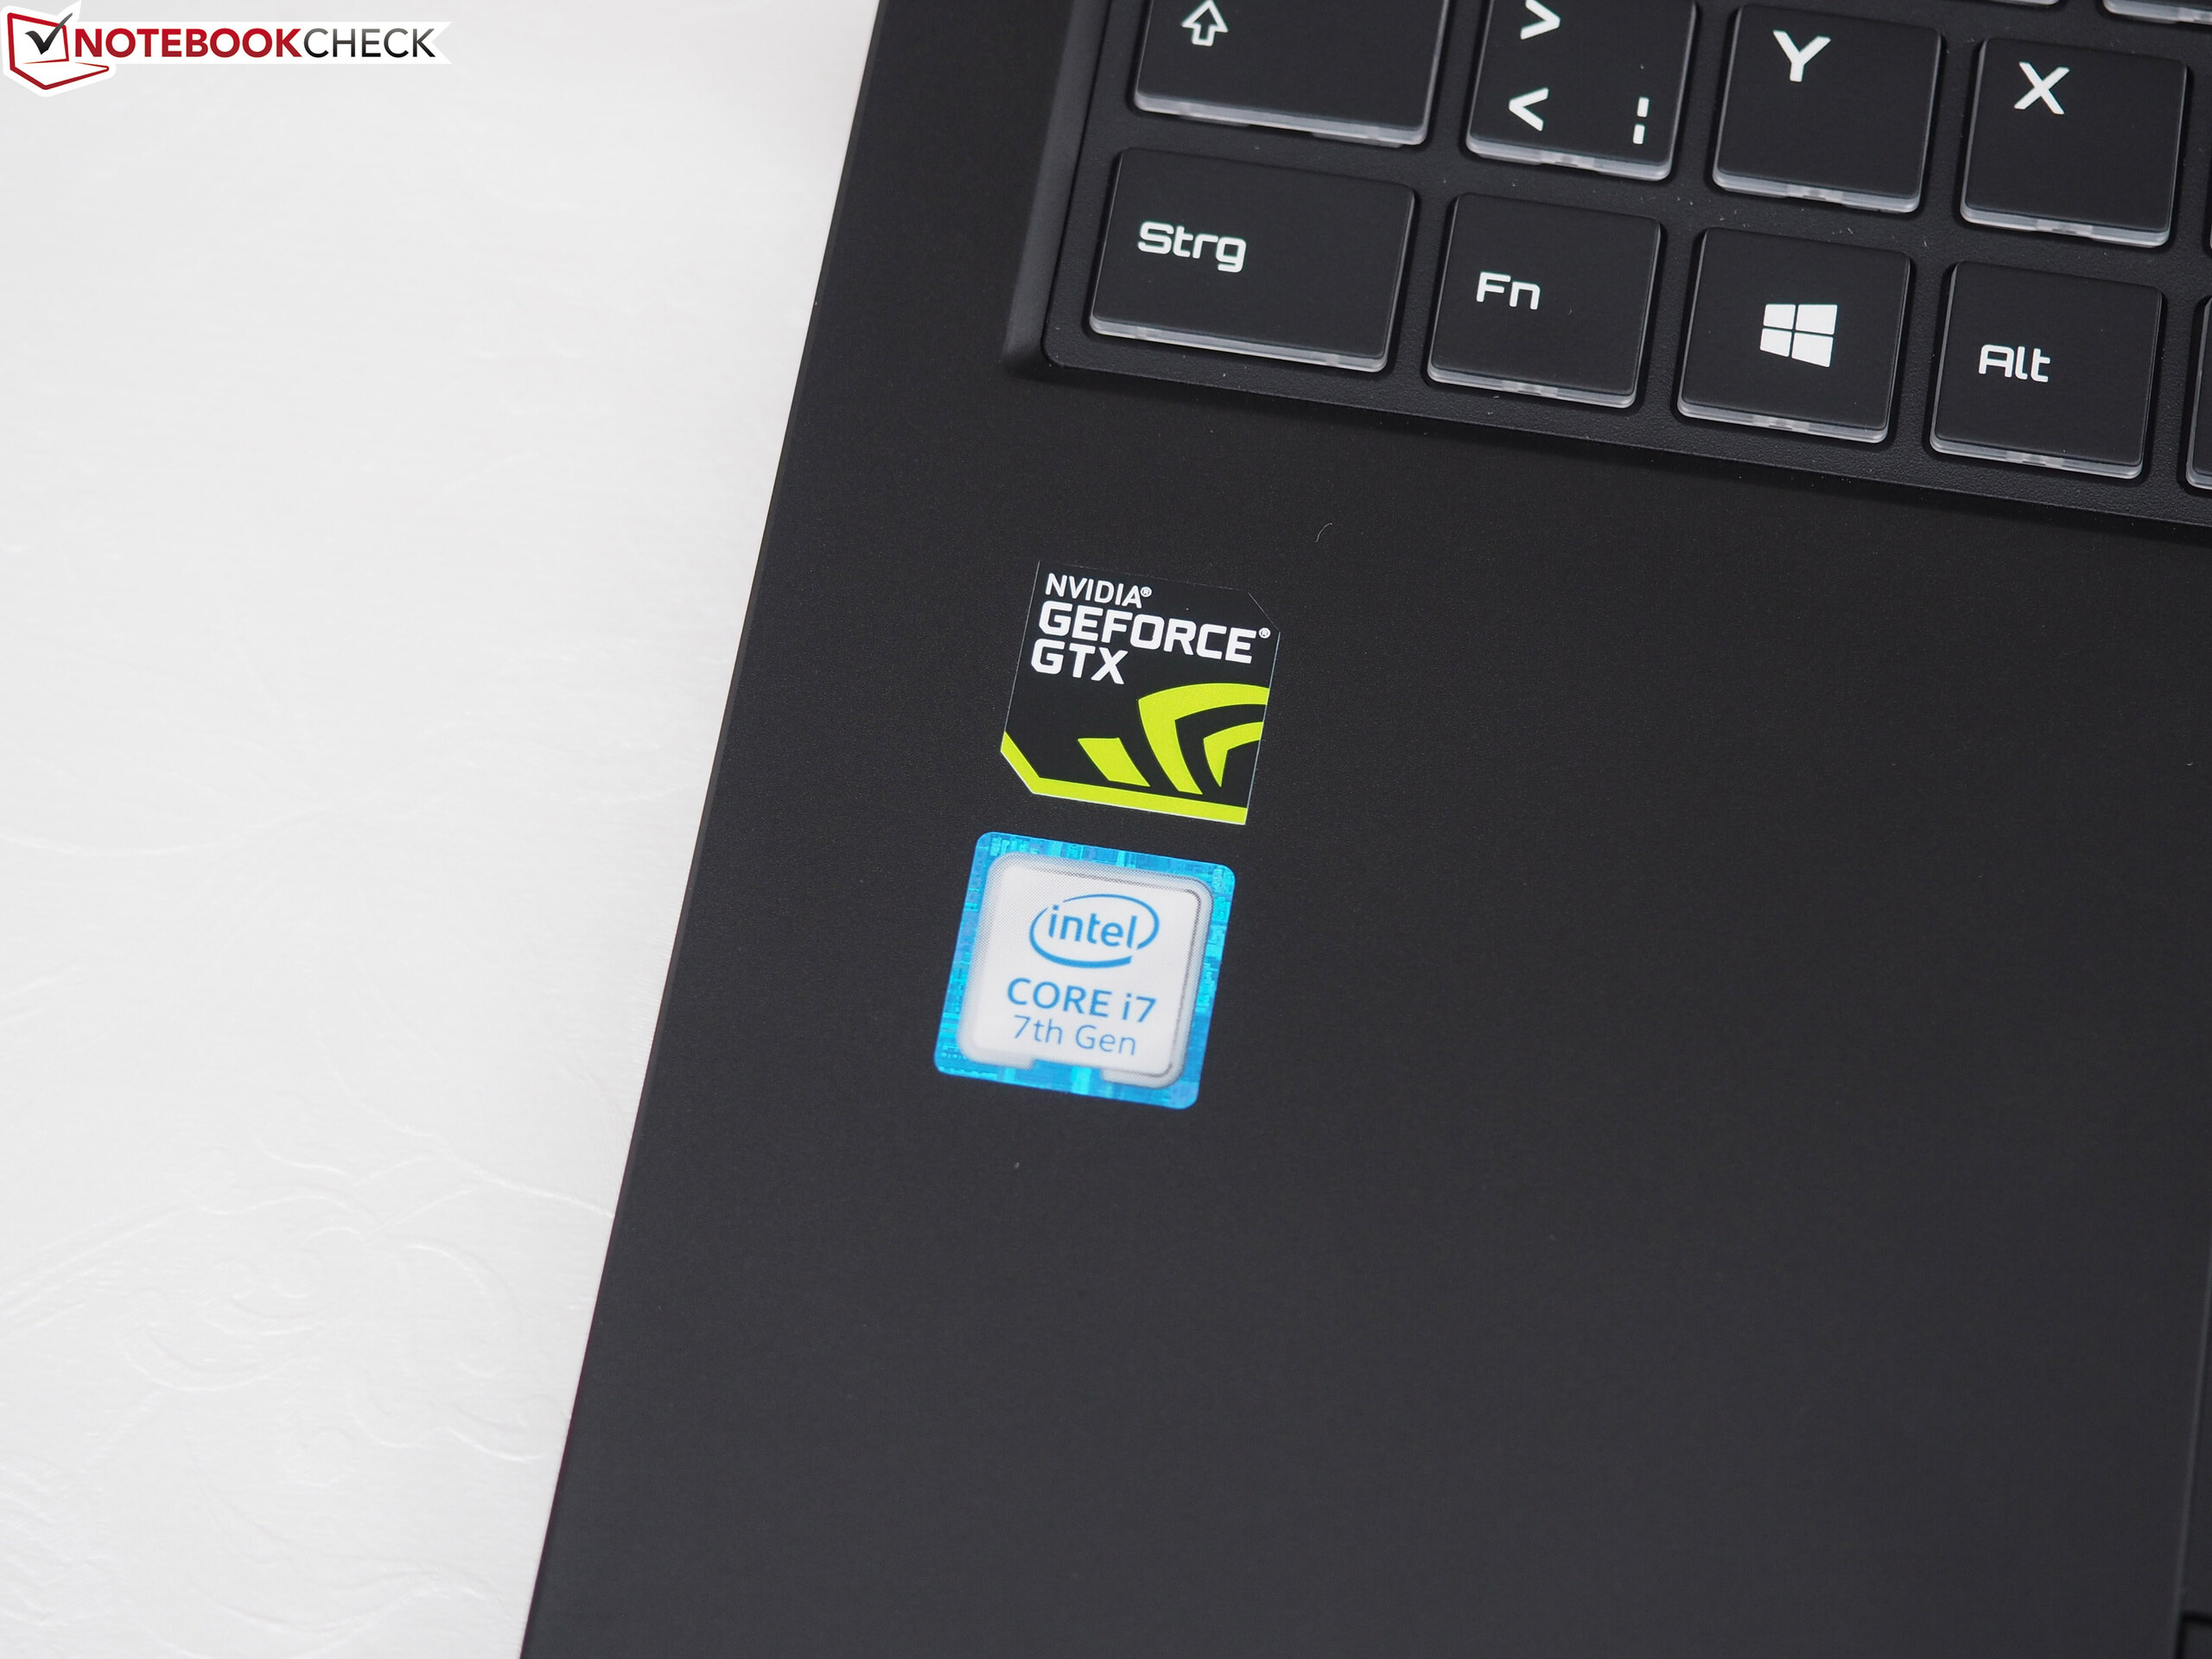
No entanto, o Key 15 tem dificuldade em manter-se contra a elite multimídia. Em particular o Aero 15, que também está disponível com o GTX 1060 e GTX 1070 Max-Q, supera o portátil Schenker em várias ocasiões. Não só o concorrente Gigabyte é mais silencioso, mas também ganha pontos com um som melhor, uma velocidade de CPU mais estável e - deixando o slot de 2,5 polegadas - com uma bateria significativamente maior. Para alguns usuários, a porta Thunderbolt-3 também pode ser um argumento para o Aero 15.
SCHENKER Key 15
-
06/14/2018 v6(old)
Florian Glaser
Pricecompare