 Deutsch
 English
 Español
 Français
 Italiano
 Nederlands
 Polski
 Português
 Русский
 Türkçe
 Svenska
 Chinese
 Magyar
Breve Análise do Smartphone Asus ZenFone 3 Max ZC520TL

| Networking | |
| iperf3 transmit AX12 | |
| LG X Power K220 | |
| Asus Zenfone 3 Max ZC520TL | |
| iperf3 receive AX12 | |
| Asus Zenfone 3 Max ZC520TL | |
| LG X Power K220 | |


| |||||||||||||||||||||||||
iluminação: 85 %
iluminação com acumulador: 507 cd/m²
Contraste: 957:1 (Preto: 0.53 cd/m²)
ΔE Color 4.7 | 0.5-29.43 Ø5
ΔE Greyscale 4.8 | 0.57-98 Ø5.3
Gamma: 2.25
| Asus Zenfone 3 Max ZC520TL IPS, 1280x720, 5.20 | Asus ZenFone Max ZC550KL IPS, 1280x720, 5.50 | Honor 5C IPS, 1920x1080, 5.20 | Huawei Y6 II Compact IPS, 1280x720, 5.00 | Samsung Galaxy J5 2016 AMOLED, 1280x720, 5.20 | LG X Power K220 IPS, 1280x720, 5.30 | |
|---|---|---|---|---|---|---|
| Screen | -1% | -14% | -28% | -6% | -24% | |
| Brightness middle | 507 | 586 16% | 515 2% | 491 -3% | 289 -43% | 381 -25% |
| Brightness | 474 | 566 19% | 498 5% | 487 3% | 291 -39% | 352 -26% |
| Brightness Distribution | 85 | 84 -1% | 93 9% | 92 8% | 96 13% | 85 0% |
| Black Level * | 0.53 | 0.57 -8% | 0.49 8% | 0.9 -70% | 0.2 62% | |
| Contrast | 957 | 1028 7% | 1051 10% | 546 -43% | 1905 99% | |
| Colorchecker dE 2000 * | 4.7 | 4.2 11% | 6.2 -32% | 6.6 -40% | 4.7 -0% | 7.3 -55% |
| Colorchecker dE 2000 max. * | 7.2 | 8.4 -17% | 11.4 -58% | 12.9 -79% | 7.3 -1% | 21.2 -194% |
| Greyscale dE 2000 * | 4.8 | 6.3 -31% | 7.4 -54% | 4.9 -2% | 3 37% | 7.4 -54% |
| Gamma | 2.25 98% | 2.39 92% | 2.28 96% | 2.12 104% | 2.03 108% | 2.26 97% |
| CCT | 6441 101% | 6614 98% | 8664 75% | 7090 92% | 6291 103% | 8417 77% |
* ... smaller is better
Screen Flickering / PWM (Pulse-Width Modulation)
| Screen flickering / PWM not detected | 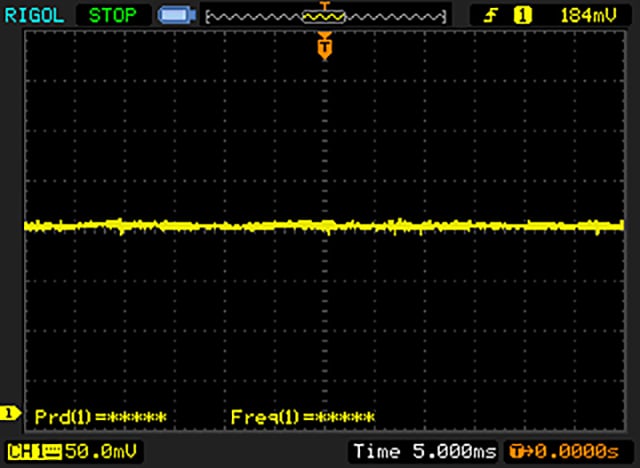 | ||
In comparison: 53 % of all tested devices do not use PWM to dim the display. If PWM was detected, an average of 17915 (minimum: 5 - maximum: 3846000) Hz was measured. | |||
Display Response Times
| ↔ Response Time Black to White | ||
|---|---|---|
| 44 ms ... rise ↗ and fall ↘ combined | ↗ 11 ms rise | 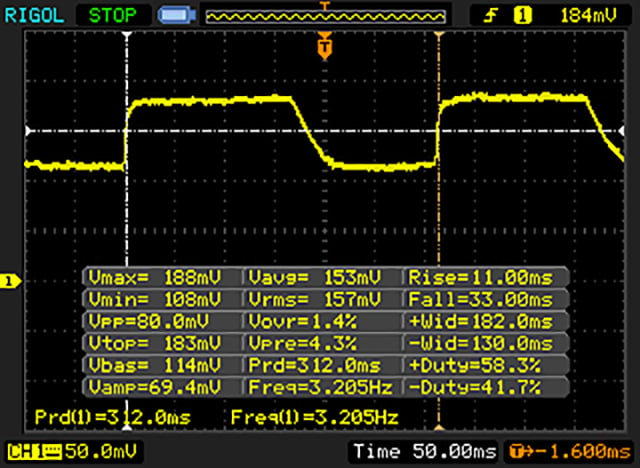 |
| ↘ 33 ms fall | ||
| The screen shows slow response rates in our tests and will be unsatisfactory for gamers. In comparison, all tested devices range from 0.1 (minimum) to 240 (maximum) ms. » 98 % of all devices are better. This means that the measured response time is worse than the average of all tested devices (21.5 ms). | ||
| ↔ Response Time 50% Grey to 80% Grey | ||
| 72 ms ... rise ↗ and fall ↘ combined | ↗ 32 ms rise | 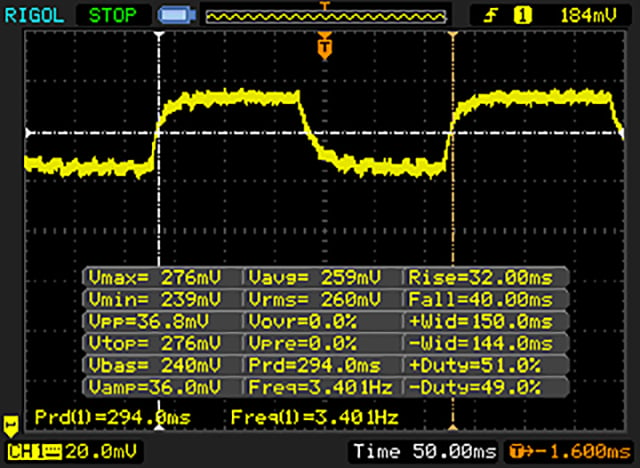 |
| ↘ 40 ms fall | ||
| The screen shows slow response rates in our tests and will be unsatisfactory for gamers. In comparison, all tested devices range from 0.2 (minimum) to 636 (maximum) ms. » 99 % of all devices are better. This means that the measured response time is worse than the average of all tested devices (33.7 ms). | ||
| AnTuTu v6 - Total Score (sort by value) | |
| Asus Zenfone 3 Max ZC520TL | |
| Asus ZenFone Max ZC550KL | |
| Honor 5C | |
| Huawei Y6 II Compact | |
| Samsung Galaxy J5 2016 | |
| LG X Power K220 | |
| Geekbench 4.0 | |
| 64 Bit Single-Core Score (sort by value) | |
| Asus Zenfone 3 Max ZC520TL | |
| Huawei Y6 II Compact | |
| LG X Power K220 | |
| 64 Bit Multi-Core Score (sort by value) | |
| Asus Zenfone 3 Max ZC520TL | |
| Huawei Y6 II Compact | |
| LG X Power K220 | |
| GFXBench (DX / GLBenchmark) 2.7 | |
| T-Rex Onscreen (sort by value) | |
| Asus Zenfone 3 Max ZC520TL | |
| Honor 5C | |
| Huawei Y6 II Compact | |
| Samsung Galaxy J5 2016 | |
| LG X Power K220 | |
| 1920x1080 T-Rex Offscreen (sort by value) | |
| Asus Zenfone 3 Max ZC520TL | |
| Asus ZenFone Max ZC550KL | |
| Honor 5C | |
| Huawei Y6 II Compact | |
| Samsung Galaxy J5 2016 | |
| LG X Power K220 | |
| GFXBench 3.0 | |
| on screen Manhattan Onscreen OGL (sort by value) | |
| Asus Zenfone 3 Max ZC520TL | |
| Asus ZenFone Max ZC550KL | |
| Honor 5C | |
| Huawei Y6 II Compact | |
| Samsung Galaxy J5 2016 | |
| LG X Power K220 | |
| 1920x1080 1080p Manhattan Offscreen (sort by value) | |
| Asus Zenfone 3 Max ZC520TL | |
| Asus ZenFone Max ZC550KL | |
| Honor 5C | |
| Huawei Y6 II Compact | |
| Samsung Galaxy J5 2016 | |
| LG X Power K220 | |
| GFXBench 3.1 | |
| on screen Manhattan ES 3.1 Onscreen (sort by value) | |
| Asus Zenfone 3 Max ZC520TL | |
| Honor 5C | |
| Huawei Y6 II Compact | |
| Samsung Galaxy J5 2016 | |
| LG X Power K220 | |
| 1920x1080 Manhattan ES 3.1 Offscreen (sort by value) | |
| Asus Zenfone 3 Max ZC520TL | |
| Honor 5C | |
| Huawei Y6 II Compact | |
| Samsung Galaxy J5 2016 | |
| LG X Power K220 | |
| PCMark for Android - Work performance score (sort by value) | |
| Asus Zenfone 3 Max ZC520TL | |
| Asus ZenFone Max ZC550KL | |
| Honor 5C | |
| Huawei Y6 II Compact | |
| Samsung Galaxy J5 2016 | |
| LG X Power K220 | |
| Octane V2 - Total Score (sort by value) | |
| Asus Zenfone 3 Max ZC520TL | |
| Asus ZenFone Max ZC550KL | |
| Honor 5C | |
| Huawei Y6 II Compact | |
| Samsung Galaxy J5 2016 | |
| LG X Power K220 | |
| Mozilla Kraken 1.1 - Total (sort by value) | |
| Asus Zenfone 3 Max ZC520TL | |
| Asus ZenFone Max ZC550KL | |
| Honor 5C | |
| Huawei Y6 II Compact | |
| Samsung Galaxy J5 2016 | |
| LG X Power K220 | |
| WebXPRT 2015 - Overall (sort by value) | |
| Asus Zenfone 3 Max ZC520TL | |
| Honor 5C | |
| Huawei Y6 II Compact | |
| Samsung Galaxy J5 2016 | |
| JetStream 1.1 - Total Score (sort by value) | |
| Asus Zenfone 3 Max ZC520TL | |
| Asus ZenFone Max ZC550KL | |
| Honor 5C | |
| Huawei Y6 II Compact | |
| Samsung Galaxy J5 2016 | |
| LG X Power K220 | |
* ... smaller is better
| Asus Zenfone 3 Max ZC520TL | Asus ZenFone Max ZC550KL | Honor 5C | Huawei Y6 II Compact | Samsung Galaxy J5 2016 | LG X Power K220 | |
|---|---|---|---|---|---|---|
| AndroBench 3-5 | -41% | 54% | 7% | 24% | -20% | |
| Sequential Read 256KB | 174.2 | 130.6 -25% | 263 51% | 211 21% | 147 -16% | 196.8 13% |
| Sequential Write 256KB | 65.2 | 31.1 -52% | 75.5 16% | 75 15% | 72 10% | 43.74 -33% |
| Random Read 4KB | 20.9 | 9.1 -56% | 61.7 195% | 23 10% | 21 0% | 18.78 -10% |
| Random Write 4KB | 9.1 | 3.6 -60% | 15.7 73% | 15.5 70% | 11.6 27% | 7.32 -20% |
| Sequential Read 256KB SDCard | 47.67 | 38.43 -19% | 51.9 9% | 31.57 -34% | 79.8 67% | 32.08 -33% |
| Sequential Write 256KB SDCard | 29.59 | 18.93 -36% | 24.21 -18% | 17.12 -42% | 46.61 58% | 18.17 -39% |
| Asphalt 8: Airborne | |||
| Configurações | Valor | ||
| high | 15 fps | ||
| very low | 28 fps | ||
| Dead Trigger 2 | |||
| Configurações | Valor | ||
| high | 27 fps | ||
(±) The maximum temperature on the upper side is 40.4 °C / 105 F, compared to the average of 35 °C / 95 F, ranging from 21.9 to 56 °C for the class Smartphone.
(+) The bottom heats up to a maximum of 35.5 °C / 96 F, compared to the average of 33.8 °C / 93 F
(+) In idle usage, the average temperature for the upper side is 28.7 °C / 84 F, compared to the device average of 32.7 °C / 91 F.
Asus Zenfone 3 Max ZC520TL audio analysis
(+) | speakers can play relatively loud (88 dB)
Bass 100 - 315 Hz
(-) | nearly no bass - on average 37.7% lower than median
(±) | linearity of bass is average (9.6% delta to prev. frequency)
Mids 400 - 2000 Hz
(±) | reduced mids - on average 9.7% lower than median
(±) | linearity of mids is average (9.4% delta to prev. frequency)
Highs 2 - 16 kHz
(±) | higher highs - on average 7.6% higher than median
(+) | highs are linear (3.3% delta to prev. frequency)
Overall 100 - 16.000 Hz
(-) | overall sound is not linear (30.7% difference to median)
Compared to same class
» 76% of all tested devices in this class were better, 4% similar, 20% worse
» The best had a delta of 12%, average was 38%, worst was 134%
Compared to all devices tested
» 87% of all tested devices were better, 3% similar, 10% worse
» The best had a delta of 4%, average was 25%, worst was 134%
LG X Power K220 audio analysis
(+) | speakers can play relatively loud (88.5 dB)
Bass 100 - 315 Hz
(-) | nearly no bass - on average 41.7% lower than median
(±) | linearity of bass is average (8.7% delta to prev. frequency)
Mids 400 - 2000 Hz
(±) | reduced mids - on average 9% lower than median
(±) | linearity of mids is average (10.7% delta to prev. frequency)
Highs 2 - 16 kHz
(±) | higher highs - on average 5.4% higher than median
(+) | highs are linear (4.6% delta to prev. frequency)
Overall 100 - 16.000 Hz
(±) | linearity of overall sound is average (29% difference to median)
Compared to same class
» 72% of all tested devices in this class were better, 4% similar, 24% worse
» The best had a delta of 12%, average was 38%, worst was 134%
Compared to all devices tested
» 85% of all tested devices were better, 3% similar, 13% worse
» The best had a delta of 4%, average was 25%, worst was 134%
Samsung Galaxy J5 2016 audio analysis
(+) | speakers can play relatively loud (84.1 dB)
Bass 100 - 315 Hz
(-) | nearly no bass - on average 32.6% lower than median
(±) | linearity of bass is average (7.1% delta to prev. frequency)
Mids 400 - 2000 Hz
(±) | higher mids - on average 7.6% higher than median
(±) | linearity of mids is average (10.9% delta to prev. frequency)
Highs 2 - 16 kHz
(±) | higher highs - on average 6.1% higher than median
(+) | highs are linear (6.5% delta to prev. frequency)
Overall 100 - 16.000 Hz
(-) | overall sound is not linear (30.2% difference to median)
Compared to same class
» 75% of all tested devices in this class were better, 4% similar, 21% worse
» The best had a delta of 12%, average was 38%, worst was 134%
Compared to all devices tested
» 86% of all tested devices were better, 3% similar, 11% worse
» The best had a delta of 4%, average was 25%, worst was 134%
| desligado | |
| Ocioso | |
| Carga |
|
| Asus Zenfone 3 Max ZC520TL 4100 mAh | Asus ZenFone Max ZC550KL 5000 mAh | Honor 5C 3000 mAh | Huawei Y6 II Compact 2200 mAh | Samsung Galaxy J5 2016 3100 mAh | LG X Power K220 4100 mAh | |
|---|---|---|---|---|---|---|
| Power Consumption | -9% | 8% | 28% | 38% | 28% | |
| Idle Minimum * | 0.74 | 1.15 -55% | 0.89 -20% | 0.57 23% | 0.61 18% | 0.64 14% |
| Idle Average * | 2.04 | 2.09 -2% | 2.07 -1% | 1.53 25% | 1.41 31% | 1.3 36% |
| Idle Maximum * | 2.22 | 2.17 2% | 2.15 3% | 1.6 28% | 1.51 32% | 1.34 40% |
| Load Average * | 5.57 | 5.38 3% | 3.46 38% | 2.82 49% | 2.56 54% | 4.18 25% |
| Load Maximum * | 6.59 | 6.08 8% | 5.18 21% | 5.69 14% | 3.1 53% | 4.87 26% |
* ... smaller is better
| Asus Zenfone 3 Max ZC520TL 4100 mAh | Asus ZenFone Max ZC550KL 5000 mAh | Honor 5C 3000 mAh | Huawei Y6 II Compact 2200 mAh | Samsung Galaxy J5 2016 3100 mAh | LG X Power K220 4100 mAh | |
|---|---|---|---|---|---|---|
| Battery Runtime | 18% | -34% | -22% | 0% | 21% | |
| Reader / Idle | 1462 | 997 -32% | 1175 -20% | 1599 9% | ||
| H.264 | 845 | 602 -29% | 682 -19% | 658 -22% | ||
| WiFi v1.3 | 814 | 959 18% | 584 -28% | 623 -23% | 643 -21% | 987 21% |
| Load | 301 | 156 -48% | 222 -26% | 402 34% | 365 21% |
Pro
Contra

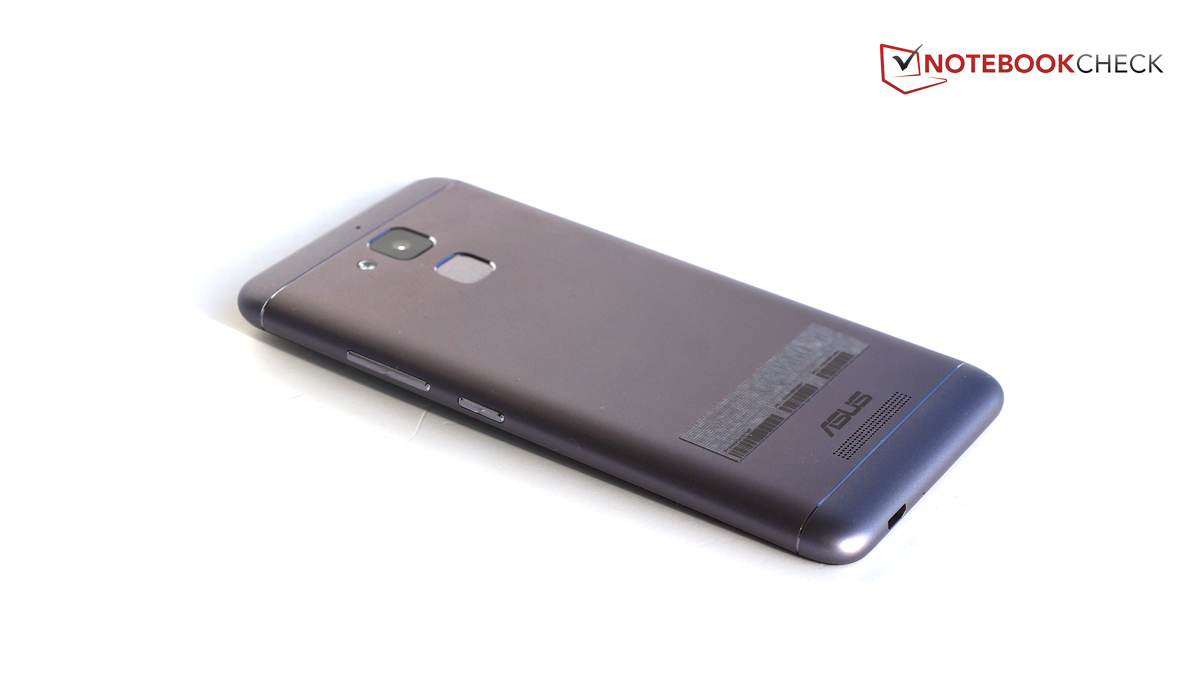
O Asus ZenFone 3 Max mantém sua promessa mais importante: Sua duração de bateria é extremamente longa. Por mais agradável que seja, temos de dizer que o LG X Power inclusive supera esta duração. Gostamos da carcaça do modelo de teste; ela é de muito alta qualidade para esta faixa de preços, mas não se destaca entre a multidão de smartphones. Mais qualidades positivas se encontram na boa tela, baixo consumo de energia no modo inativo e baixa emissão de temperaturas.
Não gostamos tanto do desempenho. O aparelho é mais lento que seus concorrentes em todos os aspectos. Talvez isto se deve à interface ZenUI da Asus? O aparelho somente é condicionalmente adequado para jogos 3D, mas websites mais sofisticados também poderiam ser um problema.
O ZenFone 3 Max oferece uma boa configuração de memória para esta faixa de preços, pode usar dois cartões SIM, e é leve e fino. O aparelho será uma boa opção para que se focar principalmente na duração da bateria.
Em comparação com o seu predecessor direto, o ZenFone Max, o nosso modelo de teste faz muitas coisa melhor, mas perdeu um pouco de seu tempo de duração. O Asus ZenFone 3 Max é uma atualização bem sucedida e é adequado principalmente para os fanáticos da duração da bateria. Todos os outros terão que fazer compromissos na câmera, alto falante, e qualidade das chamadas. Mas isto não é incomum nesta faixa de preços.
Asus Zenfone 3 Max ZC520TL
-
01/02/2017 v6(old)
Florian Wimmer