 Deutsch
 English
 Español
 Français
 Italiano
 Nederlands
 Polski
 Português
 Русский
 Türkçe
 Svenska
 Chinese
 Magyar
Breve Análise do Smartphone Phab 2 Pro


| Networking | |
| iperf3 receive AX12 | |
| Google Pixel XL 2016 | |
| Lenovo Phab 2 Pro | |
| Huawei Mate 9 | |
| Asus Zenfone 3 ZE552KL | |
| iperf3 transmit AX12 | |
| Google Pixel XL 2016 | |
| Lenovo Phab 2 Pro | |
| Huawei Mate 9 | |
| Asus Zenfone 3 ZE552KL | |
| SD Card Reader | |
| maximum SDCardreader Maximum Transfer Rate | |
| average SDCardreader Average Transfer Rate |
| |||||||||||||||||||||||||
iluminação: 93 %
iluminação com acumulador: 472.4 cd/m²
Contraste: 980:1 (Preto: 0.482 cd/m²)
ΔE Color 7 | 0.5-29.43 Ø5
ΔE Greyscale 7.9 | 0.57-98 Ø5.3
83.1% sRGB (Calman 2D)
Gamma: 2.34
| Lenovo Phab 2 Pro IPS, 6.40, 2560x1440 | Apple iPhone 7 Plus Retina HD, IPS, 5.50, 1920x1080 | Huawei Mate 9 IPS, 5.90, 1920x1080 | Asus Zenfone 3 ZE552KL IPS, 5.50, 1920x1080 | Google Pixel XL 2016 AMOLED, 5.50, 2560x1440 | |
|---|---|---|---|---|---|
| Display | |||||
| Display P3 Coverage | 67.2 | ||||
| sRGB Coverage | 99.8 | ||||
| AdobeRGB 1998 Coverage | 69 | ||||
| Response Times | 44% | 13% | 6% | 161% | |
| Response Time Grey 50% / Grey 80% * | 58.4 ? | 29 ? 50% | 57 ? 2% | 56 ? 4% | 4 ? 93% |
| Response Time Black / White * | 38.8 ? | 24 ? 38% | 30 ? 23% | 36 ? 7% | 4 ? 90% |
| PWM Frequency | 59.5 ? | 238.1 300% | |||
| Screen | 45% | 33% | 14% | 12% | |
| Brightness middle | 472.4 | 557 18% | 696 47% | 658 39% | 402 -15% |
| Brightness | 479 | 553 15% | 680 42% | 633 32% | 408 -15% |
| Brightness Distribution | 93 | 97 4% | 93 0% | 93 0% | 85 -9% |
| Black Level * | 0.482 | 0.35 27% | 0.42 13% | 0.66 -37% | |
| Contrast | 980 | 1591 62% | 1657 69% | 997 2% | |
| Colorchecker dE 2000 * | 7 | 1.4 80% | 4.3 39% | 4.9 30% | 4 43% |
| Colorchecker dE 2000 max. * | 11 | 3.1 72% | 9.4 15% | 9.1 17% | 10.1 8% |
| Greyscale dE 2000 * | 7.9 | 1.3 84% | 4.8 39% | 5.8 27% | 3.2 59% |
| Gamma | 2.34 94% | 2.21 100% | 2.33 94% | 2.26 97% | 2.19 100% |
| CCT | 7826 83% | 6667 97% | 7255 90% | 7840 83% | 7037 92% |
| Color Space (Percent of AdobeRGB 1998) | 63.1 | ||||
| Color Space (Percent of sRGB) | 99.83 | ||||
| Total Average (Program / Settings) | 45% /
45% | 23% /
29% | 10% /
12% | 87% /
62% |
* ... smaller is better
Display Response Times
| ↔ Response Time Black to White | ||
|---|---|---|
| 38.8 ms ... rise ↗ and fall ↘ combined | ↗ 7.2 ms rise | 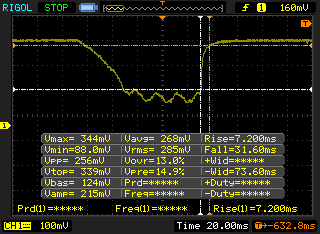 |
| ↘ 31.6 ms fall | ||
| The screen shows slow response rates in our tests and will be unsatisfactory for gamers. In comparison, all tested devices range from 0.1 (minimum) to 240 (maximum) ms. » 96 % of all devices are better. This means that the measured response time is worse than the average of all tested devices (21.5 ms). | ||
| ↔ Response Time 50% Grey to 80% Grey | ||
| 58.4 ms ... rise ↗ and fall ↘ combined | ↗ 23.2 ms rise | 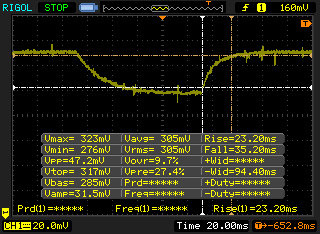 |
| ↘ 35.2 ms fall | ||
| The screen shows slow response rates in our tests and will be unsatisfactory for gamers. In comparison, all tested devices range from 0.2 (minimum) to 636 (maximum) ms. » 94 % of all devices are better. This means that the measured response time is worse than the average of all tested devices (33.7 ms). | ||
Screen Flickering / PWM (Pulse-Width Modulation)
| Screen flickering / PWM detected | 59.5 Hz | ≤ 30 % brightness setting | 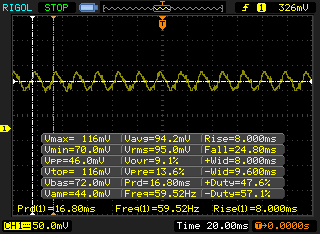 |
The display backlight flickers at 59.5 Hz (worst case, e.g., utilizing PWM) Flickering detected at a brightness setting of 30 % and below. There should be no flickering or PWM above this brightness setting. The frequency of 59.5 Hz is very low, so the flickering may cause eyestrain and headaches after extended use. In comparison: 53 % of all tested devices do not use PWM to dim the display. If PWM was detected, an average of 17900 (minimum: 5 - maximum: 3846000) Hz was measured. | |||
| AnTuTu v6 - Total Score | |
| Google Pixel XL 2016 | |
| Samsung Galaxy S7 | |
| Huawei Mate 9 | |
| Lenovo Phab 2 Pro | |
| Sony Xperia XA | |
| Fairphone 2 | |
| Geekbench 4.0 | |
| Compute RenderScript Score | |
| Google Pixel XL 2016 | |
| Lenovo Phab 2 Pro | |
| Huawei Mate 9 | |
| Fairphone 2 | |
| 64 Bit Multi-Core Score | |
| Huawei Mate 9 | |
| Google Pixel XL 2016 | |
| Lenovo Phab 2 Pro | |
| Fairphone 2 | |
| 64 Bit Single-Core Score | |
| Huawei Mate 9 | |
| Google Pixel XL 2016 | |
| Lenovo Phab 2 Pro | |
| Fairphone 2 | |
| Octane V2 - Total Score | |
| Samsung Galaxy S7 | |
| Huawei Mate 9 | |
| Lenovo Phab 2 Pro | |
| Google Pixel XL 2016 | |
| Fairphone 2 | |
| Sony Xperia XA | |
| Mozilla Kraken 1.1 - Total | |
| Sony Xperia XA | |
| Fairphone 2 | |
| Lenovo Phab 2 Pro | |
| Huawei Mate 9 | |
| Google Pixel XL 2016 | |
| Samsung Galaxy S7 | |
| WebXPRT 2015 - Overall | |
| Samsung Galaxy S7 | |
| Huawei Mate 9 | |
| Google Pixel XL 2016 | |
| Lenovo Phab 2 Pro | |
| Sony Xperia XA | |
| Fairphone 2 | |
| JetStream 1.1 - Total Score | |
| Samsung Galaxy S7 | |
| Huawei Mate 9 | |
| Google Pixel XL 2016 | |
| Lenovo Phab 2 Pro | |
| Sony Xperia XA | |
| Fairphone 2 | |
* ... smaller is better
| Lenovo Phab 2 Pro 64 GB eMMC Flash | Huawei Mate 9 64 GB UFS 2.1 Flash | Google Pixel XL 2016 32 GB eMMC Flash | Sony Xperia XA 16 GB eMMC Flash | Samsung Galaxy S7 32 GB UFS 2.0 Flash | |
|---|---|---|---|---|---|
| AndroBench 3-5 | 30% | 26% | -21% | 40% | |
| Sequential Write 256KB SDCard | 54.8 | 29.53 -46% | 50.7 -7% | 53.6 -2% | |
| Sequential Read 256KB SDCard | 71.9 | 54 -25% | 72.9 1% | 72.3 1% | |
| Random Write 4KB | 12.92 | 8.77 -32% | 14.56 13% | 10.6 -18% | 16.01 24% |
| Random Read 4KB | 38.53 | 94.7 146% | 87.7 128% | 22.05 -43% | 85.9 123% |
| Sequential Write 256KB | 138 | 142.9 4% | 83.4 -40% | 68.6 -50% | 145.7 6% |
| Sequential Read 256KB | 255 | 594 133% | 258.2 1% | 240.4 -6% | 483.8 90% |
| Lightmark - 1920x1080 1080p | |
| LG G5 | |
| Huawei Mate 9 | |
| Samsung Galaxy S7 | |
| Lenovo Phab 2 Pro | |
| Huawei Mate 8 | |
(±) The maximum temperature on the upper side is 41.6 °C / 107 F, compared to the average of 35 °C / 95 F, ranging from 21.9 to 56 °C for the class Smartphone.
(+) The bottom heats up to a maximum of 34.2 °C / 94 F, compared to the average of 33.8 °C / 93 F
(+) In idle usage, the average temperature for the upper side is 25.4 °C / 78 F, compared to the device average of 32.7 °C / 91 F.
Lenovo Phab 2 Pro audio analysis
(+) | speakers can play relatively loud (84.5 dB)
Bass 100 - 315 Hz
(-) | nearly no bass - on average 22.8% lower than median
(±) | linearity of bass is average (11.4% delta to prev. frequency)
Mids 400 - 2000 Hz
(+) | balanced mids - only 2.2% away from median
(+) | mids are linear (4.7% delta to prev. frequency)
Highs 2 - 16 kHz
(±) | higher highs - on average 6.3% higher than median
(±) | linearity of highs is average (7.3% delta to prev. frequency)
Overall 100 - 16.000 Hz
(±) | linearity of overall sound is average (21.1% difference to median)
Compared to same class
» 33% of all tested devices in this class were better, 8% similar, 59% worse
» The best had a delta of 12%, average was 38%, worst was 134%
Compared to all devices tested
» 53% of all tested devices were better, 7% similar, 40% worse
» The best had a delta of 4%, average was 25%, worst was 134%
Apple MacBook 12 (Early 2016) 1.1 GHz audio analysis
(+) | speakers can play relatively loud (83.6 dB)
Bass 100 - 315 Hz
(±) | reduced bass - on average 11.3% lower than median
(±) | linearity of bass is average (14.2% delta to prev. frequency)
Mids 400 - 2000 Hz
(+) | balanced mids - only 2.4% away from median
(+) | mids are linear (5.5% delta to prev. frequency)
Highs 2 - 16 kHz
(+) | balanced highs - only 2% away from median
(+) | highs are linear (4.5% delta to prev. frequency)
Overall 100 - 16.000 Hz
(+) | overall sound is linear (10.2% difference to median)
Compared to same class
» 5% of all tested devices in this class were better, 2% similar, 93% worse
» The best had a delta of 5%, average was 19%, worst was 53%
Compared to all devices tested
» 3% of all tested devices were better, 1% similar, 96% worse
» The best had a delta of 4%, average was 25%, worst was 134%
| desligado | |
| Ocioso | |
| Carga |
|
| Lenovo Phab 2 Pro 652 MSM8976, Adreno 510, 64 GB eMMC Flash, IPS, 2560x1440, 6.40 | Apple iPhone 7 Plus A10 Fusion, A10 Fusion GPU, 128 GB NVMe, IPS, 1920x1080, 5.50 | Huawei Mate 9 Kirin 960, Mali-G71 MP8, 64 GB UFS 2.1 Flash, IPS, 1920x1080, 5.90 | Asus Zenfone 3 ZE552KL 625, Adreno 506, 64 GB eMMC Flash, IPS, 1920x1080, 5.50 | Google Pixel XL 2016 SD 821, Adreno 530, 32 GB eMMC Flash, AMOLED, 2560x1440, 5.50 | |
|---|---|---|---|---|---|
| Power Consumption | 44% | 46% | 54% | 60% | |
| Idle Minimum * | 3 | 0.77 74% | 0.78 74% | 0.83 72% | 0.53 82% |
| Idle Average * | 4.1 | 2.04 50% | 2.13 48% | 2.11 49% | 1.07 74% |
| Idle Maximum * | 4.2 | 2.24 47% | 2.17 48% | 2.12 50% | 1.12 73% |
| Load Average * | 10.4 | 4.69 55% | 6.32 39% | 3.41 67% | 5.53 47% |
| Load Maximum * | 8.1 | 8.66 -7% | 6.49 20% | 5.46 33% | 6.26 23% |
* ... smaller is better
| Lenovo Phab 2 Pro 652 MSM8976, Adreno 510, Wh | Apple iPhone 7 Plus A10 Fusion, A10 Fusion GPU, 11.02 Wh | Huawei Mate 9 Kirin 960, Mali-G71 MP8, Wh | Asus Zenfone 3 ZE552KL 625, Adreno 506, Wh | Google Pixel XL 2016 SD 821, Adreno 530, Wh | |
|---|---|---|---|---|---|
| Battery Runtime | 33% | 34% | 59% | 13% | |
| Reader / Idle | 1119 | 1835 64% | 1538 37% | 1502 34% | 1333 19% |
| WiFi v1.3 | 508 | 587 16% | 758 49% | 797 57% | 505 -1% |
| Load | 190 | 225 18% | 219 15% | 352 85% | 230 21% |
Pro
Contra
O grande destaque do Phab 2 Pro é seu exclusivo hardware Tango Em seu estado atual, no entanto, o recurso é mais que uma novidade que é uma implementação prática. Além de seu potencial, a Lenovo prometeu a habilidade de navegar em interiores e entre quartos onde os sinais de GPS normalmente são fracos A pesquisa de rotas para um museu ou aeroporto internacional, por exemplo, ainda não está disponível e seria totalmente dependente do suporte do desenvolvedor. É muito cedo para catalogar o Tango como um "gimmick", mas o seu software se sente muito simples e não demonstra o potencial escondido atrás da área da tecnologia educativa.
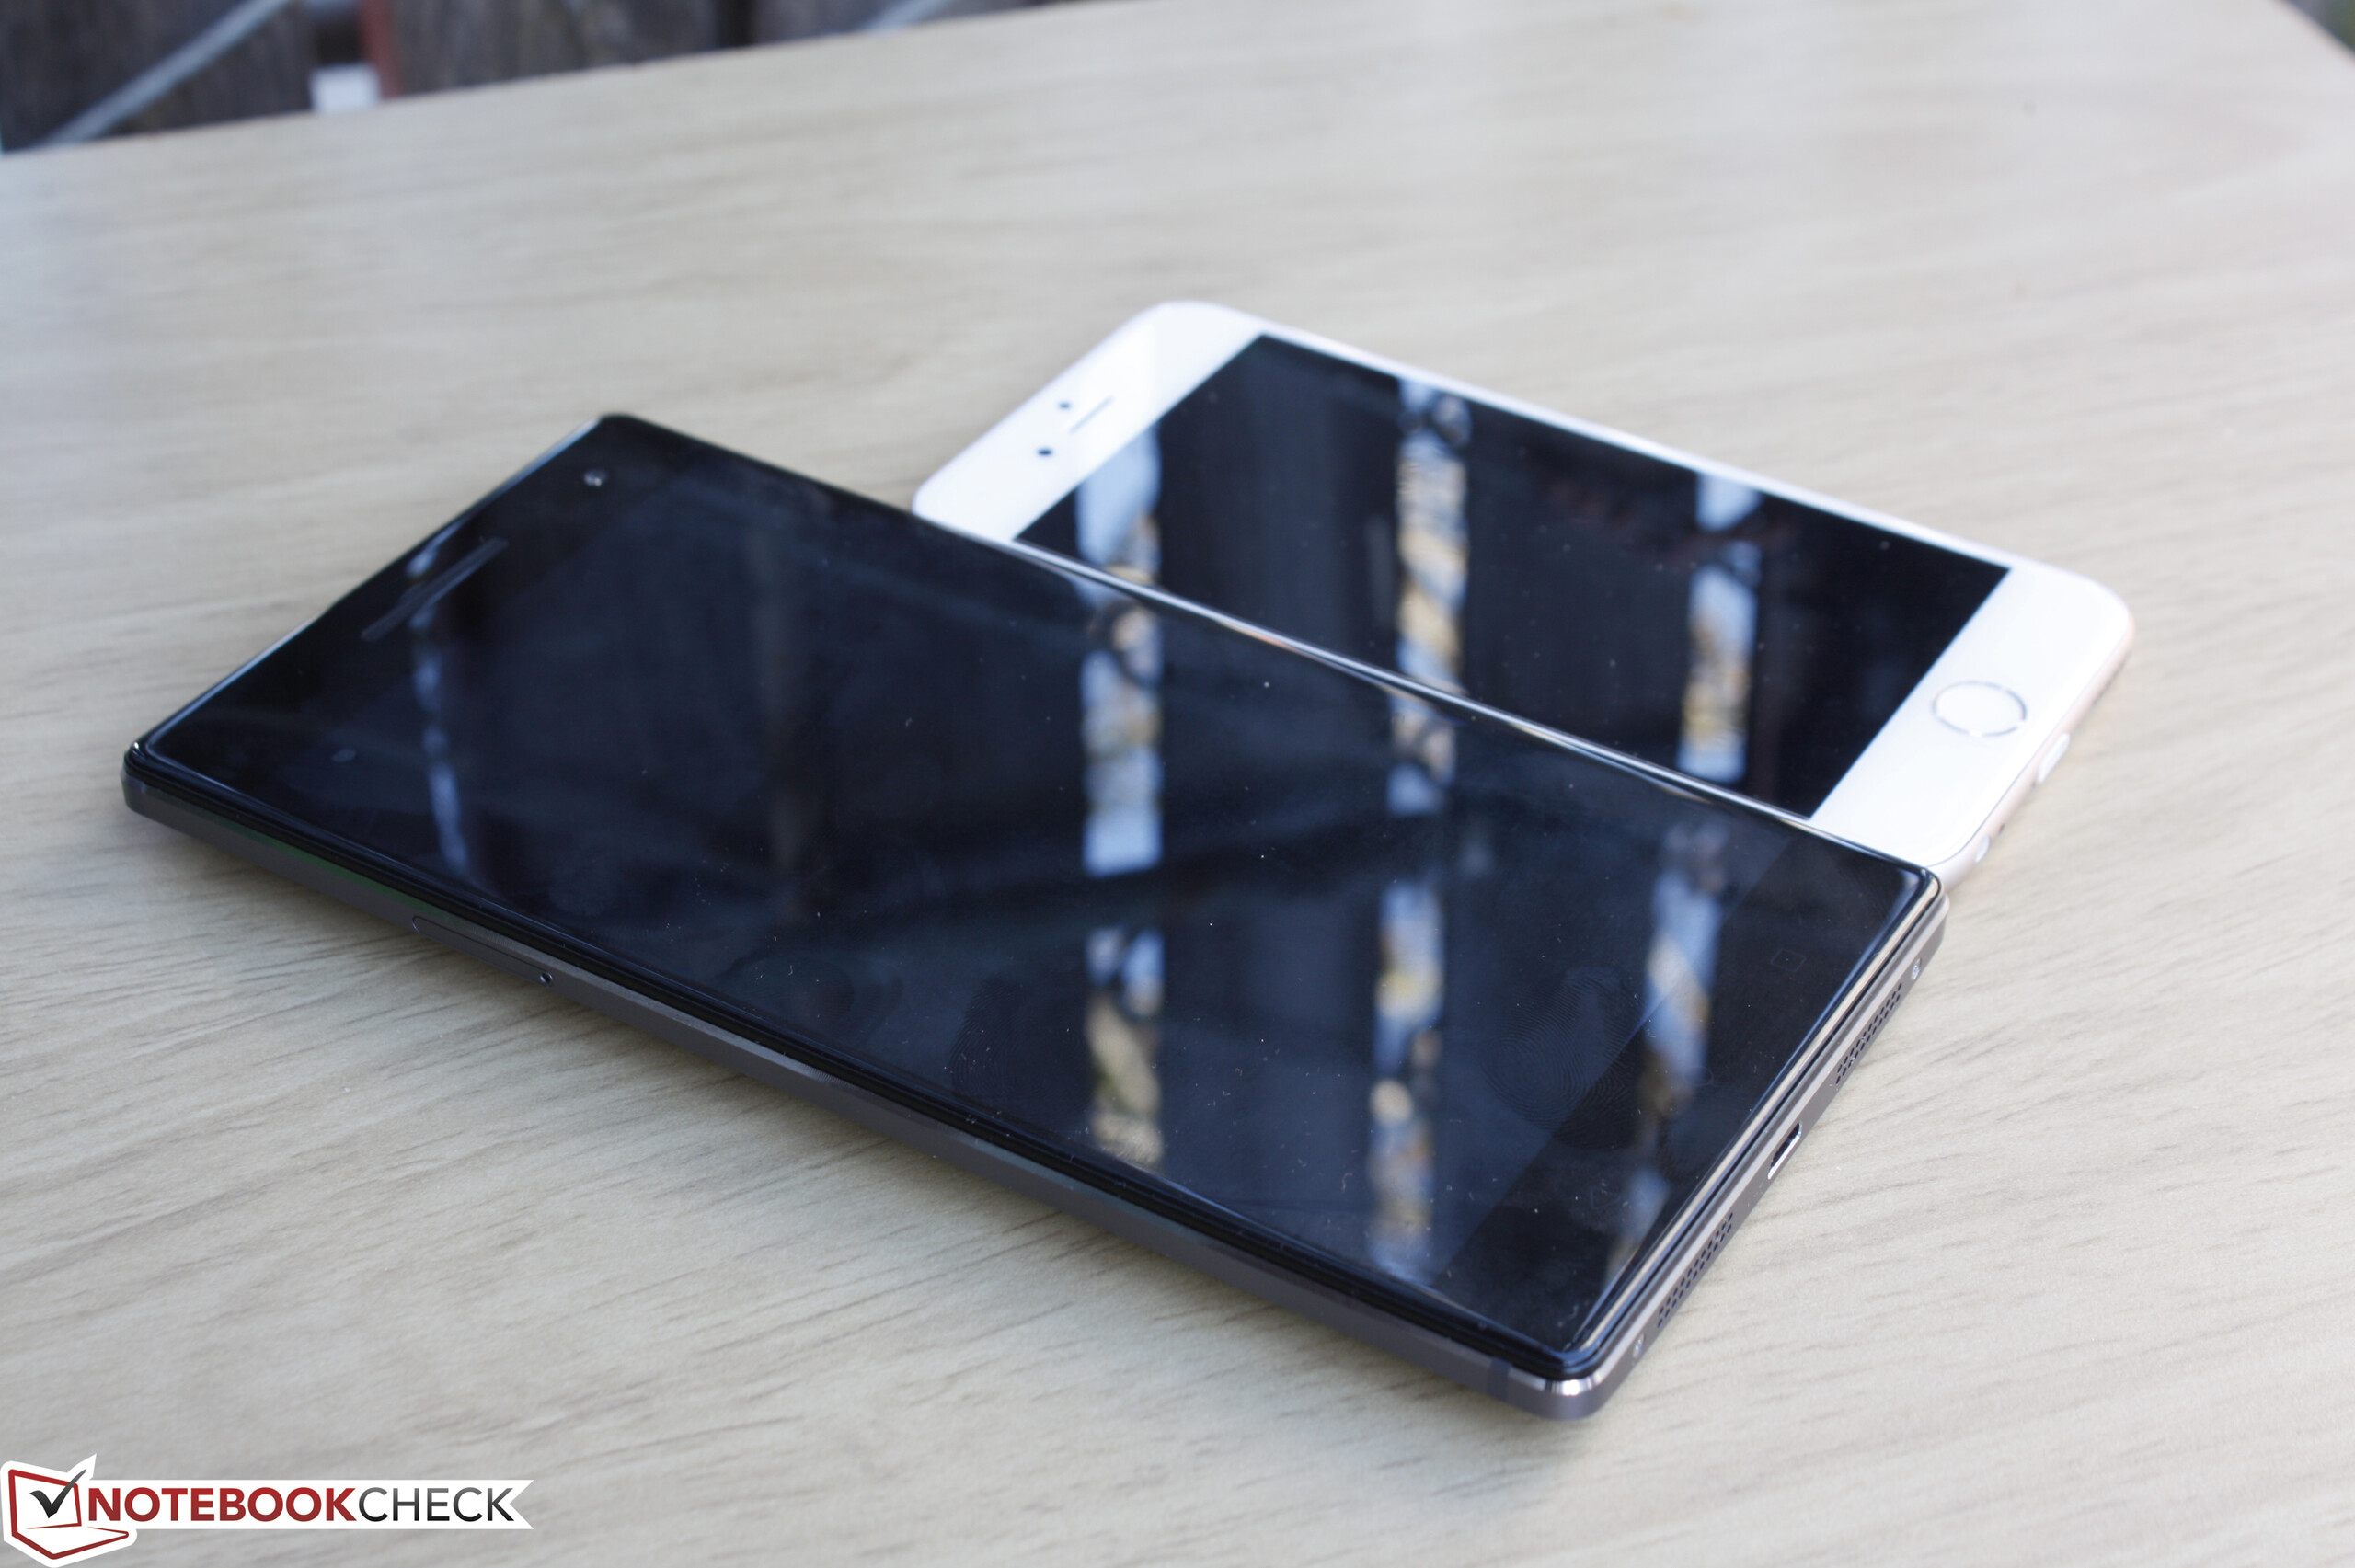
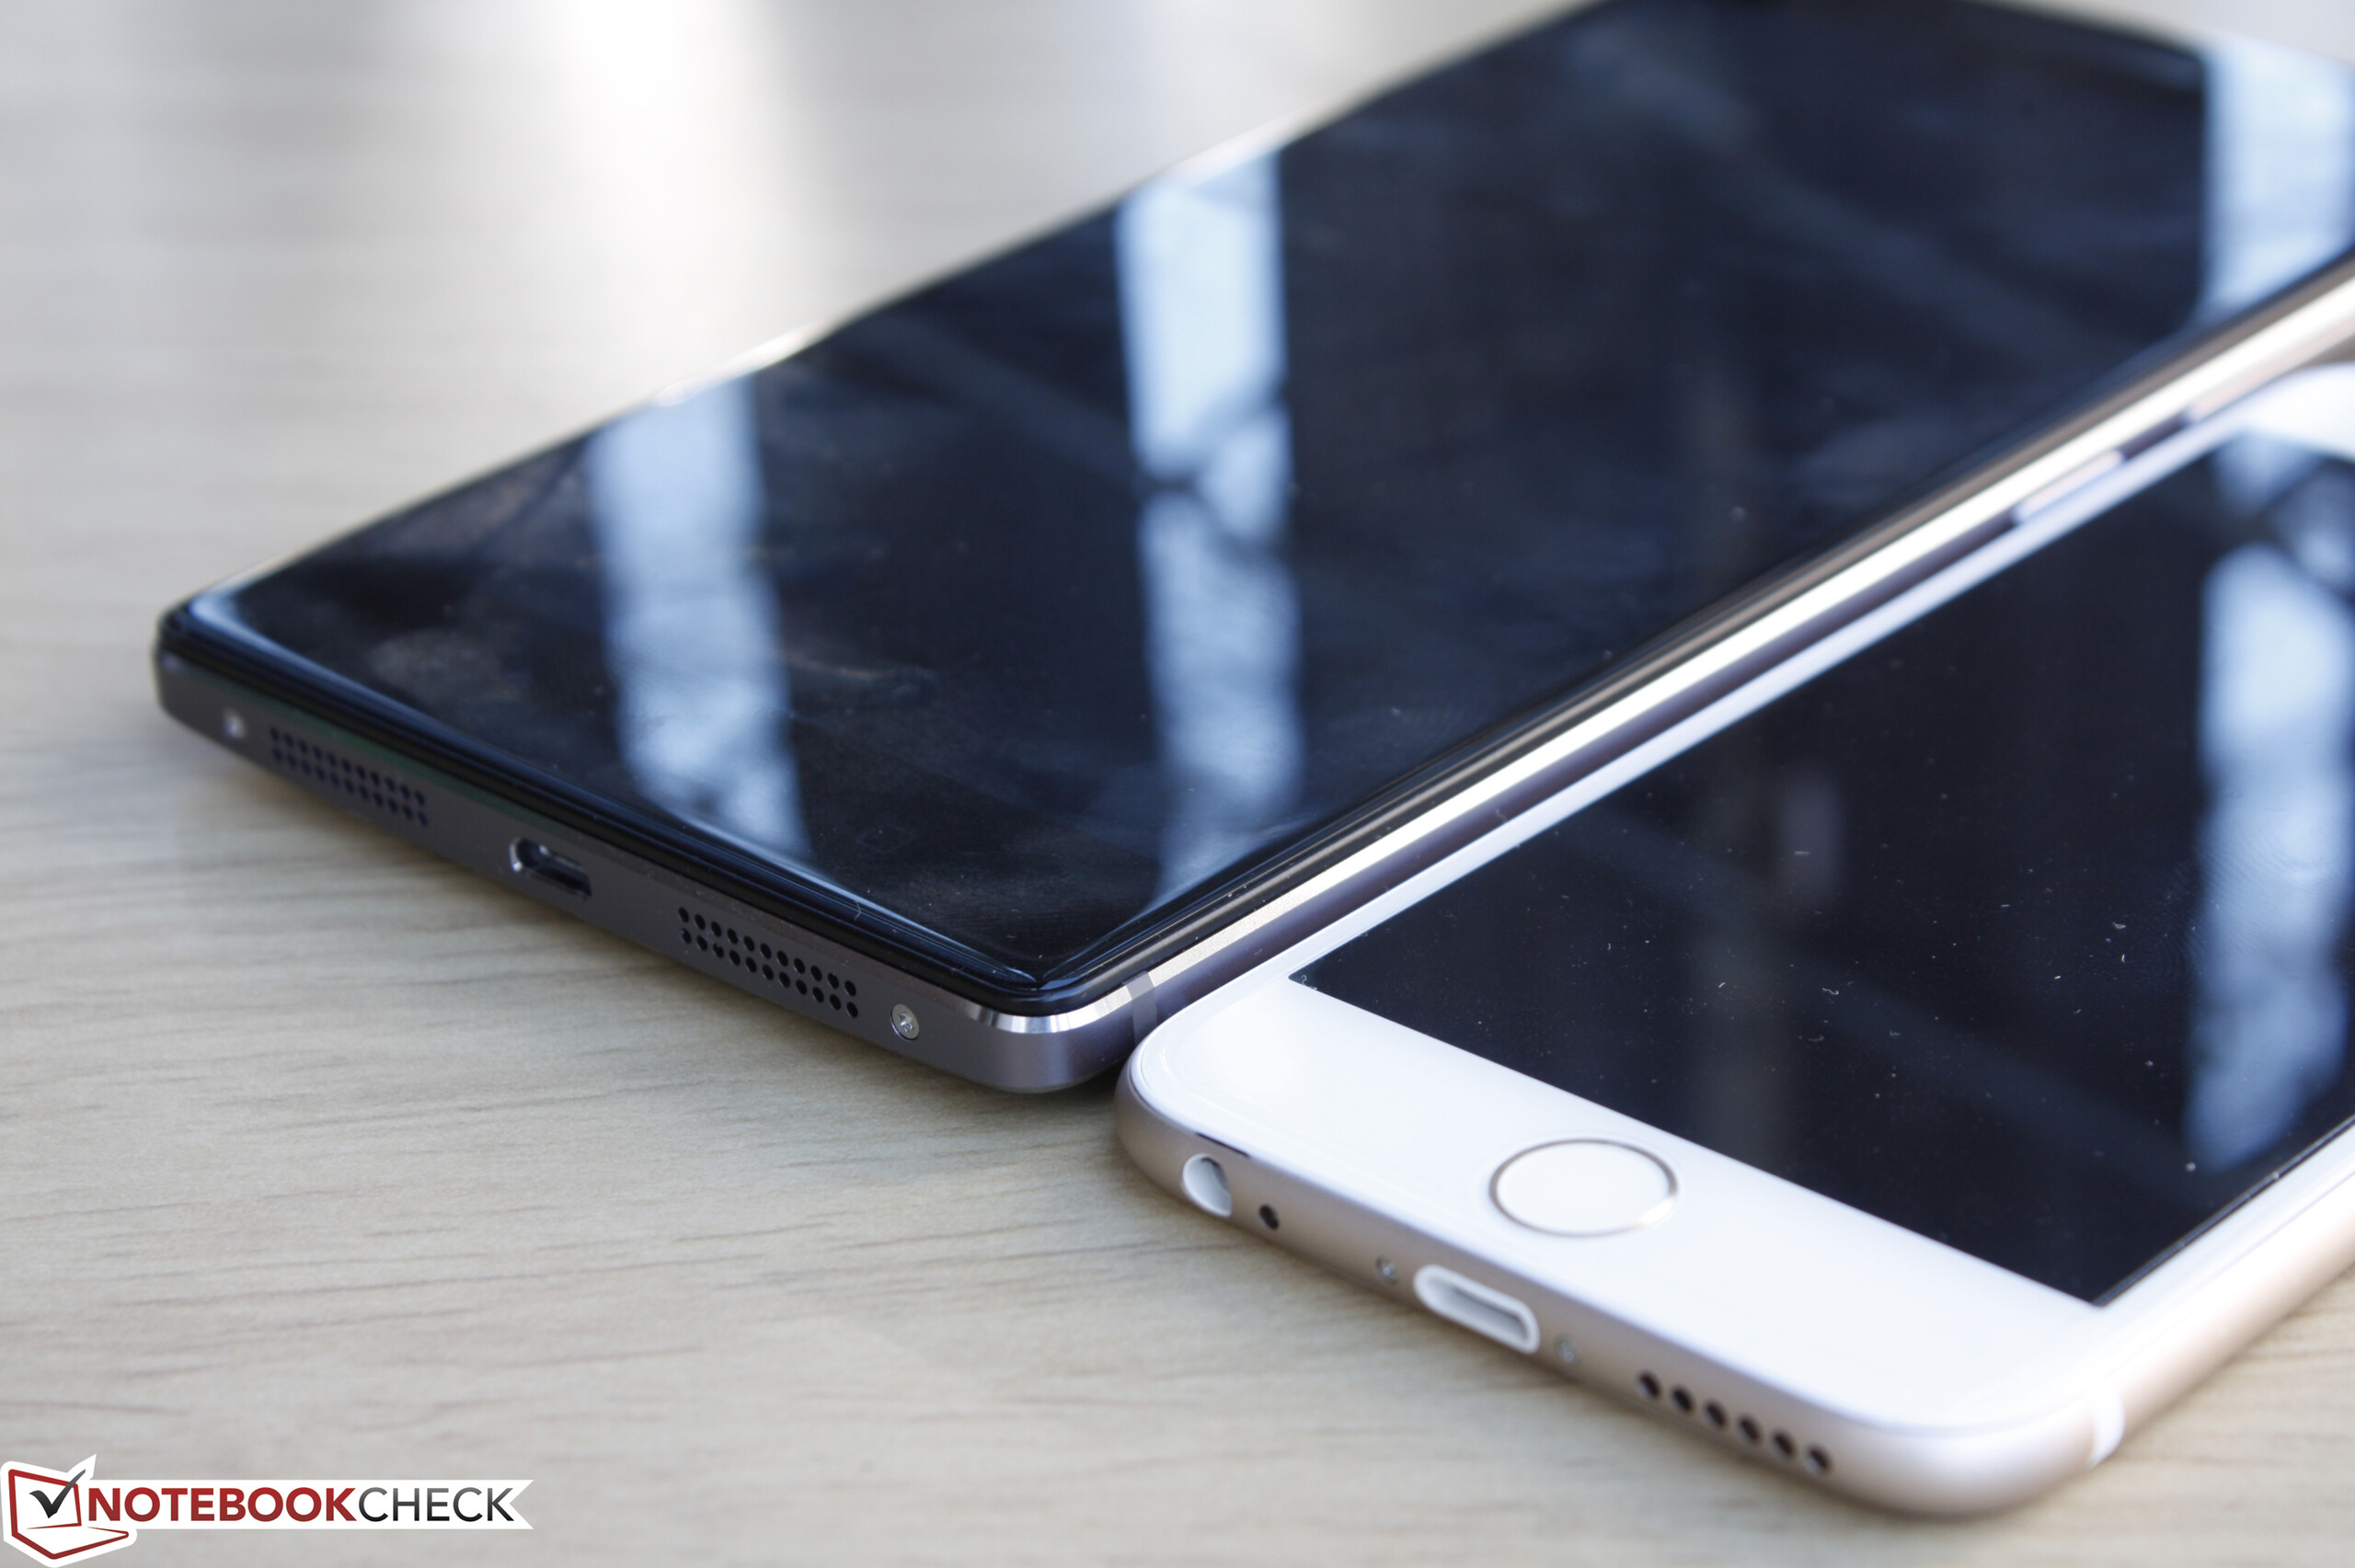
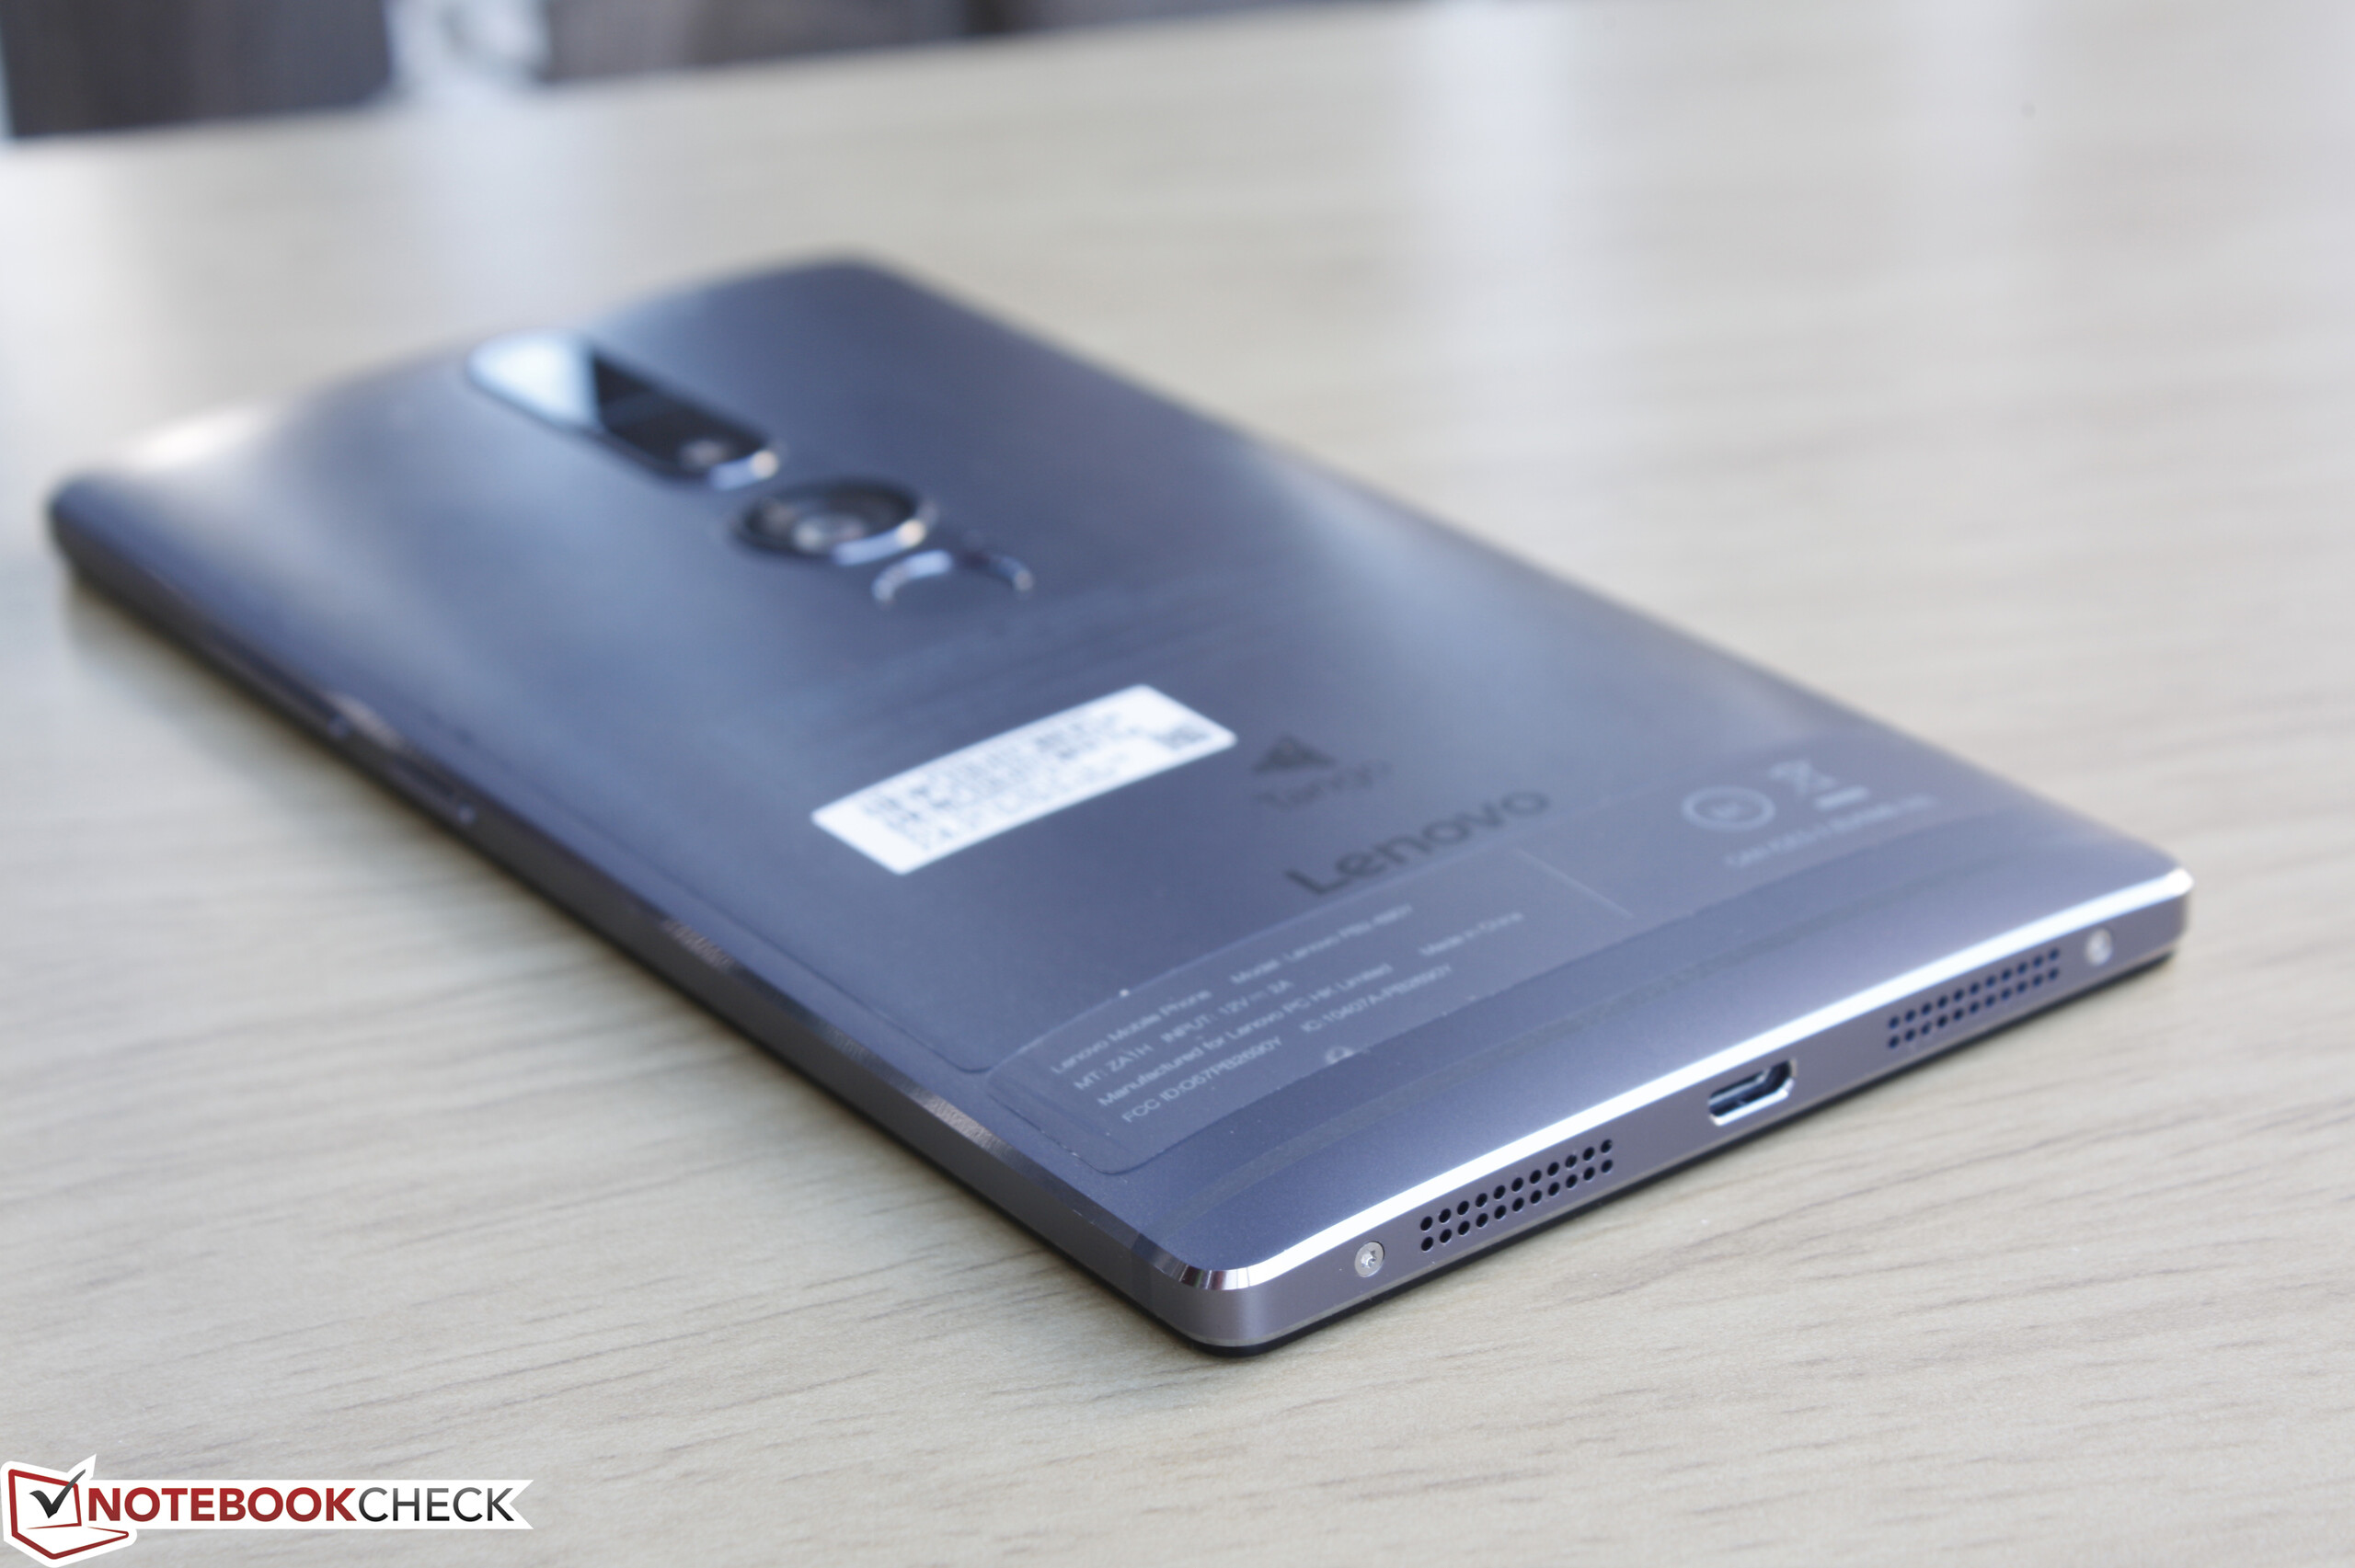
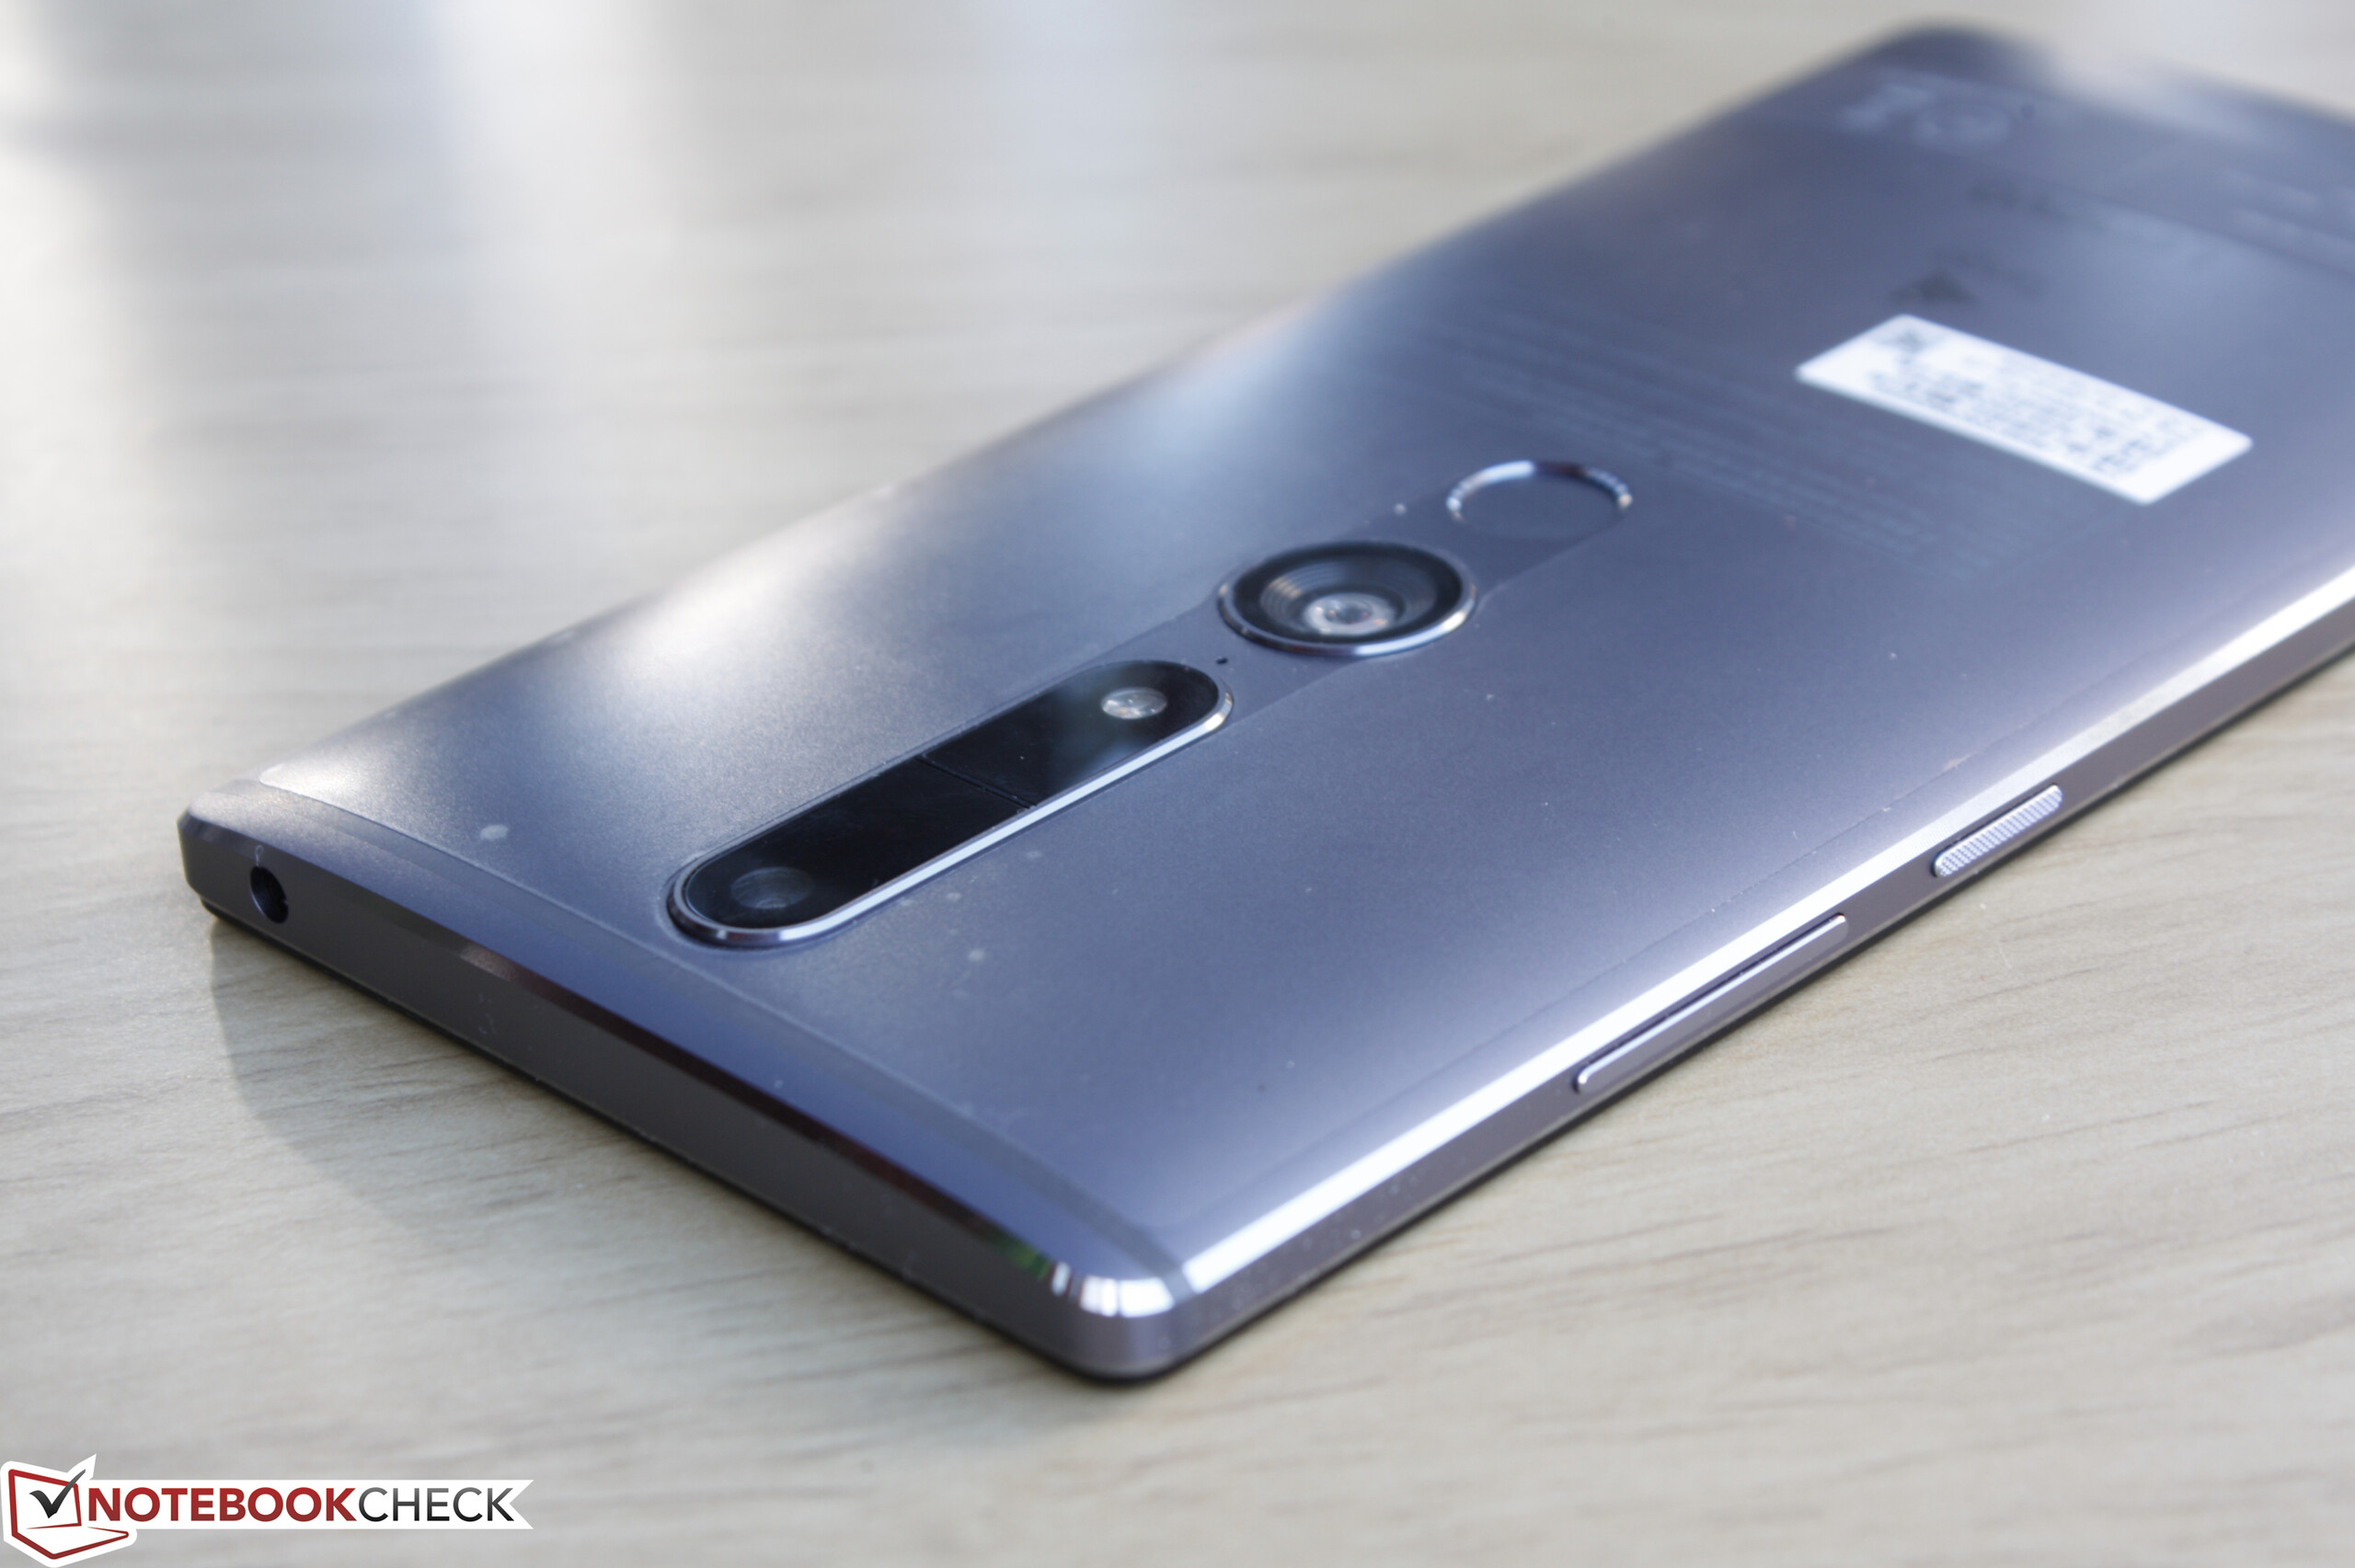
Para os usuários que não tenham interesse no Tango ou que são iniciantes nesta tecnologia, os principais recursos do smartphone do Phab 2 Pro ainda são bastante sólios. A tela é grande e nítida com suporte para 4G e MicroSD, e o seu viva voz é muito claro em comparação com concorrentes de 5-polegadas. O desempenho da CPU é veloz e o smartphone se sente denso para segurar. Suas outras especificações são apenas médias para a categoria, incluindo a GPU Adreno 510 de gama média, duração da bateria, e cores da tela e tempos de resposta. Suas grandes dimensões requerem essencialmente uma operação com as duas mãos e poderiam fazer com que os usuários desejem uma versão menor com o mesmo hardware Tango.
Como um dos primeiros smartphones oficiais da Lenovo para o mercado dos EUA, o Phab 2 Pro se destaca com o seu bom tamanho e suporte nativo para Tango. No entanto, se nada disso for atraente, os usuários ficarão com uma experiência Android respeitável (ou média).
Lenovo Phab 2 Pro
-
12/06/2016 v6(old)
Allen Ngo
Pricecompare
