 Deutsch
 English
 Español
 Français
 Italiano
 Nederlands
 Polski
 Português
 Русский
 Türkçe
 Svenska
 Chinese
 Magyar
Breve Análise do Smartphone Sony Xperia XZ
| Networking | |
| iperf Server (receive) TCP 1 m | |
| Apple iPhone 7 | |
| Sony Xperia XZ | |
| OnePlus 3 | |
| iperf Client (transmit) TCP 1 m | |
| Apple iPhone 7 | |
| OnePlus 3 | |
| Sony Xperia XZ | |


| |||||||||||||||||||||||||
iluminação: 93 %
iluminação com acumulador: 544 cd/m²
Contraste: 1470:1 (Preto: 0.37 cd/m²)
ΔE Color 5.8 | 0.5-29.43 Ø5
ΔE Greyscale 7.2 | 0.57-98 Ø5.3
100% sRGB (Calman 2D)
Gamma: 2.18
| Sony Xperia XZ IPS, 1920x1080, 5.20 | OnePlus 3 Optic-AMOLED, 1920x1080, 5.50 | Apple iPhone 7 IPS, 1334x750, 4.70 | Samsung Galaxy S7 SAMOLED, 2560x1440, 5.10 | HTC 10 Super LCD 5, 2560x1440, 5.20 | Sony Xperia Z5 Premium IPS, 3840x2160, 5.50 | |
|---|---|---|---|---|---|---|
| Screen | 2% | 30% | 24% | 12% | -25% | |
| Brightness middle | 544 | 419 -23% | 556 2% | 350 -36% | 445 -18% | 560 3% |
| Brightness | 521 | 431 -17% | 519 0% | 351 -33% | 434 -17% | 541 4% |
| Brightness Distribution | 93 | 84 -10% | 90 -3% | 98 5% | 93 0% | 85 -9% |
| Black Level * | 0.37 | 0.34 8% | 0.36 3% | 0.45 -22% | ||
| Contrast | 1470 | 1635 11% | 1236 -16% | 1244 -15% | ||
| Colorchecker dE 2000 * | 5.8 | 4.1 29% | 1.3 78% | 2.04 65% | 2.8 52% | 9.19 -58% |
| Colorchecker dE 2000 max. * | 9.8 | 12 -22% | 2.6 73% | 3.25 67% | 5.8 41% | 15.01 -53% |
| Greyscale dE 2000 * | 7.2 | 3.3 54% | 1.9 74% | 1.63 77% | 3.7 49% | 10.58 -47% |
| Gamma | 2.18 101% | 2.1 105% | 2.26 97% | 2.07 106% | 2.31 95% | 2.7 81% |
| CCT | 8619 75% | 6550 99% | 6818 95% | 6391 102% | 7164 91% | 9760 67% |
| Color Space (Percent of AdobeRGB 1998) | 89.38 | 63.15 | 86.86 | 73.19 | ||
| Color Space (Percent of sRGB) | 100 | 99.71 | 99.35 |
* ... smaller is better
Display Response Times
| ↔ Response Time Black to White | ||
|---|---|---|
| 60 ms ... rise ↗ and fall ↘ combined | ↗ 21 ms rise | 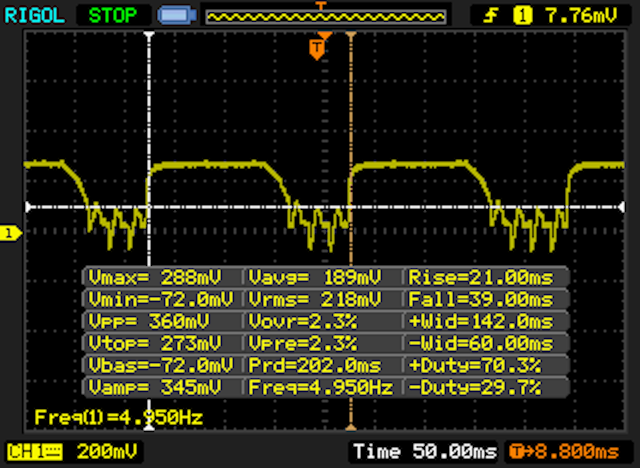 |
| ↘ 39 ms fall | ||
| The screen shows slow response rates in our tests and will be unsatisfactory for gamers. In comparison, all tested devices range from 0.1 (minimum) to 240 (maximum) ms. » 100 % of all devices are better. This means that the measured response time is worse than the average of all tested devices (21.5 ms). | ||
| ↔ Response Time 50% Grey to 80% Grey | ||
| 52 ms ... rise ↗ and fall ↘ combined | ↗ 22 ms rise | 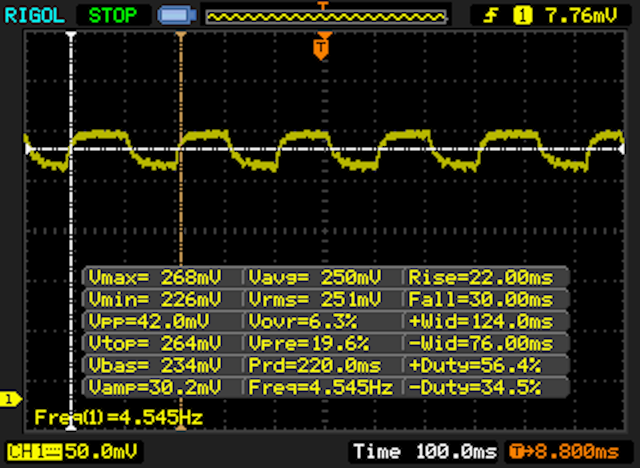 |
| ↘ 30 ms fall | ||
| The screen shows slow response rates in our tests and will be unsatisfactory for gamers. In comparison, all tested devices range from 0.2 (minimum) to 636 (maximum) ms. » 87 % of all devices are better. This means that the measured response time is worse than the average of all tested devices (33.8 ms). | ||
Screen Flickering / PWM (Pulse-Width Modulation)
| Screen flickering / PWM not detected | 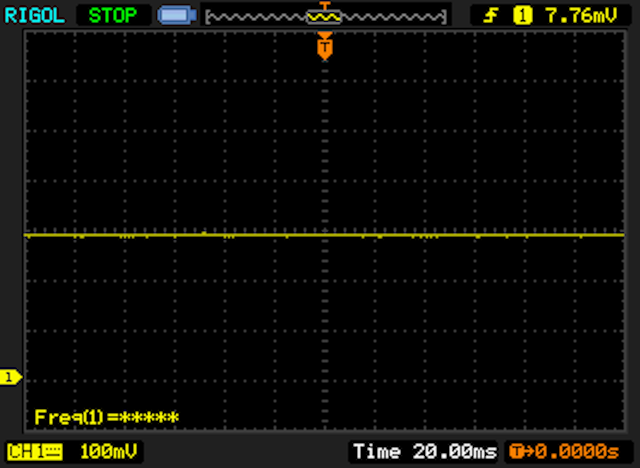 | ||
In comparison: 53 % of all tested devices do not use PWM to dim the display. If PWM was detected, an average of 17933 (minimum: 5 - maximum: 3846000) Hz was measured. | |||
| AnTuTu v6 - Total Score (sort by value) | |
| Sony Xperia XZ | |
| OnePlus 3 | |
| Apple iPhone 7 | |
| Samsung Galaxy S7 | |
| HTC 10 | |
| Sony Xperia Z5 Premium | |
| 3DMark | |
| 1280x720 offscreen Ice Storm Unlimited Score (sort by value) | |
| Sony Xperia XZ | |
| OnePlus 3 | |
| Apple iPhone 7 | |
| Samsung Galaxy S7 | |
| HTC 10 | |
| Sony Xperia Z5 Premium | |
| 1280x720 offscreen Ice Storm Unlimited Graphics Score (sort by value) | |
| Sony Xperia XZ | |
| OnePlus 3 | |
| Apple iPhone 7 | |
| Samsung Galaxy S7 | |
| HTC 10 | |
| Sony Xperia Z5 Premium | |
| 1280x720 offscreen Ice Storm Unlimited Physics (sort by value) | |
| Sony Xperia XZ | |
| OnePlus 3 | |
| Apple iPhone 7 | |
| Samsung Galaxy S7 | |
| HTC 10 | |
| Sony Xperia Z5 Premium | |
| 2560x1440 Sling Shot OpenGL ES 3.0 (sort by value) | |
| Sony Xperia XZ | |
| OnePlus 3 | |
| Apple iPhone 7 | |
| Samsung Galaxy S7 | |
| HTC 10 | |
| Sony Xperia Z5 Premium | |
| 2560x1440 Sling Shot OpenGL ES 3.0 Graphics (sort by value) | |
| Sony Xperia XZ | |
| OnePlus 3 | |
| Apple iPhone 7 | |
| Samsung Galaxy S7 | |
| HTC 10 | |
| Sony Xperia Z5 Premium | |
| 2560x1440 Sling Shot OpenGL ES 3.0 Physics (sort by value) | |
| Sony Xperia XZ | |
| OnePlus 3 | |
| Apple iPhone 7 | |
| Samsung Galaxy S7 | |
| HTC 10 | |
| Sony Xperia Z5 Premium | |
| GFXBench (DX / GLBenchmark) 2.7 | |
| T-Rex Onscreen (sort by value) | |
| Sony Xperia XZ | |
| OnePlus 3 | |
| Apple iPhone 7 | |
| Samsung Galaxy S7 | |
| HTC 10 | |
| Sony Xperia Z5 Premium | |
| 1920x1080 T-Rex Offscreen (sort by value) | |
| Sony Xperia XZ | |
| OnePlus 3 | |
| Apple iPhone 7 | |
| Samsung Galaxy S7 | |
| HTC 10 | |
| Sony Xperia Z5 Premium | |
| GFXBench 3.0 | |
| on screen Manhattan Onscreen OGL (sort by value) | |
| Sony Xperia XZ | |
| OnePlus 3 | |
| Apple iPhone 7 | |
| Samsung Galaxy S7 | |
| HTC 10 | |
| Sony Xperia Z5 Premium | |
| 1920x1080 1080p Manhattan Offscreen (sort by value) | |
| Sony Xperia XZ | |
| OnePlus 3 | |
| Apple iPhone 7 | |
| Samsung Galaxy S7 | |
| HTC 10 | |
| Sony Xperia Z5 Premium | |
| GFXBench 3.1 | |
| on screen Manhattan ES 3.1 Onscreen (sort by value) | |
| Sony Xperia XZ | |
| OnePlus 3 | |
| Apple iPhone 7 | |
| Samsung Galaxy S7 | |
| HTC 10 | |
| Sony Xperia Z5 Premium | |
| 1920x1080 Manhattan ES 3.1 Offscreen (sort by value) | |
| Sony Xperia XZ | |
| OnePlus 3 | |
| Apple iPhone 7 | |
| Samsung Galaxy S7 | |
| HTC 10 | |
| Sony Xperia Z5 Premium | |
| PCMark for Android - Work performance score (sort by value) | |
| Sony Xperia XZ | |
| OnePlus 3 | |
| Samsung Galaxy S7 | |
| HTC 10 | |
| Sony Xperia Z5 Premium | |
| Geekbench 4.0 | |
| 64 Bit Single-Core Score (sort by value) | |
| Sony Xperia XZ | |
| OnePlus 3 | |
| Apple iPhone 7 | |
| 64 Bit Multi-Core Score (sort by value) | |
| Sony Xperia XZ | |
| OnePlus 3 | |
| Apple iPhone 7 | |
| Compute RenderScript Score (sort by value) | |
| Sony Xperia XZ | |
| OnePlus 3 | |
| AndroBench 3-5 | |
| Sequential Read 256KB (sort by value) | |
| Sony Xperia XZ | |
| OnePlus 3 | |
| Samsung Galaxy S7 | |
| HTC 10 | |
| Sony Xperia Z5 Premium | |
| Sequential Write 256KB (sort by value) | |
| Sony Xperia XZ | |
| OnePlus 3 | |
| Samsung Galaxy S7 | |
| HTC 10 | |
| Sony Xperia Z5 Premium | |
| Random Read 4KB (sort by value) | |
| Sony Xperia XZ | |
| OnePlus 3 | |
| Samsung Galaxy S7 | |
| HTC 10 | |
| Sony Xperia Z5 Premium | |
| Random Write 4KB (sort by value) | |
| Sony Xperia XZ | |
| OnePlus 3 | |
| Samsung Galaxy S7 | |
| HTC 10 | |
| Sony Xperia Z5 Premium | |
| Sequential Read 256KB SDCard (sort by value) | |
| Sony Xperia XZ | |
| Samsung Galaxy S7 | |
| HTC 10 | |
| Sequential Write 256KB SDCard (sort by value) | |
| Sony Xperia XZ | |
| Samsung Galaxy S7 | |
| HTC 10 | |
| Mozilla Kraken 1.1 - Total (sort by value) | |
| Sony Xperia XZ | |
| OnePlus 3 | |
| Apple iPhone 7 | |
| Samsung Galaxy S7 | |
| HTC 10 | |
| Sony Xperia Z5 Premium | |
| Octane V2 - Total Score (sort by value) | |
| Sony Xperia XZ | |
| OnePlus 3 | |
| Apple iPhone 7 | |
| Samsung Galaxy S7 | |
| HTC 10 | |
| Sony Xperia Z5 Premium | |
| WebXPRT 2015 - Overall (sort by value) | |
| Sony Xperia XZ | |
| OnePlus 3 | |
| Apple iPhone 7 | |
| Samsung Galaxy S7 | |
| HTC 10 | |
| Sony Xperia Z5 Premium | |
| JetStream 1.1 - Total Score (sort by value) | |
| Sony Xperia XZ | |
| OnePlus 3 | |
| Apple iPhone 7 | |
| Samsung Galaxy S7 | |
| HTC 10 | |
| Sony Xperia Z5 Premium | |
* ... smaller is better
| Asphalt 8: Airborne | |||
| Configurações | Valor | ||
| high | 30 fps | ||
| very low | 30 fps | ||
| Dead Trigger 2 | |||
| Configurações | Valor | ||
| high | 30 fps | ||
(+) The maximum temperature on the upper side is 38.5 °C / 101 F, compared to the average of 35 °C / 95 F, ranging from 21.9 to 56 °C for the class Smartphone.
(+) The bottom heats up to a maximum of 39.7 °C / 103 F, compared to the average of 33.8 °C / 93 F
(±) In idle usage, the average temperature for the upper side is 33.8 °C / 93 F, compared to the device average of 32.7 °C / 91 F.
Sony Xperia XZ audio analysis
(±) | speaker loudness is average but good (77 dB)
Bass 100 - 315 Hz
(-) | nearly no bass - on average 21.3% lower than median
(-) | bass is not linear (21.2% delta to prev. frequency)
Mids 400 - 2000 Hz
(±) | higher mids - on average 6.5% higher than median
(±) | linearity of mids is average (7.7% delta to prev. frequency)
Highs 2 - 16 kHz
(±) | higher highs - on average 5.8% higher than median
(±) | linearity of highs is average (8.7% delta to prev. frequency)
Overall 100 - 16.000 Hz
(±) | linearity of overall sound is average (26.6% difference to median)
Compared to same class
» 63% of all tested devices in this class were better, 6% similar, 31% worse
» The best had a delta of 12%, average was 38%, worst was 134%
Compared to all devices tested
» 79% of all tested devices were better, 4% similar, 17% worse
» The best had a delta of 4%, average was 25%, worst was 134%
Apple iPhone 7 audio analysis
(+) | speakers can play relatively loud (83.1 dB)
Bass 100 - 315 Hz
(-) | nearly no bass - on average 21.8% lower than median
(±) | linearity of bass is average (9.5% delta to prev. frequency)
Mids 400 - 2000 Hz
(+) | balanced mids - only 4.3% away from median
(+) | mids are linear (6% delta to prev. frequency)
Highs 2 - 16 kHz
(±) | higher highs - on average 5.9% higher than median
(±) | linearity of highs is average (8.2% delta to prev. frequency)
Overall 100 - 16.000 Hz
(±) | linearity of overall sound is average (20.9% difference to median)
Compared to same class
» 32% of all tested devices in this class were better, 8% similar, 60% worse
» The best had a delta of 12%, average was 38%, worst was 134%
Compared to all devices tested
» 52% of all tested devices were better, 8% similar, 41% worse
» The best had a delta of 4%, average was 25%, worst was 134%
Samsung Galaxy S7 audio analysis
(+) | speakers can play relatively loud (87.4 dB)
Bass 100 - 315 Hz
(-) | nearly no bass - on average 25.2% lower than median
(±) | linearity of bass is average (9.2% delta to prev. frequency)
Mids 400 - 2000 Hz
(+) | balanced mids - only 4.1% away from median
(+) | mids are linear (5% delta to prev. frequency)
Highs 2 - 16 kHz
(±) | higher highs - on average 6.6% higher than median
(+) | highs are linear (6.3% delta to prev. frequency)
Overall 100 - 16.000 Hz
(±) | linearity of overall sound is average (20.9% difference to median)
Compared to same class
» 32% of all tested devices in this class were better, 8% similar, 60% worse
» The best had a delta of 12%, average was 38%, worst was 134%
Compared to all devices tested
» 52% of all tested devices were better, 8% similar, 41% worse
» The best had a delta of 4%, average was 25%, worst was 134%
OnePlus 3 audio analysis
(+) | speakers can play relatively loud (88.6 dB)
Bass 100 - 315 Hz
(-) | nearly no bass - on average 30.9% lower than median
(±) | linearity of bass is average (11.3% delta to prev. frequency)
Mids 400 - 2000 Hz
(+) | balanced mids - only 4.2% away from median
(+) | mids are linear (4.9% delta to prev. frequency)
Highs 2 - 16 kHz
(±) | higher highs - on average 5.6% higher than median
(+) | highs are linear (3.2% delta to prev. frequency)
Overall 100 - 16.000 Hz
(±) | linearity of overall sound is average (21.8% difference to median)
Compared to same class
» 37% of all tested devices in this class were better, 8% similar, 55% worse
» The best had a delta of 12%, average was 38%, worst was 134%
Compared to all devices tested
» 57% of all tested devices were better, 7% similar, 36% worse
» The best had a delta of 4%, average was 25%, worst was 134%
HTC 10 audio analysis
(+) | speakers can play relatively loud (83.1 dB)
Bass 100 - 315 Hz
(-) | nearly no bass - on average 20.4% lower than median
(±) | linearity of bass is average (12.9% delta to prev. frequency)
Mids 400 - 2000 Hz
(±) | higher mids - on average 7.3% higher than median
(±) | linearity of mids is average (8.9% delta to prev. frequency)
Highs 2 - 16 kHz
(±) | higher highs - on average 10.3% higher than median
(+) | highs are linear (6% delta to prev. frequency)
Overall 100 - 16.000 Hz
(±) | linearity of overall sound is average (27.4% difference to median)
Compared to same class
» 66% of all tested devices in this class were better, 6% similar, 28% worse
» The best had a delta of 12%, average was 38%, worst was 134%
Compared to all devices tested
» 81% of all tested devices were better, 4% similar, 15% worse
» The best had a delta of 4%, average was 25%, worst was 134%
LG G5 audio analysis
(+) | speakers can play relatively loud (86.4 dB)
Bass 100 - 315 Hz
(-) | nearly no bass - on average 28.3% lower than median
(±) | linearity of bass is average (12.5% delta to prev. frequency)
Mids 400 - 2000 Hz
(+) | balanced mids - only 3.6% away from median
(+) | mids are linear (4.3% delta to prev. frequency)
Highs 2 - 16 kHz
(+) | balanced highs - only 3.8% away from median
(+) | highs are linear (1.9% delta to prev. frequency)
Overall 100 - 16.000 Hz
(±) | linearity of overall sound is average (18.8% difference to median)
Compared to same class
» 16% of all tested devices in this class were better, 9% similar, 75% worse
» The best had a delta of 12%, average was 38%, worst was 134%
Compared to all devices tested
» 38% of all tested devices were better, 8% similar, 54% worse
» The best had a delta of 4%, average was 25%, worst was 134%
| desligado | |
| Ocioso | |
| Carga |
|
| Sony Xperia XZ 2900 mAh | OnePlus 3 3000 mAh | Apple iPhone 7 1960 mAh | Samsung Galaxy S7 3000 mAh | HTC 10 3000 mAh | Sony Xperia Z5 Premium 3430 mAh | |
|---|---|---|---|---|---|---|
| Power Consumption | 41% | 56% | 52% | 33% | 25% | |
| Idle Minimum * | 1.76 | 0.57 68% | 0.54 69% | 0.68 61% | 0.68 61% | 0.83 53% |
| Idle Average * | 3.6 | 1.24 66% | 1.51 58% | 1.02 72% | 1.49 59% | 2.36 34% |
| Idle Maximum * | 4.06 | 1.36 67% | 1.54 62% | 1.14 72% | 1.91 53% | 2.42 40% |
| Load Average * | 7 | 5.92 15% | 3.75 46% | 4.73 32% | 7.4 -6% | 7.27 -4% |
| Load Maximum * | 9.52 | 10.53 -11% | 5.01 47% | 7.16 25% | 9.71 -2% | 9.18 4% |
* ... smaller is better
| Sony Xperia XZ 2900 mAh | OnePlus 3 3000 mAh | Apple iPhone 7 1960 mAh | Samsung Galaxy S7 3000 mAh | HTC 10 3000 mAh | Sony Xperia Z5 Premium 3430 mAh | |
|---|---|---|---|---|---|---|
| Battery Runtime | 56% | 22% | 43% | 11% | -2% | |
| Reader / Idle | 1125 | 1338 19% | 1770 57% | 1810 61% | 1273 13% | 1277 14% |
| H.264 | 502 | 847 69% | 722 44% | 892 78% | 648 29% | 411 -18% |
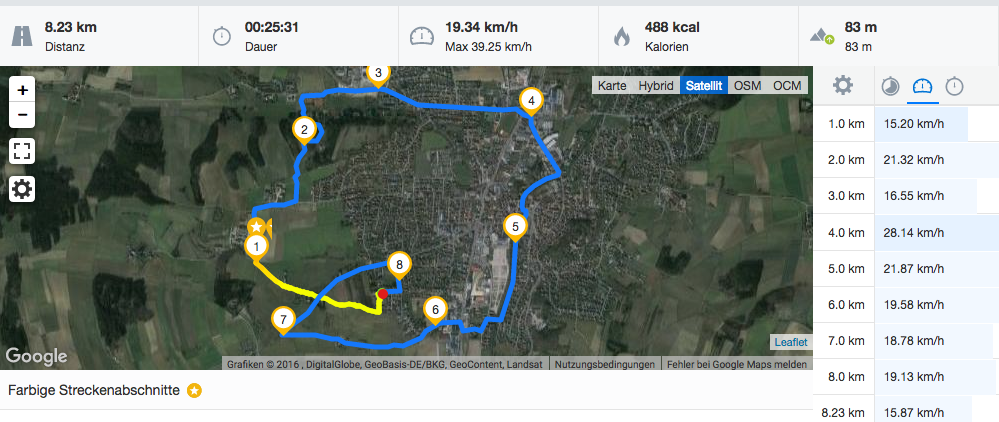
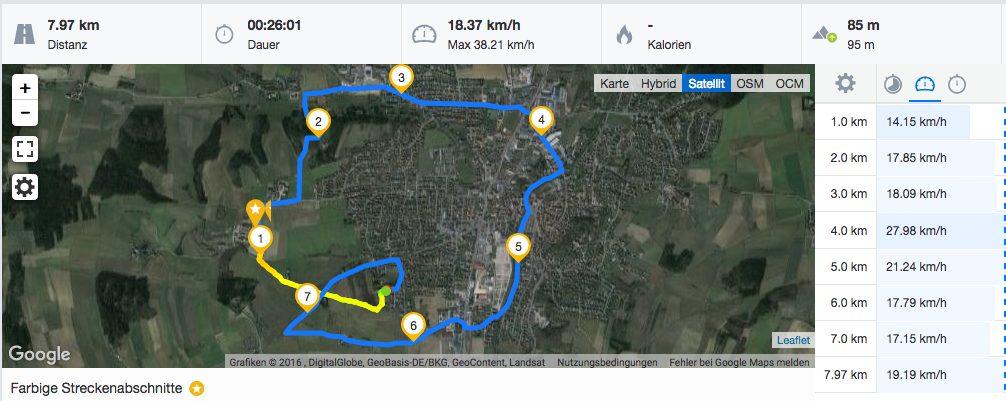
| WiFi v1.3 | 438 | 840 92% | 517 18% | 456 4% | 413 -6% | 372 -15% |
| Load | 187 | 268 43% | 126 -33% | 242 29% | 203 9% | 210 12% |
Pro
Contra
O visionário, o Xperia XZ, tristemente não é suficientemente poderoso para iniciar uma revolução. De muitas maneiras, este modelo de teste é muito conservador e não se arrisca. Nós pudemos classificá-lo como confiável mais do que "revolucionário".
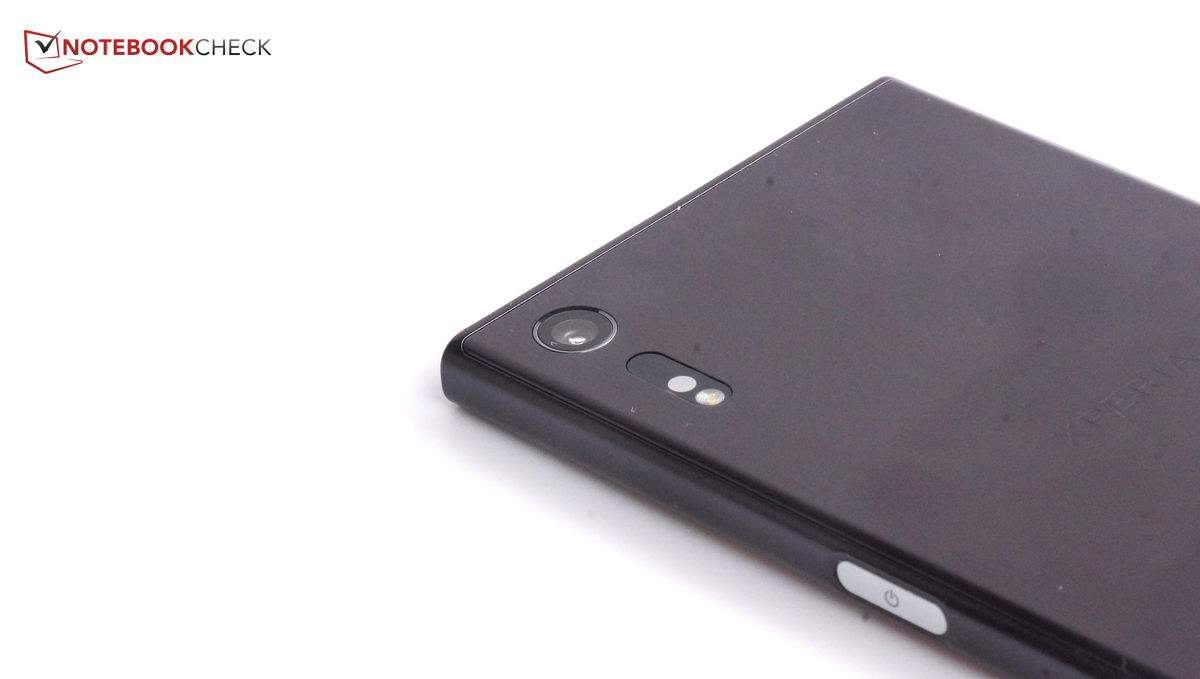
A câmera é um destaque especial da campanha de marketing: ele oferece muitos recursos bons, mas é definitivamente médio quando comparado com a concorrência. Além disso, o aparelho não possui um estabilizador de imagem, o qual ajudaria a melhorar a qualidade das imagens em condições de baixa iluminação. O Xperia XZ pode tirar fotos médias, assim como a maior parte da concorrência.
Em termos de duração da bateria, precisão de cores da tela, as velocidades do módulo WLAN e o consumo de energia, o Xperia XZ deixa a desejar. Esperaríamos mais de um smartphone com um preço de 700 Euros (~$ 763). As baixas velocidades da memória são especialmente agraviantes, dado que elas aumentam notoriamente os tempos de carga dos jogos.
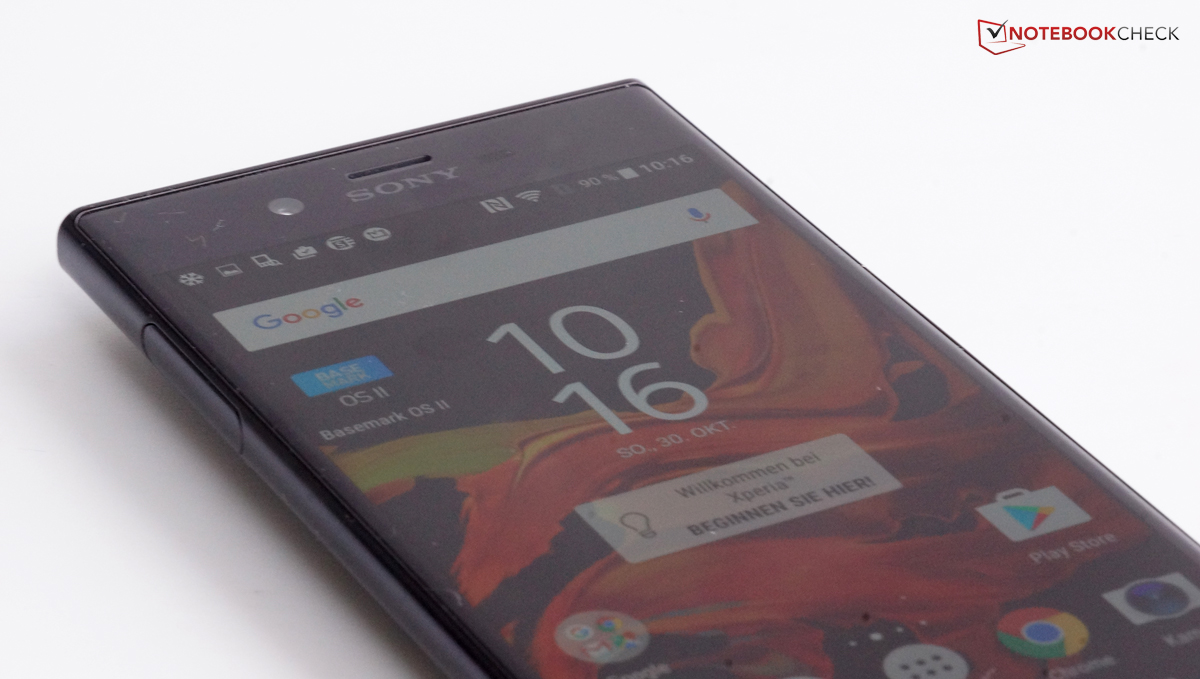
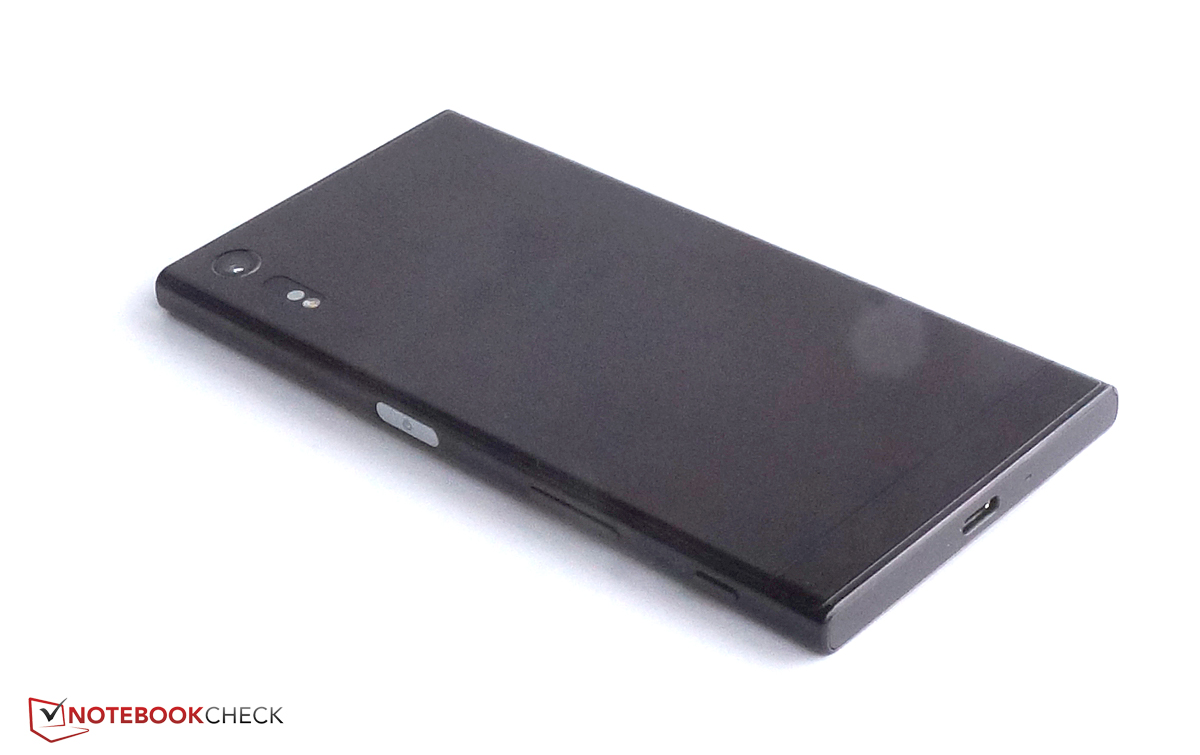
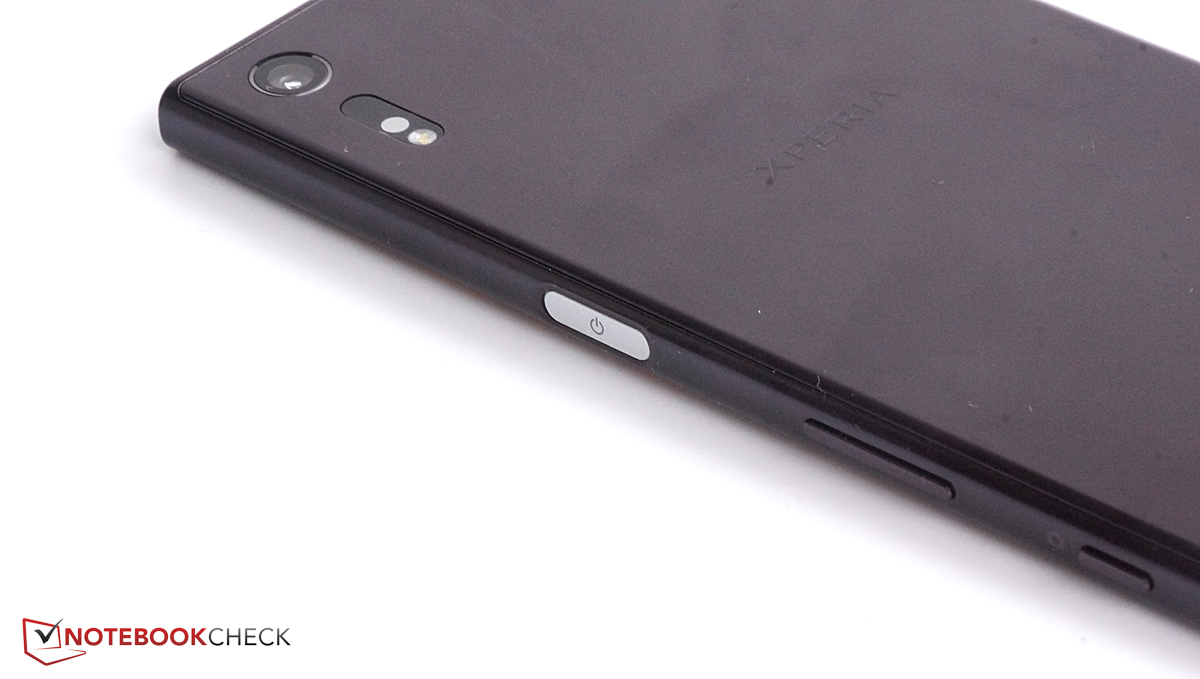
A Sony fez muitas coisa bem: o software tem muitas configurações úteis para novos usuários e as ferramente fornecidas podem inclusive melhorar o som e as cores das tela. O design elegante do telefone definitivamente é um ponto positivo. Os alto falantes e as temperaturas da superfície também sçao muito bons. Nós apreciamos especialmente as ofertas so aplicativo de lealdade do cliente, o Xperia Lounge.
No final, o Xperia XZ é definitivamente médio em muitos departamentos. Como tal, ele não pode ser um smartphone de gama alta destacado. A Sony não inova muito mas criou um bom smartphone.
Sabemos que a Sony é capaz de revolucionalizar o mercado de smartphones: o Xperia Z5 Premium e outros modelos de gama alta compactos são a prova de sua criatividade. No entanto, o Xperia XZ não desafia os padrões estabelecidos pelos smartphones. Apesar de ser uma aparelho confiável de gama alta, seus recursos podem não valer 700 Euros (~$763), dado que há muitos concorrentes, como o OnePlus 3, o Galaxy S7 ou o iPhone 7, que se desempenham muito melhor.
Sony Xperia XZ
-
11/02/2016 v5.1(old)
Florian Wimmer