 Deutsch
 English
 Español
 Français
 Italiano
 Nederlands
 Polski
 Português
 Русский
 Türkçe
 Svenska
 Chinese
 Magyar
Breve Análise do Subportátil HP EliteBook 1030 G1
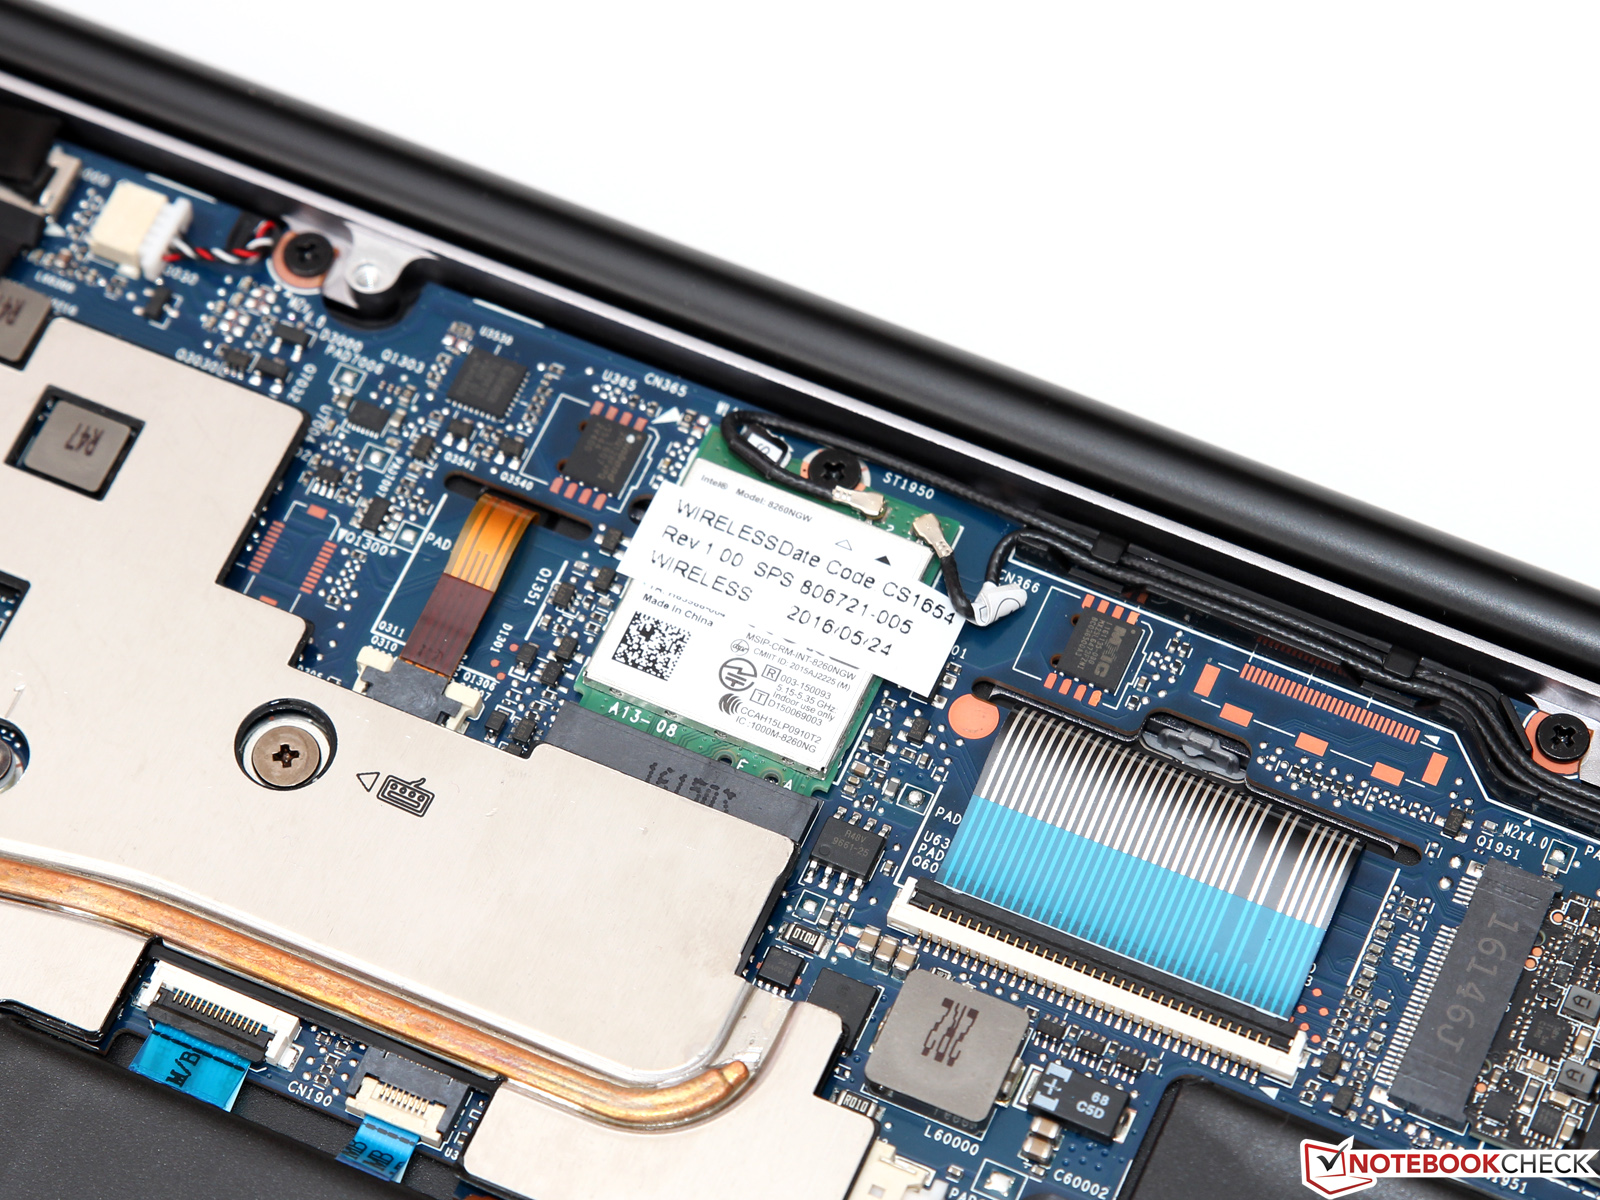
| Networking | |
| iperf Server (receive) TCP 1 m | |
| Apple MacBook 12 (Early 2016) 1.1 GHz | |
| iperf Client (transmit) TCP 1 m | |
| Apple MacBook 12 (Early 2016) 1.1 GHz | |
| |||||||||||||||||||||||||
iluminação: 85 %
iluminação com acumulador: 399 cd/m²
Contraste: 1146:1 (Preto: 0.35 cd/m²)
ΔE Color 3.5 | 0.5-29.43 Ø5
ΔE Greyscale 4.13 | 0.57-98 Ø5.3
94.64% sRGB (Argyll 1.6.3 3D)
61.56% AdobeRGB 1998 (Argyll 1.6.3 3D)
69% AdobeRGB 1998 (Argyll 2.2.0 3D)
94.7% sRGB (Argyll 2.2.0 3D)
67.6% Display P3 (Argyll 2.2.0 3D)
Gamma: 2.28
Screen Flickering / PWM (Pulse-Width Modulation)
| Screen flickering / PWM not detected | ||
In comparison: 53 % of all tested devices do not use PWM to dim the display. If PWM was detected, an average of 17900 (minimum: 5 - maximum: 3846000) Hz was measured. | ||
| HP EliteBook 1030 G1-X2F03EA Sharp SHP1465, IPS, 3200x1800, 13.30 | Dell Latitude 13 7370 Sharp LQ133M1, IPS, 1920x1080, 13.30 | HP EliteBook Folio G1 V1C37EA AUO226D, IPS, 1920x1080, 12.50 | Toshiba Portege Z30-C-138 TOS508F, IPS, 1920x1080, 13.30 | Lenovo ThinkPad X1 Carbon 20FB003RGE VVX14T058J00, IPS, 2560x1440, 14.00 | |
|---|---|---|---|---|---|
| Display | -21% | -33% | 1% | -1% | |
| Display P3 Coverage | 67.6 | 52.2 -23% | 44.45 -34% | 67.9 0% | 66.7 -1% |
| sRGB Coverage | 94.7 | 78.3 -17% | 65.2 -31% | 98 3% | 94.7 0% |
| AdobeRGB 1998 Coverage | 69 | 53.9 -22% | 45.96 -33% | 69.8 1% | 68.4 -1% |
| Response Times | -25% | 16% | -4% | 1% | |
| Response Time Grey 50% / Grey 80% * | 42.4 ? | 50.4 ? -19% | 32 ? 25% | 42 ? 1% | 44 ? -4% |
| Response Time Black / White * | 25.6 ? | 33.6 ? -31% | 24 ? 6% | 28 ? -9% | 24 ? 6% |
| PWM Frequency | 217 ? | 220 ? | |||
| Screen | -20% | -19% | -19% | -2% | |
| Brightness middle | 401 | 261 -35% | 289 -28% | 300 -25% | 272 -32% |
| Brightness | 369 | 241 -35% | 298 -19% | 280 -24% | 268 -27% |
| Brightness Distribution | 85 | 85 0% | 87 2% | 87 2% | 95 12% |
| Black Level * | 0.35 | 0.26 26% | 0.27 23% | 0.31 11% | 0.32 9% |
| Contrast | 1146 | 1004 -12% | 1070 -7% | 968 -16% | 850 -26% |
| Colorchecker dE 2000 * | 3.5 | 4.3 -23% | 4.82 -38% | 4.9 -40% | 2.61 25% |
| Colorchecker dE 2000 max. * | 6.33 | 8.66 -37% | 10.73 -70% | 8.91 -41% | 6.43 -2% |
| Greyscale dE 2000 * | 4.13 | 5.82 -41% | 3.84 7% | 6.69 -62% | 3.31 20% |
| Gamma | 2.28 96% | 2.44 90% | 2.41 91% | 2.33 94% | 2.35 94% |
| CCT | 6508 100% | 6771 96% | 6492 100% | 6487 100% | 6360 102% |
| Color Space (Percent of AdobeRGB 1998) | 61.56 | 49.18 -20% | 42.03 -32% | 63 2% | 63 2% |
| Color Space (Percent of sRGB) | 94.64 | 77.84 -18% | 64.8 -32% | 98 4% | 95 0% |
| Total Average (Program / Settings) | -22% /
-20% | -12% /
-17% | -7% /
-13% | -1% /
-1% |
* ... smaller is better
Display Response Times
| ↔ Response Time Black to White | ||
|---|---|---|
| 25.6 ms ... rise ↗ and fall ↘ combined | ↗ 11.6 ms rise | 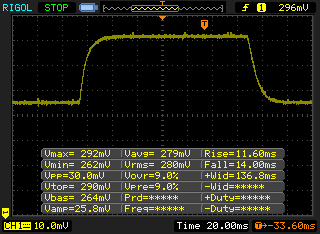 |
| ↘ 14 ms fall | ||
| The screen shows relatively slow response rates in our tests and may be too slow for gamers. In comparison, all tested devices range from 0.1 (minimum) to 240 (maximum) ms. » 56 % of all devices are better. This means that the measured response time is worse than the average of all tested devices (21.5 ms). | ||
| ↔ Response Time 50% Grey to 80% Grey | ||
| 42.4 ms ... rise ↗ and fall ↘ combined | ↗ 17.2 ms rise | 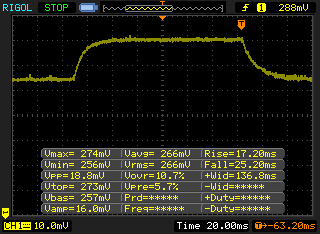 |
| ↘ 25.2 ms fall | ||
| The screen shows slow response rates in our tests and will be unsatisfactory for gamers. In comparison, all tested devices range from 0.2 (minimum) to 636 (maximum) ms. » 66 % of all devices are better. This means that the measured response time is worse than the average of all tested devices (33.7 ms). | ||
| Cinebench R15 | |
| CPU Single 64Bit | |
| Toshiba Portege Z30-C-125 | |
| HP EliteBook 820 G3 T8X20EA | |
| HP EliteBook 1030 G1-X2F03EA | |
| HP EliteBook Folio G1 V1C37EA | |
| Dell Latitude 13 7370 | |
| Apple MacBook 12 (Early 2016) 1.1 GHz | |
| Apple MacBook 12 (Early 2016) 1.1 GHz | |
| Microsoft Surface Pro 4, Core m3 | |
| CPU Multi 64Bit | |
| Toshiba Portege Z30-C-125 | |
| HP EliteBook 820 G3 T8X20EA | |
| HP EliteBook 1030 G1-X2F03EA | |
| HP EliteBook Folio G1 V1C37EA | |
| Apple MacBook 12 (Early 2016) 1.1 GHz | |
| Microsoft Surface Pro 4, Core m3 | |
| Dell Latitude 13 7370 | |
| Cinebench R11.5 | |
| CPU Single 64Bit | |
| HP EliteBook 1030 G1-X2F03EA | |
| HP EliteBook 820 G3 T8X20EA | |
| Dell Latitude 13 7370 | |
| Apple MacBook 12 (Early 2016) 1.1 GHz | |
| Apple MacBook 12 (Early 2016) 1.1 GHz | |
| Microsoft Surface Pro 4, Core m3 | |
| CPU Multi 64Bit | |
| HP EliteBook 1030 G1-X2F03EA | |
| HP EliteBook 820 G3 T8X20EA | |
| Apple MacBook 12 (Early 2016) 1.1 GHz | |
| Apple MacBook 12 (Early 2016) 1.1 GHz | |
| Microsoft Surface Pro 4, Core m3 | |
| Dell Latitude 13 7370 | |
| X264 HD Benchmark 4.0 | |
| Pass 1 | |
| HP EliteBook 1030 G1-X2F03EA | |
| Toshiba Portege Z30-C-125 | |
| HP EliteBook 820 G3 T8X20EA | |
| Dell Latitude 13 7370 | |
| Microsoft Surface Pro 4, Core m3 | |
| Apple MacBook 12 (Early 2016) 1.1 GHz | |
| Pass 2 | |
| Toshiba Portege Z30-C-125 | |
| HP EliteBook 1030 G1-X2F03EA | |
| HP EliteBook 820 G3 T8X20EA | |
| Microsoft Surface Pro 4, Core m3 | |
| Apple MacBook 12 (Early 2016) 1.1 GHz | |
| Dell Latitude 13 7370 | |
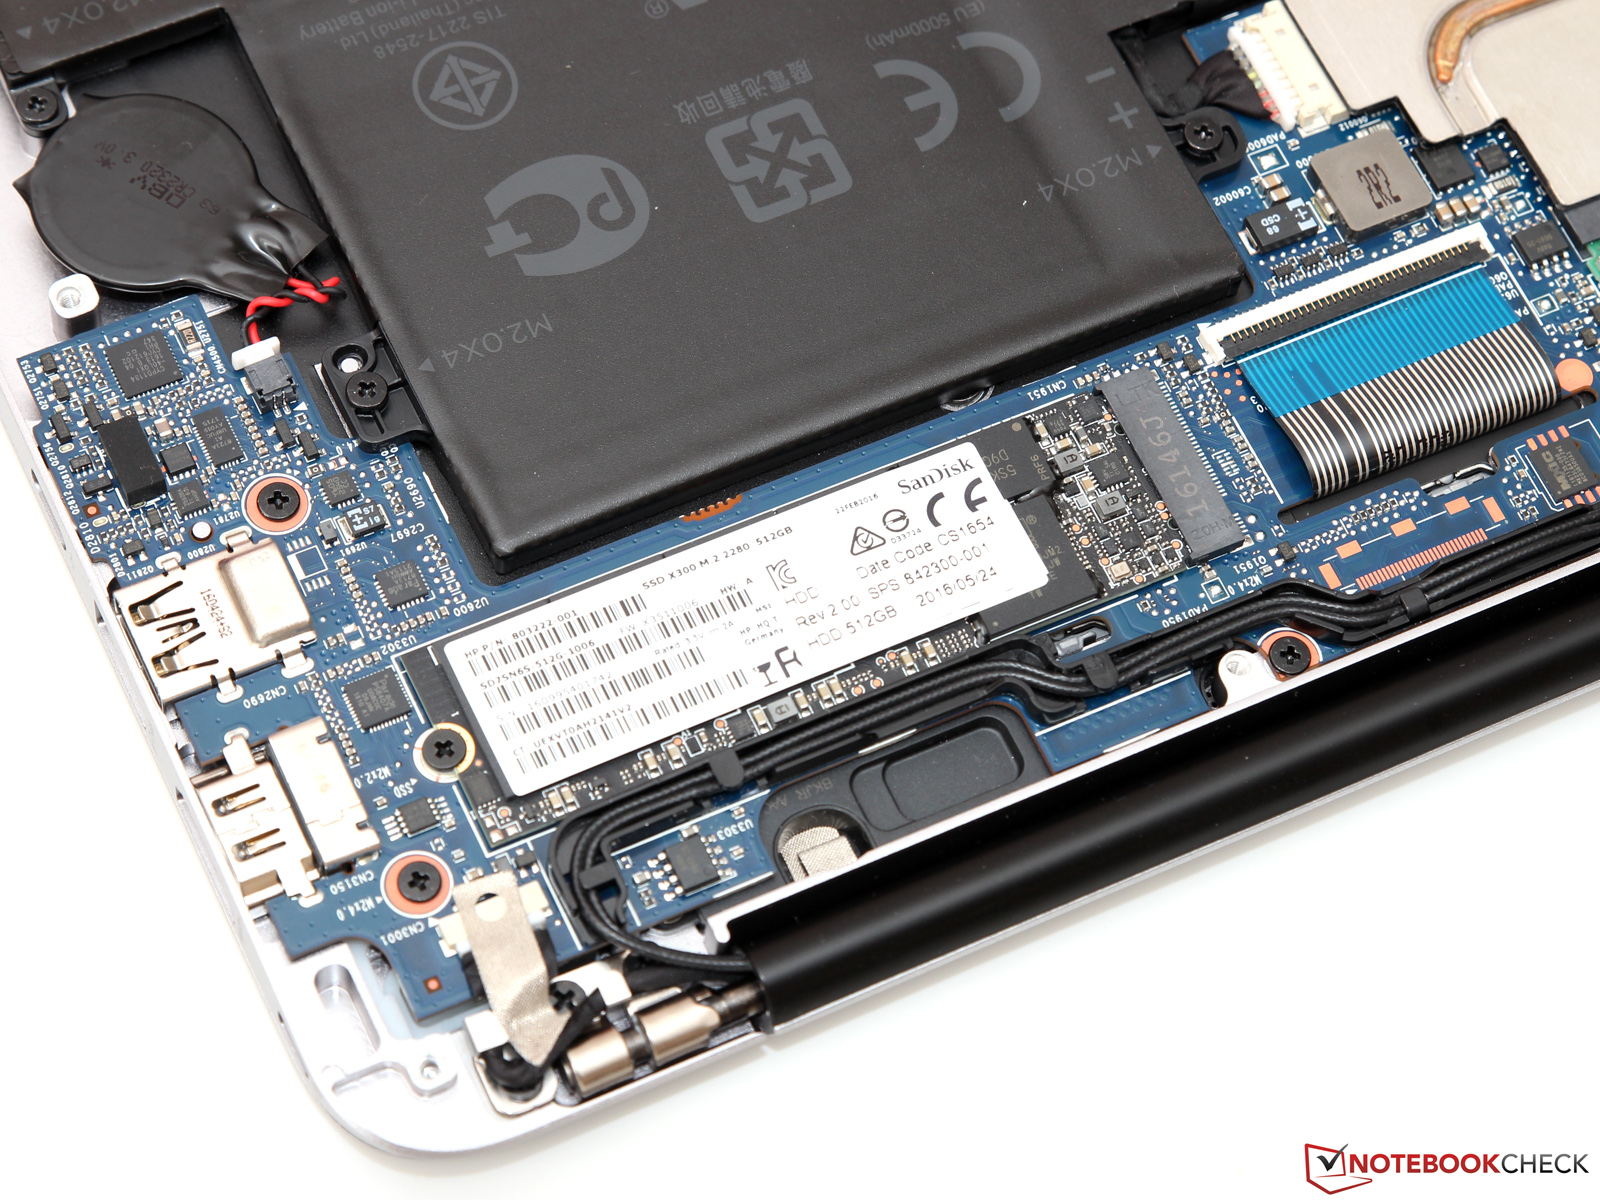
| HP EliteBook 1030 G1-X2F03EA Sandisk X300 SD7SN6S-512G-1006 | Dell Latitude 13 7370 Toshiba NVMe THNSN5256GPU7 | HP EliteBook Folio G1 V1C37EA Samsung SM951 MZVPV256 m.2 | Apple MacBook 12 (Early 2016) 1.1 GHz Apple SSD AP0256 | Toshiba Portege Z30-C-138 Toshiba HG6 THNSNJ512G8NY | |
|---|---|---|---|---|---|
| CrystalDiskMark 3.0 | 154% | 173% | 53% | 11% | |
| Read Seq | 387.5 | 1354 249% | 1482 282% | 754 95% | 518 34% |
| Write Seq | 348.7 | 1132 225% | 1232 253% | 638 83% | 423.3 21% |
| Read 512 | 239.9 | 1140 375% | 1191 396% | 616 157% | 414.8 73% |
| Write 512 | 335.3 | 1020 204% | 1220 264% | 678 102% | 379.9 13% |
| Read 4k | 30.34 | 42.13 39% | 46.96 55% | 14.6 -52% | 21.17 -30% |
| Write 4k | 75.9 | 105.8 39% | 100.7 33% | 20.5 -73% | 86.3 14% |
| Read 4k QD32 | 311.3 | 400.5 29% | 464 49% | 464 49% | 227.3 -27% |
| Write 4k QD32 | 192.8 | 328.4 70% | 292.1 52% | 315 63% | 174.7 -9% |
| PCMark 7 - Score | |
| Lenovo ThinkPad X1 Carbon 20FB003RGE | |
| HP EliteBook 1030 G1-X2F03EA | |
| Microsoft Surface Pro 4, Core m3 | |
| Dell Latitude 13 7370 | |
| PCMark 7 Score | 4917 pontos | |
| PCMark 8 Home Score Accelerated v2 | 2838 pontos | |
| PCMark 8 Creative Score Accelerated v2 | 3555 pontos | |
| PCMark 8 Work Score Accelerated v2 | 3784 pontos | |
Ajuda | ||

| 3DMark 06 Standard Score | 7197 pontos | |
| 3DMark 11 Performance | 1219 pontos | |
| 3DMark Ice Storm Standard Score | 43571 pontos | |
| 3DMark Cloud Gate Standard Score | 5242 pontos | |
| 3DMark Fire Strike Score | 774 pontos | |
Ajuda | ||
| baixo | média | alto | ultra | |
| BioShock Infinite (2013) | 44.6 | 19.5 | 16.7 | 5.1 |
| Metro: Last Light (2013) | 21.5 | 18 | 12.5 | |
| Dirt Rally (2015) | 67.2 | 15.8 | 12.5 |
(±) The maximum temperature on the upper side is 43.4 °C / 110 F, compared to the average of 35.9 °C / 97 F, ranging from 21.4 to 59 °C for the class Subnotebook.
(±) The bottom heats up to a maximum of 44.5 °C / 112 F, compared to the average of 39.4 °C / 103 F
(+) In idle usage, the average temperature for the upper side is 30.6 °C / 87 F, compared to the device average of 30.7 °C / 87 F.
(±) The palmrests and touchpad can get very hot to the touch with a maximum of 38.7 °C / 101.7 F.
(-) The average temperature of the palmrest area of similar devices was 28.3 °C / 82.9 F (-10.4 °C / -18.8 F).
| desligado | |
| Ocioso | |
| Carga |
|
| HP EliteBook 1030 G1-X2F03EA 6Y75, HD Graphics 515, Sandisk X300 SD7SN6S-512G-1006, IPS, 3200x1800, 13.30 | Dell Latitude 13 7370 6Y57, HD Graphics 515, Toshiba NVMe THNSN5256GPU7, IPS, 1920x1080, 13.30 | HP EliteBook Folio G1 V1C37EA 6Y54, HD Graphics 515, Samsung SM951 MZVPV256 m.2, IPS, 1920x1080, 12.50 | Toshiba Portege Z30-C-138 6500U, HD Graphics 520, Toshiba HG6 THNSNJ512G8NY, IPS, 1920x1080, 13.30 | Lenovo ThinkPad X1 Carbon 20FB003RGE 6500U, HD Graphics 520, Samsung SSD PM871 MZNLN256HCHP, IPS, 2560x1440, 14.00 | |
|---|---|---|---|---|---|
| Power Consumption | 11% | 13% | -8% | -3% | |
| Idle Minimum * | 4 | 5 -25% | 4.3 -8% | 3.2 20% | 3.8 5% |
| Idle Average * | 8 | 7.5 6% | 6 25% | 7.8 2% | 7.1 11% |
| Idle Maximum * | 8.6 | 8 7% | 6.4 26% | 8.7 -1% | 7.7 10% |
| Load Average * | 26.5 | 15.3 42% | 22.7 14% | 42.2 -59% | 30.2 -14% |
| Load Maximum * | 34.8 | 26.8 23% | 31.2 10% | 35.7 -3% | 44.7 -28% |
* ... smaller is better
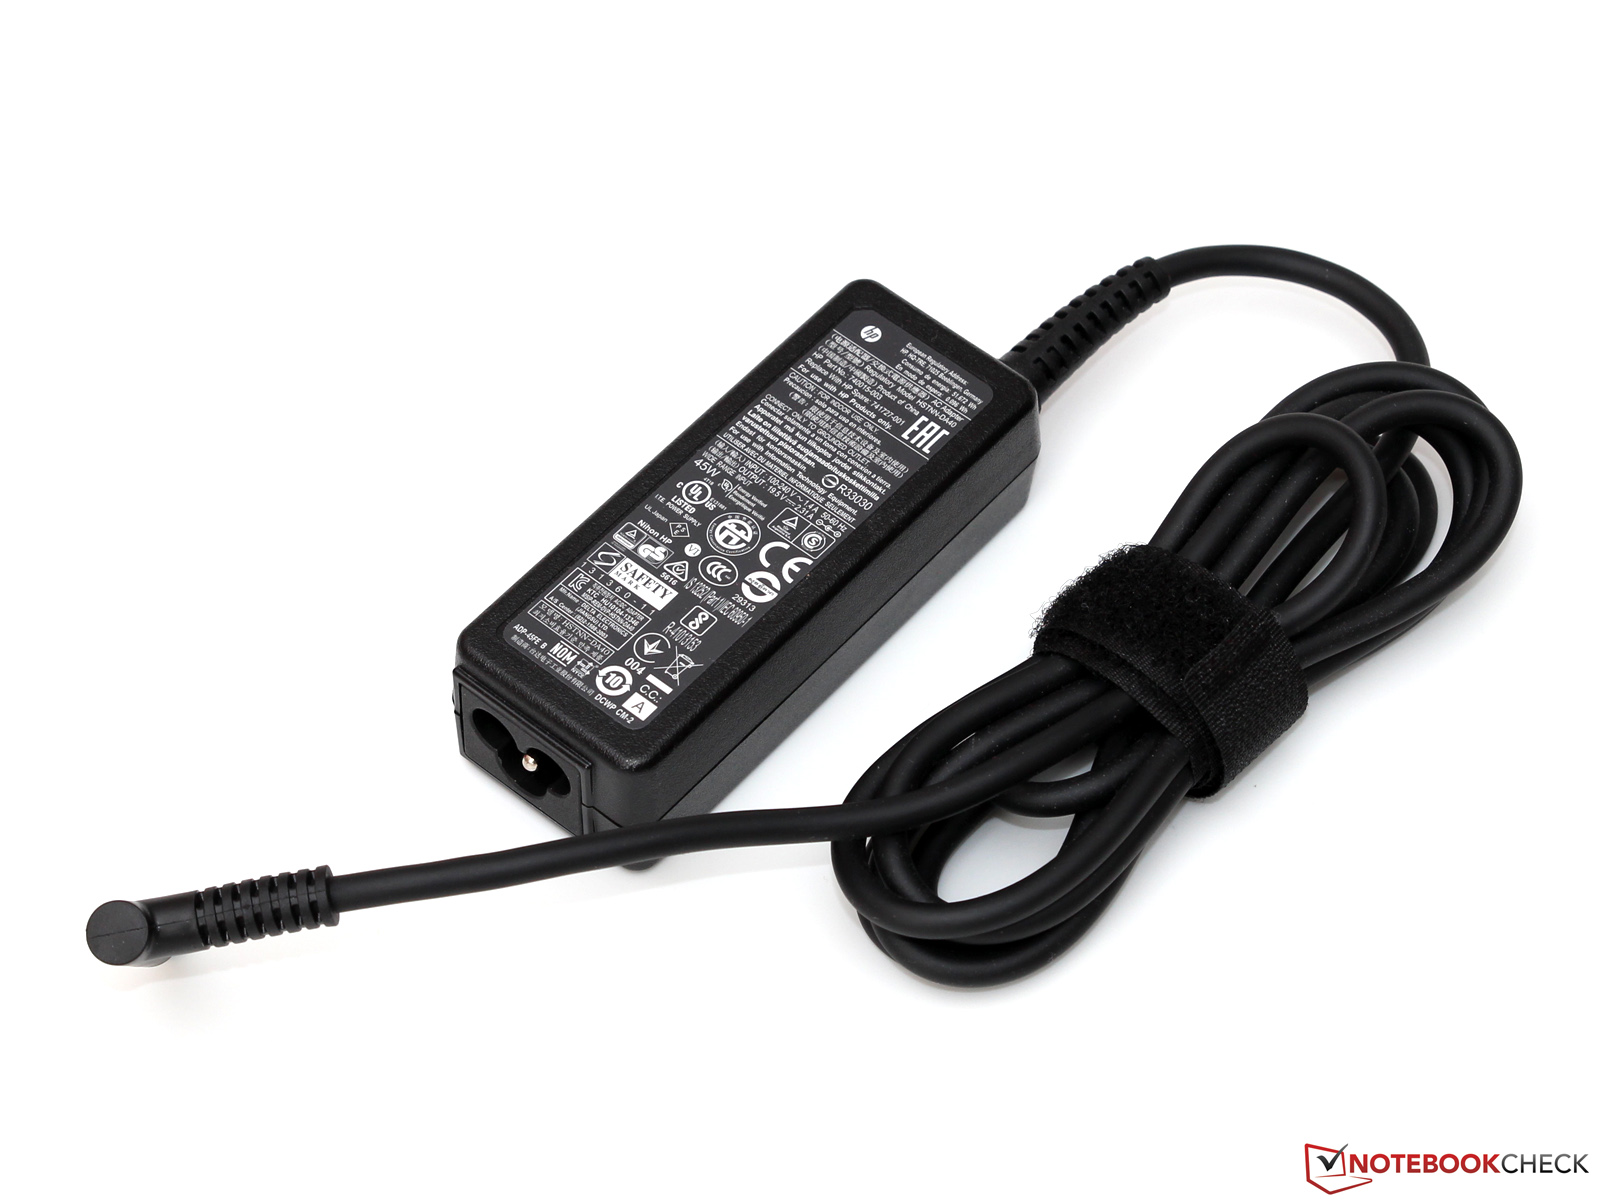
| HP EliteBook 1030 G1-X2F03EA 6Y75, HD Graphics 515, 40 Wh | Dell Latitude 13 7370 6Y57, HD Graphics 515, 34 Wh | HP EliteBook Folio G1 V1C37EA 6Y54, HD Graphics 515, 38 Wh | Toshiba Portege Z30-C-138 6500U, HD Graphics 520, 52 Wh | Lenovo ThinkPad X1 Carbon 20FB003RGE 6500U, HD Graphics 520, 52 Wh | Apple MacBook 12 (Early 2016) 1.1 GHz 6Y30, HD Graphics 515, 41.4 Wh | |
|---|---|---|---|---|---|---|
| Battery Runtime | 10% | 4% | 13% | 27% | 53% | |
| Reader / Idle | 618 | 588 -5% | 526 -15% | 942 52% | ||
| H.264 | 377 | 391 4% | 413 10% | 510 35% | 512 36% | |
| WiFi v1.3 | 305 | 367 20% | 355 16% | 345 13% | 429 41% | 501 64% |
| Load | 144 | 176 22% | 152 6% | 115 -20% | 231 60% |
Pro
Contra
Pode haver diferente opiniões sobre o conceito básico de um portátil empresarial resfriado passivamente: Se você deve realizar cálculos exigentes nas temperaturas do verão e precisa tanto desempenho quanto possível, você definitivamente estará melhor com um processador Core i clássico. Para aplicativos de escritório simples, navegar ou videoconferências, no entanto, você normalmente não precisa de tanto desempenho – outros aspectos como os dispositivos de entrada, peso e ruído são mais importantes.
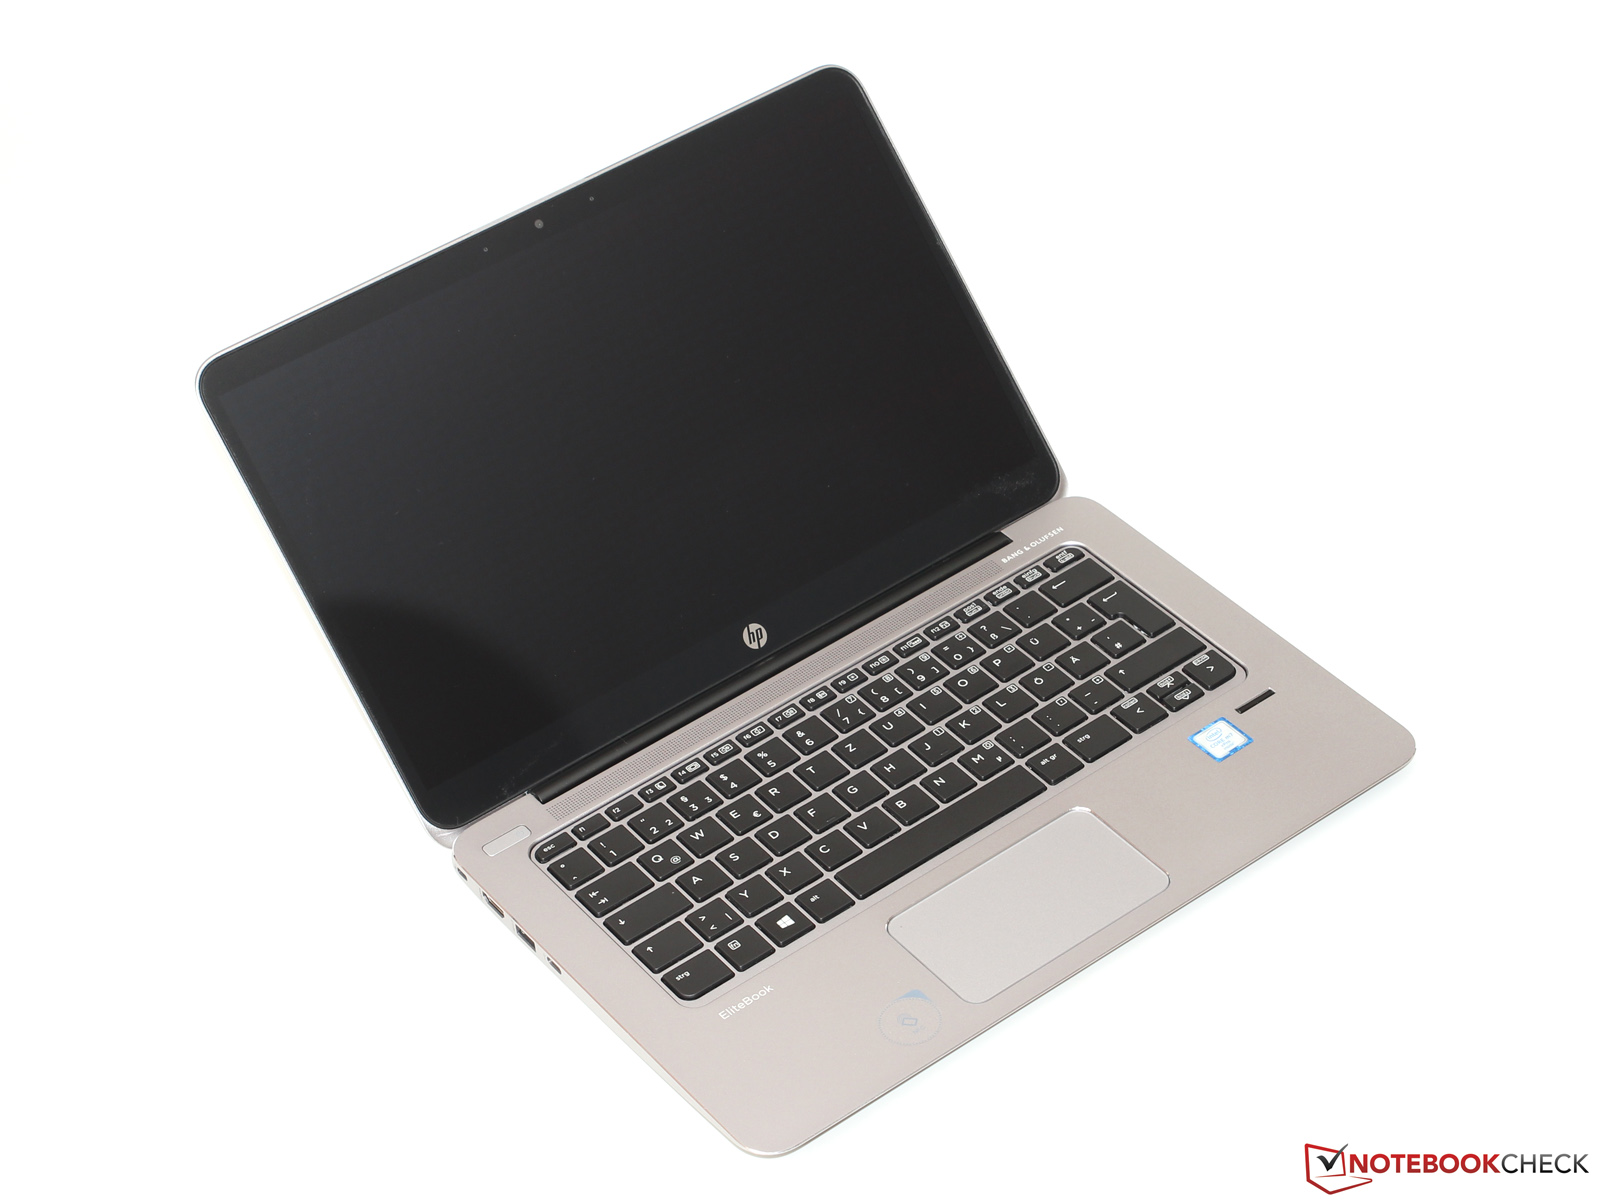
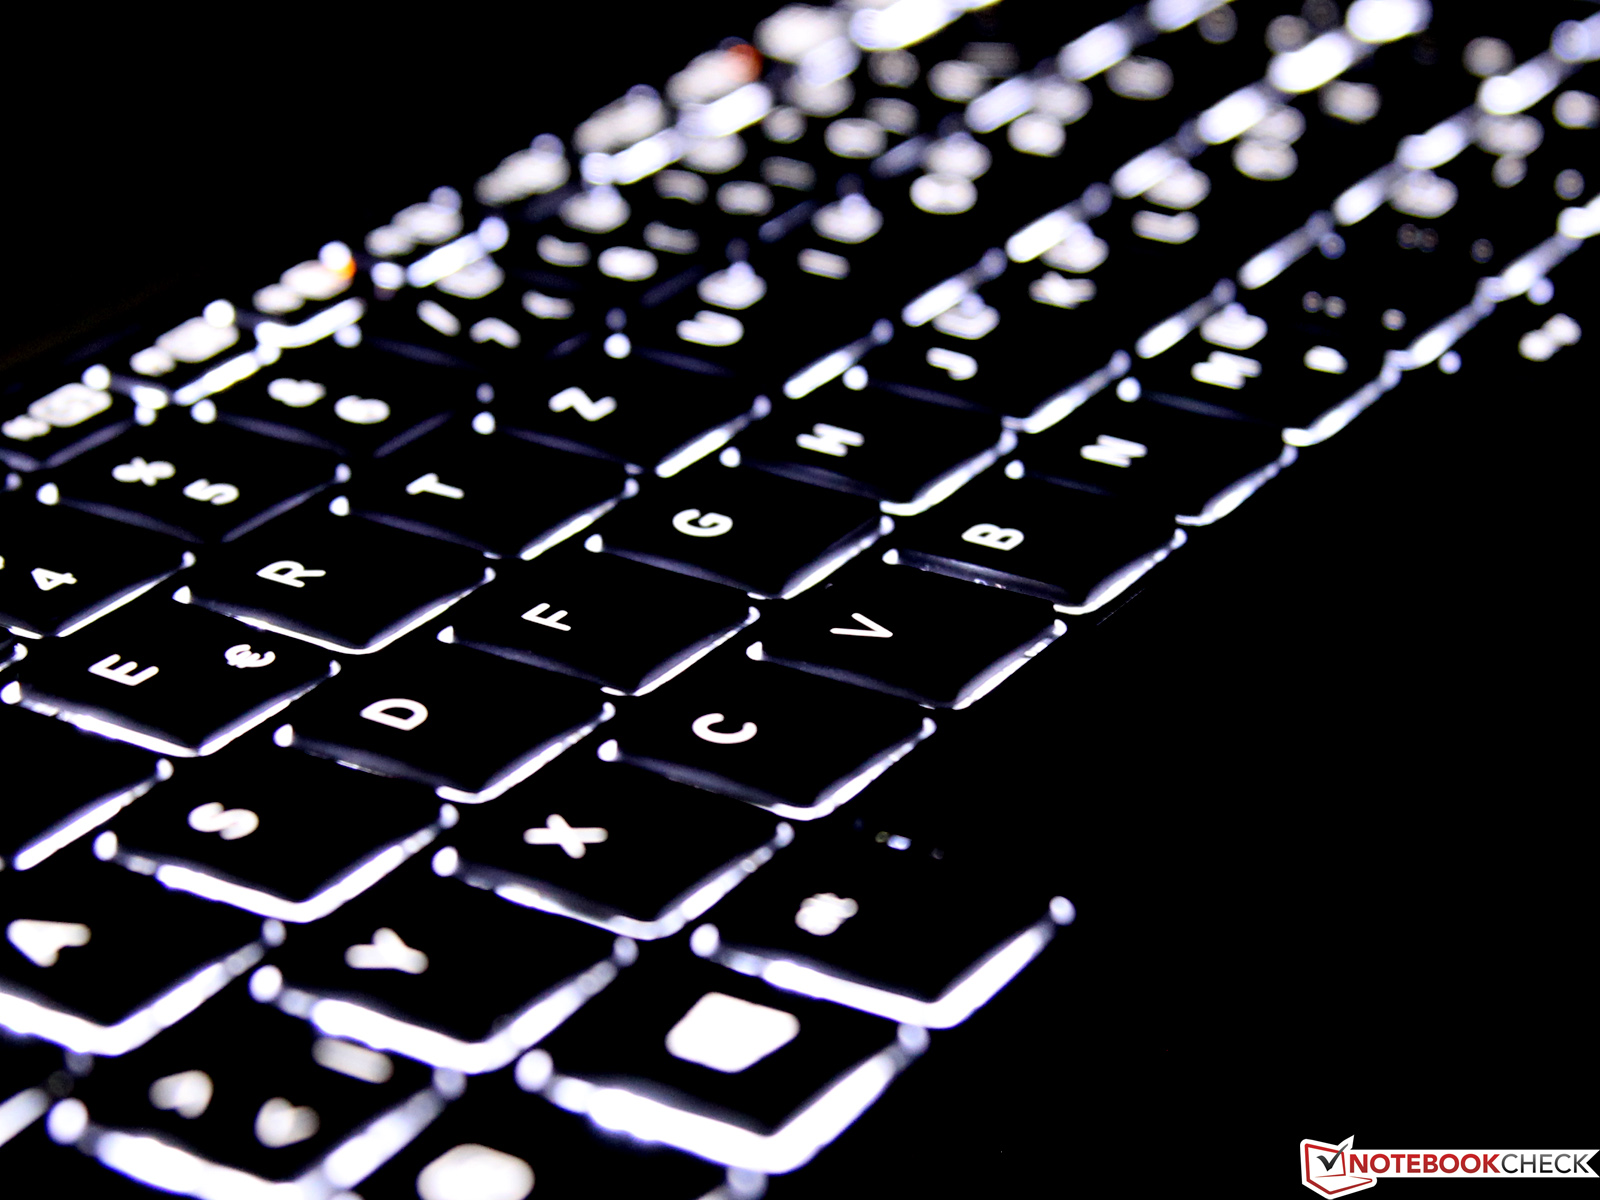
A HP tomou esta abordagem e criou um aparelho quase perfeito com o EliteBook 1030 G1. O portátil está entre os melhores aparelhos em termos de qualidade e consegue convencer particularmente com sua qualidade de construção, o teclado, e a tela. O desempenho de aplicativos também é muito bom, apesar das limitações mencionadas, dado que a HP conseguiu um compromisso entre desempenho e aquecimento graças a limites de TDP e temperatura mais inteligentes. Apenas as durações comparativamente curtas da bateria não atendem nossa ideia de Ultrabook perfeito – o vindouro modelo Full HD provavelmente terá mais estamina se você puder renunciar ao painel QHD+ extremamente nítido.
Em resumo, o 1030 G1 realmente merece uma recomendação, embora o alto preço de venda entre 1.500 e 2.000 Euros (~$1697 e ~$2263) possa afastar alguns compradores potenciais no início. Concorrentes similares, no entanto, não são baratos.
HP EliteBook 1030 G1-X2F03EA
-
07/11/2016 v5.1(old)
Till Schönborn
Pricecompare
