 Deutsch
 English
 Español
 Français
 Italiano
 Nederlands
 Polski
 Português
 Русский
 Türkçe
 Svenska
 Chinese
 Magyar
Breve Análise do Tablet Xplore Technologies XSLATE L10 (Pentium N4200, FHD)
| SD Card Reader | |
| average JPG Copy Test (av. of 3 runs) | |
| Panasonic Toughbook CF-XZ6 (Toshiba Exceria Pro SDXC 64 GB UHS-II) | |
| Dell Latitude 14 7414 Rugged Extreme (Toshiba Exceria Pro SDXC 64 GB UHS-II) | |
| Xploretech XSLATE L10 (Toshiba Exceria Pro SDXC 64 GB UHS-II) | |
| Dell Latitude 3490 (Toshiba Exceria Pro SDXC 64 GB UHS-II) | |
| maximum AS SSD Seq Read Test (1GB) | |
| Panasonic Toughbook CF-XZ6 (Toshiba Exceria Pro SDXC 64 GB UHS-II) | |
| Dell Latitude 14 7414 Rugged Extreme (Toshiba Exceria Pro SDXC 64 GB UHS-II) | |
| Xploretech XSLATE L10 (Toshiba Exceria Pro SDXC 64 GB UHS-II) | |
| Dell Latitude 3490 (Toshiba Exceria Pro SDXC 64 GB UHS-II) | |
| Networking | |
| iperf3 transmit AX12 | |
| Panasonic Toughbook CF-XZ6 | |
| Dell Latitude 14 7414 Rugged Extreme | |
| Apple iPad Pro 10.5 2017 | |
| Xploretech XSLATE L10 | |
| iperf3 receive AX12 | |
| Xploretech XSLATE L10 | |
| Apple iPad Pro 10.5 2017 | |
| Panasonic Toughbook CF-XZ6 | |
| Dell Latitude 14 7414 Rugged Extreme | |
| |||||||||||||||||||||||||
iluminação: 88 %
iluminação com acumulador: 1145.9 cd/m²
Contraste: 1014:1 (Preto: 1.13 cd/m²)
ΔE Color 5.14 | 0.5-29.43 Ø5, calibrated: 5.06
ΔE Greyscale 4.4 | 0.57-98 Ø5.3
67.2% sRGB (Argyll 1.6.3 3D)
42.8% AdobeRGB 1998 (Argyll 1.6.3 3D)
47.29% AdobeRGB 1998 (Argyll 2.2.0 3D)
68.1% sRGB (Argyll 2.2.0 3D)
45.72% Display P3 (Argyll 2.2.0 3D)
Gamma: 2.25
| Xploretech XSLATE L10 IPS, 10.10, 1920x1200 | Apple iPad Pro 10.5 2017 IPS, 10.50, 2224x1668 | Dell Latitude 12 Rugged Tablet Sharp SHP1417 LQ116K1, TN, 11.60, 1366x768 | Dell Latitude 14 7414 Rugged Extreme Sharp LQ140K1, IPS, 14.00, 1366x768 | Panasonic Toughbook CF-XZ6 Semi-Matte Beschichtung, IPS LED, 12.00, 2160x1440 | Dell Latitude 3490 LP140WF6 / LGD059D, IPS LED, 14.00, 1920x1080 | |
|---|---|---|---|---|---|---|
| Display | -21% | -19% | 2% | -13% | ||
| Display P3 Coverage | 45.72 | 36.06 -21% | 37.22 -19% | 46.47 2% | 39.81 -13% | |
| sRGB Coverage | 68.1 | 54 -21% | 55.8 -18% | 70 3% | 59.6 -12% | |
| AdobeRGB 1998 Coverage | 47.29 | 37.29 -21% | 38.49 -19% | 48.01 2% | 41.16 -13% | |
| Response Times | -5% | -22% | 59% | -16% | ||
| Response Time Grey 50% / Grey 80% * | 32.8 ? | 39.6 ? -21% | 43 ? -31% | 39 ? -19% | 36.4 ? -11% | |
| Response Time Black / White * | 20 ? | 17.6 ? 12% | 27 ? -35% | 30 ? -50% | 24 ? -20% | |
| PWM Frequency | 200 ? | 200 ? 0% | 694 ? 247% | |||
| Screen | 27% | -37% | -36% | 3% | -8% | |
| Brightness middle | 1145.9 | 634 -45% | 632 -45% | 493 -57% | 565 -51% | 250 -78% |
| Brightness | 1090 | 625 -43% | 613 -44% | 456 -58% | 538 -51% | 241 -78% |
| Brightness Distribution | 88 | 87 -1% | 90 2% | 81 -8% | 82 -7% | 81 -8% |
| Black Level * | 1.13 | 0.39 65% | 0.47 58% | 0.53 53% | 0.4 65% | 0.25 78% |
| Contrast | 1014 | 1626 60% | 1345 33% | 930 -8% | 1413 39% | 1000 -1% |
| Colorchecker dE 2000 * | 5.14 | 1.9 63% | 11.22 -118% | 11.08 -116% | 5.06 2% | 5.5 -7% |
| Colorchecker dE 2000 max. * | 23.66 | 3.9 84% | 15.11 36% | 8.1 66% | 23.5 1% | |
| Colorchecker dE 2000 calibrated * | 5.06 | 4.8 5% | ||||
| Greyscale dE 2000 * | 4.4 | 2.8 36% | 12.19 -177% | 11.99 -173% | 6.4 -45% | 3.5 20% |
| Gamma | 2.25 98% | 2.26 97% | 3.4 65% | 4.03 55% | 2.25 98% | 2.27 97% |
| CCT | 6847 95% | 7027 93% | 1256 518% | 10872 60% | 5794 112% | 7049 92% |
| Color Space (Percent of AdobeRGB 1998) | 42.8 | 35 -18% | 36 -16% | 44 3% | 37.9 -11% | |
| Color Space (Percent of sRGB) | 67.2 | 54 -20% | 56 -17% | 70 4% | 59.4 -12% | |
| Total Average (Program / Settings) | 11% /
21% | -29% /
-33% | -26% /
-30% | 21% /
13% | -12% /
-10% |
* ... smaller is better
Display Response Times
| ↔ Response Time Black to White | ||
|---|---|---|
| 20 ms ... rise ↗ and fall ↘ combined | ↗ 10.8 ms rise | 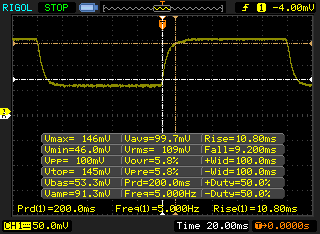 |
| ↘ 9.2 ms fall | ||
| The screen shows good response rates in our tests, but may be too slow for competitive gamers. In comparison, all tested devices range from 0.1 (minimum) to 240 (maximum) ms. » 37 % of all devices are better. This means that the measured response time is similar to the average of all tested devices (21.5 ms). | ||
| ↔ Response Time 50% Grey to 80% Grey | ||
| 32.8 ms ... rise ↗ and fall ↘ combined | ↗ 17.6 ms rise | 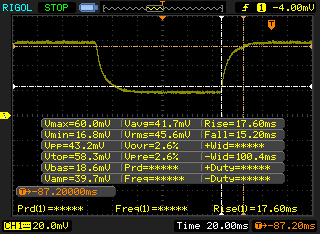 |
| ↘ 15.2 ms fall | ||
| The screen shows slow response rates in our tests and will be unsatisfactory for gamers. In comparison, all tested devices range from 0.2 (minimum) to 636 (maximum) ms. » 38 % of all devices are better. This means that the measured response time is similar to the average of all tested devices (33.7 ms). | ||
Screen Flickering / PWM (Pulse-Width Modulation)
| Screen flickering / PWM detected | 200 Hz | ≤ 99 % brightness setting | 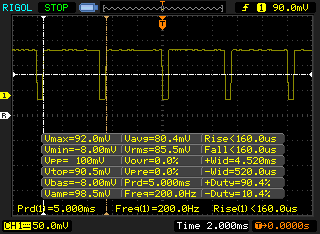 |
The display backlight flickers at 200 Hz (worst case, e.g., utilizing PWM) Flickering detected at a brightness setting of 99 % and below. There should be no flickering or PWM above this brightness setting. The frequency of 200 Hz is relatively low, so sensitive users will likely notice flickering and experience eyestrain at the stated brightness setting and below. In comparison: 53 % of all tested devices do not use PWM to dim the display. If PWM was detected, an average of 17924 (minimum: 5 - maximum: 3846000) Hz was measured. | |||
| Cinebench R15 | |
| CPU Single 64Bit | |
| Dell Latitude 5490 | |
| Asus VivoBook 15 F510UF-ES71 | |
| Lenovo ThinkPad T480s-20L7002AUS | |
| Acer Aspire V3-572PG-604M | |
| Intel NUC7CJYH | |
| Acer Swift 1 SF114-32-P8GG | |
| Dell Latitude 12 Rugged Tablet | |
| Average Intel Pentium N4200 (47 - 53, n=15) | |
| Xploretech XSLATE L10 | |
| Fujitsu Stylistic V535 | |
| Toshiba Satellite Click 10 LX0W-C-104 | |
| CPU Multi 64Bit | |
| Lenovo ThinkPad T480s-20L7002AUS | |
| Dell Latitude 5490 | |
| Asus VivoBook 15 F510UF-ES71 | |
| Acer Swift 1 SF114-32-P8GG | |
| Acer Aspire V3-572PG-604M | |
| Average Intel Pentium N4200 (128 - 178, n=15) | |
| Intel NUC7CJYH | |
| Xploretech XSLATE L10 | |
| Dell Latitude 12 Rugged Tablet | |
| Fujitsu Stylistic V535 | |
| Toshiba Satellite Click 10 LX0W-C-104 | |
| Cinebench R11.5 | |
| CPU Single 64Bit | |
| Dell Latitude 5490 | |
| Asus VivoBook 15 F510UF-ES71 | |
| Acer Aspire V3-572PG-604M | |
| Acer Swift 1 SF114-32-P8GG | |
| Intel NUC7CJYH | |
| Dell Latitude 12 Rugged Tablet | |
| Average Intel Pentium N4200 (0.64 - 0.66, n=3) | |
| Toshiba Satellite Click 10 LX0W-C-104 | |
| CPU Multi 64Bit | |
| Dell Latitude 5490 | |
| Asus VivoBook 15 F510UF-ES71 | |
| Acer Swift 1 SF114-32-P8GG | |
| Acer Aspire V3-572PG-604M | |
| Average Intel Pentium N4200 (2.02 - 2.27, n=3) | |
| Dell Latitude 12 Rugged Tablet | |
| Intel NUC7CJYH | |
| Toshiba Satellite Click 10 LX0W-C-104 | |
| Cinebench R10 | |
| Rendering Multiple CPUs 32Bit | |
| Acer Aspire V3-572PG-604M | |
| Acer Swift 1 SF114-32-P8GG | |
| Average Intel Pentium N4200 (4673 - 5440, n=8) | |
| Dell Latitude 12 Rugged Tablet | |
| Intel NUC7CJYH | |
| Toshiba Satellite Click 10 LX0W-C-104 | |
| Rendering Single 32Bit | |
| Acer Aspire V3-572PG-604M | |
| Dell Latitude 12 Rugged Tablet | |
| Acer Swift 1 SF114-32-P8GG | |
| Intel NUC7CJYH | |
| Average Intel Pentium N4200 (1630 - 1680, n=8) | |
| Toshiba Satellite Click 10 LX0W-C-104 | |
| wPrime 2.10 - 1024m | |
| Intel NUC7CJYH | |
| Average Intel Pentium N4200 (704 - 724, n=2) | |
| Acer Swift 1 SF114-32-P8GG | |
| Dell Latitude 5490 | |
* ... smaller is better
| PCMark 8 - Home Score Accelerated v2 | |
| Dell Latitude 3490 | |
| Dell Latitude 14 7414 Rugged Extreme | |
| Panasonic Toughbook CF-XZ6 | |
| Intel NUC7CJYH | |
| Xploretech XSLATE L10 | |
| Fujitsu Stylistic V535 | |
| PCMark 10 - Score | |
| Dell Latitude 3490 | |
| Panasonic Toughbook CF-XZ6 | |
| Xploretech XSLATE L10 | |
| Intel NUC7CJYH | |
| PCMark 8 Home Score Accelerated v2 | 1337 pontos | |
| PCMark 10 Score | 1355 pontos | |
Ajuda | ||
| Xploretech XSLATE L10 SanDisk SD8SN8U256G1122 | Dell Latitude 12 Rugged Tablet Liteon L8H-128V2G M.2 2280 | Dell Latitude 14 7414 Rugged Extreme Liteonit CV3-8D128 | Dell Latitude 3490 SK hynix SC311 M.2 | Intel NUC7CJYH SanDisk Ultra II | |
|---|---|---|---|---|---|
| AS SSD | -8% | 9% | 53% | 9% | |
| Copy Game MB/s | 151.1 | 158.6 5% | 168.6 12% | 306.2 103% | 175.5 16% |
| Copy Program MB/s | 80.2 | 101.7 27% | 115.4 44% | 315.9 294% | 102 27% |
| Copy ISO MB/s | 275.9 | 164.8 -40% | 302.4 10% | 476.7 73% | 197 -29% |
| Score Total | 1362 | 643 -53% | 762 -44% | 1006 -26% | 1025 -25% |
| Score Write | 240 | 164 -32% | 226 -6% | 387 61% | 268 12% |
| Score Read | 746 | 323 -57% | 349 -53% | 409 -45% | 498 -33% |
| Access Time Write * | 0.119 | 0.095 20% | 0.069 42% | 0.052 56% | 0.089 25% |
| Access Time Read * | 0.154 | 0.091 41% | 0.121 21% | 0.097 37% | 0.115 25% |
| 4K-64 Write | 170.1 | 85.8 -50% | 124.7 -27% | 286.1 68% | 174.6 3% |
| 4K-64 Read | 683 | 246.6 -64% | 267.5 -61% | 332.7 -51% | 420.5 -38% |
| 4K Write | 34.04 | 64.5 89% | 54.7 61% | 68.9 102% | 47.43 39% |
| 4K Read | 16.17 | 25.41 57% | 29.92 85% | 27.67 71% | 26.98 67% |
| Seq Write | 362 | 139.3 -62% | 464.4 28% | 318.8 -12% | 464.8 28% |
| Seq Read | 466 | 513 10% | 516 11% | 484.7 4% | 480 3% |
* ... smaller is better

| 3DMark 11 | |
| 1280x720 Performance GPU | |
| Asus VivoBook 15 F510UF-ES71 | |
| Dell Latitude 3490 | |
| Dell Latitude 14 7414 Rugged Extreme | |
| Average Intel HD Graphics 505 (424 - 825, n=16) | |
| Intel NUC7CJYH | |
| Dell Latitude 12 Rugged Tablet | |
| Xploretech XSLATE L10 | |
| Toshiba Satellite Click 10 LX0W-C-104 | |
| Fujitsu Stylistic V535 | |
| 1280x720 Performance Combined | |
| Asus VivoBook 15 F510UF-ES71 | |
| Dell Latitude 3490 | |
| Dell Latitude 14 7414 Rugged Extreme | |
| Intel NUC7CJYH | |
| Dell Latitude 12 Rugged Tablet | |
| Average Intel HD Graphics 505 (308 - 754, n=16) | |
| Xploretech XSLATE L10 | |
| Toshiba Satellite Click 10 LX0W-C-104 | |
| Fujitsu Stylistic V535 | |
| 3DMark 11 Performance | 577 pontos | |
Ajuda | ||
| baixo | média | alto | ultra | |
| BioShock Infinite (2013) | 21.3 | 10.2 |
Barulho
| Ocioso |
| 27.8 / 27.8 / 27.8 dB |
| Carga |
| 27.8 / 29.9 dB |
 | ||
30 dB silencioso 40 dB(A) audível 50 dB(A) ruidosamente alto |
||
min: | ||
| Xploretech XSLATE L10 HD Graphics 505, Pentium N4200, SanDisk SD8SN8U256G1122 | Dell Latitude 12 Rugged Tablet HD Graphics 5300, 5Y71, Liteon L8H-128V2G M.2 2280 | Dell Latitude 14 7414 Rugged Extreme HD Graphics 520, 6300U, Liteonit CV3-8D128 | Panasonic Toughbook CF-XZ6 HD Graphics 620, i5-7300U, Samsung SSD PM871a MZNLN256HMHQ | Dell Latitude 3490 UHD Graphics 620, i5-8250U, SK hynix SC311 M.2 | Fujitsu Stylistic V535 HD Graphics (Bay Trail), Z3795, 128 GB eMMC Flash | |
|---|---|---|---|---|---|---|
| Noise | -22% | -9% | -11% | -20% | ||
| off / environment * | 27.8 | 30.2 -9% | 30.5 -10% | 29.8 -7% | ||
| Idle Minimum * | 27.8 | 31 -12% | 30.2 -9% | 30.5 -10% | 29.8 -7% | |
| Idle Average * | 27.8 | 31 -12% | 30.2 -9% | 30.5 -10% | 29.8 -7% | |
| Idle Maximum * | 27.8 | 31 -12% | 30.2 -9% | 30.5 -10% | 29.8 -7% | |
| Load Average * | 27.8 | 39.6 -42% | 30.2 -9% | 31.9 -15% | 39.1 -41% | |
| Load Maximum * | 29.9 | 39.9 -33% | 31.7 -6% | 32.6 -9% | 44.3 -48% |
* ... smaller is better
(+) The maximum temperature on the upper side is 38.8 °C / 102 F, compared to the average of 33.8 °C / 93 F, ranging from 20.7 to 53.2 °C for the class Tablet.
(±) The bottom heats up to a maximum of 41.2 °C / 106 F, compared to the average of 33.3 °C / 92 F
(+) In idle usage, the average temperature for the upper side is 26.2 °C / 79 F, compared to the device average of 30 °C / 86 F.
| desligado | |
| Ocioso | |
| Carga |
|
| Xploretech XSLATE L10 Pentium N4200, HD Graphics 505, SanDisk SD8SN8U256G1122, IPS, 1920x1200, 10.10 | Apple iPad Pro 10.5 2017 A10X Fusion, A10X Fusion GPU, Toshiba THGBX669D4LLDXG 64 GB NAND , IPS, 2224x1668, 10.50 | Dell Latitude 12 Rugged Tablet 5Y71, HD Graphics 5300, Liteon L8H-128V2G M.2 2280, TN, 1366x768, 11.60 | Panasonic Toughbook CF-XZ6 i5-7300U, HD Graphics 620, Samsung SSD PM871a MZNLN256HMHQ, IPS LED, 2160x1440, 12.00 | Dell Latitude 3490 i5-8250U, UHD Graphics 620, SK hynix SC311 M.2, IPS LED, 1920x1080, 14.00 | Apple MacBook 12 2017 m3-7Y32, HD Graphics 615, Apple SSD AP0256, LED IPS, 2304x1440, 12.00 | |
|---|---|---|---|---|---|---|
| Power Consumption | 48% | 8% | 11% | -64% | 20% | |
| Idle Minimum * | 3.7 | 1.44 61% | 3.8 -3% | 3.15 15% | 3.2 14% | 2 46% |
| Idle Average * | 10.7 | 6.12 43% | 9.3 13% | 6 44% | 5.5 49% | 5.4 50% |
| Idle Maximum * | 11 | 6.14 44% | 9.7 12% | 6.3 43% | 8.1 26% | 6.6 40% |
| Load Average * | 17.8 | 8.55 52% | 16.3 8% | 21 -18% | 40.8 -129% | 22 -24% |
| Load Maximum * | 17.9 | 10.62 41% | 15.9 11% | 23 -28% | 68.1 -280% | 20 -12% |
* ... smaller is better
| Xploretech XSLATE L10 Pentium N4200, HD Graphics 505, 36 Wh | Apple iPad Pro 10.5 2017 A10X Fusion, A10X Fusion GPU, 30.8 Wh | Dell Latitude 12 Rugged Tablet 5Y71, HD Graphics 5300, 56 Wh | Dell Latitude 3490 i5-8250U, UHD Graphics 620, 56 Wh | Fujitsu Stylistic V535 Z3795, HD Graphics (Bay Trail), 17.7 Wh | Dell Latitude 14 7414 Rugged Extreme 6300U, HD Graphics 520, 97 Wh | |
|---|---|---|---|---|---|---|
| Battery Runtime | 45% | 9% | 61% | -42% | 46% | |
| WiFi v1.3 | 431 | 693 61% | 471 9% | 694 61% | 252 -42% | 628 46% |
| Load | 156 | 199 28% | ||||
| Reader / Idle | 2036 |
Pro
Contra
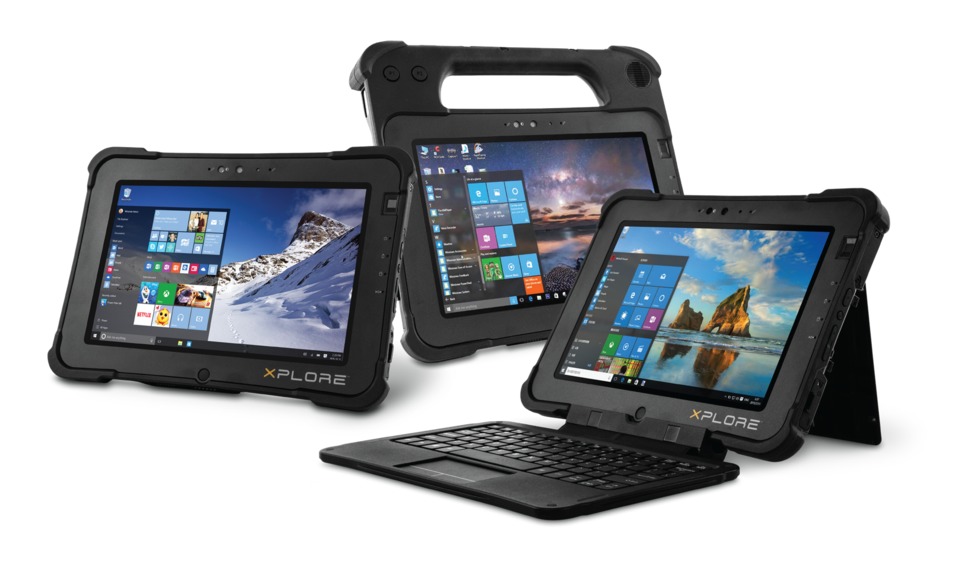
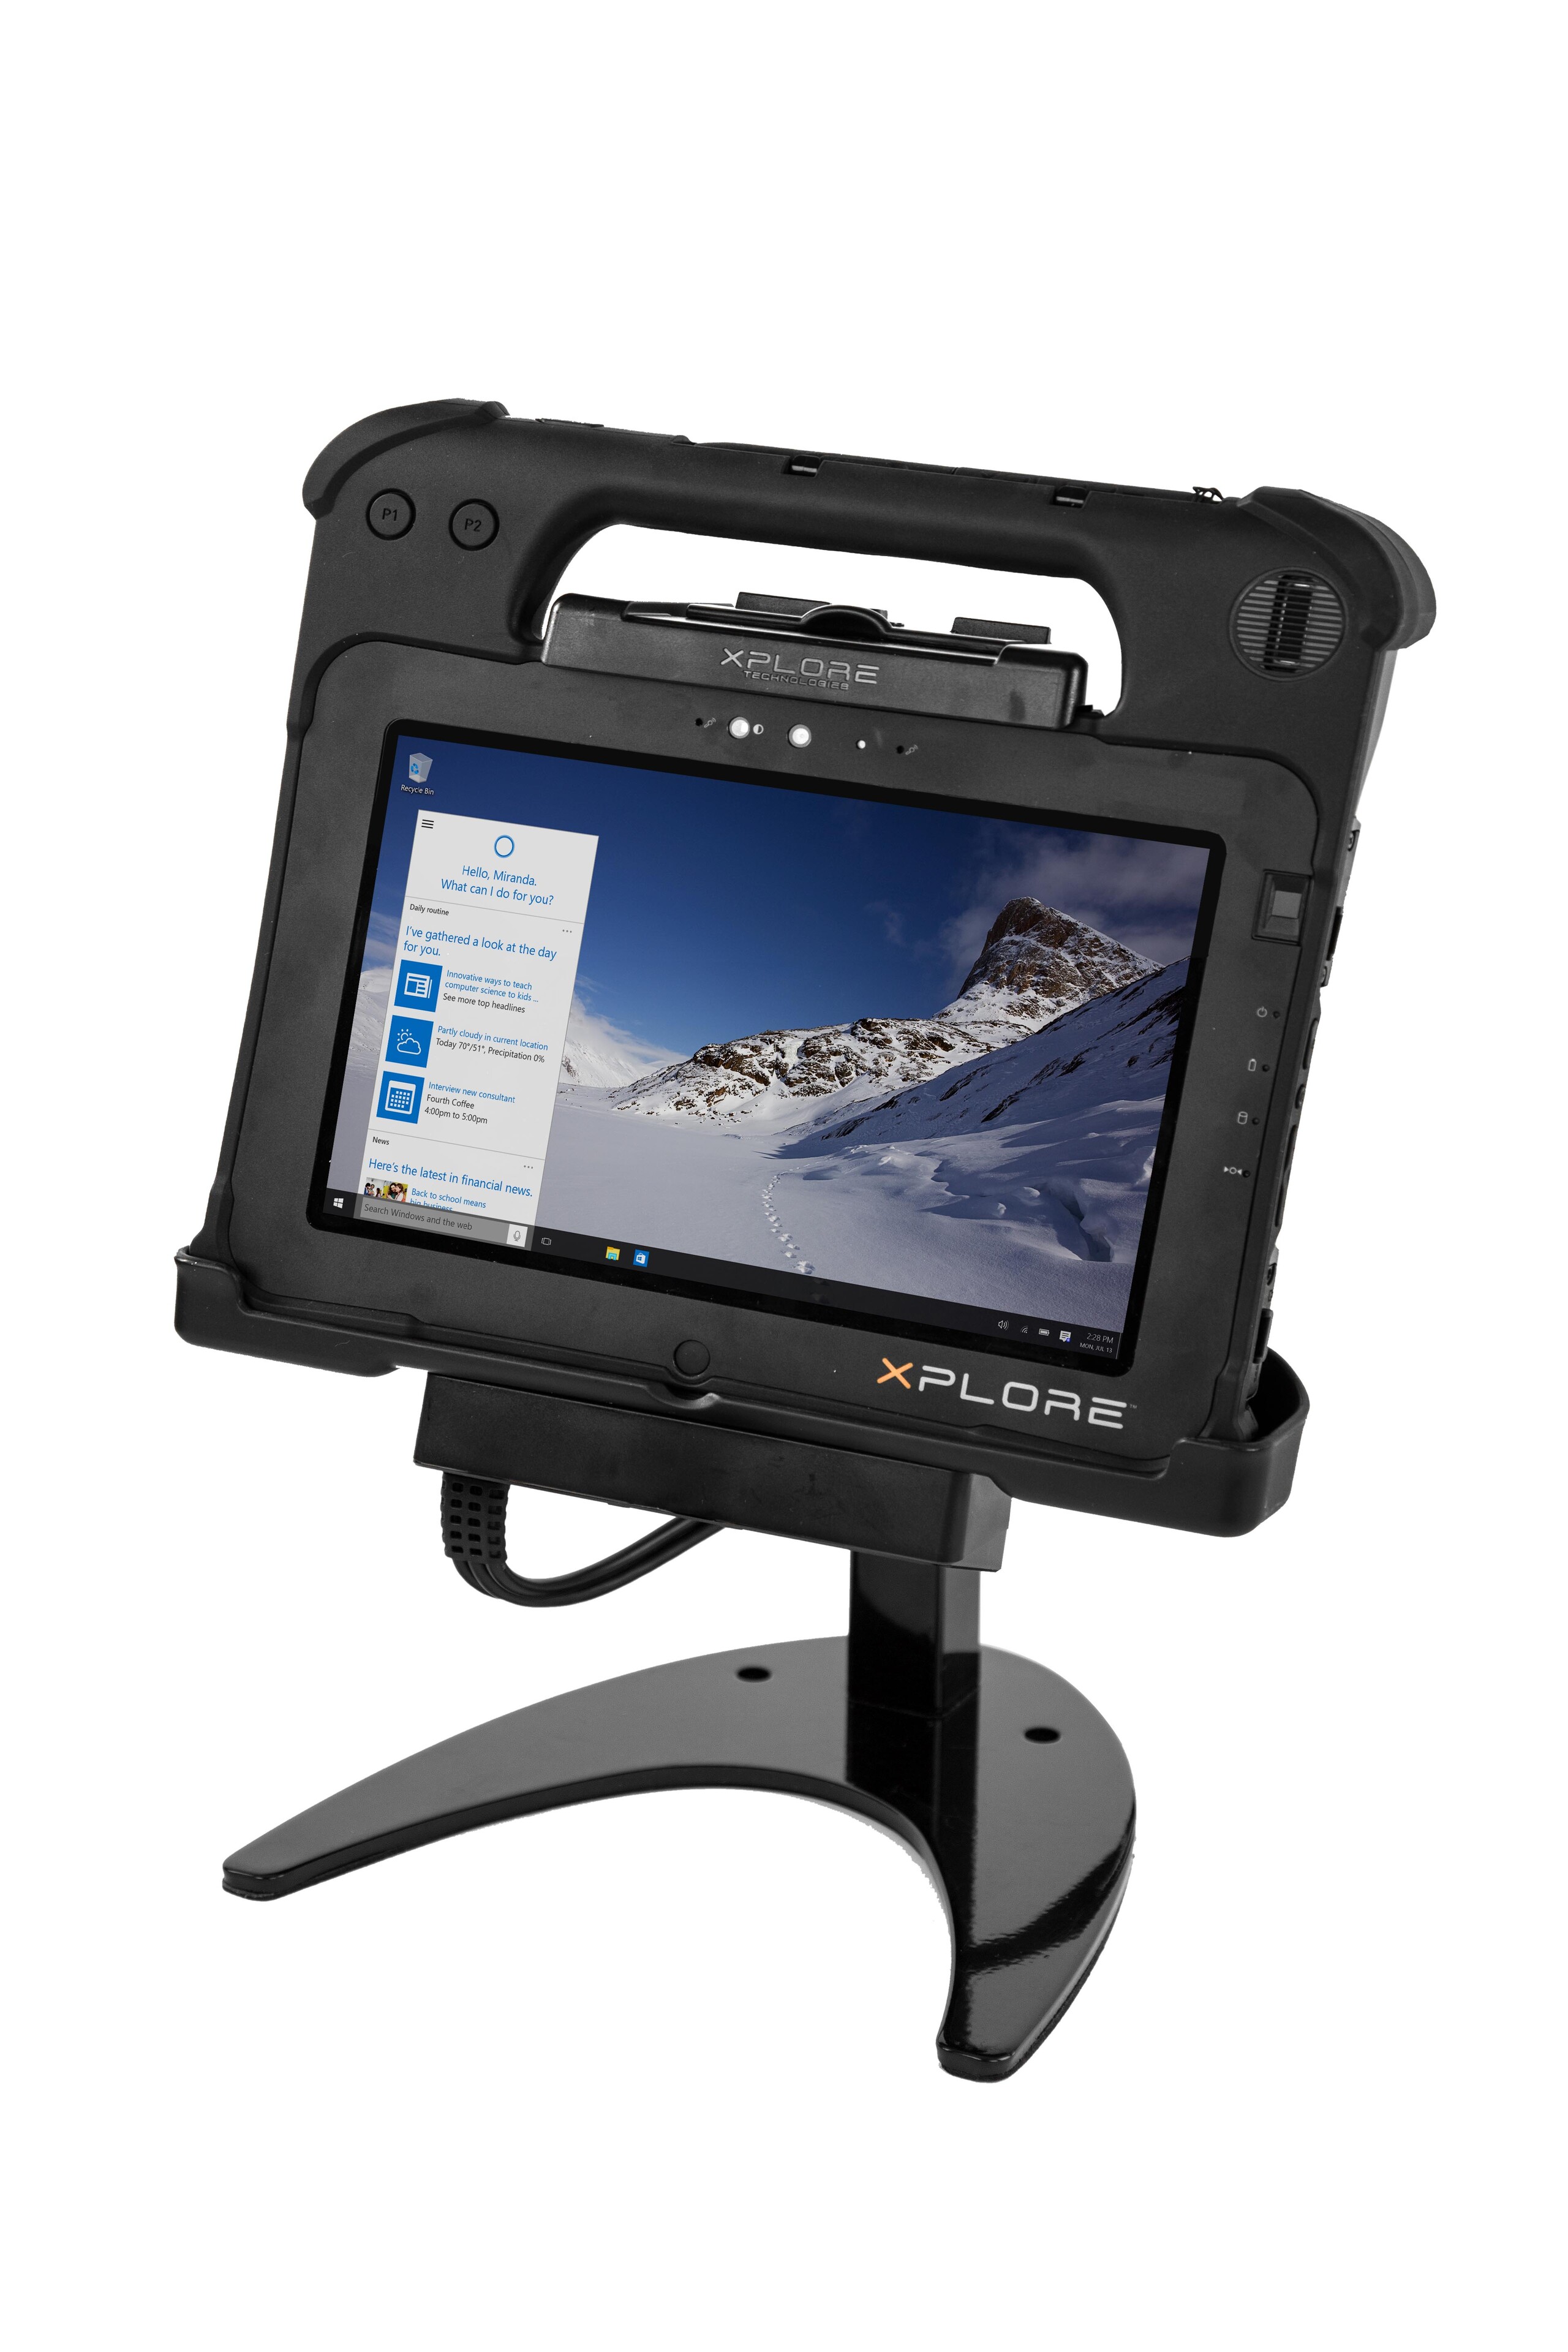
O L10 é focado para fornecer a melhor experiência para usuários industriais e atinge a marca. A precisão das cores, a reprodução de graves, o bleeding da luz de fundo e o desempenho gráfico são, na melhor das hipóteses, ruins ou medianos. Felizmente para o público-alvo, essas desvantagens provavelmente terão um impacto mínimo nas cargas de trabalho do dia-a-dia e provavelmente não serão prejudiciais. Em vez disso, é a rigidez, a conectividade e o brilho da tela que importam, e o L10 definitivamente cumpre nessa frente.
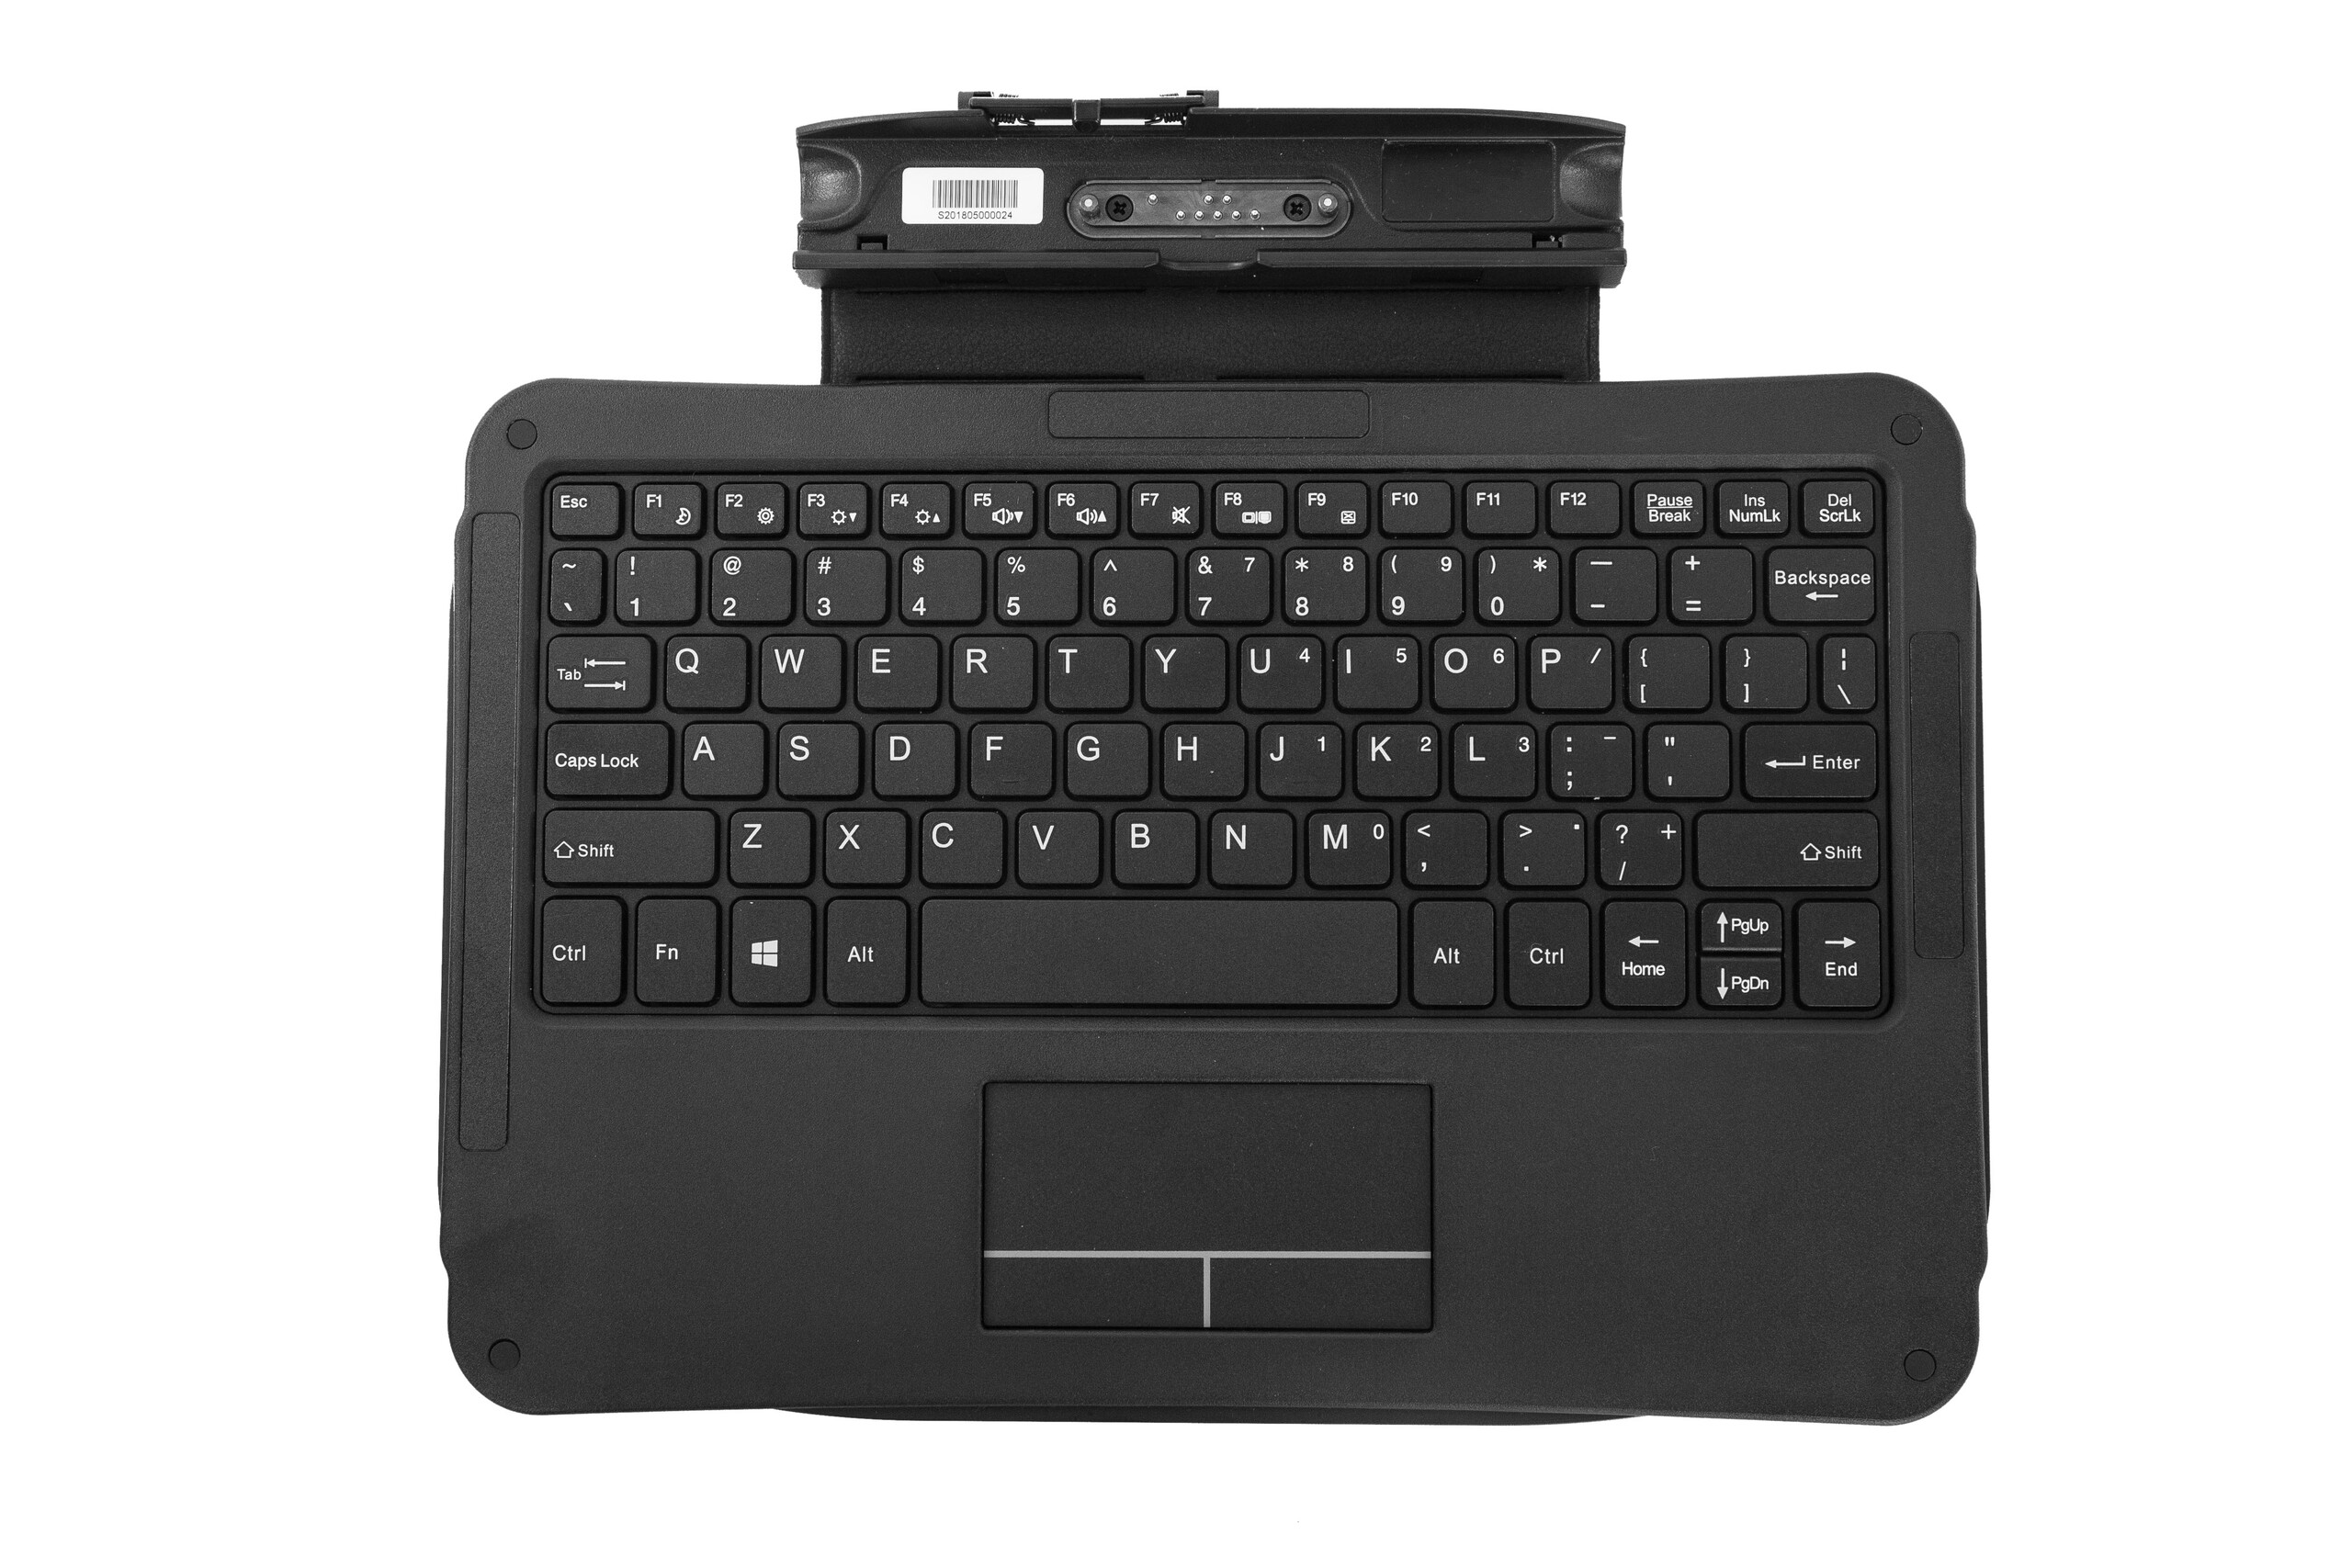
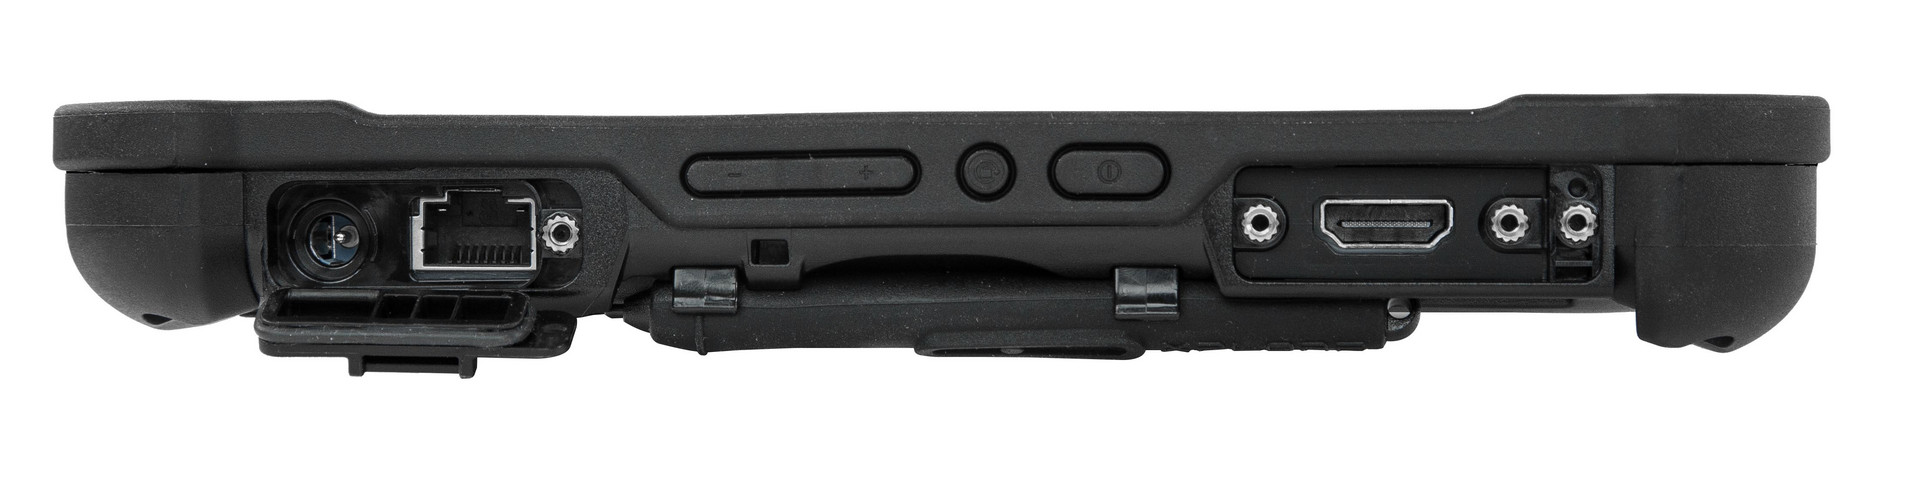
Há alguns detalhes que esperamos que a Xplore possa resolver em futuras revisões. Primeiro, o adaptador de CA proprietário é inconveniente quando o carregamento universal via USB tipo C está agora disponível na maioria dos portáteis e tablets. Em segundo lugar, o digitalizador da WACOM é muito pequeno e estreito para segurar confortavelmente quando comparado aos concorrentes. Em terceiro lugar, o volume máximo poderia ter sido mais alto para o trabalho em exteriores ou em ambientes industriais. Só podemos esperar que os nossos resultados de WiFi inconsistentes sejam específicos da nossa unidade e não sejam generalizados.
Um tablet industrial muito brilhante e versátil com quase todos os recursos de um tablet de consumo convencional. Se visibilidade ao ar livre é de extrema preocupação, então este é o tablet indicado. Alguns aborrecimentos de design menores significam muito espaço para melhorias em revisões futuras.
Xploretech XSLATE L10
-
07/15/2018 v6(old)
Allen Ngo
Pricecompare
