 Deutsch
 English
 Español
 Français
 Italiano
 Nederlands
 Polski
 Português
 Русский
 Türkçe
 Svenska
 Chinese
 Magyar
Breve Análise do Ultrabook Dell XPS 13-9350 InfinityEdge
| |||||||||||||||||||||||||
iluminação: 88 %
iluminação com acumulador: 277.5 cd/m²
Contraste: 1453:1 (Preto: 0.191 cd/m²)
ΔE Color 4.88 | 0.5-29.43 Ø5
ΔE Greyscale 4.26 | 0.57-98 Ø5.3
65.79% sRGB (Argyll 1.6.3 3D)
41.6% AdobeRGB 1998 (Argyll 1.6.3 3D)
45.97% AdobeRGB 1998 (Argyll 2.2.0 3D)
66.8% sRGB (Argyll 2.2.0 3D)
44.53% Display P3 (Argyll 2.2.0 3D)
Gamma: 2.59
| Dell XPS 13-9350 | Dell XPS 13-9343 | Dell XPS 13-9343 Non-Touch | Apple MacBook Air 13 inch 2015-03 | Microsoft Surface Book Core i5 | |
|---|---|---|---|---|---|
| Display | 54% | 42% | -10% | 48% | |
| Display P3 Coverage | 44.53 | 72 62% | 65.9 48% | 40.1 -10% | 67 50% |
| sRGB Coverage | 66.8 | 96 44% | 89.6 34% | 59.8 -10% | 95.8 43% |
| AdobeRGB 1998 Coverage | 45.97 | 71.6 56% | 66.2 44% | 41.51 -10% | 68.9 50% |
| Response Times | |||||
| Response Time Grey 50% / Grey 80% * | 48.4 ? | ||||
| Response Time Black / White * | 32.8 ? | ||||
| PWM Frequency | |||||
| Screen | 19% | -5% | -12% | 33% | |
| Brightness middle | 277.5 | 367.3 32% | 409.7 48% | 329 19% | 430.9 55% |
| Brightness | 276 | 372 35% | 405 47% | 310 12% | 410 49% |
| Brightness Distribution | 88 | 77 -12% | 93 6% | 82 -7% | 93 6% |
| Black Level * | 0.191 | 0.178 7% | 0.366 -92% | 0.405 -112% | 0.254 -33% |
| Contrast | 1453 | 2063 42% | 1119 -23% | 812 -44% | 1696 17% |
| Colorchecker dE 2000 * | 4.88 | 5.92 -21% | 7.67 -57% | 3.96 19% | 2.06 58% |
| Greyscale dE 2000 * | 4.26 | 4.79 -12% | 4.66 -9% | 3.51 18% | 2.22 48% |
| Gamma | 2.59 85% | 2.42 91% | 1.65 133% | 3.83 57% | 2.13 103% |
| CCT | 6562 99% | 7013 93% | 6502 100% | 6711 97% | 6520 100% |
| Color Space (Percent of AdobeRGB 1998) | 41.6 | 63 51% | 59.65 43% | 38.4 -8% | 64 54% |
| Color Space (Percent of sRGB) | 65.79 | 96.4 47% | 59.8 -9% | 96 46% | |
| Colorchecker dE 2000 max. * | 7.51 | ||||
| Total Average (Program / Settings) | 37% /
28% | 19% /
8% | -11% /
-12% | 41% /
37% |
* ... smaller is better
| Cinebench R11.5 | |
| CPU Single 64Bit (sort by value) | |
| Dell XPS 13-9350 | |
| Dell XPS 13-9343 | |
| Dell XPS 13-9343 Non-Touch | |
| HP EliteBook Folio 1040 G2 H7W22EA | |
| Apple MacBook Air 13 inch 2015-03 | |
| Microsoft Surface Book Core i5 | |
| Apple MacBook Pro Retina 13 inch 2015-03 | |
| Apple MacBook Pro Retina 13 inch 2015-03 | |
| CPU Multi 64Bit (sort by value) | |
| Dell XPS 13-9350 | |
| Dell XPS 13-9343 | |
| Dell XPS 13-9343 Non-Touch | |
| HP EliteBook Folio 1040 G2 H7W22EA | |
| Apple MacBook Air 13 inch 2015-03 | |
| Microsoft Surface Book Core i5 | |
| Apple MacBook Pro Retina 13 inch 2015-03 | |
| Apple MacBook Pro Retina 13 inch 2015-03 | |
| Cinebench R15 | |
| CPU Single 64Bit (sort by value) | |
| Dell XPS 13-9350 | |
| Dell XPS 13-9343 | |
| Dell XPS 13-9343 Non-Touch | |
| HP EliteBook Folio 1040 G2 H7W22EA | |
| Apple MacBook Air 13 inch 2015-03 | |
| Microsoft Surface Book Core i5 | |
| Apple MacBook Pro Retina 13 inch 2015-03 | |
| CPU Multi 64Bit (sort by value) | |
| Dell XPS 13-9350 | |
| Dell XPS 13-9343 | |
| Dell XPS 13-9343 Non-Touch | |
| HP EliteBook Folio 1040 G2 H7W22EA | |
| Apple MacBook Air 13 inch 2015-03 | |
| Microsoft Surface Book Core i5 | |
| Apple MacBook Pro Retina 13 inch 2015-03 | |
| wPrime 2.10 | |
| 32m (sort by value) | |
| Dell XPS 13-9350 | |
| Dell XPS 13-9343 | |
| Dell XPS 13-9343 Non-Touch | |
| HP EliteBook Folio 1040 G2 H7W22EA | |
| Apple MacBook Air 13 inch 2015-03 | |
| Microsoft Surface Book Core i5 | |
| 1024m (sort by value) | |
| Dell XPS 13-9350 | |
| Dell XPS 13-9343 | |
| Dell XPS 13-9343 Non-Touch | |
| HP EliteBook Folio 1040 G2 H7W22EA | |
| Apple MacBook Air 13 inch 2015-03 | |
| Microsoft Surface Book Core i5 | |
| Super Pi Mod 1.5 XS 32M - 32M (sort by value) | |
| Dell XPS 13-9350 | |
| Dell XPS 13-9343 | |
| Dell XPS 13-9343 Non-Touch | |
| HP EliteBook Folio 1040 G2 H7W22EA | |
| Apple MacBook Air 13 inch 2015-03 | |
| Microsoft Surface Book Core i5 | |
| Apple MacBook Pro Retina 13 inch 2015-03 | |
* ... smaller is better
| PCMark 7 Score | 4989 pontos | |
| PCMark 8 Home Score Accelerated v2 | 2983 pontos | |
| PCMark 8 Creative Score Accelerated v2 | 3658 pontos | |
| PCMark 8 Work Score Accelerated v2 | 4078 pontos | |
Ajuda | ||

| 3DMark 06 Standard Score | 9313 pontos | |
| 3DMark 11 Performance | 1558 pontos | |
| 3DMark Ice Storm Standard Score | 52625 pontos | |
| 3DMark Cloud Gate Standard Score | 5931 pontos | |
| 3DMark Fire Strike Score | 861 pontos | |
Ajuda | ||
| baixo | média | alto | ultra | |
| Metro 2033 (2010) | 31.33 | 19.67 | 9.67 | |
| StarCraft 2 (2010) | 49 | 32 | 21 | |
| BioShock Infinite (2013) | 54.7 | 28.16 | 23.7 | 7.33 |
| 3DMark 06 - 1280x1024 Standard Score AA:0x AF:0x (sort by value) | |
| Dell XPS 13-9350 | |
| Dell XPS 13-9343 | |
| Dell XPS 13-9343 Non-Touch | |
| Apple MacBook Air 13 inch 2015-03 | |
| Microsoft Surface Book Core i5 | |
| Apple MacBook Pro Retina 13 inch 2015-03 | |
| 3DMark 11 | |
| 1280x720 Performance (sort by value) | |
| Dell XPS 13-9350 | |
| Dell XPS 13-9343 | |
| Dell XPS 13-9343 Non-Touch | |
| HP EliteBook Folio 1040 G2 H7W22EA | |
| Apple MacBook Air 13 inch 2015-03 | |
| Microsoft Surface Book Core i5 | |
| Apple MacBook Pro Retina 13 inch 2015-03 | |
| 1280x720 Performance GPU (sort by value) | |
| Dell XPS 13-9350 | |
| Dell XPS 13-9343 Non-Touch | |
| HP EliteBook Folio 1040 G2 H7W22EA | |
| Apple MacBook Air 13 inch 2015-03 | |
| Microsoft Surface Book Core i5 | |
| Apple MacBook Pro Retina 13 inch 2015-03 | |
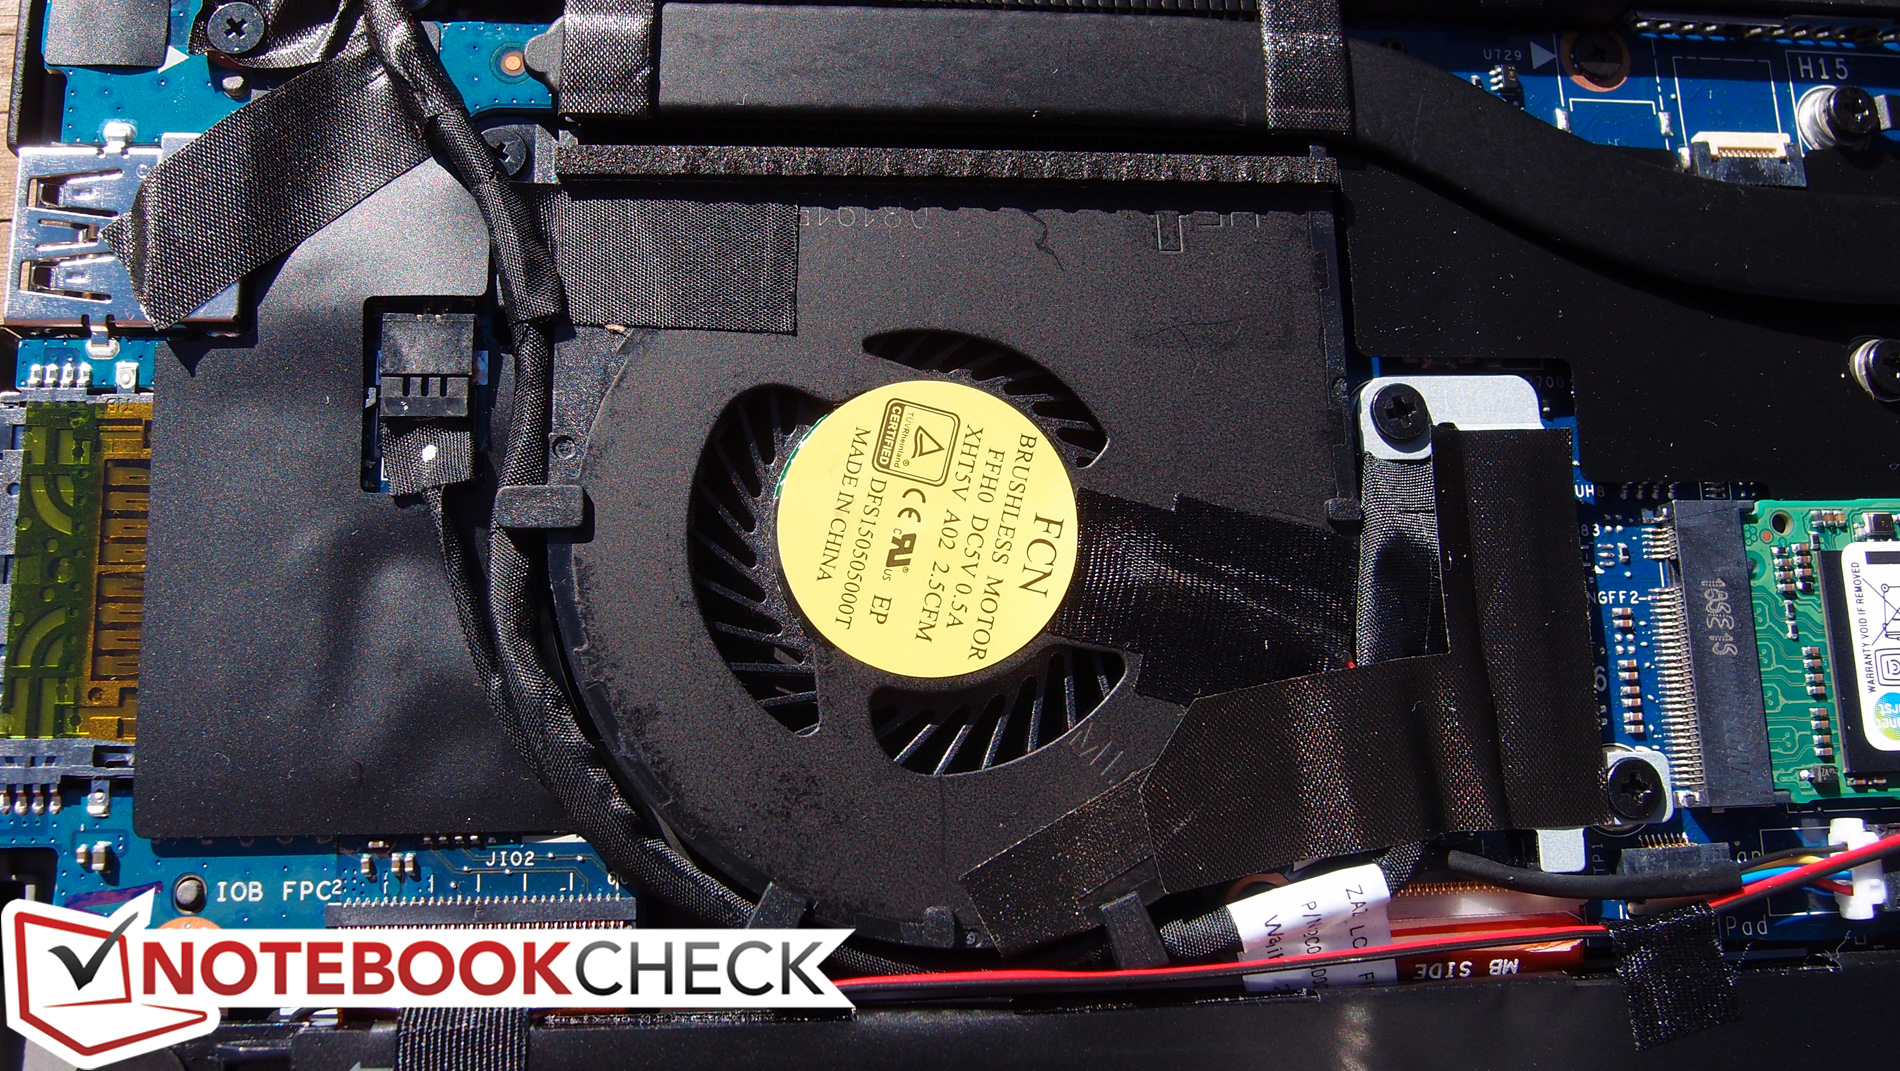
Barulho
| Ocioso |
| 28.2 / 28.3 / 28.4 dB |
| Carga |
| 30.2 / 30.2 dB |
 | ||
30 dB silencioso 40 dB(A) audível 50 dB(A) ruidosamente alto |
||
min: | ||
| Dell XPS 13-9350 | Dell XPS 13-9343 | Dell XPS 13-9343 Non-Touch | Apple MacBook Air 13 inch 2015-03 | Microsoft Surface Book Core i5 | |
|---|---|---|---|---|---|
| Noise | -19% | -8% | -19% | -15% | |
| Idle Minimum * | 28.2 | 30.2 -7% | 29 -3% | 29.2 -4% | 29.5 -5% |
| Idle Average * | 28.3 | 30.3 -7% | 29.1 -3% | 29.2 -3% | 29.6 -5% |
| Idle Maximum * | 28.4 | 30.4 -7% | 29.2 -3% | 29.2 -3% | 29.7 -5% |
| Load Average * | 30.2 | 34.4 -14% | 31.1 -3% | 40.2 -33% | 37.5 -24% |
| Load Maximum * | 30.2 | 48 -59% | 38.4 -27% | 46.3 -53% | 40.9 -35% |
* ... smaller is better
(-) The maximum temperature on the upper side is 45.2 °C / 113 F, compared to the average of 35.9 °C / 97 F, ranging from 21.4 to 59 °C for the class Subnotebook.
(-) The bottom heats up to a maximum of 45.2 °C / 113 F, compared to the average of 39.4 °C / 103 F
(+) In idle usage, the average temperature for the upper side is 27 °C / 81 F, compared to the device average of 30.7 °C / 87 F.
(+) The palmrests and touchpad are cooler than skin temperature with a maximum of 30.8 °C / 87.4 F and are therefore cool to the touch.
(-) The average temperature of the palmrest area of similar devices was 28.3 °C / 82.9 F (-2.5 °C / -4.5 F).
| Dell XPS 13-9350 | Dell XPS 13-9343 | Dell XPS 13-9343 Non-Touch | Apple MacBook Air 13 inch 2015-03 | Microsoft Surface Book Core i5 | |
|---|---|---|---|---|---|
| Battery Runtime | 5% | 32% | 34% | 9% | |
| Reader / Idle | 782 | 912 17% | 1295 66% | 1572 101% | 1070 37% |
| WiFi v1.3 | 451 | 598 33% | 620 37% | 402 -11% | |
| Load | 150 | 140 -7% | 145 -3% | 97 -35% | 153 2% |
| WiFi | 580 |
Pro
Contra
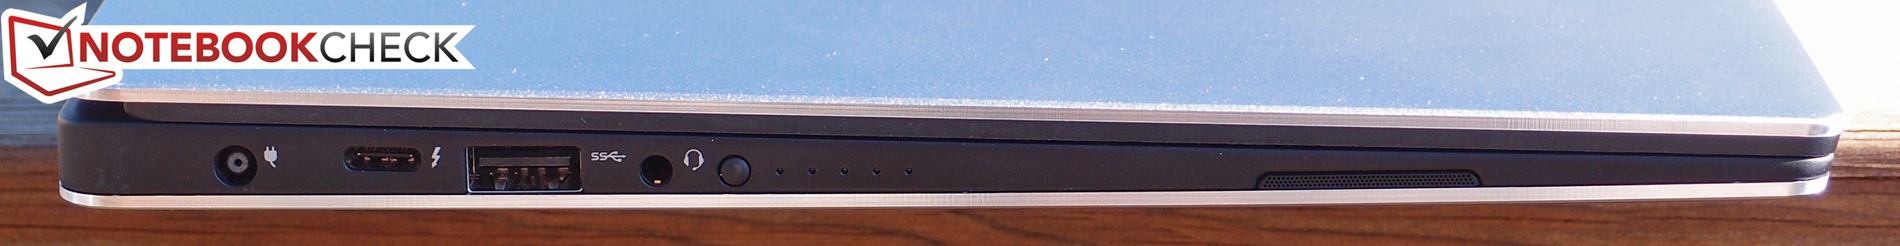
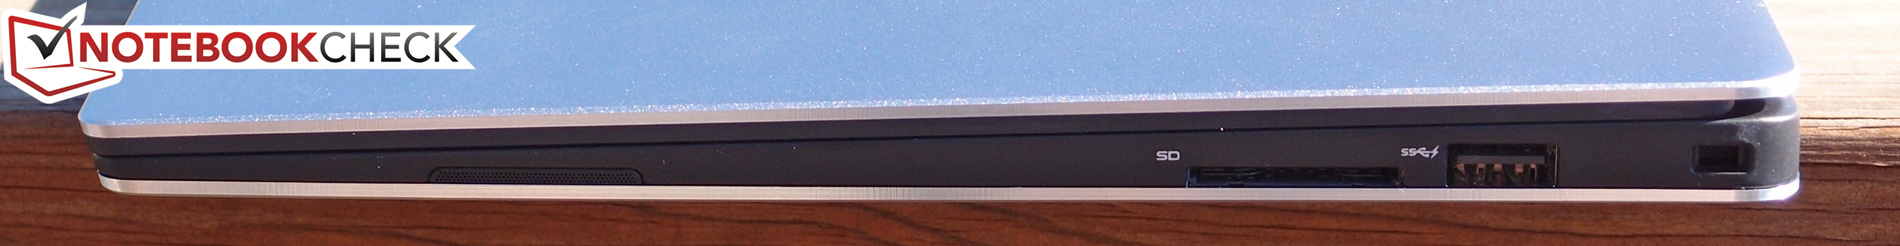
Oito meses depois, o Dell XPS 13 permanece como um contendor superior para a coroa dos ultra portáveis, sustentado por um chipset e CPU melhorados, armazenamento SSD NVMe mais veloz, configurações de memória melhoradas, gráficos integrados superiores, melhor seleção de portas, e operação notoriamente mais silenciosa, além de tudo isso. Este não é o mais o Ultrabook mais veloz que testamos; uma variedade de contendores modernos — desde o Microsoft Surface Book até o Apple MacBook Air 13— superam suas pontuações do desempenho do sistema por uma margem estreita. Mas é o fato de que estas altas pontuações estão construídas sobre um conjunto de características já perfeitamente balanceadas o que o torna tão atraente. Os vencedores da categoria mainstream de ultra portáveis não são definidos por vitória absoluta em algumas categorias seletas, senão, mais frequentemente em um desempenho poderoso balanceado em tudo.
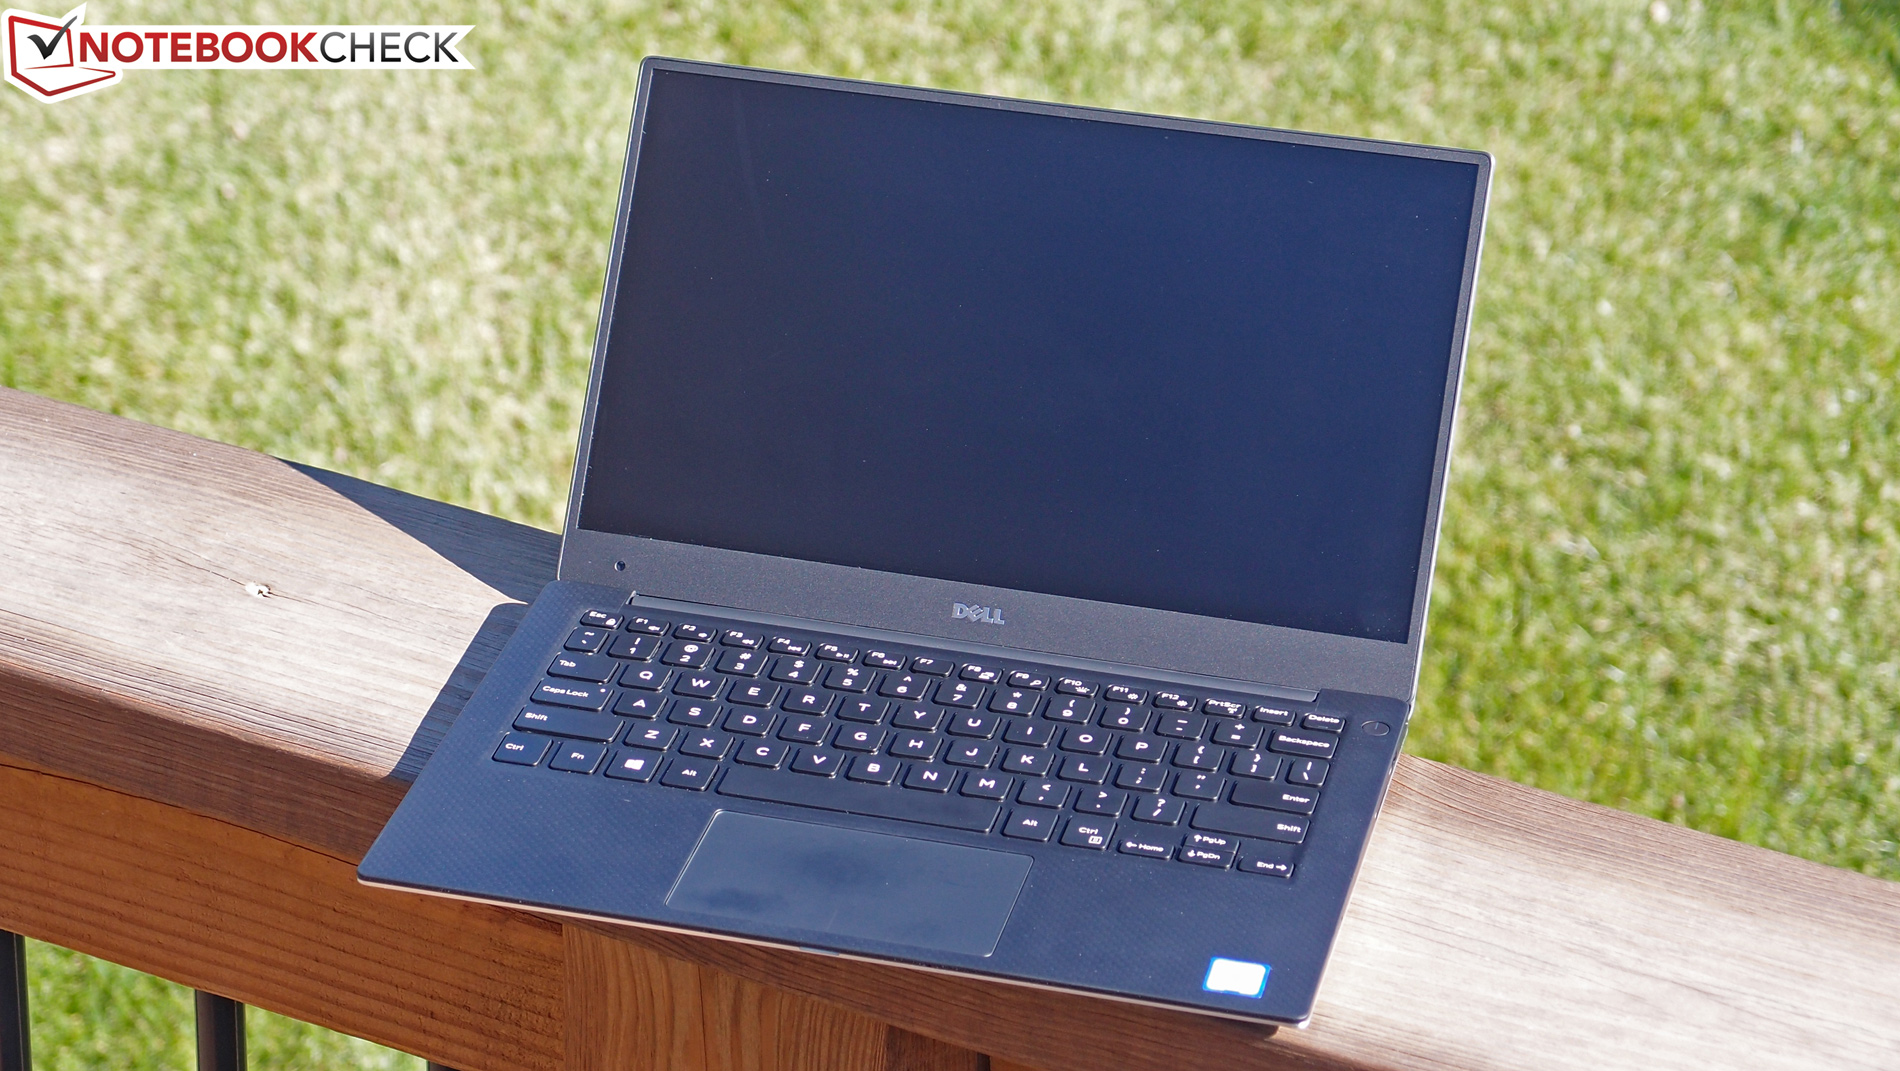
A maior fortaleza do Dell XPS 13-9350 está em seu delicado equilíbrio de tudo o que interessa para o mercado de ultra portáveis. Seja a ênfase na portabilidade, desempenho, versatilidade, ergonomia, aquecimento e ruído, ou inclusive sua beleza, simplesmente não há muito do que reclamar.
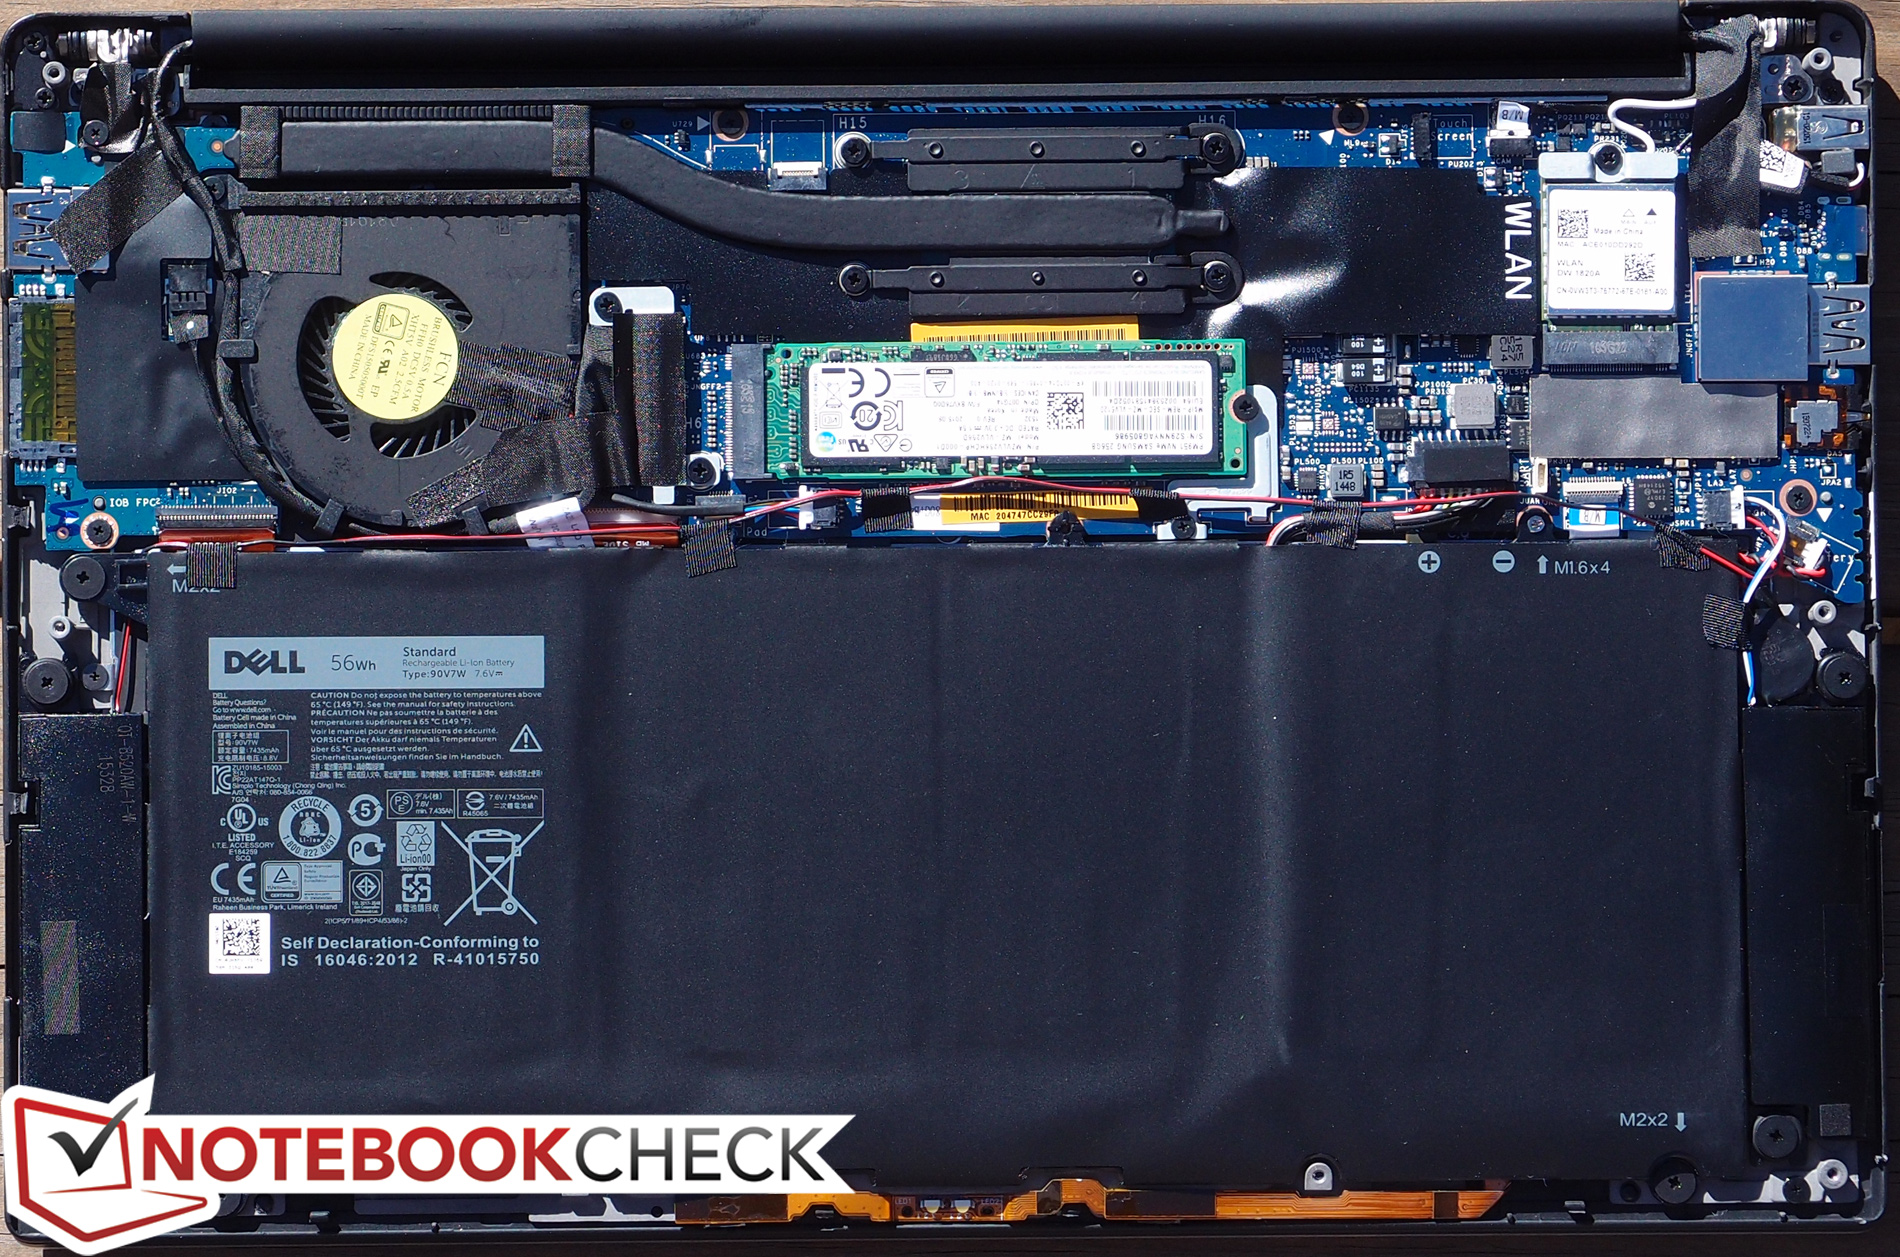
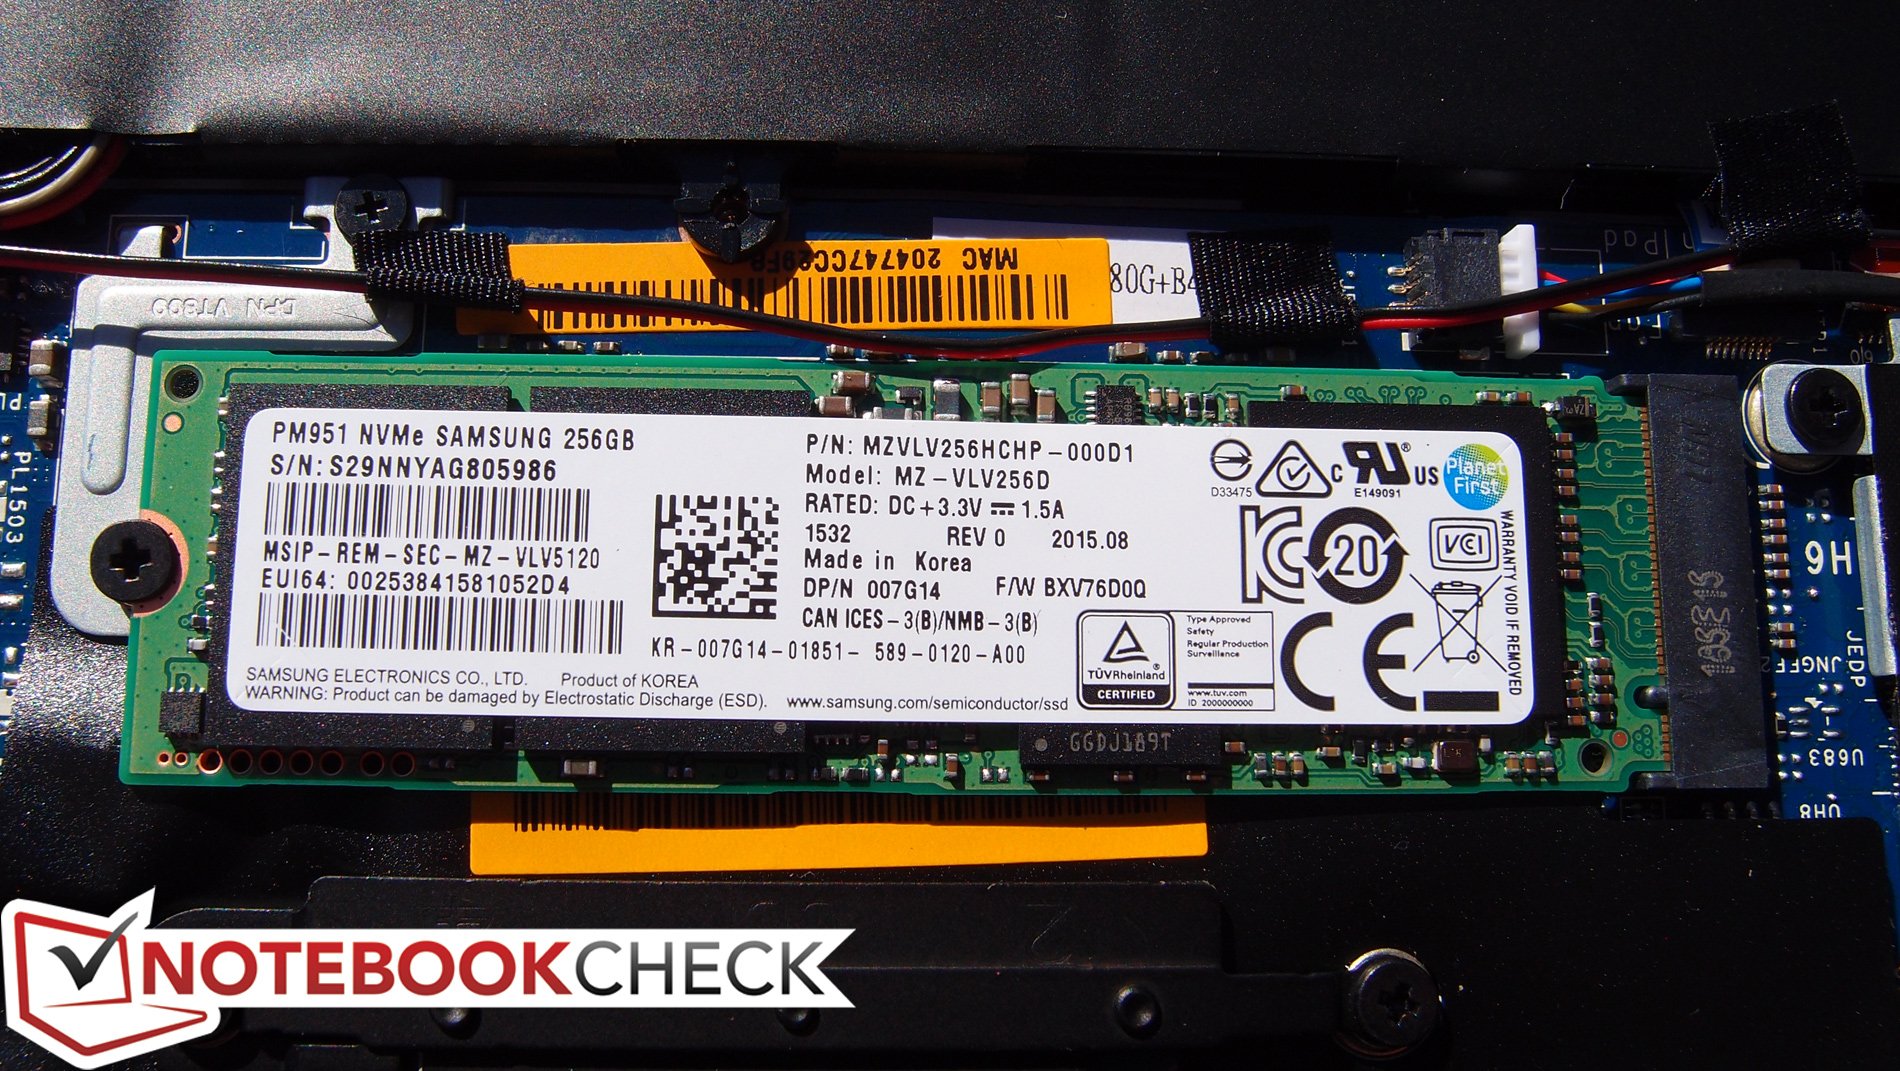
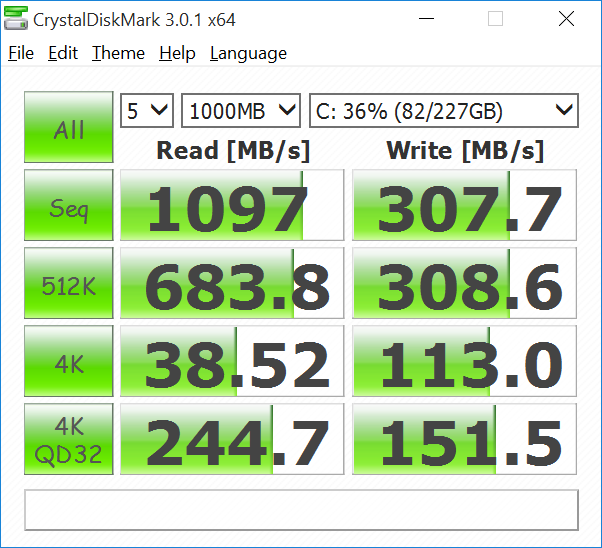
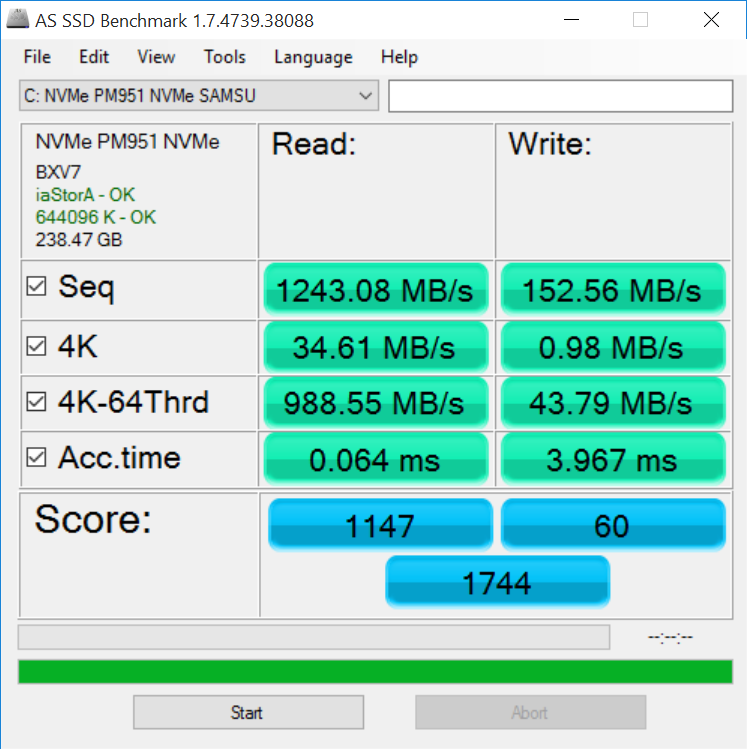
Os reclamos que identificamos são ainda mais insignificantes que aqueles em nossa análise anterior: uma gama de cores um pouco sem brilho para a tela, manutenção e opções de atualização limitadas, e uma garantia de mail-in como padrão. A velocidade de gravação do SSD Samsung também é lenta para a sua classe, e é uma pena ver o retorno do muito criticado auto-brilho CBAC. No entanto, não há outras carências explícitas evidentes, mesmo depois de nossos procedimentos de avaliação e análise intensivos.
Então, será este o ideal a possuir? Cada um dos concorrentes explorados nesta análise provavelmente satisfaria a quase qualquer consumidor, porém exigente, mas o Dell XPS 13-9350, sem dúvida continua a ser o design de mais vanguarda e melhor equilíbrio global entre portabilidade, poder e valor.
Esta é uma versão reduzida da análise original. Você pode ler a análise completa em inglês aqui.
Dell XPS 13-9350
-
02/16/2016 v5(old)
Steve Schardein
Pricecompare
