 Deutsch
 English
 Español
 Français
 Italiano
 Nederlands
 Polski
 Português
 Русский
 Türkçe
 Svenska
 Chinese
 Magyar
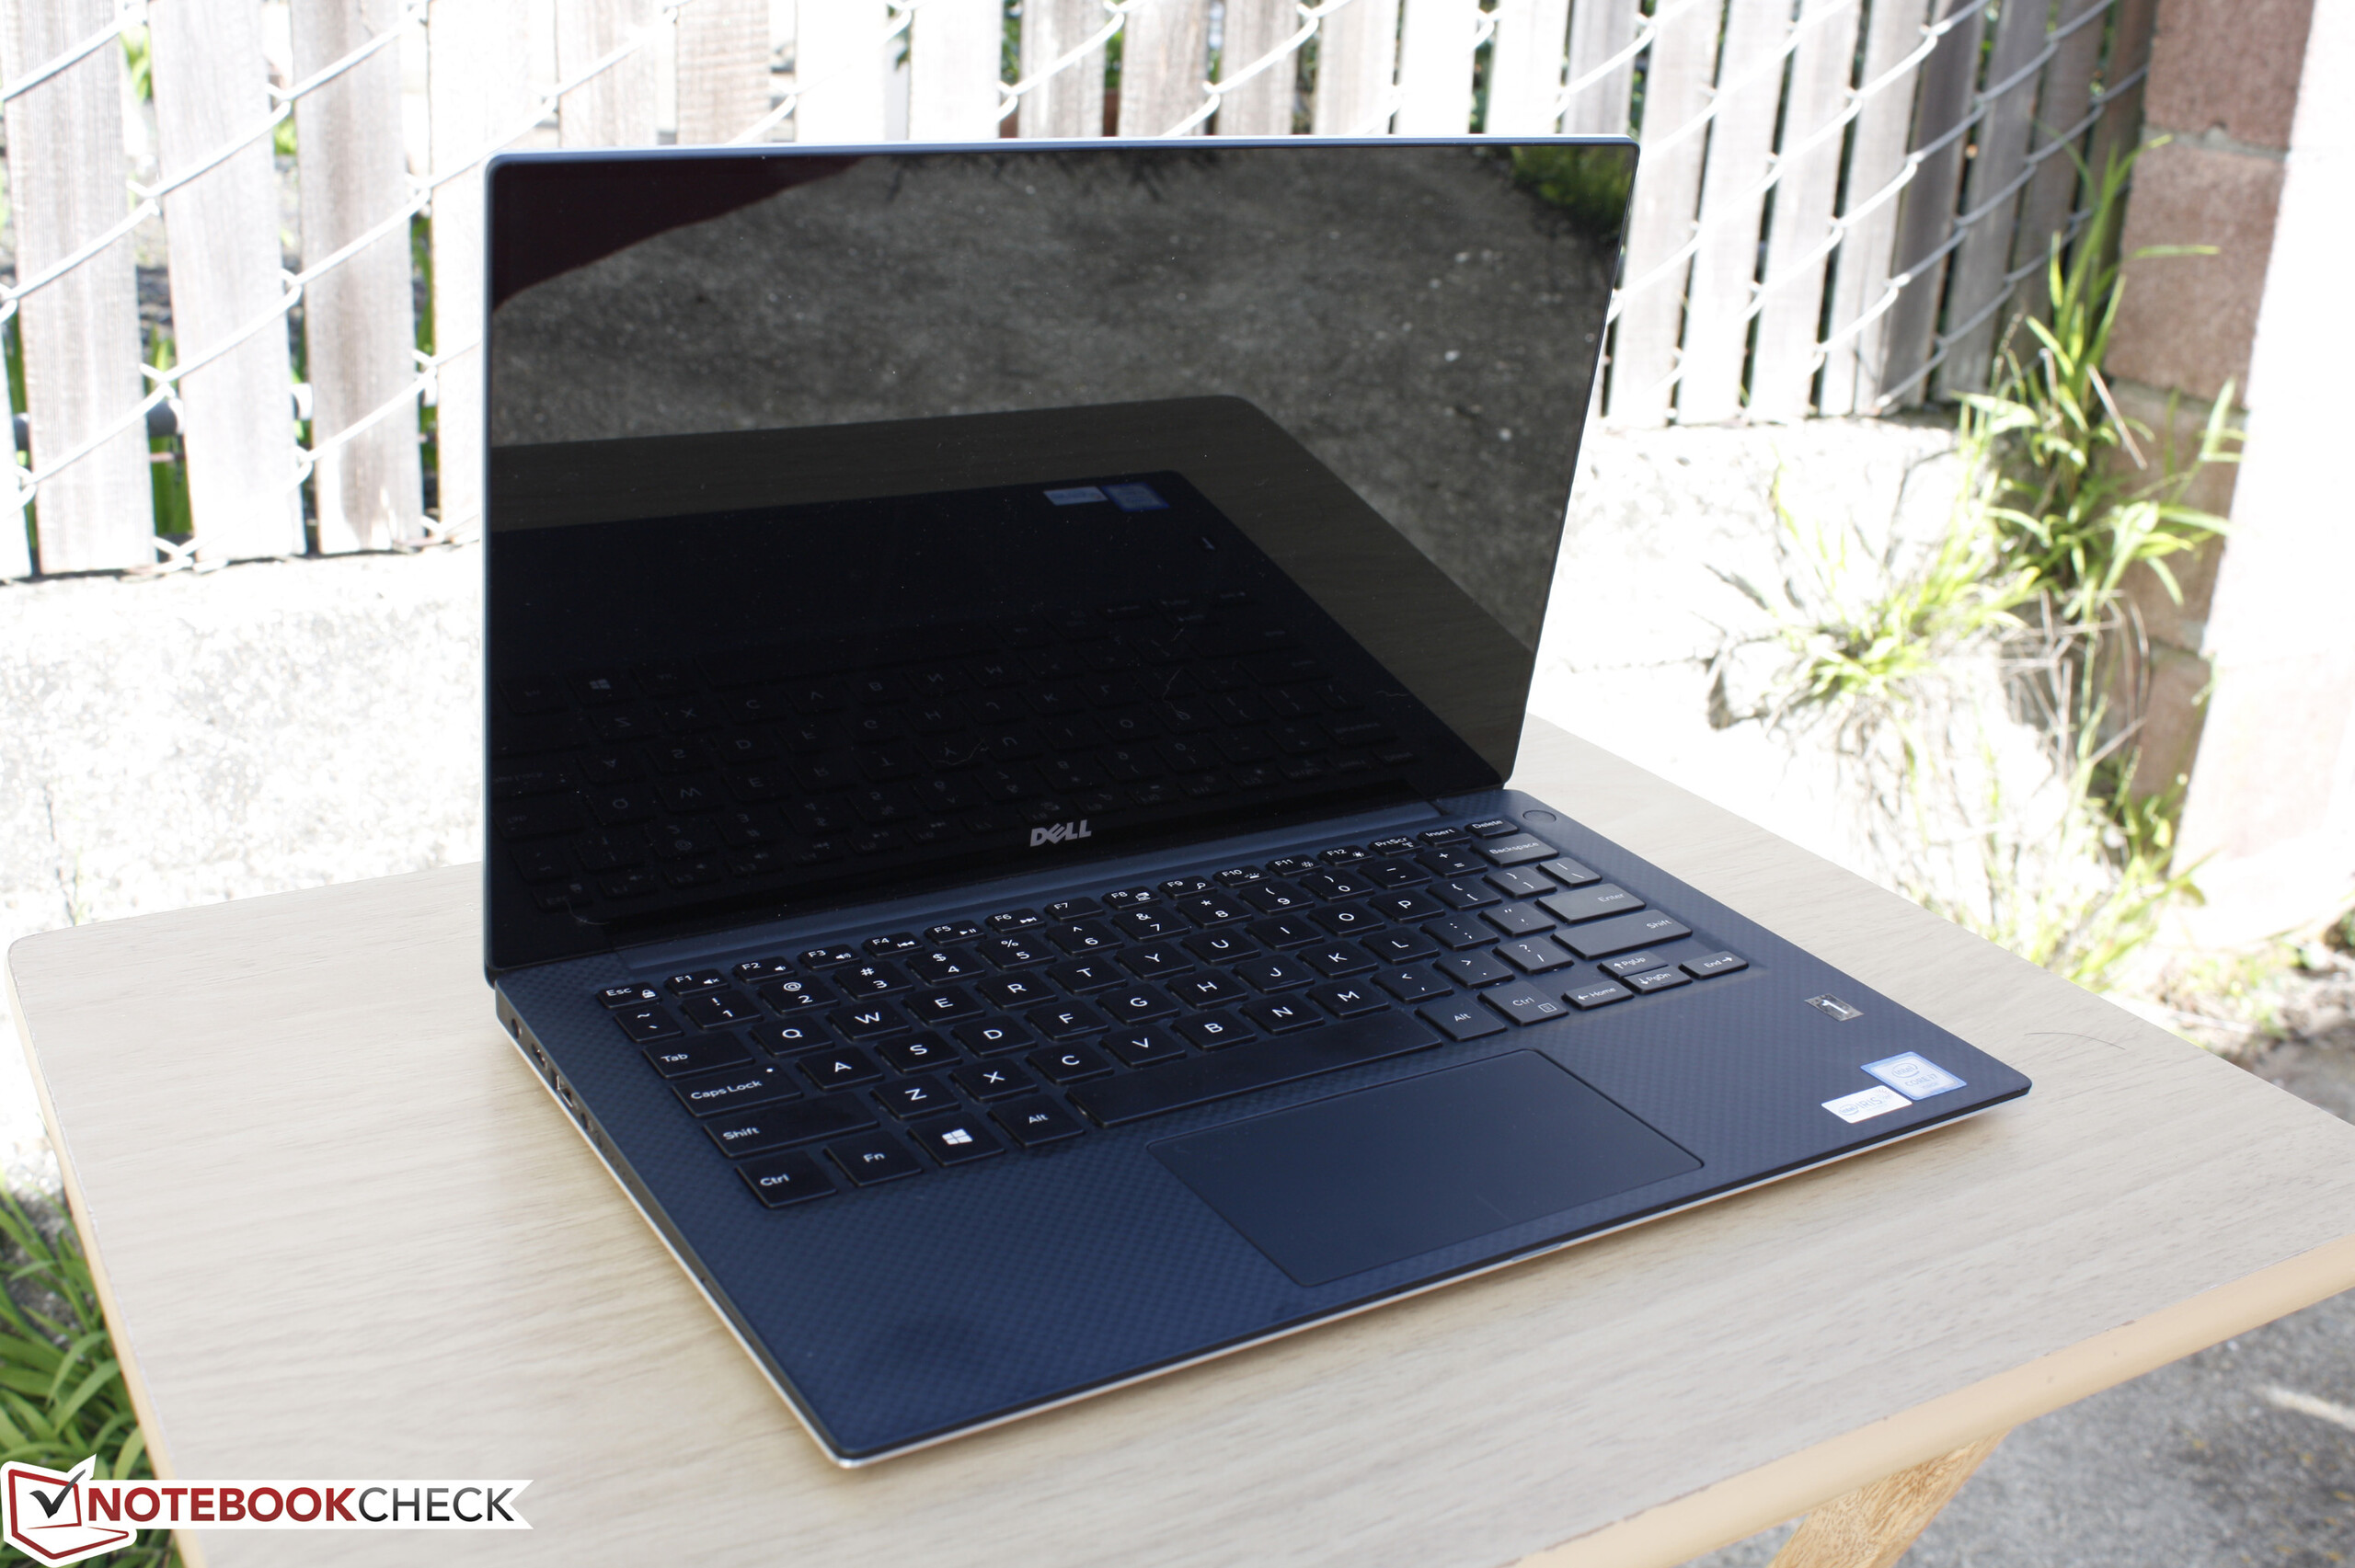
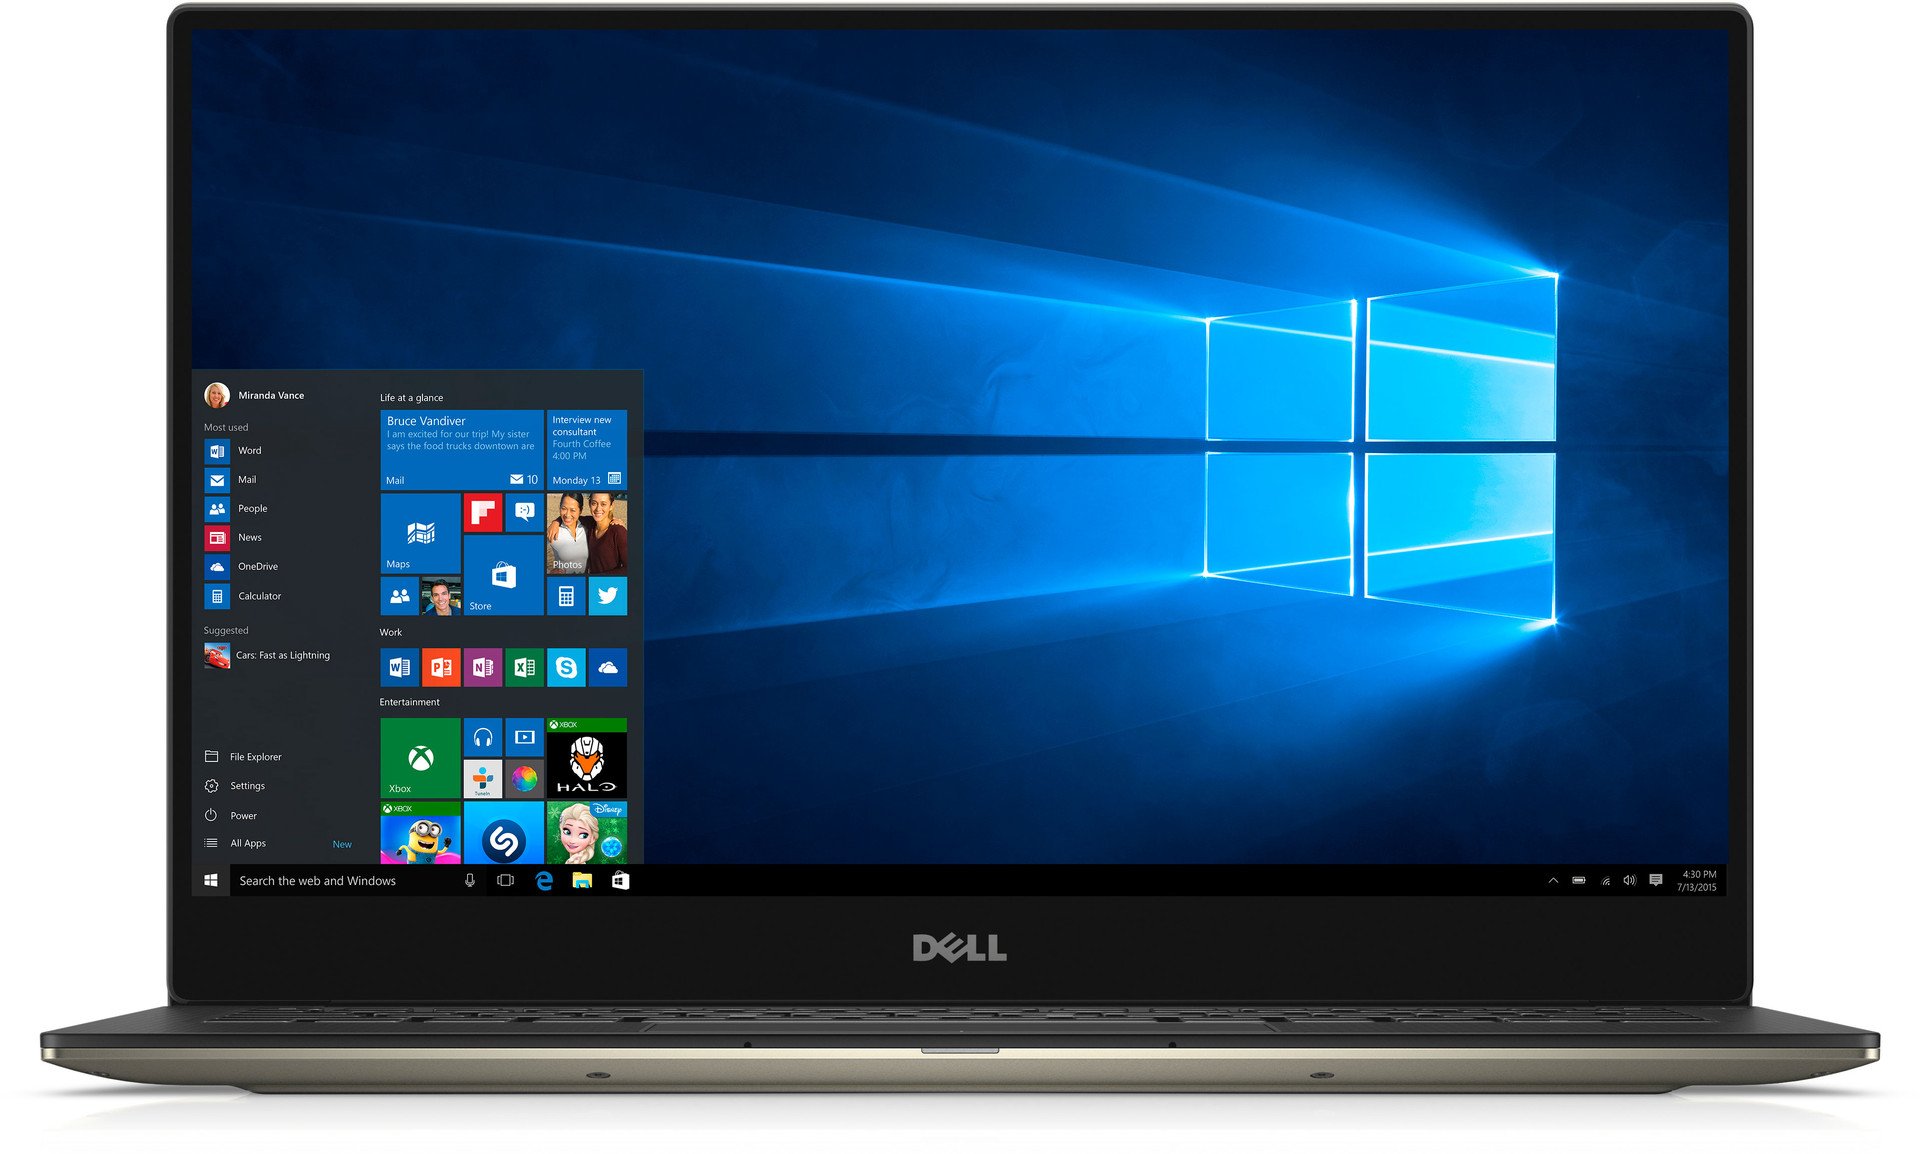
Breve Análise do Ultrabook Dell XPS 13 9350 (i7-6560U, QHD+)
| |||||||||||||||||||||||||
iluminação: 92 %
iluminação com acumulador: 307.5 cd/m²
Contraste: 1486:1 (Preto: 0.207 cd/m²)
ΔE Color 4.18 | 0.5-29.43 Ø5
ΔE Greyscale 4.94 | 0.57-98 Ø5.3
92% sRGB (Argyll 1.6.3 3D)
59% AdobeRGB 1998 (Argyll 1.6.3 3D)
65.4% AdobeRGB 1998 (Argyll 2.2.0 3D)
92.3% sRGB (Argyll 2.2.0 3D)
63.6% Display P3 (Argyll 2.2.0 3D)
Gamma: 2.31
| Dell XPS 13 9350 WQXGA 13.30, 3200x1800 | HP ProBook 430 G3 P5T00ES 13.30, 1366x768 | Asus Zenbook UX303UB-DH74T 13.30, 3200x1800 | Apple MacBook Air 13 inch 2015-03 13.30, 1440x900 | Lenovo Yoga 900-13ISK 80MK 13.30, 3200x1800 | HP Spectre x360 13-4104ng 13.30, 2560x1440 | |
|---|---|---|---|---|---|---|
| Display | -43% | -5% | -36% | -2% | 3% | |
| Display P3 Coverage | 63.6 | 35.87 -44% | 60.9 -4% | 40.1 -37% | 63.2 -1% | 66.8 5% |
| sRGB Coverage | 92.3 | 54 -41% | 85.4 -7% | 59.8 -35% | 88.7 -4% | 92.8 1% |
| AdobeRGB 1998 Coverage | 65.4 | 37.06 -43% | 62.5 -4% | 41.51 -37% | 64.9 -1% | 67.3 3% |
| Response Times | -9% | -5% | 24% | 45% | ||
| Response Time Grey 50% / Grey 80% * | 50.8 ? | 54.4 ? -7% | 44.4 ? 13% | 38.8 ? 24% | 24 ? 53% | |
| Response Time Black / White * | 29.6 ? | 32.8 ? -11% | 36 ? -22% | 22.4 ? 24% | 19 ? 36% | |
| PWM Frequency | 192 ? | 1389 | 1316 | |||
| Screen | -92% | -56% | -17% | -33% | -9% | |
| Brightness middle | 307.5 | 212 -31% | 291.4 -5% | 329 7% | 319.8 4% | 324 5% |
| Brightness | 297 | 205 -31% | 270 -9% | 310 4% | 302 2% | 324 9% |
| Brightness Distribution | 92 | 90 -2% | 84 -9% | 82 -11% | 88 -4% | 90 -2% |
| Black Level * | 0.207 | 0.71 -243% | 0.954 -361% | 0.405 -96% | 0.835 -303% | 0.34 -64% |
| Contrast | 1486 | 299 -80% | 305 -79% | 812 -45% | 383 -74% | 953 -36% |
| Colorchecker dE 2000 * | 4.18 | 12.06 -189% | 4.63 -11% | 3.96 5% | 2.68 36% | 4.36 -4% |
| Colorchecker dE 2000 max. * | 7.84 | 7.51 4% | ||||
| Greyscale dE 2000 * | 4.94 | 13.41 -171% | 5.65 -14% | 3.51 29% | 2.35 52% | 4.62 6% |
| Gamma | 2.31 95% | 2.41 91% | 2.16 102% | 3.83 57% | 2.09 105% | 2.18 101% |
| CCT | 7645 85% | 15382 42% | 6320 103% | 6711 97% | 6975 93% | 6857 95% |
| Color Space (Percent of AdobeRGB 1998) | 59 | 34.3 -42% | 55.2 -6% | 38.4 -35% | 57 -3% | 60 2% |
| Color Space (Percent of sRGB) | 92 | 54.2 -41% | 85.2 -7% | 59.8 -35% | 88 -4% | 93 1% |
| Total Average (Program / Settings) | -48% /
-70% | -22% /
-38% | -27% /
-22% | -4% /
-18% | 13% /
1% |
* ... smaller is better
Display Response Times
| ↔ Response Time Black to White | ||
|---|---|---|
| 29.6 ms ... rise ↗ and fall ↘ combined | ↗ 6 ms rise | 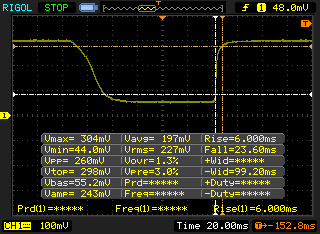 |
| ↘ 23.6 ms fall | ||
| The screen shows relatively slow response rates in our tests and may be too slow for gamers. In comparison, all tested devices range from 0.1 (minimum) to 240 (maximum) ms. » 76 % of all devices are better. This means that the measured response time is worse than the average of all tested devices (21.5 ms). | ||
| ↔ Response Time 50% Grey to 80% Grey | ||
| 50.8 ms ... rise ↗ and fall ↘ combined | ↗ 18.4 ms rise | 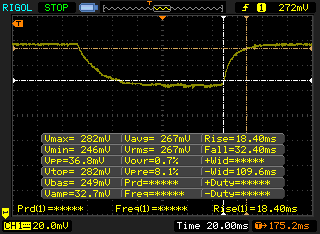 |
| ↘ 32.4 ms fall | ||
| The screen shows slow response rates in our tests and will be unsatisfactory for gamers. In comparison, all tested devices range from 0.2 (minimum) to 636 (maximum) ms. » 85 % of all devices are better. This means that the measured response time is worse than the average of all tested devices (33.7 ms). | ||
Screen Flickering / PWM (Pulse-Width Modulation)
| Screen flickering / PWM not detected | 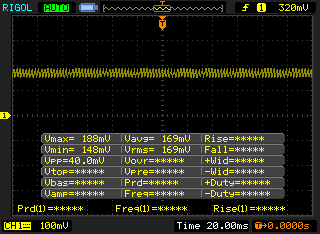 | ||
In comparison: 53 % of all tested devices do not use PWM to dim the display. If PWM was detected, an average of 17924 (minimum: 5 - maximum: 3846000) Hz was measured. | |||

| Cinebench R15 | |
| CPU Single 64Bit (sort by value) | |
| Dell XPS 13 9350 WQXGA | |
| Eurocom Shark 4 | |
| Microsoft Surface Pro 4 Core i7 | |
| Asus Zenbook UX303UB-DH74T | |
| Microsoft Surface Book Core i5 | |
| Lenovo ThinkPad T560-20FH001FGE | |
| CPU Multi 64Bit (sort by value) | |
| Dell XPS 13 9350 WQXGA | |
| Eurocom Shark 4 | |
| Microsoft Surface Pro 4 Core i7 | |
| Asus Zenbook UX303UB-DH74T | |
| Microsoft Surface Book Core i5 | |
| Lenovo ThinkPad T560-20FH001FGE | |
| Cinebench R11.5 | |
| CPU Single 64Bit (sort by value) | |
| Dell XPS 13 9350 WQXGA | |
| Eurocom Shark 4 | |
| Microsoft Surface Pro 4 Core i7 | |
| Asus Zenbook UX303UB-DH74T | |
| Microsoft Surface Book Core i5 | |
| Lenovo ThinkPad T560-20FH001FGE | |
| CPU Multi 64Bit (sort by value) | |
| Dell XPS 13 9350 WQXGA | |
| Eurocom Shark 4 | |
| Microsoft Surface Pro 4 Core i7 | |
| Asus Zenbook UX303UB-DH74T | |
| Microsoft Surface Book Core i5 | |
| Lenovo ThinkPad T560-20FH001FGE | |
| Cinebench R10 | |
| Rendering Single CPUs 64Bit (sort by value) | |
| Eurocom Shark 4 | |
| Microsoft Surface Pro 4 Core i7 | |
| Microsoft Surface Book Core i5 | |
| Lenovo ThinkPad T560-20FH001FGE | |
| Rendering Multiple CPUs 64Bit (sort by value) | |
| Eurocom Shark 4 | |
| Microsoft Surface Pro 4 Core i7 | |
| Microsoft Surface Book Core i5 | |
| Lenovo ThinkPad T560-20FH001FGE | |
| wPrime 2.10 - 1024m (sort by value) | |
| Dell XPS 13 9350 WQXGA | |
| Eurocom Shark 4 | |
| Microsoft Surface Pro 4 Core i7 | |
| Asus Zenbook UX303UB-DH74T | |
| Microsoft Surface Book Core i5 | |
| Super Pi Mod 1.5 XS 32M - 32M (sort by value) | |
| Dell XPS 13 9350 WQXGA | |
| Eurocom Shark 4 | |
| Microsoft Surface Pro 4 Core i7 | |
| Asus Zenbook UX303UB-DH74T | |
| Microsoft Surface Book Core i5 | |
| Lenovo ThinkPad T560-20FH001FGE | |
* ... smaller is better
| PCMark 7 - Score (sort by value) | |
| Dell XPS 13 9350 WQXGA | |
| Lenovo Yoga 900-13ISK 80MK | |
| Apple MacBook Air 13 inch 2015-03 | |
| Asus Zenbook UX303UB-DH74T | |
| HP ProBook 430 G3 P5T00ES | |
| PCMark 8 | |
| Home Score Accelerated v2 (sort by value) | |
| Dell XPS 13 9350 WQXGA | |
| Lenovo Yoga 900-13ISK 80MK | |
| Apple MacBook Air 13 inch 2015-03 | |
| Asus Zenbook UX303UB-DH74T | |
| HP ProBook 430 G3 P5T00ES | |
| Work Score Accelerated v2 (sort by value) | |
| Dell XPS 13 9350 WQXGA | |
| Lenovo Yoga 900-13ISK 80MK | |
| Apple MacBook Air 13 inch 2015-03 | |
| Asus Zenbook UX303UB-DH74T | |
| HP ProBook 430 G3 P5T00ES | |
| Creative Score Accelerated v2 (sort by value) | |
| Dell XPS 13 9350 WQXGA | |
| Lenovo Yoga 900-13ISK 80MK | |
| Apple MacBook Air 13 inch 2015-03 | |
| Asus Zenbook UX303UB-DH74T | |
| HP ProBook 430 G3 P5T00ES | |
| PCMark 7 Score | 5672 pontos | |
| PCMark 8 Home Score Accelerated v2 | 2928 pontos | |
| PCMark 8 Creative Score Accelerated v2 | 4470 pontos | |
| PCMark 8 Work Score Accelerated v2 | 3438 pontos | |
Ajuda | ||
| Dell XPS 13 9350 WQXGA Iris Graphics 540, 6560U, Samsung PM951 NVMe 512 GB | HP ProBook 430 G2 L3Q21EA HD Graphics 5500, 5200U, Samsung SSD PM851 128 GB MZ7TE128HMGR | Asus Zenbook UX303UB-DH74T GeForce 940M, 6500U, CUK Cyclone SSD 1TB | Apple MacBook Air 13 inch 2015-03 HD Graphics 6000, 5650U, Apple SSD SD0256F | Lenovo Yoga 900-13ISK 80MK HD Graphics 520, 6500U, Samsung SSD PM871 MZNLN512HCJH | Dell XPS 13-9333 HD Graphics 4400, 4200U, Liteonit LMT-128M6M | |
|---|---|---|---|---|---|---|
| AS SSD | -74% | -63% | -68% | -42% | -63% | |
| Copy Game MB/s | 753 | 110.3 -85% | 392.8 -48% | 479.3 -36% | 298.7 -60% | |
| Copy Program MB/s | 271.8 | 105 -61% | 233.7 -14% | 245 -10% | 249.6 -8% | |
| Copy ISO MB/s | 1041 | 136.3 -87% | 382.5 -63% | 643 -38% | 364.5 -65% | |
| Score Total | 3158 | 838 -73% | 882 -72% | 2383 -25% | 1129 -64% | 902 -71% |
| Score Write | 664 | 218 -67% | 373 -44% | 463 -30% | 429 -35% | 337 -49% |
| Score Read | 1679 | 415 -75% | 333 -80% | 1281 -24% | 458 -73% | 373 -78% |
| Access Time Write * | 0.031 | 0.042 -35% | 0.051 -65% | 0.155 -400% | 0.039 -26% | 0.065 -110% |
| Access Time Read * | 0.046 | 0.141 -207% | 0.14 -204% | 0.171 -272% | 0.054 -17% | 0.078 -70% |
| 4K-64 Write | 492 | 111.1 -77% | 261.1 -47% | 338.9 -31% | 303 -38% | 249.5 -49% |
| 4K-64 Read | 1497 | 342.6 -77% | 256.9 -83% | 1140 -24% | 374.8 -75% | 294.2 -80% |
| 4K Write | 116.5 | 93.5 -20% | 71.3 -39% | 23.73 -80% | 80.6 -31% | 57.6 -51% |
| 4K Read | 38.29 | 26.84 -30% | 25.99 -32% | 19.16 -50% | 32.29 -16% | 29.32 -23% |
| Seq Write | 559 | 130.5 -77% | 409.8 -27% | 1001 79% | 454.6 -19% | 302.2 -46% |
| Seq Read | 1442 | 459 -68% | 505 -65% | 1212 -16% | 505 -65% | 492.7 -66% |
* ... smaller is better

| 3DMark | |
| 1920x1080 Fire Strike Score (sort by value) | |
| Dell XPS 13 9350 WQXGA | |
| Microsoft Surface Pro 4 Core i7 | |
| MSI GT72 | |
| HP Spectre x360 15-ap011dx | |
| HP Spectre x2 12-a003ng K3D42EA | |
| 1280x720 Cloud Gate Standard Score (sort by value) | |
| Dell XPS 13 9350 WQXGA | |
| Microsoft Surface Pro 4 Core i7 | |
| MSI GT72 | |
| HP Spectre x360 15-ap011dx | |
| HP Spectre x2 12-a003ng K3D42EA | |
| Fujitsu Lifebook E544 | |
| 1280x720 Ice Storm Standard Score (sort by value) | |
| Dell XPS 13 9350 WQXGA | |
| Microsoft Surface Pro 4 Core i7 | |
| MSI GT72 | |
| HP Spectre x360 15-ap011dx | |
| HP Spectre x2 12-a003ng K3D42EA | |
| Fujitsu Lifebook E544 | |
| Fire Strike Extreme Graphics (sort by value) | |
| Dell XPS 13 9350 WQXGA | |
| Microsoft Surface Pro 4 Core i7 | |
| HP Spectre x360 15-ap011dx | |
| Fire Strike Extreme Combined (sort by value) | |
| Dell XPS 13 9350 WQXGA | |
| Microsoft Surface Pro 4 Core i7 | |
| HP Spectre x360 15-ap011dx | |
| 1280x720 Cloud Gate Standard Graphics (sort by value) | |
| Dell XPS 13 9350 WQXGA | |
| Microsoft Surface Pro 4 Core i7 | |
| MSI GT72 | |
| HP Spectre x360 15-ap011dx | |
| HP Spectre x2 12-a003ng K3D42EA | |
| Fujitsu Lifebook E544 | |
| 3DMark 11 Performance | 2039 pontos | |
| 3DMark Ice Storm Standard Score | 58948 pontos | |
| 3DMark Cloud Gate Standard Score | 6730 pontos | |
| 3DMark Fire Strike Score | 1114 pontos | |
| 3DMark Fire Strike Extreme Score | 503 pontos | |
Ajuda | ||
| Tomb Raider - 1366x768 Normal Preset AA:FX AF:4x (sort by value) | |
| Dell XPS 13 9350 WQXGA | |
| Asus Zenbook UX303UB-DH74T | |
| Lenovo U31-70 80M5003EGE | |
| Asus Zenbook UX303UA-FN121T | |
| Lenovo IdeaPad Miix 700 | |
| Lenovo ThinkPad L440 20AT004QGE | |
| baixo | média | alto | ultra | |
| Tomb Raider (2013) | 85 | 49.2 | 33.3 | |
| Metro: Last Light (2013) | 28.1 | 23 | 15.8 | |
| Thief (2014) | 23.3 | 15.7 | 13.7 | |
| Metal Gear Solid V (2015) | 48.6 | 28.9 | 13.9 |
| Dell XPS 13 9350 WQXGA Iris Graphics 540, 6560U, Samsung PM951 NVMe 512 GB | HP ProBook 430 G3 P5T00ES HD Graphics 520, 6200U, Hitachi Travelstar Z7K500 HTS725050A7E630 | Asus Zenbook UX303UB-DH74T GeForce 940M, 6500U, CUK Cyclone SSD 1TB | Apple MacBook Air 13 inch 2015-03 HD Graphics 6000, 5650U, Apple SSD SD0256F | Lenovo Yoga 900-13ISK 80MK HD Graphics 520, 6500U, Samsung SSD PM871 MZNLN512HCJH | HP Spectre x360 13-4104ng HD Graphics 520, 6200U, Samsung SSD PM851 256 GB MZNTE256HMHP | |
|---|---|---|---|---|---|---|
| Noise | -7% | -11% | -15% | -6% | -10% | |
| off / environment * | 29.2 | |||||
| Idle Minimum * | 29.2 | 29.8 -2% | 29.8 -2% | 29.2 -0% | 29.7 -2% | 29.6 -1% |
| Idle Average * | 29.2 | 29.8 -2% | 29.8 -2% | 29.2 -0% | 29.8 -2% | 29.6 -1% |
| Idle Maximum * | 29.2 | 30.9 -6% | 29.8 -2% | 29.2 -0% | 30 -3% | 34.6 -18% |
| Load Average * | 31.4 | 33.3 -6% | 37.4 -19% | 40.2 -28% | 32 -2% | 34.7 -11% |
| Load Maximum * | 31.4 | 37.4 -19% | 40.3 -28% | 46.3 -47% | 38.5 -23% | 37.9 -21% |
* ... smaller is better
Barulho
| Ocioso |
| 29.2 / 29.2 / 29.2 dB |
| Carga |
| 31.4 / 31.4 dB |
 | ||
30 dB silencioso 40 dB(A) audível 50 dB(A) ruidosamente alto |
||
min: | ||
(±) The maximum temperature on the upper side is 41.4 °C / 107 F, compared to the average of 35.9 °C / 97 F, ranging from 21.4 to 59 °C for the class Subnotebook.
(-) The bottom heats up to a maximum of 49.2 °C / 121 F, compared to the average of 39.4 °C / 103 F
(+) In idle usage, the average temperature for the upper side is 26.7 °C / 80 F, compared to the device average of 30.7 °C / 87 F.
(+) The palmrests and touchpad are cooler than skin temperature with a maximum of 28.7 °C / 83.7 F and are therefore cool to the touch.
(±) The average temperature of the palmrest area of similar devices was 28.3 °C / 82.9 F (-0.4 °C / -0.8 F).
| desligado | |
| Ocioso | |
| Carga |
|
| Dell XPS 13 9350 WQXGA 56 Wh | HP ProBook 430 G3 P5T00ES 44 Wh | Asus Zenbook UX303UB-DH74T 50 Wh | Apple MacBook Air 13 inch 2015-03 54 Wh | Lenovo Yoga 900-13ISK 80MK 66 Wh | HP Spectre x360 13-4104ng 56 Wh | |
|---|---|---|---|---|---|---|
| Battery Runtime | -4% | -3% | 78% | 23% | 61% | |
| Reader / Idle | 604 | 449 -26% | 617 2% | 1572 160% | 844 40% | |
| WiFi v1.3 | 311 | 377 21% | 341 10% | 620 99% | 403 30% | 500 61% |
| Load | 128 | 118 -8% | 103 -20% | 97 -24% | 128 0% |
Pro
Contra
Alguns dos melhores aspectos do XPS 13 além de seu extraordinário tamanho pequeno, incluem ventoinha silenciosas e tela de alta qualidade. O Core i7-6560U e Iris Graphics 540 integrado impulsionam o sistema ainda mais, sem aumentar necessariamente o ruído das ventoinhas, o que é sua própria faca de dois gumes. Embora o desempenho tenha melhorado, as temperaturas são muito mais alta até o ponto onde a CPU potencialmente se afogará quando estiver rodando jogos. A duração da bateria, em particular, é afetada pela tela QHD+ de resolução mais alta e CPU mais potente. o desempenho geral está um passo atrás do Core i7-6650U no Surface Pro 4, especialmente em termos de desempenho gráfico.
Os usuários que não precisem da mais poderosa Iris Graphics 540 sobre a Graphics 520 podem querer optar por um SKU mais econômico para durações de bateria mais longas. Se o poder da GPU for de maior importância, então pode valer a pena investir no Zenbook UX303 um pouco maior, e sua discreta placa de vídeo Nvidia por um maior retorno de desempenho sem sacrificar muito na área da mobilidade.
Esta é uma versão reduzida da análise original. Você pode ler a análise completa em inglês aqui
Dell XPS 13 9350 WQXGA
-
02/26/2016 v5(old)
Allen Ngo
Pricecompare
