 Deutsch
 English
 Español
 Français
 Italiano
 Nederlands
 Polski
 Português
 Русский
 Türkçe
 Svenska
 Chinese
 Magyar
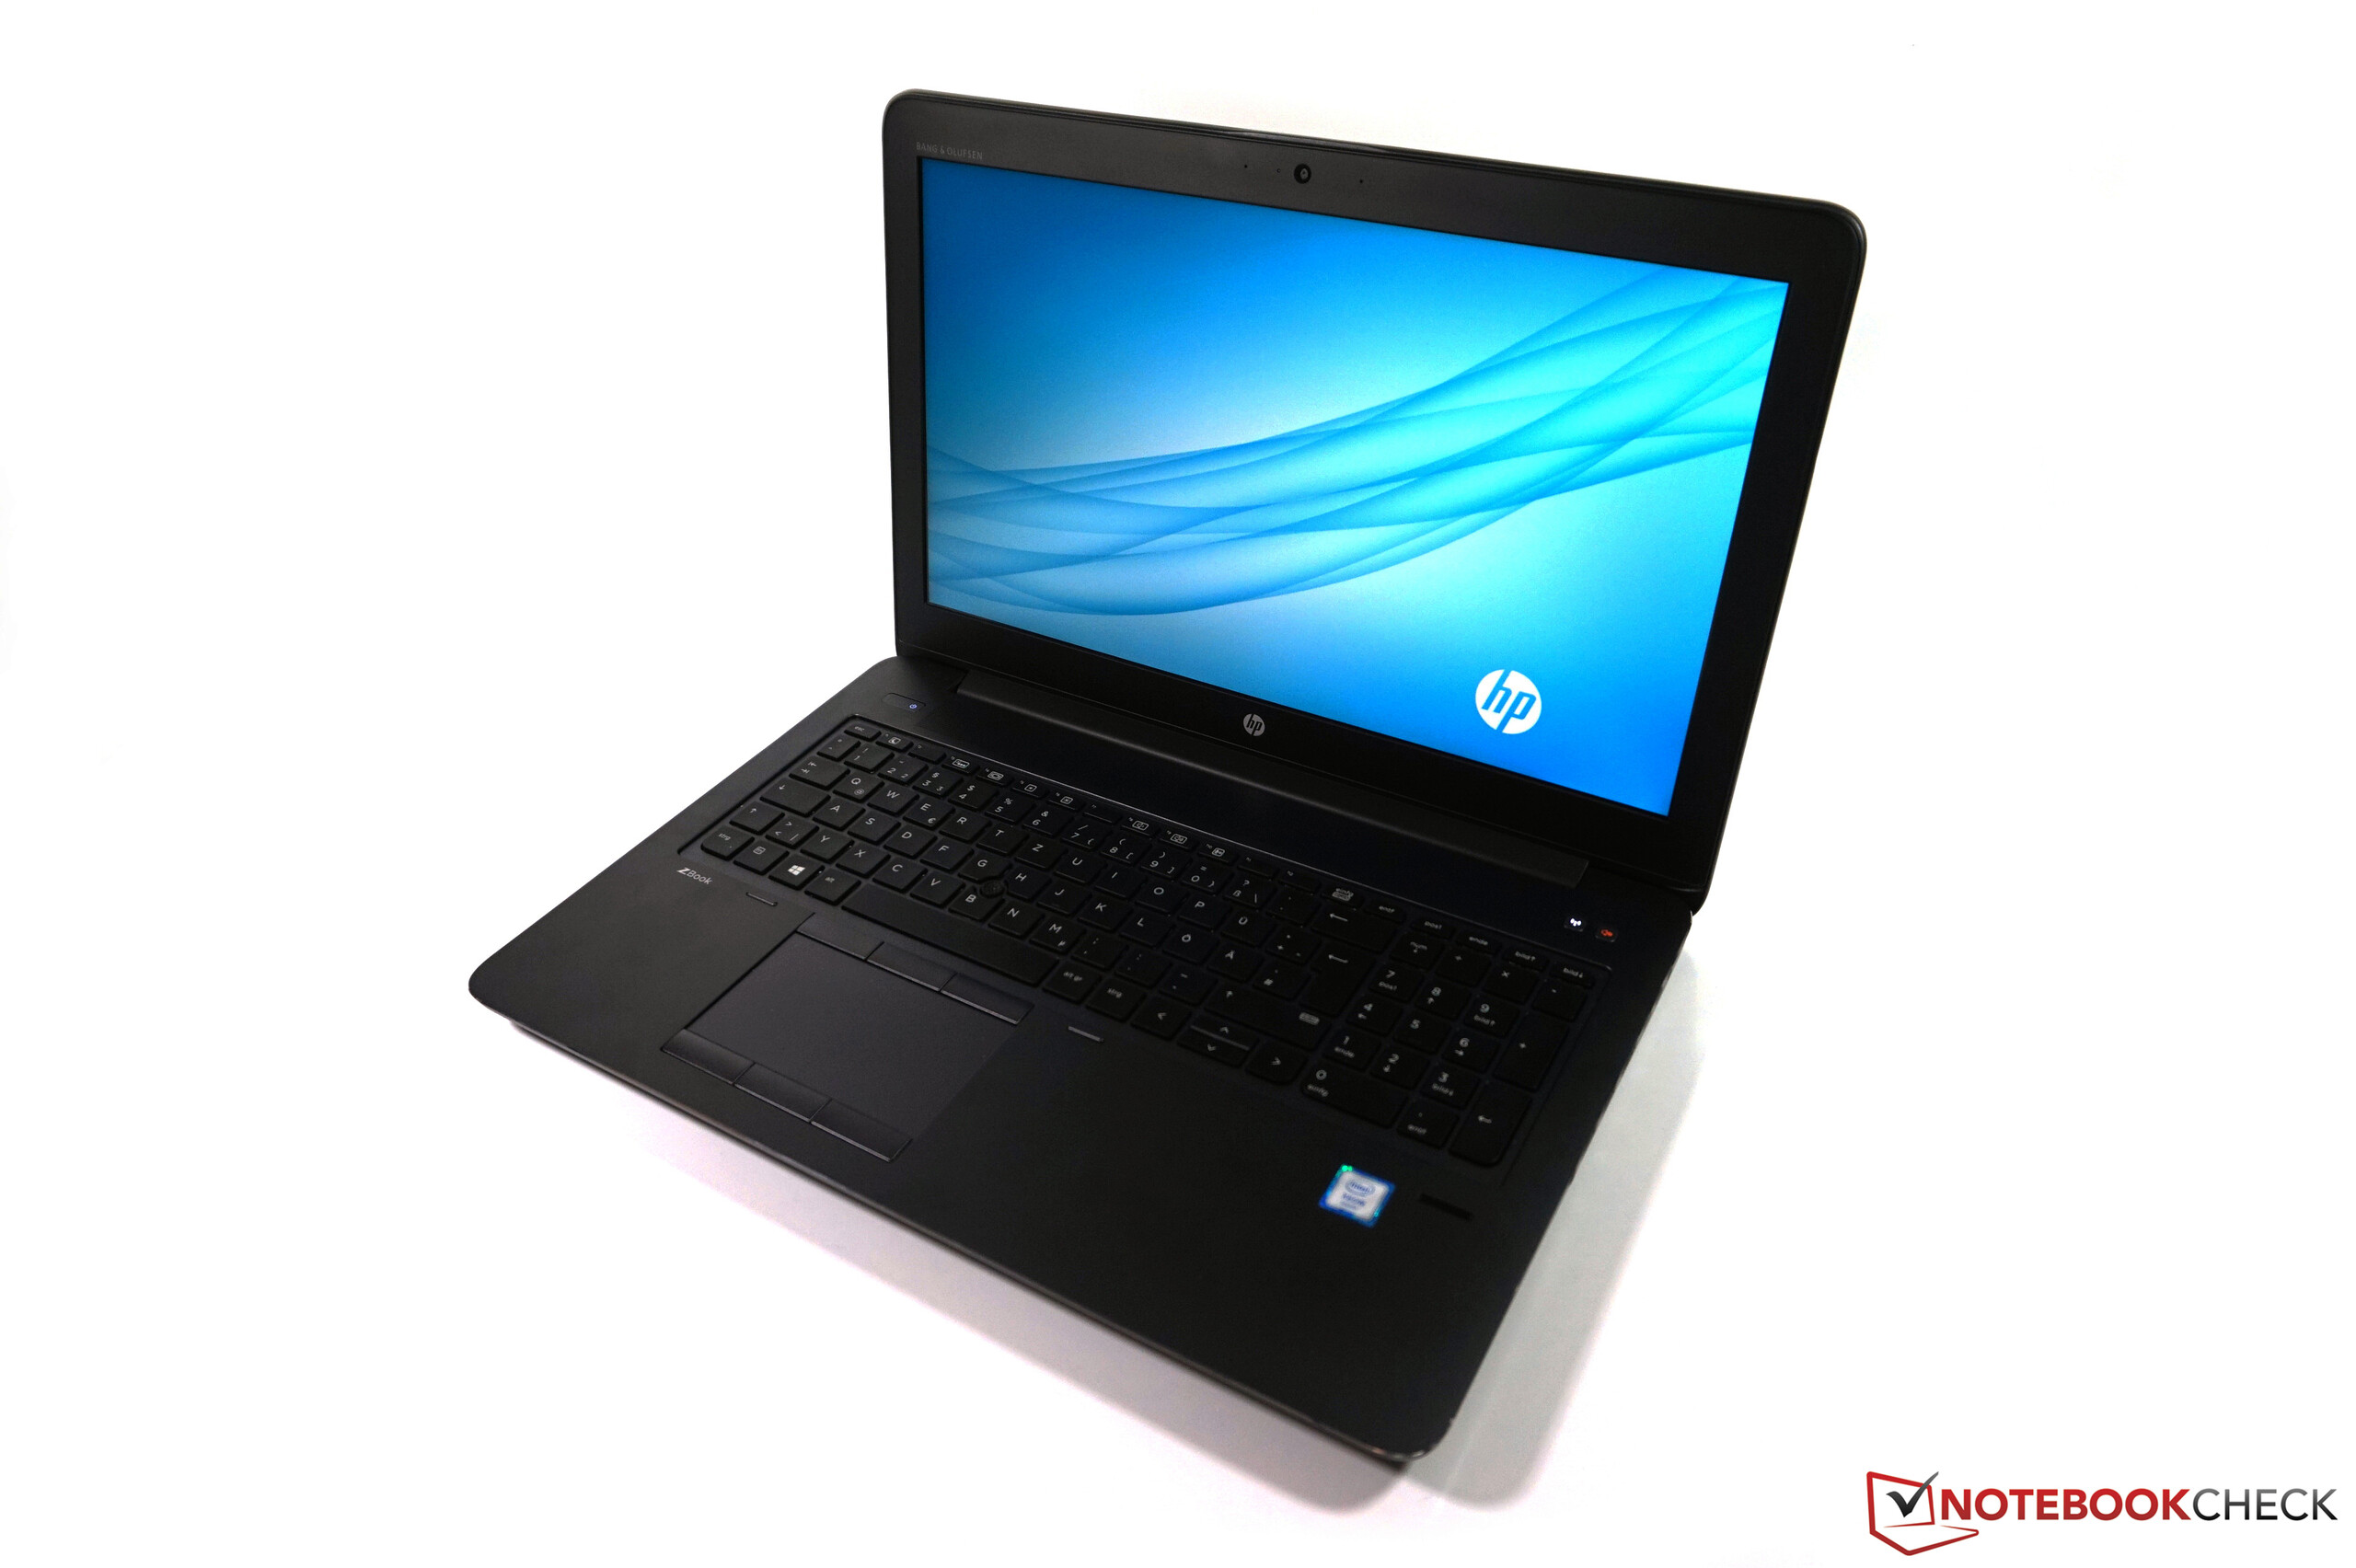
Breve Análise do Workstation HP ZBook 15 G3
| |||||||||||||||||||||||||
iluminação: 85 %
iluminação com acumulador: 306 cd/m²
Contraste: 900:1 (Preto: 0.34 cd/m²)
ΔE Color 5.1 | 0.5-29.43 Ø5
ΔE Greyscale 7.4 | 0.57-98 Ø5.3
95% sRGB (Argyll 1.6.3 3D)
63% AdobeRGB 1998 (Argyll 1.6.3 3D)
69% AdobeRGB 1998 (Argyll 2.2.0 3D)
95.5% sRGB (Argyll 2.2.0 3D)
66.8% Display P3 (Argyll 2.2.0 3D)
Gamma: 2.37
| HP ZBook 15 G3 Samsung SDC5344, UWVA-IPS, 1920x1080 | Lenovo ThinkPad P50 LP156WF6-SPK1, IPS, 1920x1080 | Dell Precision 5510 SHP143E, 7PHPT_LQ156D1, IGZO LED, 3840x2160 | Dell XPS 15 2016 9550 Sharp SHP1453 LQ156M1 Dell PN: 1203M, IPS, 1920x1080 | HP ZBook 15 G2 Samsung SDC5344, IPS LED, 1920x1080 | |
|---|---|---|---|---|---|
| Display | -40% | 27% | 3% | 2% | |
| Display P3 Coverage | 66.8 | 39.13 -41% | 88.4 32% | 68.8 3% | 68.5 3% |
| sRGB Coverage | 95.5 | 58.5 -39% | 100 5% | 97.9 3% | 97.3 2% |
| AdobeRGB 1998 Coverage | 69 | 40.45 -41% | 99.5 44% | 70.7 2% | 70.7 2% |
| Response Times | 21% | 0% | 19% | ||
| Response Time Grey 50% / Grey 80% * | 54 ? | 46 ? 15% | 56.4 ? -4% | 62 ? -15% | |
| Response Time Black / White * | 35.6 ? | 26 ? 27% | 34 ? 4% | 40 ? -12% | |
| PWM Frequency | 198 ? | 362 ? 83% | |||
| Screen | -3% | 17% | 18% | -2% | |
| Brightness middle | 306 | 263 -14% | 391 28% | 399 30% | 309 1% |
| Brightness | 289 | 236 -18% | 361 25% | 394 36% | 289 0% |
| Brightness Distribution | 85 | 78 -8% | 87 2% | 89 5% | 84 -1% |
| Black Level * | 0.34 | 0.34 -0% | 0.4 -18% | 0.24 29% | 0.47 -38% |
| Contrast | 900 | 774 -14% | 978 9% | 1663 85% | 657 -27% |
| Colorchecker dE 2000 * | 5.1 | 2.35 54% | 4.85 5% | 5.95 -17% | 3.82 25% |
| Colorchecker dE 2000 max. * | 9.9 | ||||
| Greyscale dE 2000 * | 7.4 | 3.33 55% | 4.01 46% | 8.41 -14% | 5.94 20% |
| Gamma | 2.37 93% | 2.38 92% | 2.18 101% | 2.35 94% | 2.16 102% |
| CCT | 7263 89% | 6917 94% | 7340 89% | 7010 93% | 6996 93% |
| Color Space (Percent of AdobeRGB 1998) | 63 | 37 -41% | 96 52% | 64 2% | 63.8 1% |
| Color Space (Percent of sRGB) | 95 | 58 -39% | 100 5% | 98 3% | |
| Total Average (Program / Settings) | -7% /
-7% | 15% /
17% | 13% /
15% | 0% /
-1% |
* ... smaller is better
Display Response Times
| ↔ Response Time Black to White | ||
|---|---|---|
| 35.6 ms ... rise ↗ and fall ↘ combined | ↗ 11.6 ms rise | 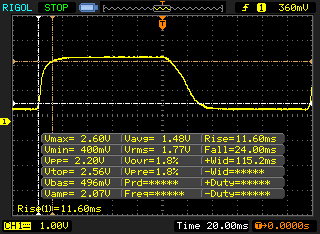 |
| ↘ 24 ms fall | ||
| The screen shows slow response rates in our tests and will be unsatisfactory for gamers. In comparison, all tested devices range from 0.1 (minimum) to 240 (maximum) ms. » 93 % of all devices are better. This means that the measured response time is worse than the average of all tested devices (21.5 ms). | ||
| ↔ Response Time 50% Grey to 80% Grey | ||
| 54 ms ... rise ↗ and fall ↘ combined | ↗ 24.4 ms rise | 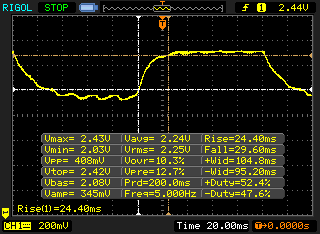 |
| ↘ 29.6 ms fall | ||
| The screen shows slow response rates in our tests and will be unsatisfactory for gamers. In comparison, all tested devices range from 0.2 (minimum) to 636 (maximum) ms. » 89 % of all devices are better. This means that the measured response time is worse than the average of all tested devices (33.7 ms). | ||
Screen Flickering / PWM (Pulse-Width Modulation)
| Screen flickering / PWM detected | 198 Hz | ≤ 95 % brightness setting | 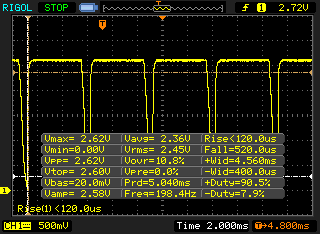 |
The display backlight flickers at 198 Hz (worst case, e.g., utilizing PWM) Flickering detected at a brightness setting of 95 % and below. There should be no flickering or PWM above this brightness setting. The frequency of 198 Hz is relatively low, so sensitive users will likely notice flickering and experience eyestrain at the stated brightness setting and below. In comparison: 53 % of all tested devices do not use PWM to dim the display. If PWM was detected, an average of 17924 (minimum: 5 - maximum: 3846000) Hz was measured. | |||
| Cinebench R15 | |
| CPU Multi 64Bit | |
| Dell Precision 5510 | |
| HP ZBook 15 G3 | |
| MSI WS60-6QJE316H11 | |
| HP ZBook 15 G2 | |
| Lenovo ThinkPad P50 | |
| Dell XPS 15 2016 9550 | |
| CPU Single 64Bit | |
| MSI WS60-6QJE316H11 | |
| HP ZBook 15 G3 | |
| HP ZBook 15 G2 | |
| Dell Precision 5510 | |
| Dell XPS 15 2016 9550 | |
| Lenovo ThinkPad P50 | |
| Cinebench R11.5 | |
| CPU Multi 64Bit | |
| Dell Precision 5510 | |
| HP ZBook 15 G3 | |
| MSI WS60-6QJE316H11 | |
| HP ZBook 15 G2 | |
| Lenovo ThinkPad P50 | |
| Dell XPS 15 2016 9550 | |
| CPU Single 64Bit | |
| MSI WS60-6QJE316H11 | |
| HP ZBook 15 G3 | |
| HP ZBook 15 G2 | |
| Dell Precision 5510 | |
| Dell XPS 15 2016 9550 | |
| Lenovo ThinkPad P50 | |
| Cinebench R10 | |
| Rendering Multiple CPUs 32Bit | |
| HP ZBook 15 G3 | |
| Dell Precision 5510 | |
| MSI WS60-6QJE316H11 | |
| HP ZBook 15 G2 | |
| Lenovo ThinkPad P50 | |
| Dell XPS 15 2016 9550 | |
| Rendering Single 32Bit | |
| MSI WS60-6QJE316H11 | |
| HP ZBook 15 G3 | |
| HP ZBook 15 G2 | |
| Dell Precision 5510 | |
| Dell XPS 15 2016 9550 | |
| Lenovo ThinkPad P50 | |
| Rendering Multiple CPUs 64Bit | |
| HP ZBook 15 G3 | |
| Dell Precision 5510 | |
| HP ZBook 15 G2 | |
| MSI WS60-6QJE316H11 | |
| Lenovo ThinkPad P50 | |
| Dell XPS 15 2016 9550 | |
| Rendering Single CPUs 64Bit | |
| MSI WS60-6QJE316H11 | |
| HP ZBook 15 G2 | |
| HP ZBook 15 G3 | |
| Dell Precision 5510 | |
| Dell XPS 15 2016 9550 | |
| Lenovo ThinkPad P50 | |
| PCMark 7 - Score | |
| HP ZBook 15 G2 | |
| HP ZBook 15 G3 | |
| MSI WS60-6QJE316H11 | |
| Dell Precision 5510 | |
| Dell XPS 15 2016 9550 | |
| Lenovo ThinkPad P50 | |
| PCMark 8 | |
| Home Score Accelerated v2 | |
| HP ZBook 15 G2 | |
| Lenovo ThinkPad P50 | |
| HP ZBook 15 G3 | |
| Dell Precision 5510 | |
| Dell XPS 15 2016 9550 | |
| MSI WS60-6QJE316H11 | |
| Creative Score Accelerated v2 | |
| HP ZBook 15 G2 | |
| Dell Precision 5510 | |
| HP ZBook 15 G3 | |
| Dell XPS 15 2016 9550 | |
| Work Score Accelerated v2 | |
| HP ZBook 15 G3 | |
| HP ZBook 15 G2 | |
| Dell Precision 5510 | |
| Lenovo ThinkPad P50 | |
| MSI WS60-6QJE316H11 | |
| PCMark Vantage Result | 23161 pontos | |
| PCMark 7 Score | 5521 pontos | |
| PCMark 8 Home Score Accelerated v2 | 3959 pontos | |
| PCMark 8 Creative Score Accelerated v2 | 4392 pontos | |
| PCMark 8 Work Score Accelerated v2 | 5221 pontos | |
Ajuda | ||

| LuxMark v2.0 64Bit | |
| Room GPUs-only | |
| HP ZBook 15 G3 | |
| MSI WS60-6QJE316H11 | |
| Dell XPS 15 2016 9550 | |
| Lenovo ThinkPad P50 | |
| Dell Precision 5510 | |
| HP ZBook 15 G2 | |
| Lenovo ThinkPad W541 20EF000SGE | |
| Sala GPUs-only | |
| HP ZBook 15 G3 | |
| MSI WS60-6QJE316H11 | |
| Lenovo ThinkPad P50 | |
| Dell XPS 15 2016 9550 | |
| Dell Precision 5510 | |
| HP ZBook 15 G2 | |
| Lenovo ThinkPad W541 20EF000SGE | |
| SiSoft Sandra 2016 | |
| Image Processing | |
| HP ZBook 15 G3 | |
| MSI WS60-6QJE316H11 | |
| Lenovo ThinkPad P50 | |
| Dell Precision 5510 | |
| GP Cryptography (Higher Security AES256+SHA2-512) | |
| Lenovo ThinkPad P50 | |
| HP ZBook 15 G3 | |
| MSI WS60-6QJE316H11 | |
| Dell Precision 5510 | |
| GP Financial Analysis (FP High/Double Precision) | |
| HP ZBook 15 G3 | |
| Lenovo ThinkPad P50 | |
| MSI WS60-6QJE316H11 | |
| Dell Precision 5510 | |
| 3DMark 11 | |
| 1280x720 Performance | |
| MSI WS60-6QJE316H11 | |
| HP ZBook 15 G3 | |
| Dell XPS 15 2016 9550 | |
| Lenovo ThinkPad P50 | |
| Dell Precision 5510 | |
| 1280x720 Performance GPU | |
| Dell XPS 15 2016 9550 | |
| MSI WS60-6QJE316H11 | |
| Lenovo ThinkPad P50 | |
| HP ZBook 15 G3 | |
| Dell Precision 5510 | |
| 3DMark | |
| 1920x1080 Fire Strike Score | |
| MSI WS60-6QJE316H11 | |
| Dell XPS 15 2016 9550 | |
| HP ZBook 15 G3 | |
| Lenovo ThinkPad P50 | |
| Dell Precision 5510 | |
| HP ZBook 15 G2 | |
| 1920x1080 Fire Strike Graphics | |
| Dell XPS 15 2016 9550 | |
| MSI WS60-6QJE316H11 | |
| Lenovo ThinkPad P50 | |
| HP ZBook 15 G3 | |
| Dell Precision 5510 | |
| HP ZBook 15 G2 | |
| Unigine Valley 1.0 | |
| 1920x1080 Extreme HD DirectX AA:x8 | |
| Lenovo ThinkPad P50 | |
| HP ZBook 15 G3 | |
| MSI WS60-6QJE316H11 | |
| Dell Precision 5510 | |
| 1920x1080 Extreme HD Preset OpenGL AA:x8 | |
| HP ZBook 15 G3 | |
| Dell Precision 5510 | |
| MSI WS60-6QJE316H11 | |
| Lenovo ThinkPad P50 | |
| Unigine Heaven 3.0 | |
| 1920x1080 DX 11, Normal Tessellation, High Shaders AA:Off AF:Off | |
| MSI WS60-6QJE316H11 | |
| Lenovo ThinkPad P50 | |
| HP ZBook 15 G3 | |
| Dell Precision 5510 | |
| HP ZBook 15 G2 | |
| 1920x1080 OpenGL, Normal Tessellation, High Shaders AA:Off AF:Off | |
| HP ZBook 15 G3 | |
| Dell Precision 5510 | |
| MSI WS60-6QJE316H11 | |
| Lenovo ThinkPad P50 | |
| HP ZBook 15 G2 | |
| 3DMark 06 Standard Score | 25462 pontos | |
| 3DMark Vantage P Result | 21026 pontos | |
| 3DMark 11 Performance | 5414 pontos | |
| 3DMark Ice Storm Standard Score | 89211 pontos | |
| 3DMark Cloud Gate Standard Score | 18230 pontos | |
| 3DMark Fire Strike Score | 3820 pontos | |
Ajuda | ||
| baixo | média | alto | ultra | |
| BioShock Infinite (2013) | 211 | 133 | 115.8 | 72.2 |
| The Witcher 3 (2015) | 75.7 | 46.8 | 25.9 | 13.6 |
| Rise of the Tomb Raider (2016) | 72.6 | 44.6 | 25.5 | 21.8 |
Barulho
| Ocioso |
| 30 / 30 / 30 dB |
| Carga |
| 45.3 / 49.7 dB |
 | ||
30 dB silencioso 40 dB(A) audível 50 dB(A) ruidosamente alto |
||
min: | ||
| HP ZBook 15 G3 Intel Xeon E3-1505M v5, NVIDIA Quadro M2000M | Lenovo ThinkPad P50 Intel Core i7-6820HQ, NVIDIA Quadro M2000M | Dell Precision 5510 Intel Xeon E3-1505M v5, NVIDIA Quadro M1000M | HP ZBook 15 G2 Intel Core i7-4910MQ, AMD FirePro M5100 | MSI WS60-6QJE316H11 Intel Xeon E3-1505M v5, NVIDIA Quadro M2000M | |
|---|---|---|---|---|---|
| Noise | 8% | 3% | 6% | -13% | |
| off / environment * | 30 | ||||
| Idle Minimum * | 30 | 30 -0% | 30 -0% | 30.6 -2% | 37.2 -24% |
| Idle Average * | 30 | 30 -0% | 30 -0% | 30.6 -2% | 37.2 -24% |
| Idle Maximum * | 30 | 30 -0% | 30 -0% | 30.6 -2% | 37.2 -24% |
| Load Average * | 45.3 | 34.5 24% | 42.08 7% | 35.7 21% | 42.1 7% |
| Load Maximum * | 49.7 | 42.1 15% | 46.78 6% | 43.2 13% | 50.7 -2% |
* ... smaller is better
(-) The maximum temperature on the upper side is 54.6 °C / 130 F, compared to the average of 38.1 °C / 101 F, ranging from 22.2 to 69.8 °C for the class Workstation.
(-) The bottom heats up to a maximum of 60.8 °C / 141 F, compared to the average of 41.3 °C / 106 F
(+) In idle usage, the average temperature for the upper side is 27.7 °C / 82 F, compared to the device average of 32 °C / 90 F.
(+) The palmrests and touchpad are cooler than skin temperature with a maximum of 28.6 °C / 83.5 F and are therefore cool to the touch.
(±) The average temperature of the palmrest area of similar devices was 27.8 °C / 82 F (-0.8 °C / -1.5 F).
| HP ZBook 15 G3 Intel Xeon E3-1505M v5, NVIDIA Quadro M2000M | Lenovo ThinkPad P50 Intel Core i7-6820HQ, NVIDIA Quadro M2000M | Dell Precision 5510 Intel Xeon E3-1505M v5, NVIDIA Quadro M1000M | HP ZBook 15 G2 Intel Core i7-4910MQ, AMD FirePro M5100 | MSI WS60-6QJE316H11 Intel Xeon E3-1505M v5, NVIDIA Quadro M2000M | |
|---|---|---|---|---|---|
| Heat | 11% | 8% | 10% | 2% | |
| Maximum Upper Side * | 54.6 | 36.7 33% | 45.8 16% | 44.1 19% | 42.3 23% |
| Maximum Bottom * | 60.8 | 41.3 32% | 46.7 23% | 45.7 25% | 60.1 1% |
| Idle Upper Side * | 30.3 | 31.1 -3% | 31.2 -3% | 29.6 2% | 32.7 -8% |
| Idle Bottom * | 30.7 | 36.2 -18% | 31.9 -4% | 32.2 -5% | 33.1 -8% |
* ... smaller is better
| desligado | |
| Ocioso | |
| Carga |
|
| HP ZBook 15 G3 Quadro M2000M, E3-1505M v5, Samsung SM951 MZVPV512HDGL m.2 PCI-e | Lenovo ThinkPad P50 Quadro M2000M, 6820HQ, Samsung SSD PM871 MZNLN256HCHP | Dell Precision 5510 Quadro M1000M, E3-1505M v5, SK hynix SC920 512 GB | HP ZBook 15 G2 FirePro M5100, 4910MQ, SanDisk A110 SD6PP4M-256G-1006 | MSI WS60-6QJE316H11 Quadro M2000M, E3-1505M v5, Toshiba NVMe THNSN5128GP | |
|---|---|---|---|---|---|
| Power Consumption | 15% | -22% | -71% | -106% | |
| Idle Minimum * | 5.7 | 5.6 2% | 8.6 -51% | 17.1 -200% | 18.8 -230% |
| Idle Average * | 12.2 | 8.6 30% | 16.2 -33% | 21.9 -80% | 29.6 -143% |
| Idle Maximum * | 12.6 | 9.3 26% | 16.7 -33% | 23.2 -84% | 30.3 -140% |
| Load Average * | 83.1 | 89.5 -8% | 82.6 1% | 86.6 -4% | 90.4 -9% |
| Load Maximum * | 138.2 | 105 24% | 131.8 5% | 120.7 13% | 150.2 -9% |
* ... smaller is better
| HP ZBook 15 G3 90 Wh | Lenovo ThinkPad P50 90 Wh | Dell Precision 5510 56 Wh | HP ZBook 15 G2 83 Wh | MSI WS60-6QJE316H11 47 Wh | |
|---|---|---|---|---|---|
| Battery Runtime | 14% | -33% | -44% | -69% | |
| Reader / Idle | 822 | 860 5% | 428 -48% | 370 -55% | 160 -81% |
| H.264 | 449 | 533 19% | 197 -56% | 260 -42% | 141 -69% |
| WiFi v1.3 | 386 | 498 29% | 286 -26% | 278 -28% | 106 -73% |
| Load | 110 | 113 3% | 109 -1% | 53 -52% | 51 -54% |
| WiFi | 298 | 237 |
Pro
Contra
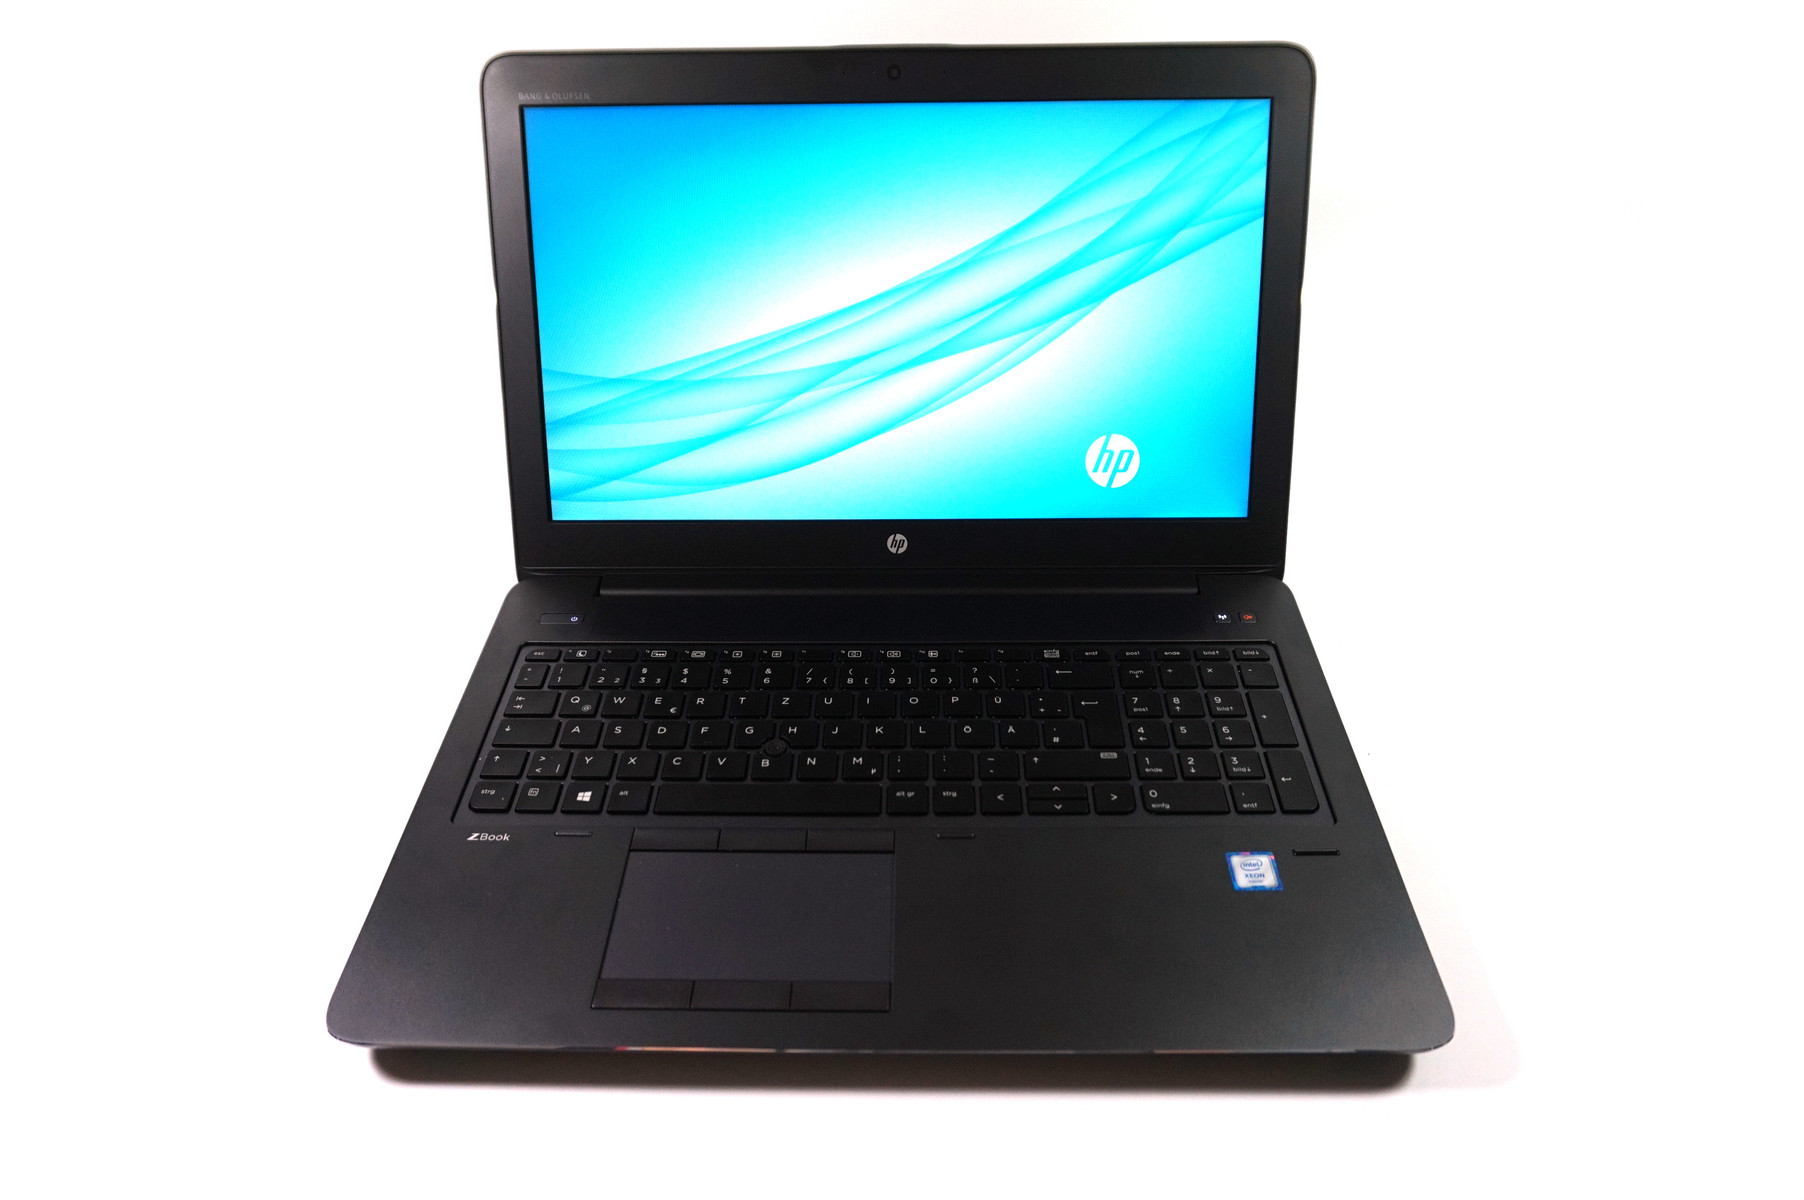
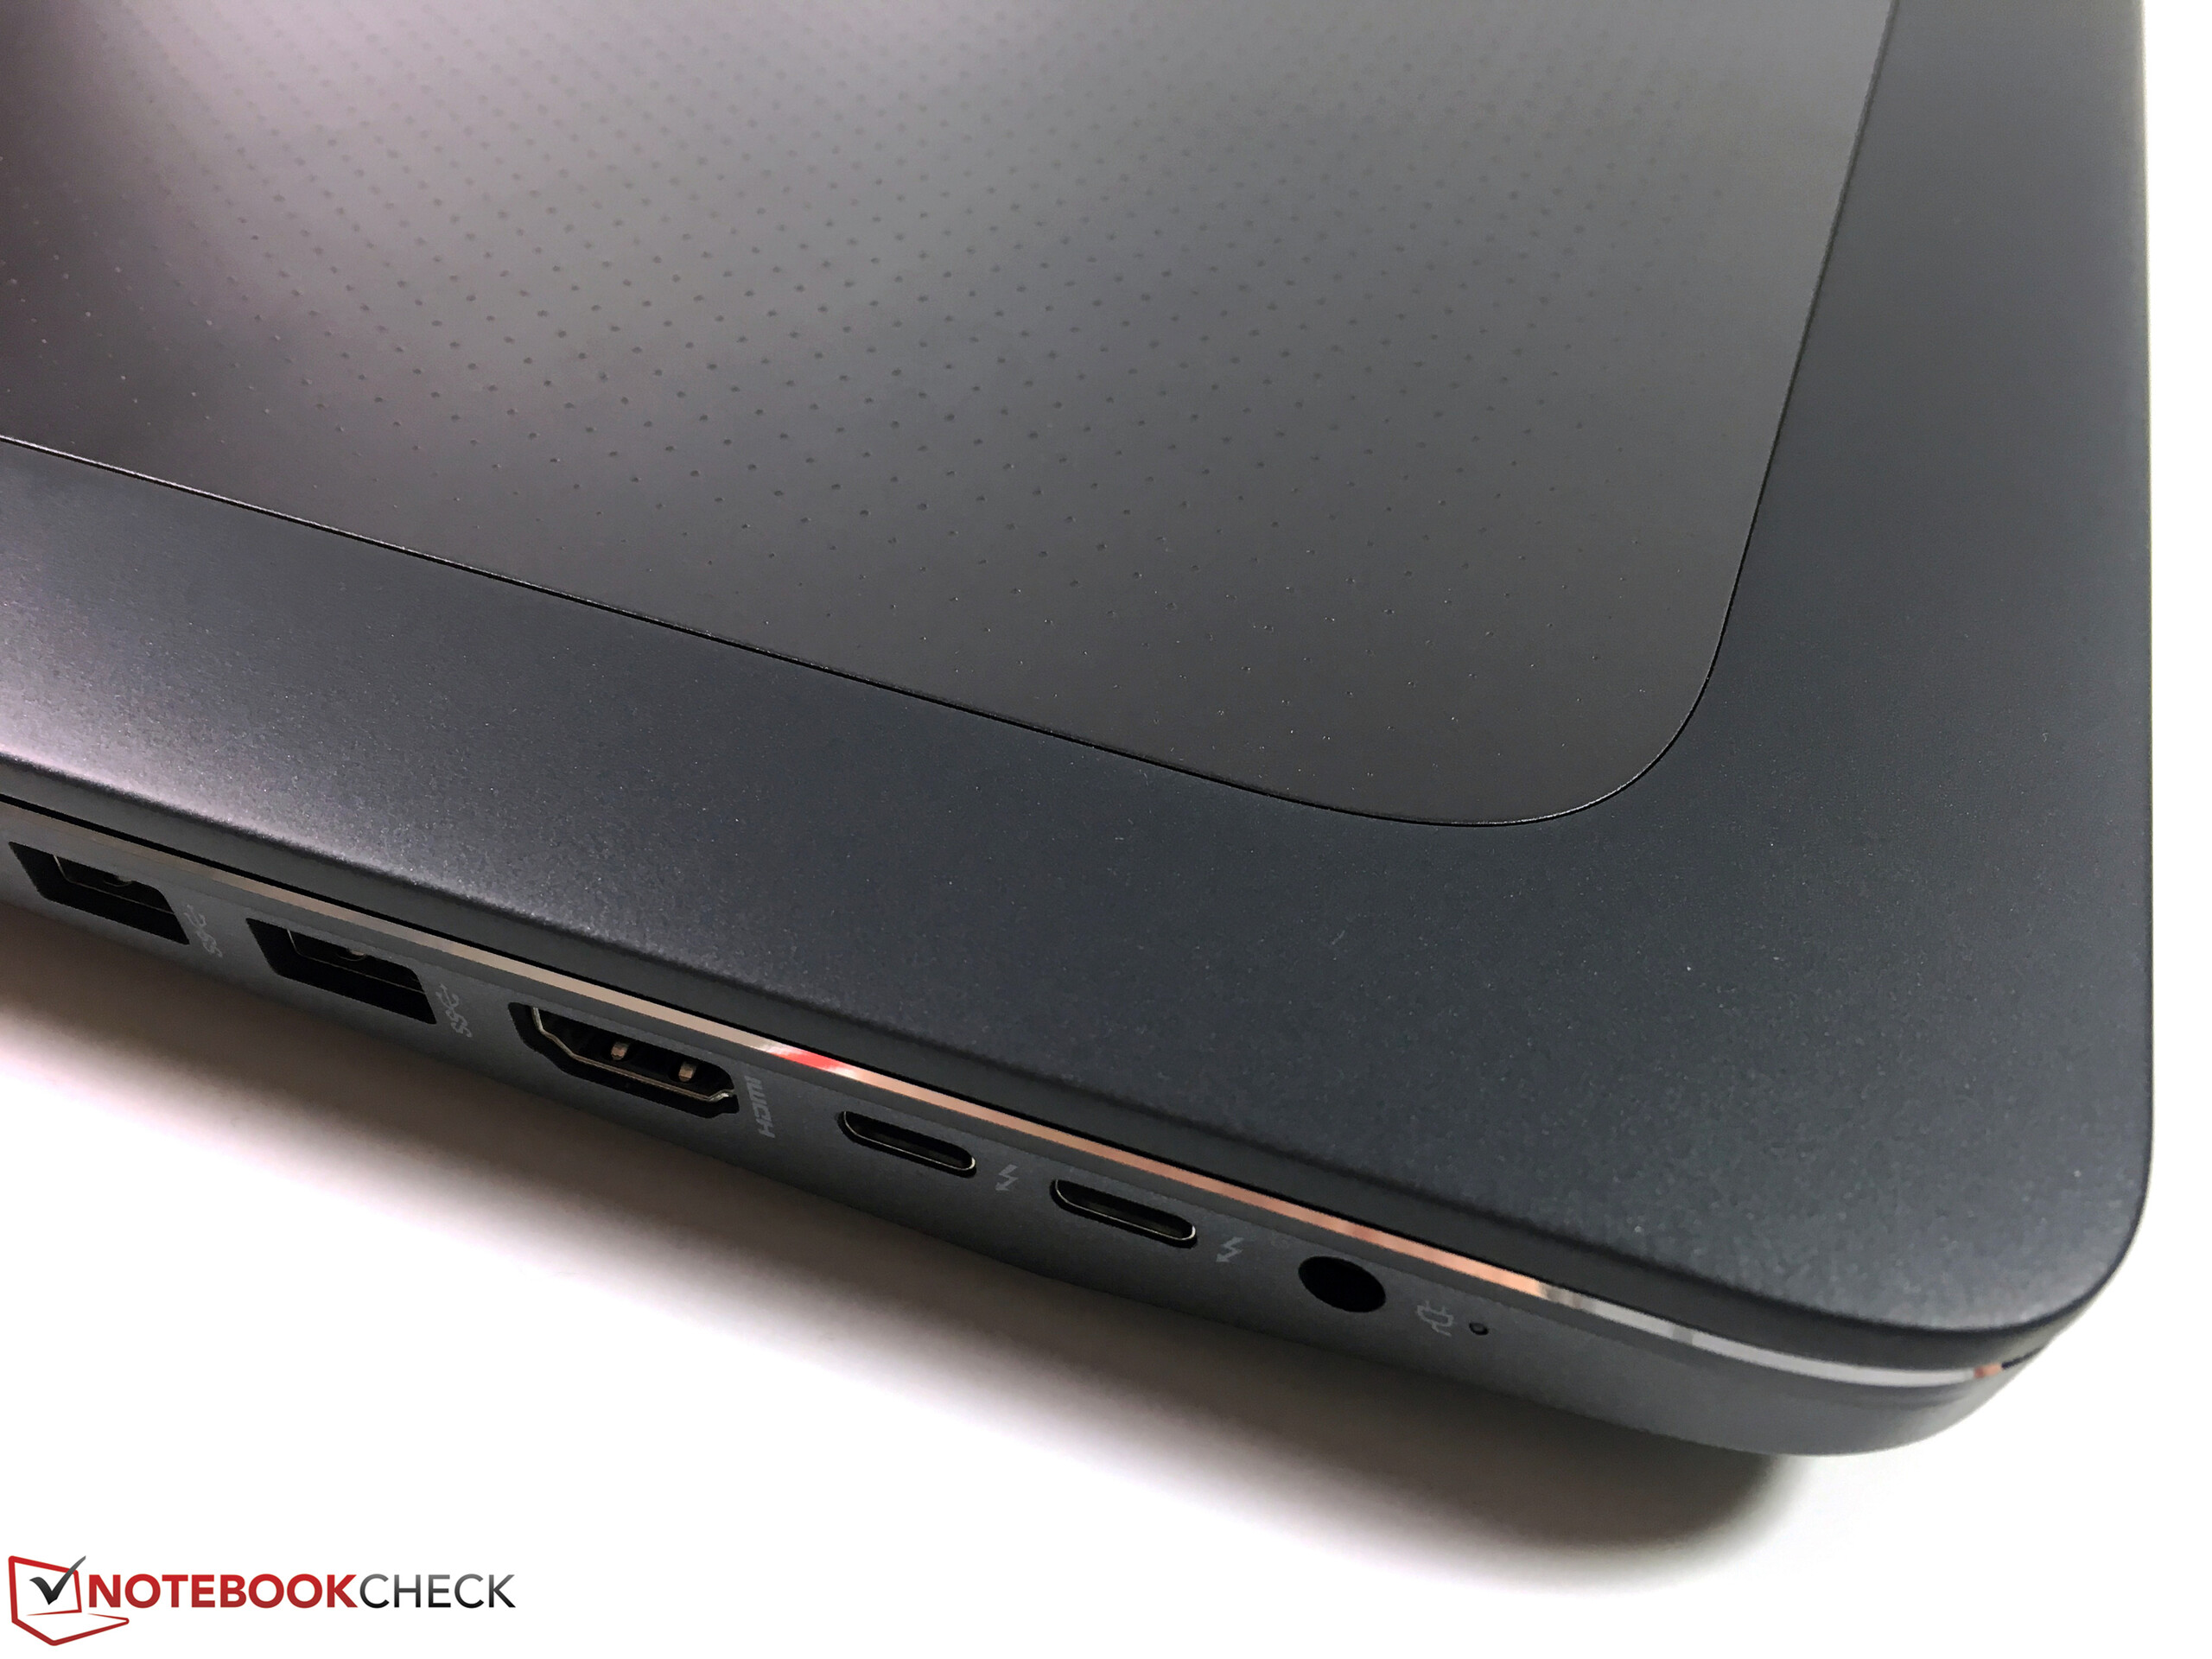
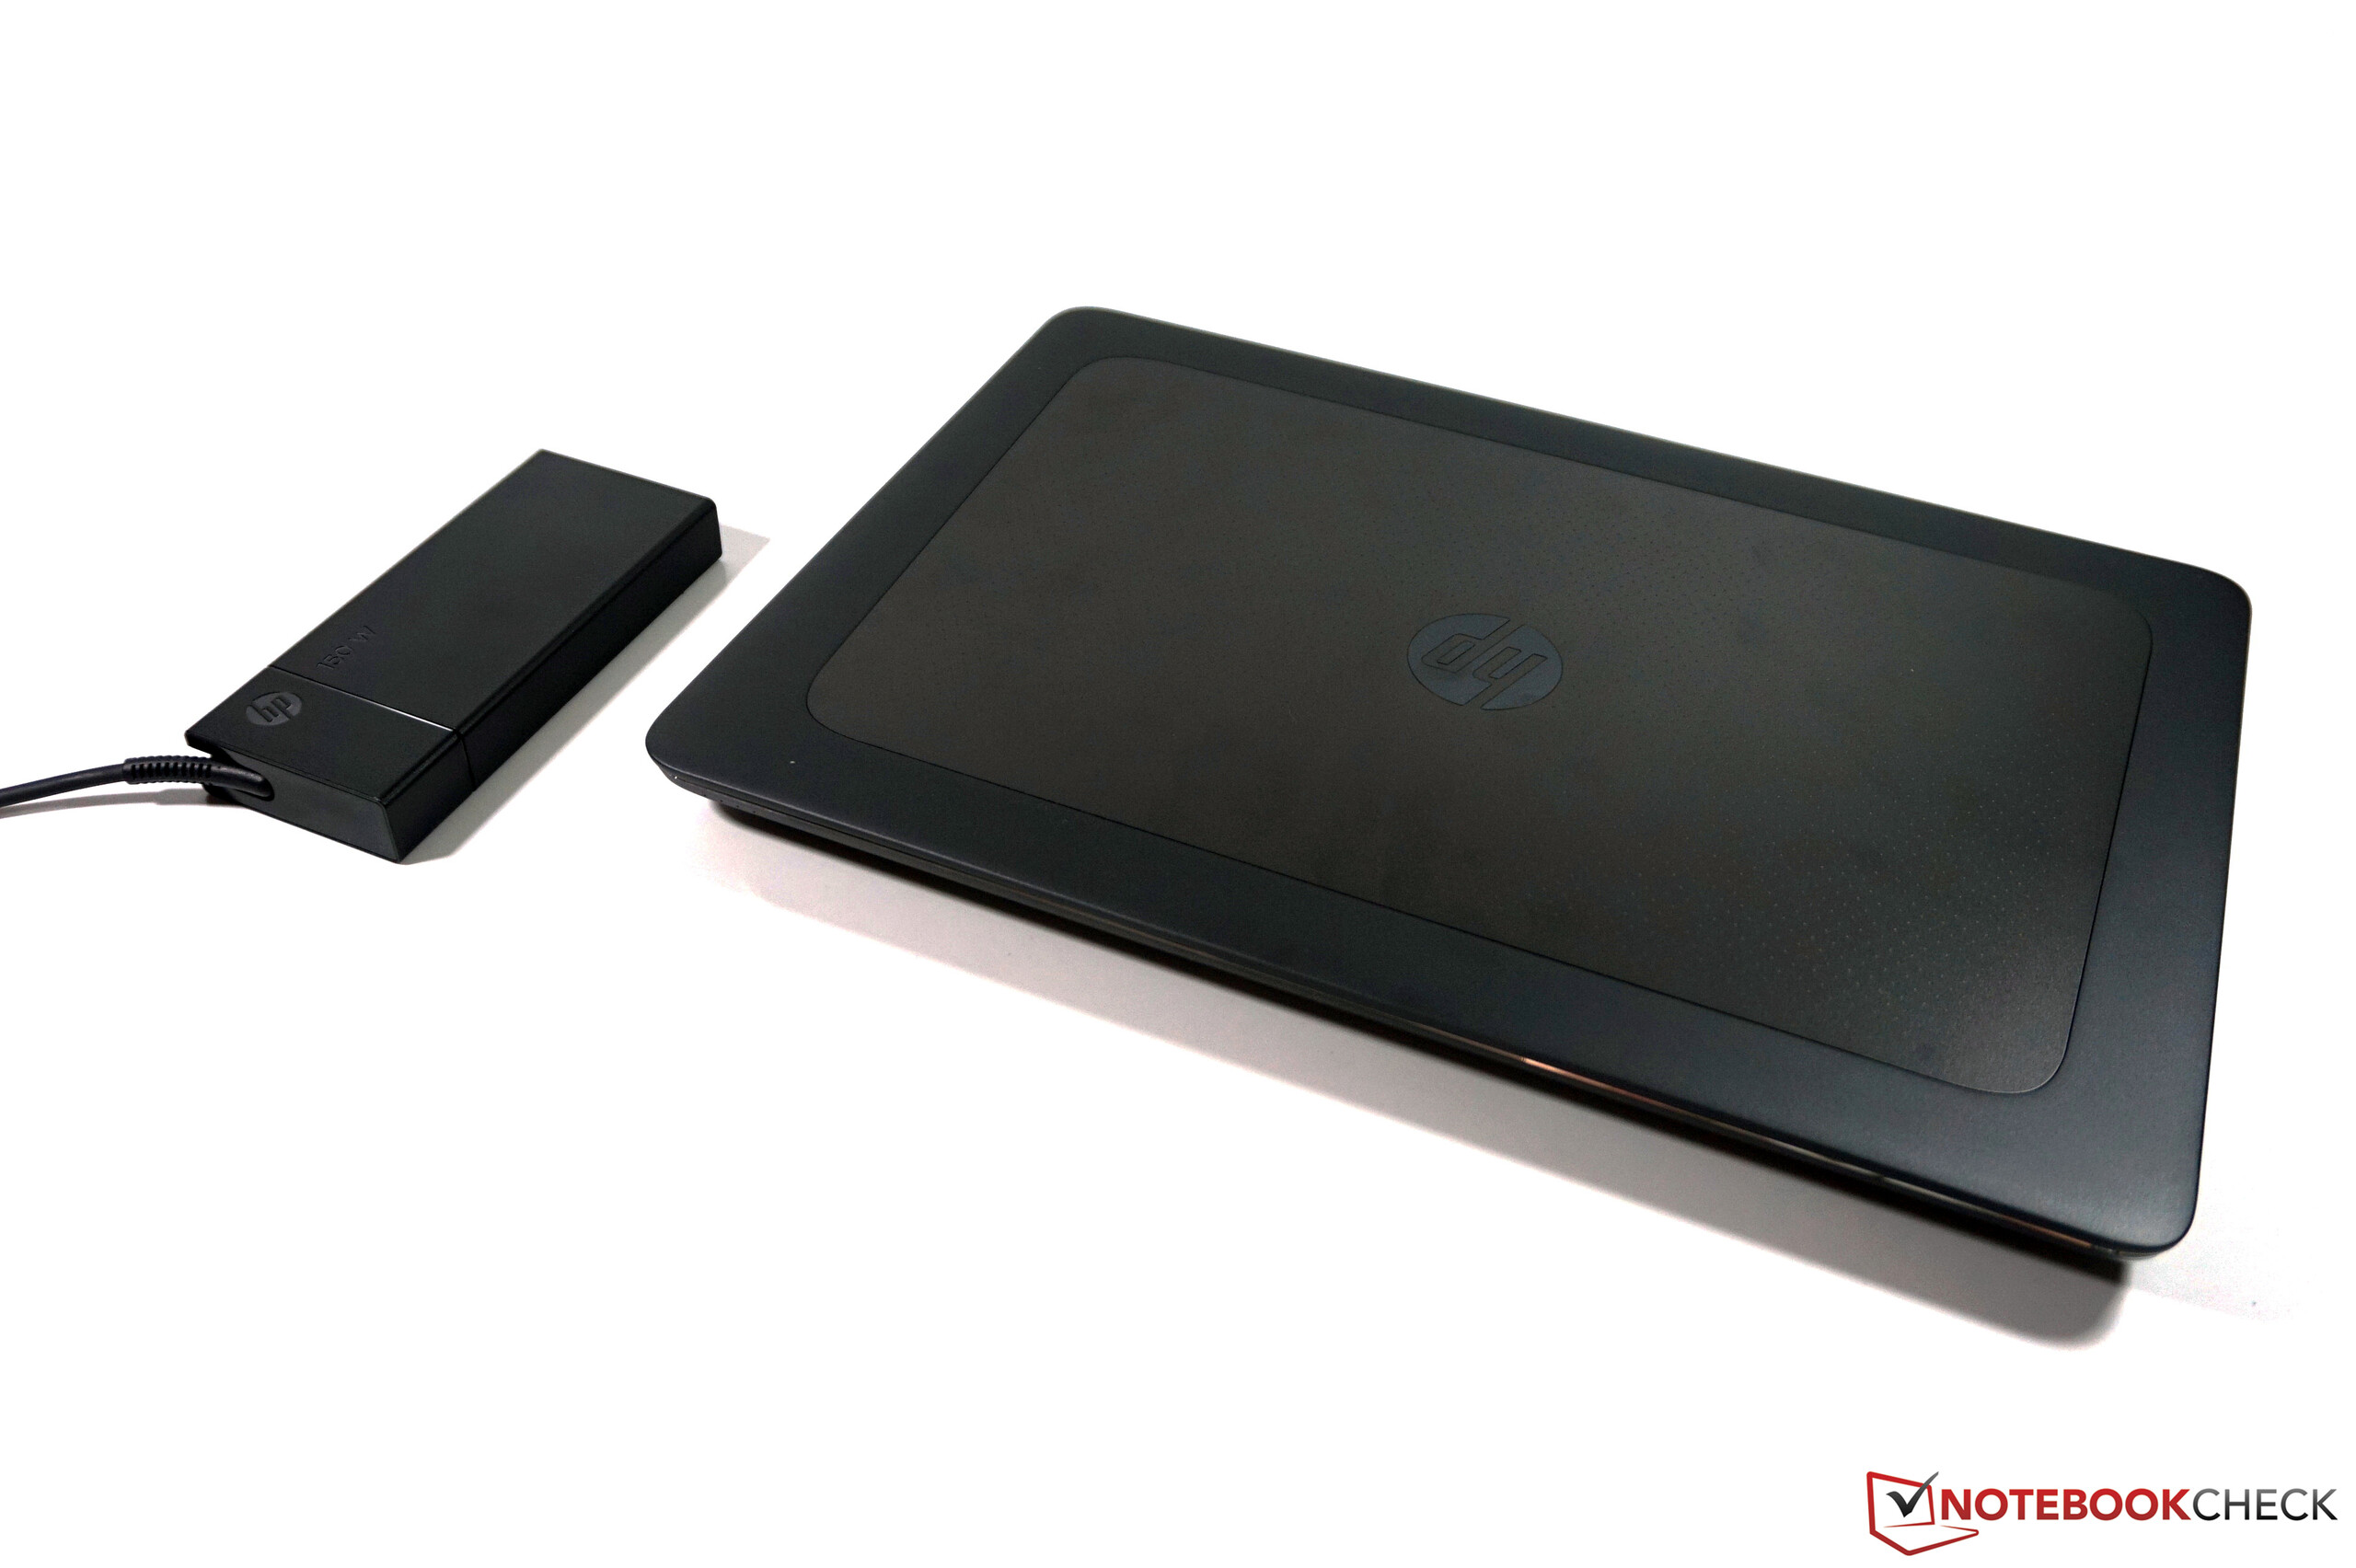
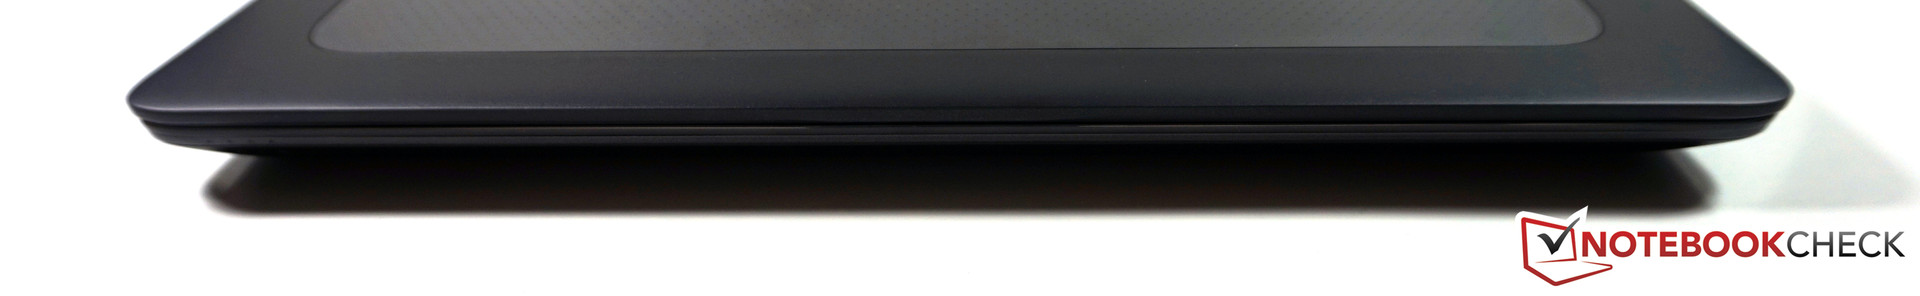
A HP consegue melhorar o já convincente predecessor com o ZBook 15 G3. O chassi completamente remodelado deixa uma impressão muito nobre e não nada que invejar aos concorrentes em termos de qualidade de construção e estabilidade. Além da atualização para um processador Skylake, a HP também implementa todas as interfaces modernas, tanto interna como externamente. O desempenho também é bom e atualmente representa quase o limite em um workstation móvel com uma tela de 15-polegadas. Depois de ficarmos decepcionados com muitos paineis FHD recentemente, o painel IPS do ZBook 15 G3 é finalmente um bom produto, embora tenha que calibrá-lo. Também há uma tela DreamColor opcional, se precisar de uma gama de cores maior.
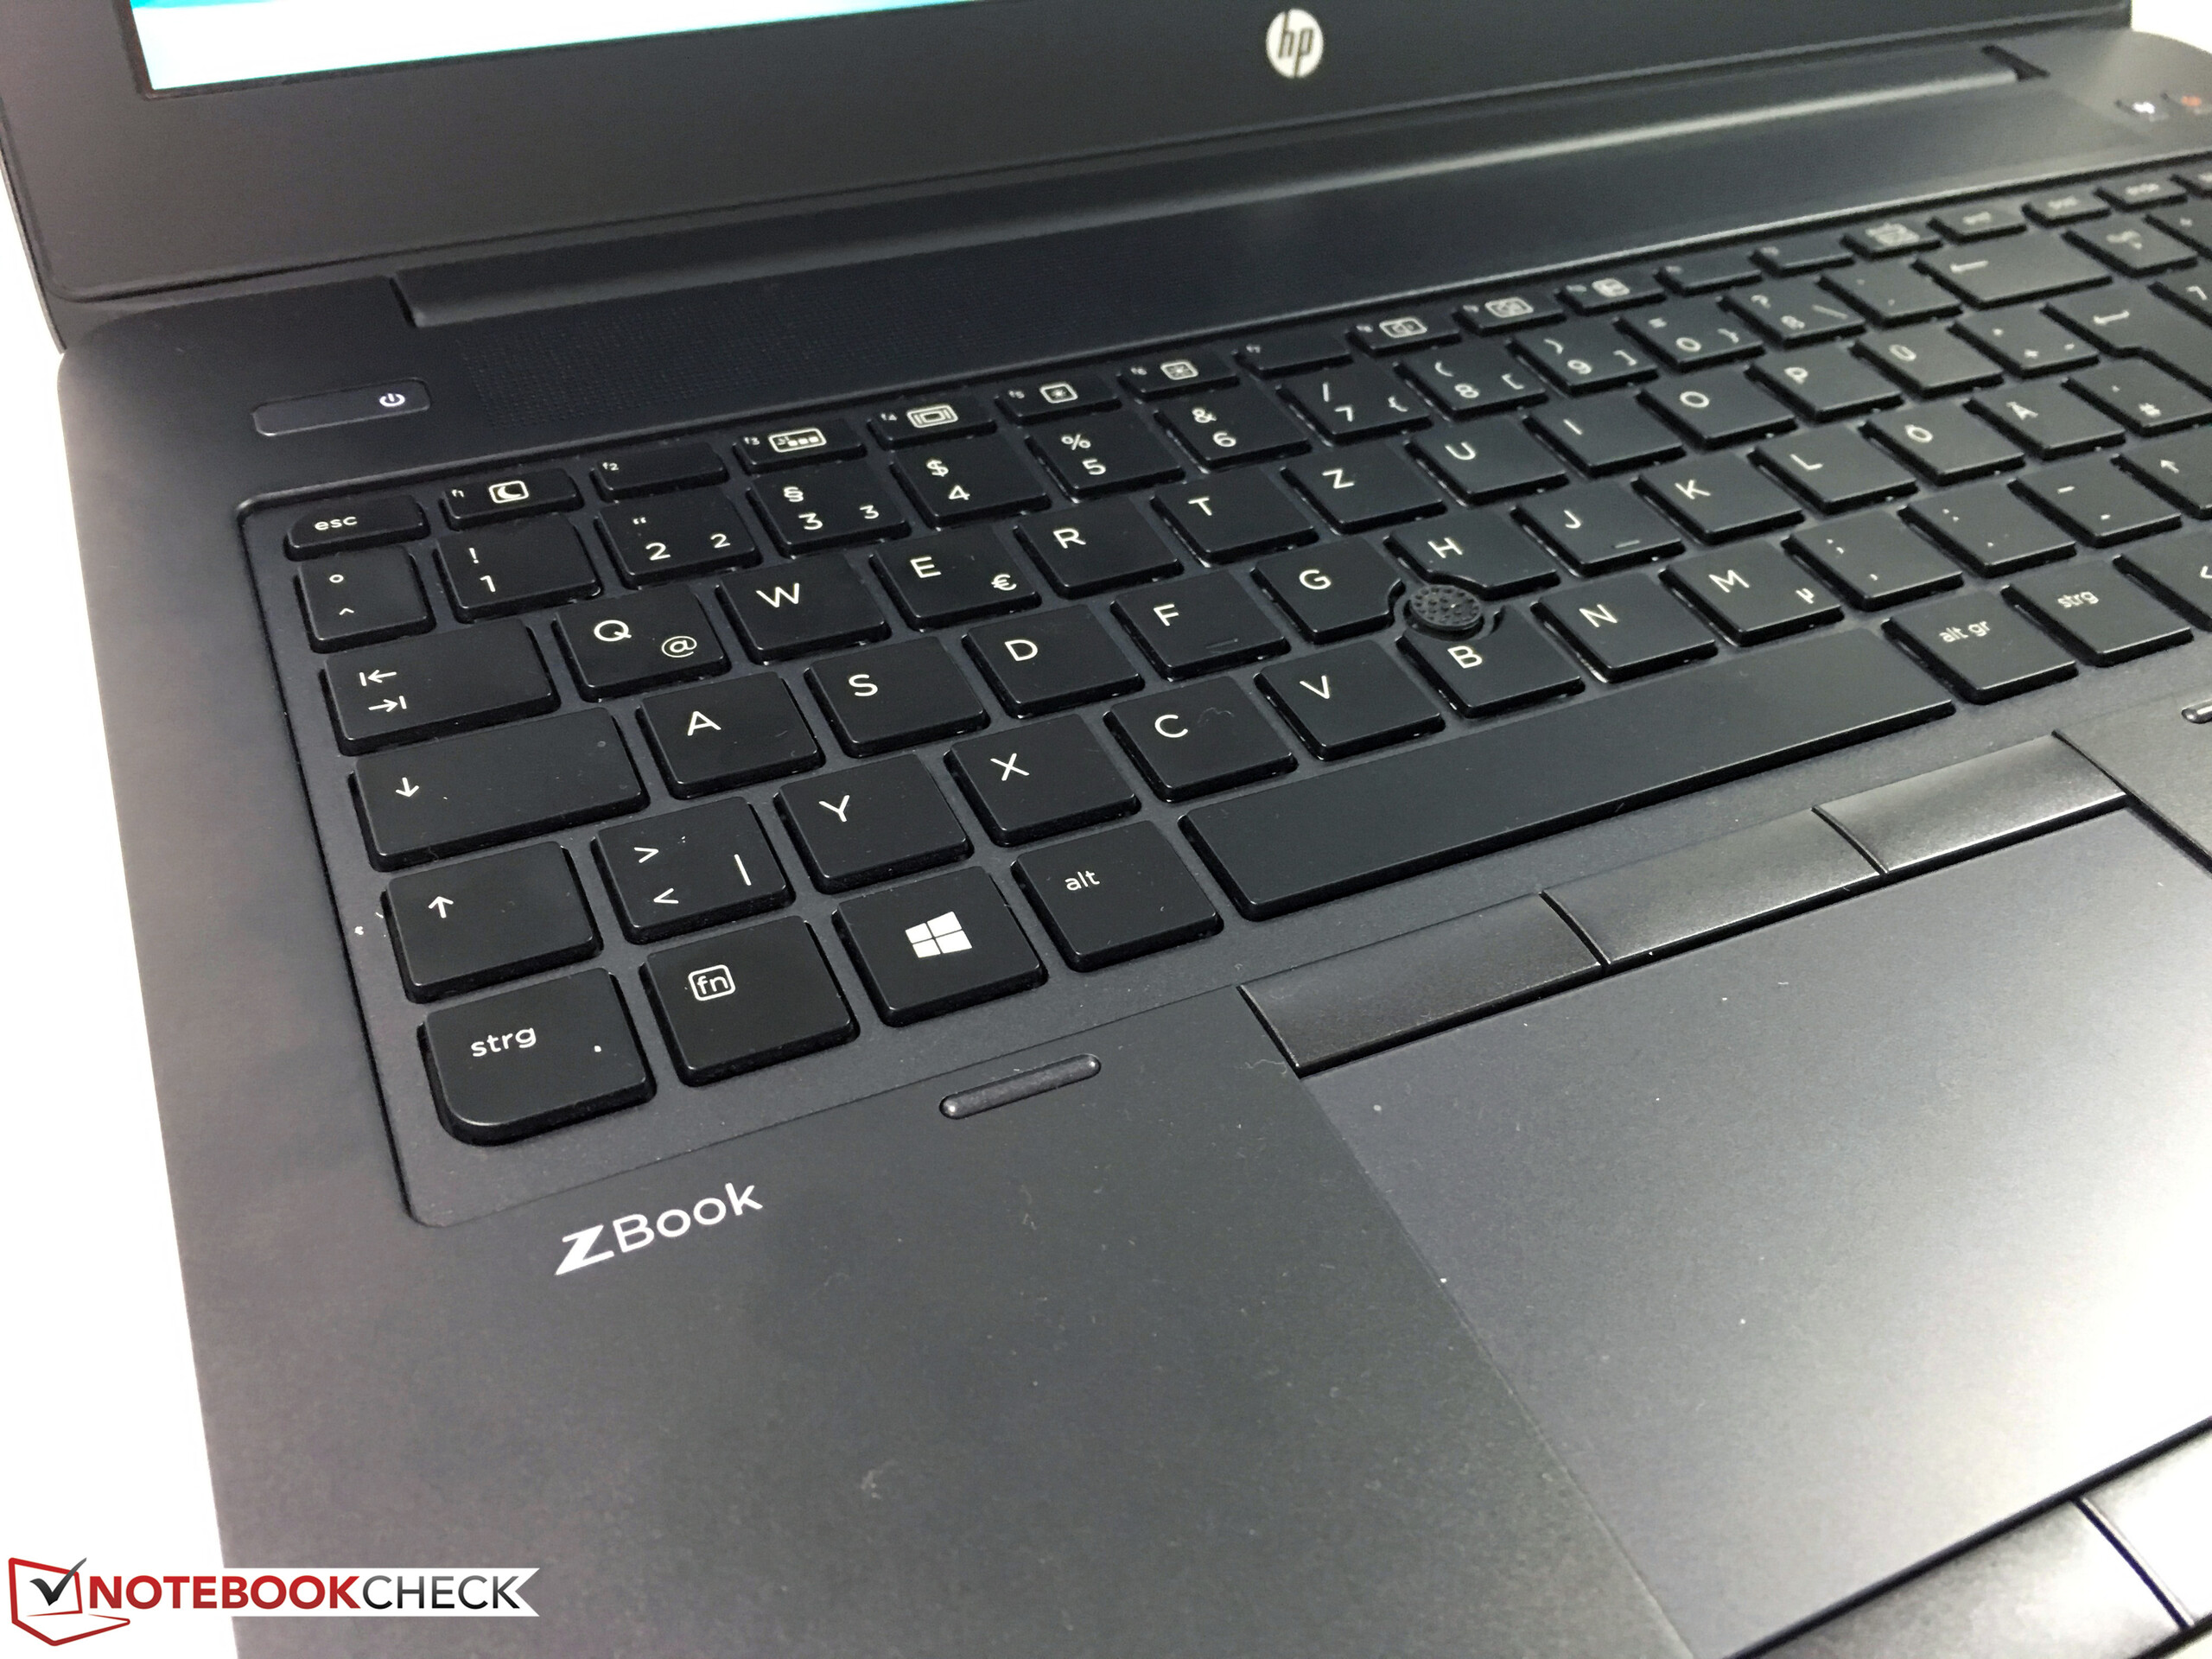
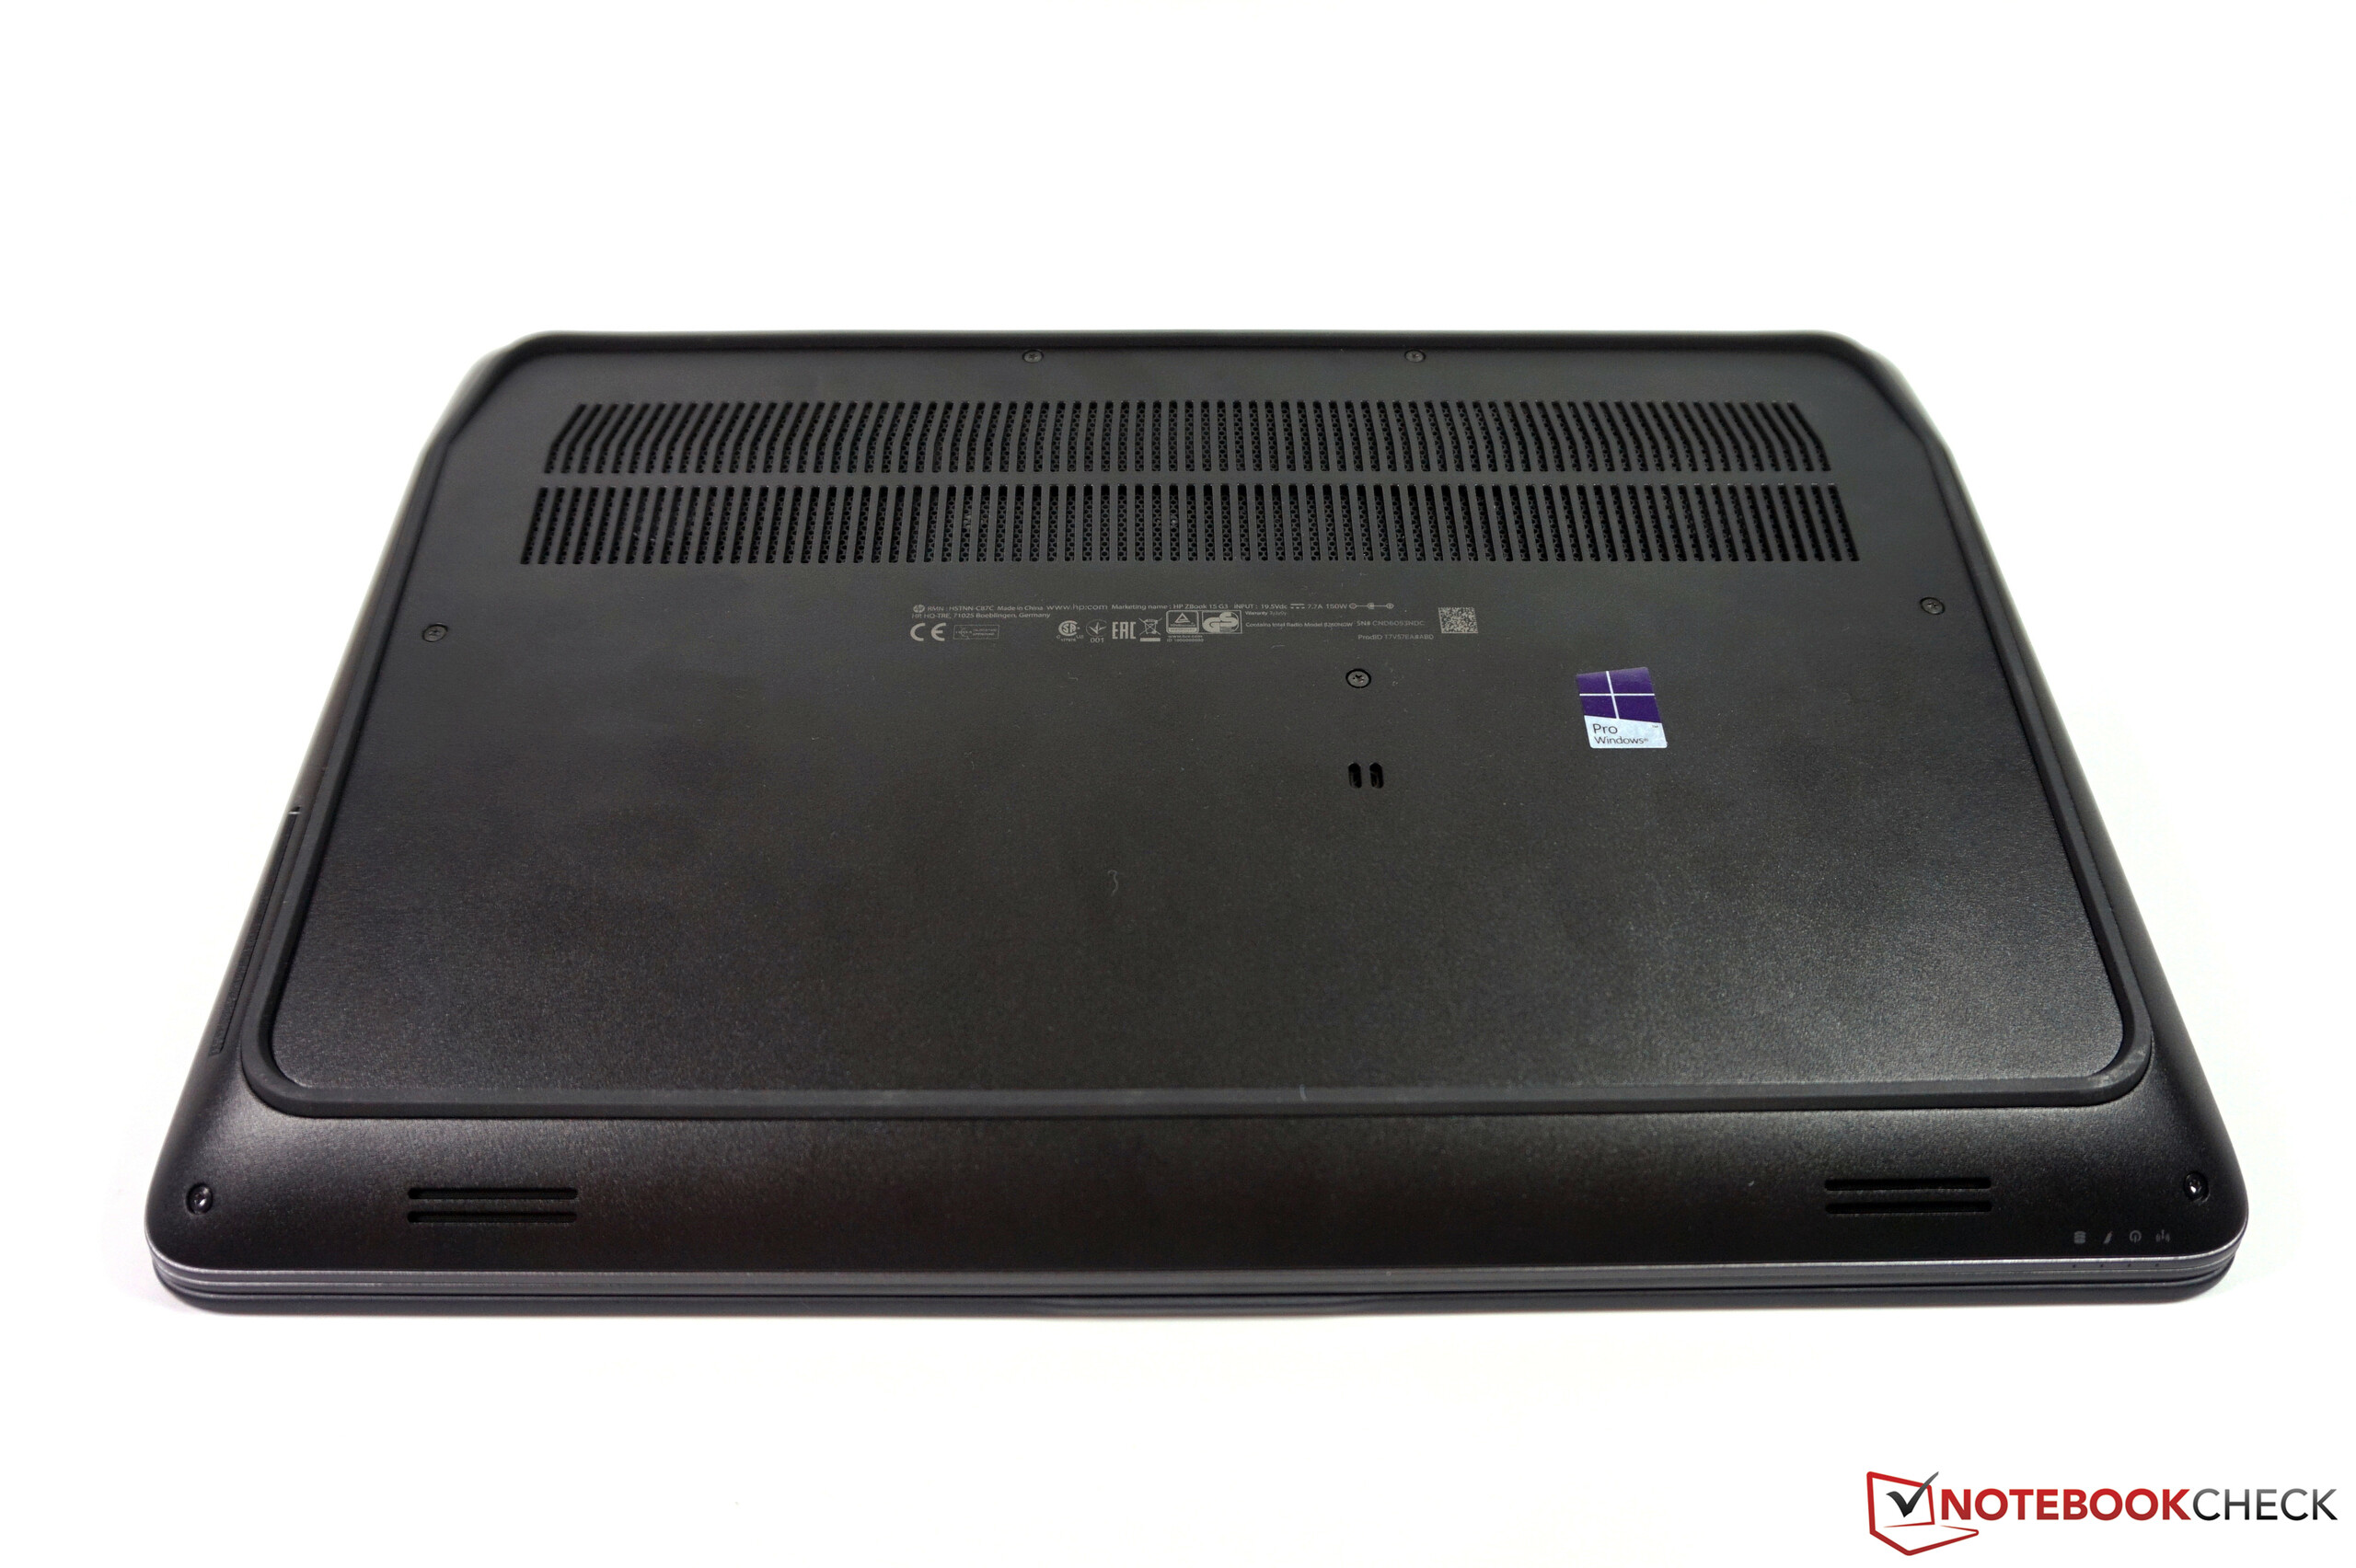
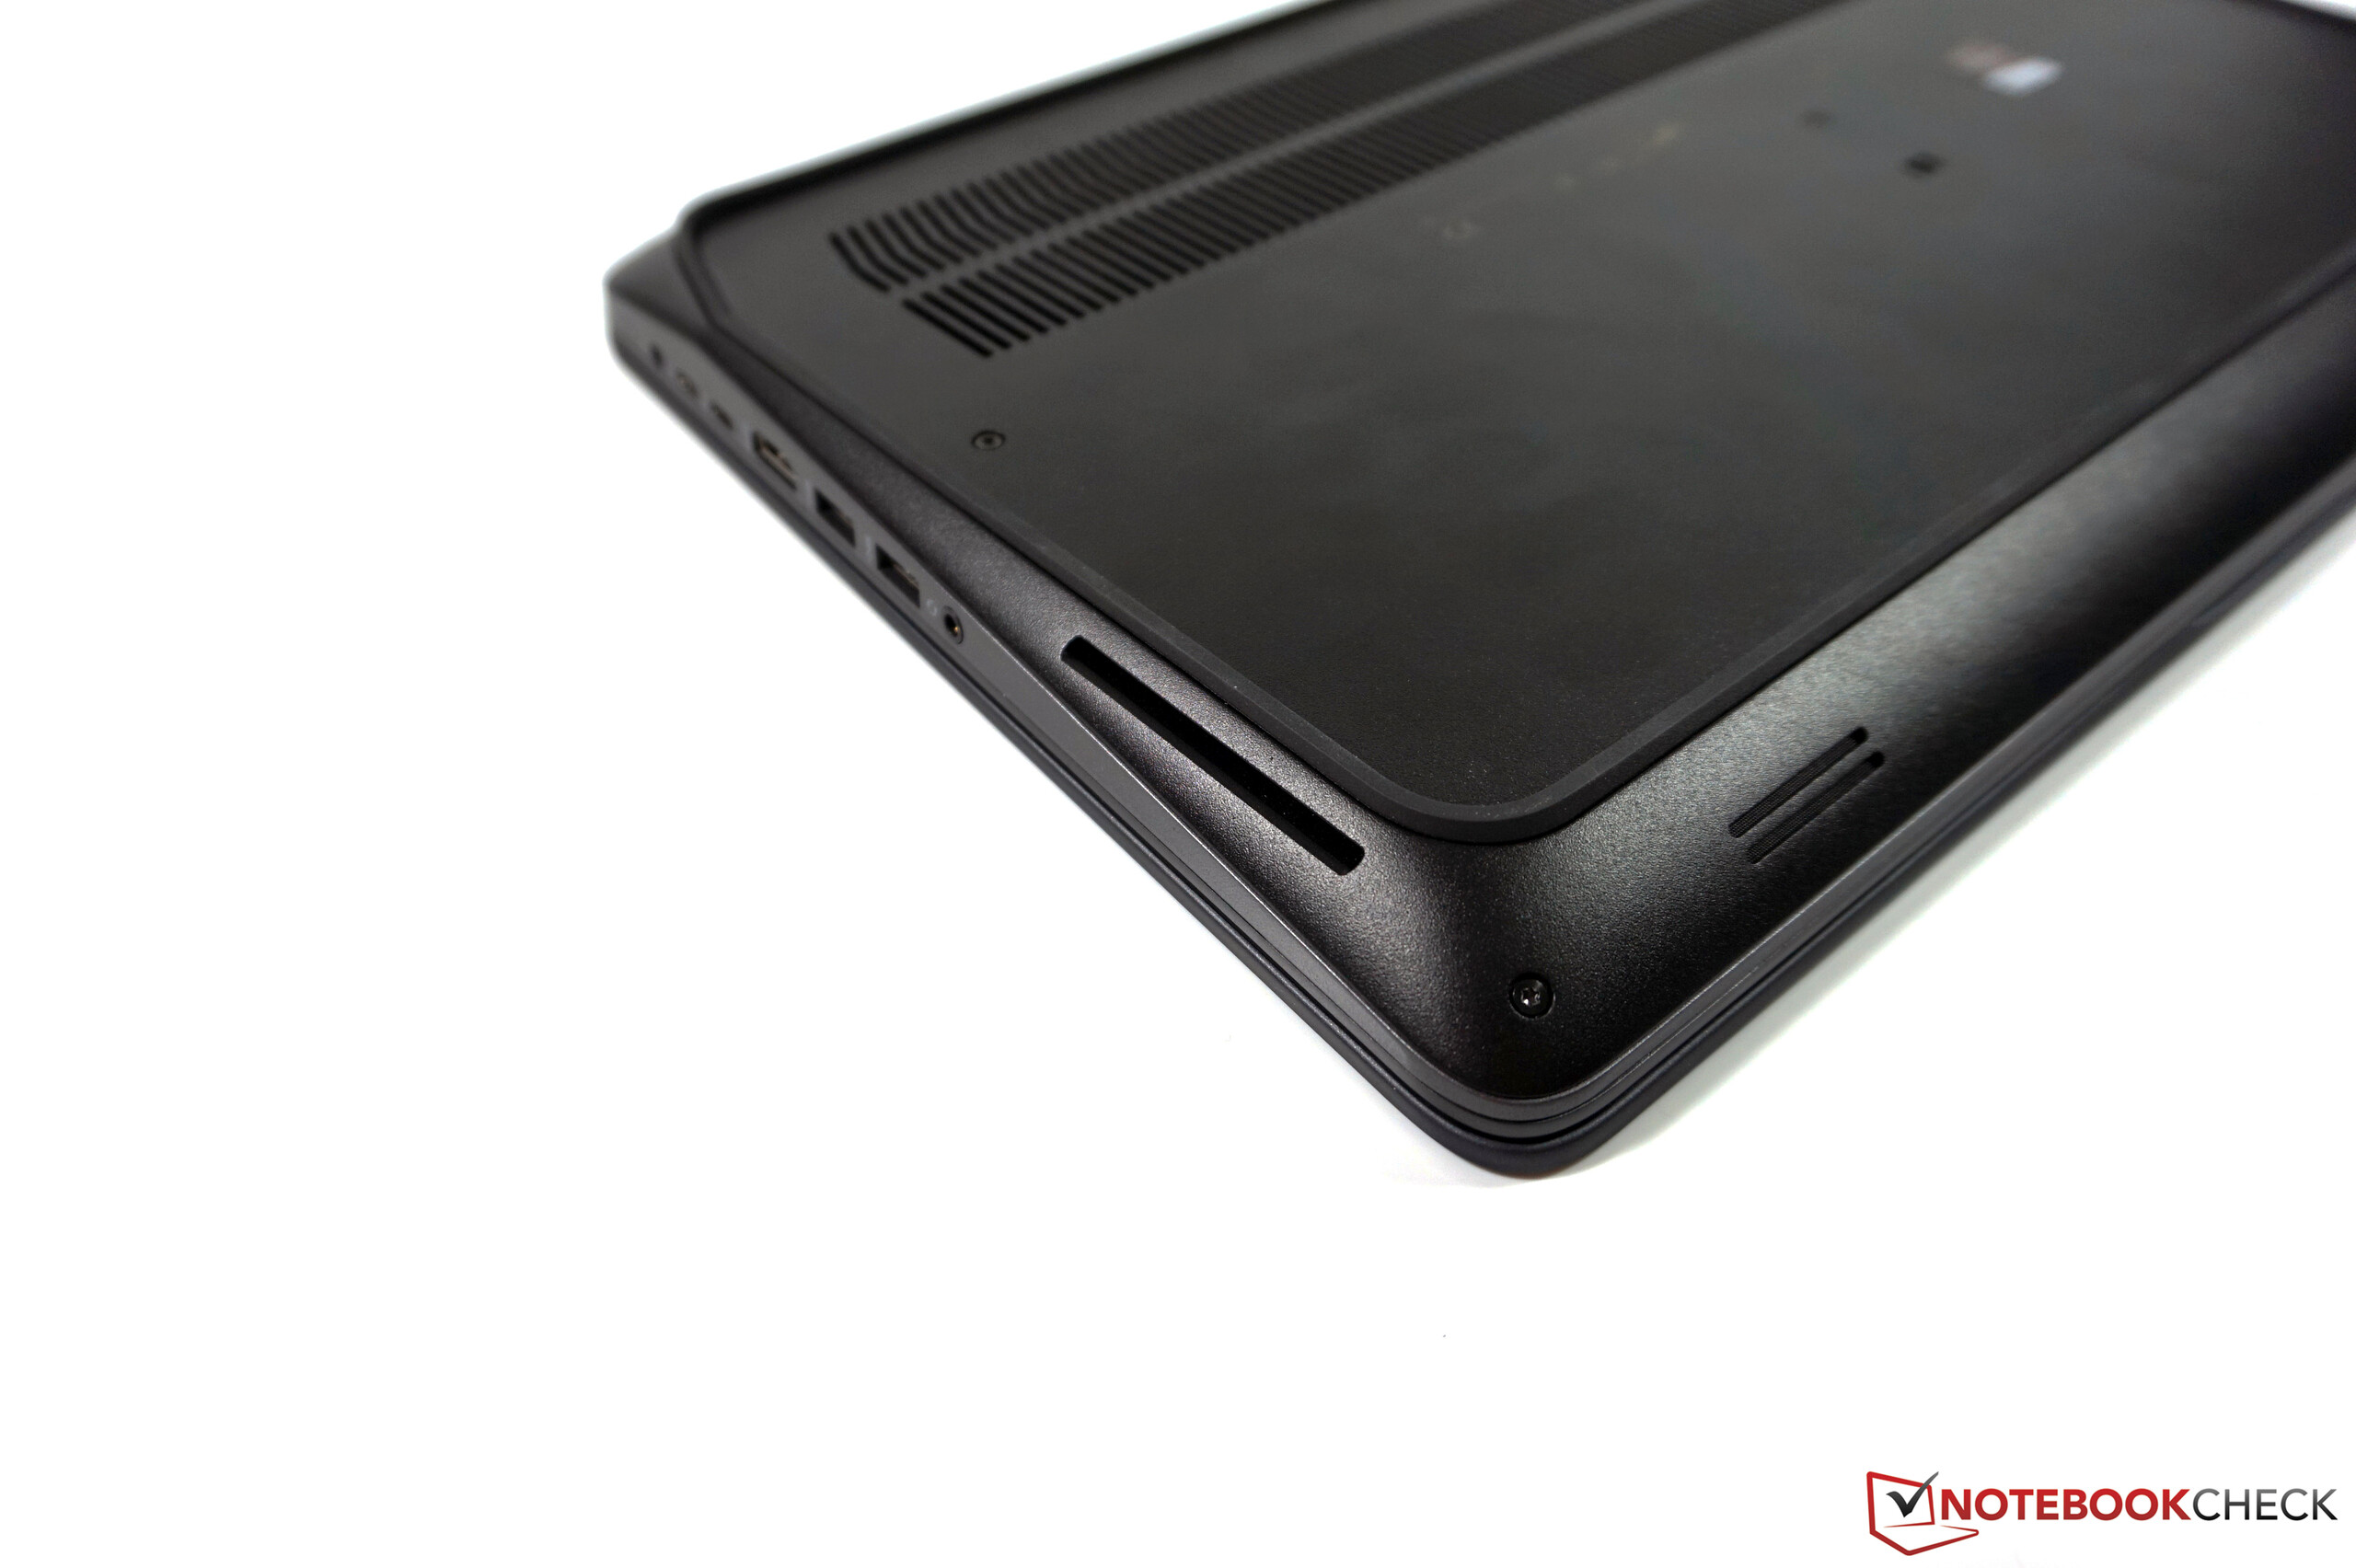
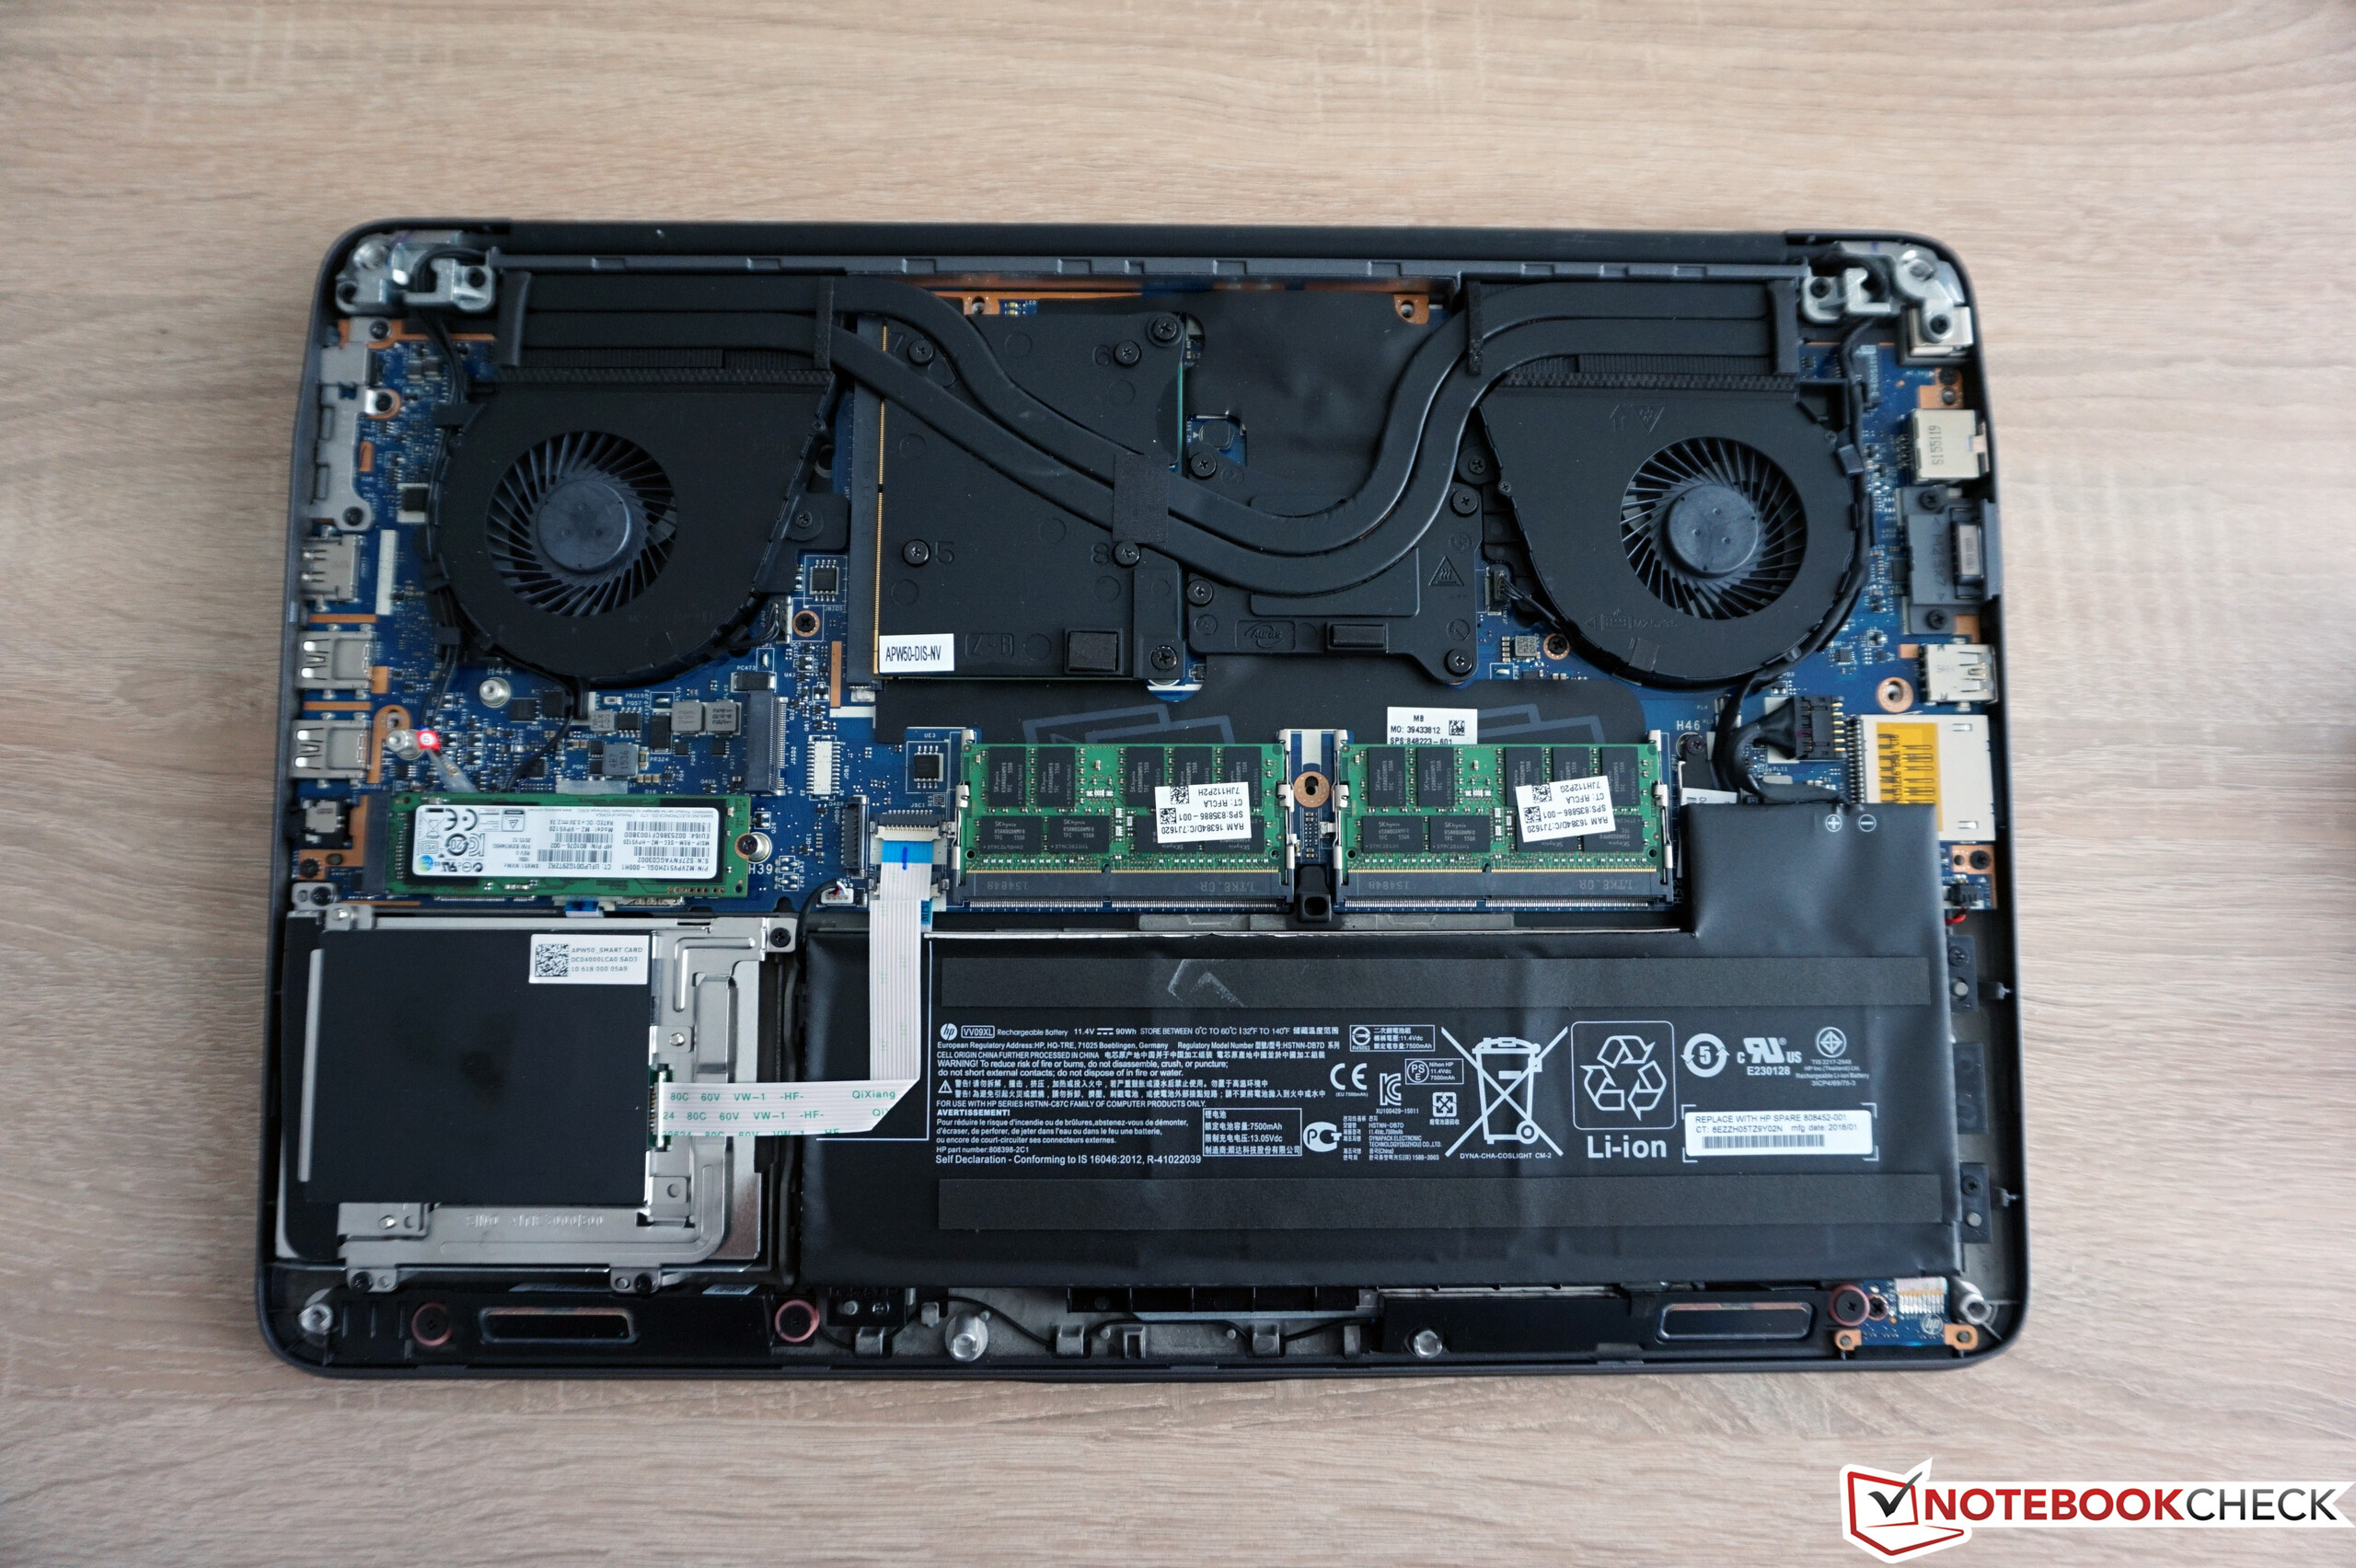
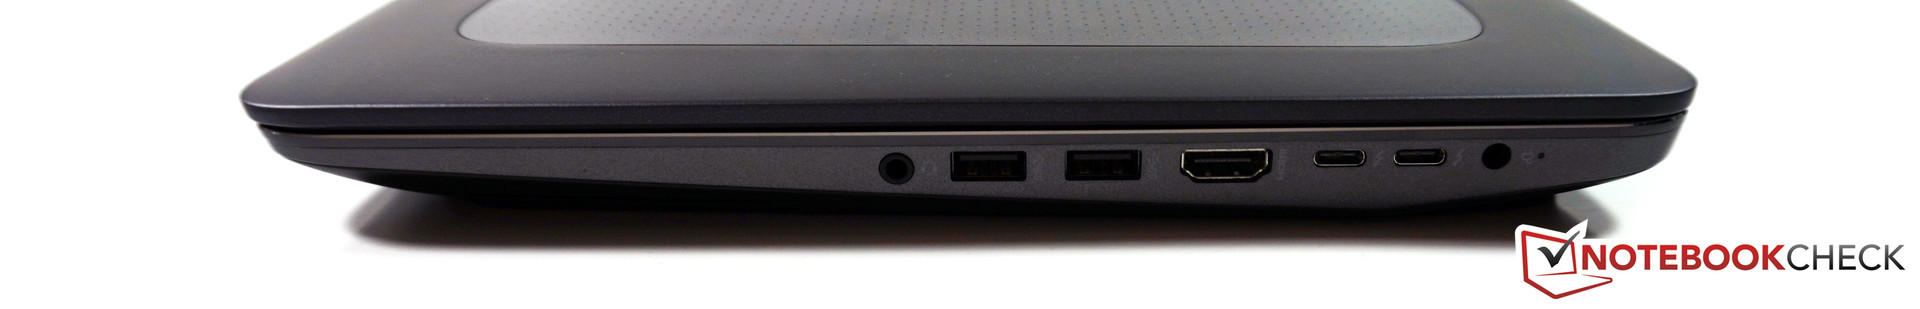
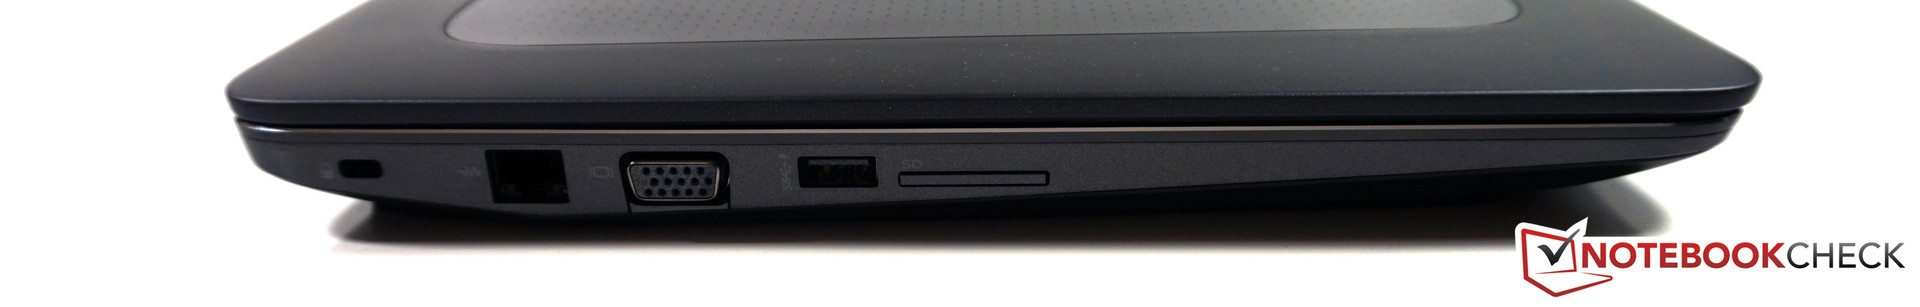
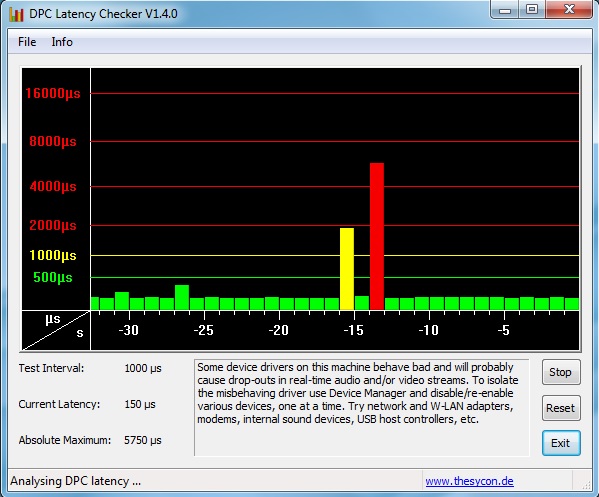
Há apenas algumas pequenas coisas das que não gostamos. Isto inclui a bateria, que agora não pode ser acessada desde o exterior, e as ventoinhas, que são muito mais barulhentas sob uso intenso, em comparação com o predecessor. Alguns dos componentes internos são difíceis de acessar. Nós realmente não sabemos porque o slot SIM foi posicionado embaixo do SSD M.2 e o módulo Wi-Fi. A tela usa PWM para quase todas as configurações e o processador é ligeiramente desacelerado pelo TDP quando coloca todos os núcleos sob estresse. A HP também poderia melhorar um pouco o teclado. Obtivemos um bom dispositivo de entrada, mas o Lenovo ThinkPad P50 ainda é um pouco melhor neste quesito, que também é o caso para as emissões. Outro fator é obviamente o alto preço, embora os aparelhos de comparação, de fato, não diferem tanto quando são configurados com os mesmos componentes.
O HP ZBook 15 G3 é uma atualização bem-sucedida de seu workstation móvel e oferece um excelente aparelho de trabalho, mas não é um produto barato.
Este é um bom momento para os usuários de workstations móveis, porque depois do ThinkPad P50 da Lenovo, o ZBook 15 G3 já é o segundo workstation completo deste ano, que conseguiu nos convencer em muitos aspectos. Certamente existem diferenças entre os dois aparelhos, portanto isto finalmente acaba sendo uma questão de preferência pessoal. O ZBook ganha pontos com um melhor design e a tela FHD mais brilhante, enquanto o ThinkPad oferece um teclado melhor e emissões mais baixas. A situação poderia ficar ainda mais interessante com o Dell Precision 7510, porque provavelmente obteremos outro excelente aparelho.
Esta é uma versão reduzida da análise original. Você pode ler a análise completa em inglês aqui.
HP ZBook 15 G3
-
04/18/2016 v5.1(old)
Andreas Osthoff
Pricecompare
