 Deutsch
 English
 Español
 Français
 Italiano
 Nederlands
 Polski
 Português
 Русский
 Türkçe
 Svenska
 Chinese
 Magyar
Breve Análise do Workstation HP ZBook Studio G3
| |||||||||||||||||||||||||
iluminação: 86 %
iluminação com acumulador: 307 cd/m²
Contraste: 1069:1 (Preto: 0.29 cd/m²)
ΔE Color 5.9 | 0.5-29.43 Ø5
ΔE Greyscale 5.5 | 0.57-98 Ø5.3
99.9% sRGB (Calman 2D)
99% sRGB (Argyll 1.6.3 3D)
85% AdobeRGB 1998 (Argyll 1.6.3 3D)
98% AdobeRGB 1998 (Argyll 2.2.0 3D)
98.9% sRGB (Argyll 2.2.0 3D)
86% Display P3 (Argyll 2.2.0 3D)
Gamma: 2.09
| HP ZBook Studio G3 15.60, 3840x2160, IPS | Dell Precision 5510 15.60, 3840x2160, IGZO LED | MSI WS60-6QJE316H11 15.60, 3840x2160, IPS | Lenovo ThinkPad P50 15.60, 1920x1080, IPS | Lenovo ThinkPad P50s-20FKS00400 15.50, 2880x1620, IPS | HP ZBook 15 G3 15.60, 1920x1080, UWVA-IPS | HP ZBook 15u G3 15.60, 1920x1080, TN LED | Apple MacBook Pro Retina 15 inch 2015-05 15.40, 2880x1800, IPS-Panel | |
|---|---|---|---|---|---|---|---|---|
| Display | 2% | -31% | -51% | -24% | -18% | -34% | -24% | |
| Display P3 Coverage | 86 | 88.4 3% | 55.1 -36% | 39.13 -54% | 63.7 -26% | 66.8 -22% | 53.2 -38% | 61.4 -29% |
| sRGB Coverage | 98.9 | 100 1% | 83 -16% | 58.5 -41% | 87.6 -11% | 95.5 -3% | 80.1 -19% | 90.8 -8% |
| AdobeRGB 1998 Coverage | 98 | 99.5 2% | 56.9 -42% | 40.45 -59% | 63.8 -35% | 69 -30% | 54.9 -44% | 62.9 -36% |
| Response Times | -38% | 193% | -9% | 0% | -26% | -18% | ||
| Response Time Grey 50% / Grey 80% * | 44 ? | 56.4 ? -28% | 34 ? 23% | 46 ? -5% | 38 ? 14% | 54 ? -23% | 45.6 ? -4% | |
| Response Time Black / White * | 23.2 ? | 34 ? -47% | 24 ? -3% | 26 ? -12% | 28.8 ? -24% | 35.6 ? -53% | 34.4 ? -48% | |
| PWM Frequency | 200 ? | 1316 ? 558% | 219 ? 10% | 198 ? -1% | 198.4 ? -1% | |||
| Screen | 7% | -6% | -10% | -2% | -8% | -48% | 15% | |
| Brightness middle | 310 | 391 26% | 237 -24% | 263 -15% | 319 3% | 306 -1% | 297.8 -4% | 341 10% |
| Brightness | 299 | 361 21% | 208 -30% | 236 -21% | 290 -3% | 289 -3% | 284 -5% | 315 5% |
| Brightness Distribution | 86 | 87 1% | 77 -10% | 78 -9% | 82 -5% | 85 -1% | 89 3% | 82 -5% |
| Black Level * | 0.29 | 0.4 -38% | 0.26 10% | 0.34 -17% | 0.31 -7% | 0.34 -17% | 0.849 -193% | 0.34 -17% |
| Contrast | 1069 | 978 -9% | 912 -15% | 774 -28% | 1029 -4% | 900 -16% | 351 -67% | 1003 -6% |
| Colorchecker dE 2000 * | 5.9 | 4.85 18% | 4.42 25% | 2.35 60% | 4.8 19% | 5.1 14% | 8.68 -47% | 2.07 65% |
| Colorchecker dE 2000 max. * | 10.7 | 8.54 20% | 7.8 27% | 9.9 7% | 14.98 -40% | 3.27 69% | ||
| Greyscale dE 2000 * | 5.5 | 4.01 27% | 4.43 19% | 3.33 39% | 5.7 -4% | 7.4 -35% | 9.3 -69% | 1.9 65% |
| Gamma | 2.09 105% | 2.18 101% | 2.23 99% | 2.38 92% | 2.07 106% | 2.37 93% | 2.27 97% | 2.62 84% |
| CCT | 5980 109% | 7340 89% | 6133 106% | 6917 94% | 6260 104% | 7263 89% | 10585 61% | 6514 100% |
| Color Space (Percent of AdobeRGB 1998) | 85 | 96 13% | 52.5 -38% | 37 -56% | 56.9 -33% | 63 -26% | 50.99 -40% | 58 -32% |
| Color Space (Percent of sRGB) | 99 | 100 1% | 82.9 -16% | 58 -41% | 87.4 -12% | 95 -4% | 80.42 -19% | 91 -8% |
| Total Average (Program / Settings) | -10% /
-1% | 52% /
27% | -23% /
-19% | -9% /
-6% | -17% /
-13% | -33% /
-40% | -5% /
6% |
* ... smaller is better
Display Response Times
| ↔ Response Time Black to White | ||
|---|---|---|
| 23.2 ms ... rise ↗ and fall ↘ combined | ↗ 6 ms rise | 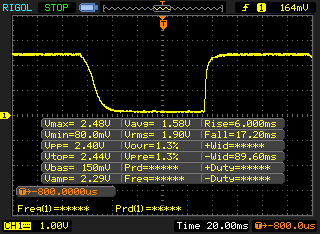 |
| ↘ 17.2 ms fall | ||
| The screen shows good response rates in our tests, but may be too slow for competitive gamers. In comparison, all tested devices range from 0.1 (minimum) to 240 (maximum) ms. » 47 % of all devices are better. This means that the measured response time is similar to the average of all tested devices (21.5 ms). | ||
| ↔ Response Time 50% Grey to 80% Grey | ||
| 44 ms ... rise ↗ and fall ↘ combined | ↗ 17 ms rise | 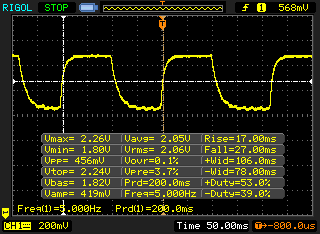 |
| ↘ 27 ms fall | ||
| The screen shows slow response rates in our tests and will be unsatisfactory for gamers. In comparison, all tested devices range from 0.2 (minimum) to 636 (maximum) ms. » 69 % of all devices are better. This means that the measured response time is worse than the average of all tested devices (33.7 ms). | ||
Screen Flickering / PWM (Pulse-Width Modulation)
| Screen flickering / PWM detected | 200 Hz | ≤ 55 % brightness setting |  |
The display backlight flickers at 200 Hz (worst case, e.g., utilizing PWM) Flickering detected at a brightness setting of 55 % and below. There should be no flickering or PWM above this brightness setting. The frequency of 200 Hz is relatively low, so sensitive users will likely notice flickering and experience eyestrain at the stated brightness setting and below. In comparison: 53 % of all tested devices do not use PWM to dim the display. If PWM was detected, an average of 17924 (minimum: 5 - maximum: 3846000) Hz was measured. | |||
| Cinebench R10 | |
| Rendering Multiple CPUs 32Bit | |
| HP ZBook 15 G3 | |
| Dell Precision 5510 | |
| HP ZBook Studio G3 | |
| MSI WS60-6QJE316H11 | |
| Apple MacBook Pro Retina 15 inch 2015-05 | |
| Lenovo ThinkPad P50 | |
| HP ZBook 15u G3 | |
| Lenovo ThinkPad P50s-20FKS00400 | |
| Rendering Single 32Bit | |
| MSI WS60-6QJE316H11 | |
| HP ZBook 15 G3 | |
| HP ZBook Studio G3 | |
| HP ZBook 15u G3 | |
| Dell Precision 5510 | |
| Apple MacBook Pro Retina 15 inch 2015-05 | |
| Lenovo ThinkPad P50s-20FKS00400 | |
| Lenovo ThinkPad P50 | |
| Rendering Multiple CPUs 64Bit | |
| HP ZBook 15 G3 | |
| Dell Precision 5510 | |
| HP ZBook Studio G3 | |
| Apple MacBook Pro Retina 15 inch 2015-05 | |
| MSI WS60-6QJE316H11 | |
| Lenovo ThinkPad P50 | |
| Lenovo ThinkPad P50s-20FKS00400 | |
| Rendering Single CPUs 64Bit | |
| MSI WS60-6QJE316H11 | |
| HP ZBook 15 G3 | |
| Apple MacBook Pro Retina 15 inch 2015-05 | |
| HP ZBook Studio G3 | |
| Dell Precision 5510 | |
| Lenovo ThinkPad P50s-20FKS00400 | |
| Lenovo ThinkPad P50 | |
| PCMark 8 | |
| Work Score Accelerated v2 | |
| HP ZBook 15 G3 | |
| Dell Precision 5510 | |
| HP ZBook 15u G3 | |
| Lenovo ThinkPad P50 | |
| Apple MacBook Pro Retina 15 inch 2015-05 | |
| HP ZBook Studio G3 | |
| MSI WS60-6QJE316H11 | |
| Lenovo ThinkPad P50s-20FKS00400 | |
| Creative Score Accelerated v2 | |
| Apple MacBook Pro Retina 15 inch 2015-05 | |
| HP ZBook 15u G3 | |
| Dell Precision 5510 | |
| HP ZBook 15 G3 | |
| HP ZBook Studio G3 | |
| Home Score Accelerated v2 | |
| Lenovo ThinkPad P50 | |
| HP ZBook 15u G3 | |
| HP ZBook 15 G3 | |
| Dell Precision 5510 | |
| Apple MacBook Pro Retina 15 inch 2015-05 | |
| HP ZBook Studio G3 | |
| MSI WS60-6QJE316H11 | |
| Lenovo ThinkPad P50s-20FKS00400 | |
| PCMark 7 - Score | |
| HP ZBook 15 G3 | |
| HP ZBook 15u G3 | |
| Apple MacBook Pro Retina 15 inch 2015-05 | |
| MSI WS60-6QJE316H11 | |
| HP ZBook Studio G3 | |
| Dell Precision 5510 | |
| Lenovo ThinkPad P50s-20FKS00400 | |
| Lenovo ThinkPad P50 | |
| PCMark 7 Score | 5336 pontos | |
| PCMark 8 Home Score Accelerated v2 | 3262 pontos | |
| PCMark 8 Creative Score Accelerated v2 | 4235 pontos | |
| PCMark 8 Work Score Accelerated v2 | 4301 pontos | |
Ajuda | ||

| LuxMark v2.0 64Bit | |
| Room GPUs-only | |
| HP ZBook 15 G3 | |
| MSI WS60-6QJE316H11 | |
| HP ZBook Studio G3 | |
| Lenovo ThinkPad P50 | |
| Dell Precision 5510 | |
| Apple MacBook Pro Retina 15 inch 2015-05 | |
| Lenovo ThinkPad P50s-20FKS00400 | |
| Sala GPUs-only | |
| HP ZBook 15 G3 | |
| HP ZBook Studio G3 | |
| MSI WS60-6QJE316H11 | |
| Lenovo ThinkPad P50 | |
| HP ZBook 15u G3 | |
| Lenovo ThinkPad P50s-20FKS00400 | |
| Dell Precision 5510 | |
| Apple MacBook Pro Retina 15 inch 2015-05 | |
| SiSoft Sandra 2016 | |
| Image Processing | |
| HP ZBook 15 G3 | |
| HP ZBook Studio G3 | |
| MSI WS60-6QJE316H11 | |
| Lenovo ThinkPad P50 | |
| Dell Precision 5510 | |
| Lenovo ThinkPad P50s-20FKS00400 | |
| GP Cryptography (Higher Security AES256+SHA2-512) | |
| Lenovo ThinkPad P50 | |
| HP ZBook 15 G3 | |
| MSI WS60-6QJE316H11 | |
| HP ZBook Studio G3 | |
| Dell Precision 5510 | |
| Lenovo ThinkPad P50s-20FKS00400 | |
| GP Financial Analysis (FP High/Double Precision) | |
| HP ZBook 15 G3 | |
| Lenovo ThinkPad P50 | |
| MSI WS60-6QJE316H11 | |
| Dell Precision 5510 | |
| HP ZBook Studio G3 | |
| Lenovo ThinkPad P50s-20FKS00400 | |
| Unigine Heaven 3.0 | |
| 1920x1080 DX 11, Normal Tessellation, High Shaders AA:Off AF:Off | |
| MSI WS60-6QJE316H11 | |
| Lenovo ThinkPad P50 | |
| HP ZBook 15 G3 | |
| Dell Precision 5510 | |
| HP ZBook Studio G3 | |
| Lenovo ThinkPad P50s-20FKS00400 | |
| 1920x1080 OpenGL, Normal Tessellation, High Shaders AA:Off AF:Off | |
| HP ZBook 15 G3 | |
| HP ZBook Studio G3 | |
| Dell Precision 5510 | |
| MSI WS60-6QJE316H11 | |
| Lenovo ThinkPad P50 | |
| Lenovo ThinkPad P50s-20FKS00400 | |
| Unigine Valley 1.0 | |
| 1920x1080 Extreme HD DirectX AA:x8 | |
| Lenovo ThinkPad P50 | |
| HP ZBook 15 G3 | |
| MSI WS60-6QJE316H11 | |
| HP ZBook Studio G3 | |
| Dell Precision 5510 | |
| Lenovo ThinkPad P50s-20FKS00400 | |
| 1920x1080 Extreme HD Preset OpenGL AA:x8 | |
| HP ZBook 15 G3 | |
| HP ZBook Studio G3 | |
| Dell Precision 5510 | |
| MSI WS60-6QJE316H11 | |
| Lenovo ThinkPad P50 | |
| Lenovo ThinkPad P50s-20FKS00400 | |
| 3DMark | |
| 1920x1080 Fire Strike Score | |
| Asus G501VW-FY081T | |
| MSI WS60-6QJE316H11 | |
| HP ZBook 15 G3 | |
| Lenovo ThinkPad P50 | |
| Dell Precision 5510 | |
| HP ZBook Studio G3 | |
| Asus N752VX-GC131T | |
| Apple MacBook Pro Retina 15 inch 2015-05 | |
| HP ZBook 15u G3 | |
| Lenovo ThinkPad P50s-20FKS00400 | |
| 1920x1080 Fire Strike Graphics | |
| Asus G501VW-FY081T | |
| MSI WS60-6QJE316H11 | |
| Lenovo ThinkPad P50 | |
| HP ZBook 15 G3 | |
| Dell Precision 5510 | |
| HP ZBook Studio G3 | |
| Asus N752VX-GC131T | |
| Apple MacBook Pro Retina 15 inch 2015-05 | |
| Lenovo ThinkPad P50s-20FKS00400 | |
| HP ZBook 15u G3 | |
| 3DMark 06 Standard Score | 24393 pontos | |
| 3DMark 11 Performance | 4673 pontos | |
| 3DMark Ice Storm Standard Score | 42096 pontos | |
| 3DMark Cloud Gate Standard Score | 15717 pontos | |
| 3DMark Fire Strike Score | 3302 pontos | |
Ajuda | ||
| baixo | média | alto | ultra | 4K | |
| BioShock Infinite (2013) | 176.7 | 115 | 100.1 | 37 | |
| The Witcher 3 (2015) | 59.4 | 36.5 | 20.8 | 10.8 | 7.7 |
| Rainbow Six Siege (2015) | 137.8 | 79.9 | 43.5 | 32 | 13.2 |
Barulho
| Ocioso |
| 30 / 30 / 30 dB |
| Carga |
| 51 / 52.8 dB |
 | ||
30 dB silencioso 40 dB(A) audível 50 dB(A) ruidosamente alto |
||
min: | ||
| HP ZBook Studio G3 6820HQ, Quadro M1000M | Dell Precision 5510 E3-1505M v5, Quadro M1000M | MSI WS60-6QJE316H11 E3-1505M v5, Quadro M2000M | Lenovo ThinkPad P50 6820HQ, Quadro M2000M | Lenovo ThinkPad P50s-20FKS00400 6500U, Quadro M500M | HP ZBook 15 G3 E3-1505M v5, Quadro M2000M | HP ZBook 15u G3 6600U, FirePro W4190M | Apple MacBook Pro Retina 15 inch 2015-05 4870HQ, Radeon R9 M370X | |
|---|---|---|---|---|---|---|---|---|
| Noise | 6% | -10% | 10% | 11% | 3% | 9% | 7% | |
| off / environment * | 30 | 30 -0% | ||||||
| Idle Minimum * | 30 | 30 -0% | 37.2 -24% | 30 -0% | 30 -0% | 30 -0% | 29.8 1% | 28.9 4% |
| Idle Average * | 30 | 30 -0% | 37.2 -24% | 30 -0% | 30 -0% | 30 -0% | 29.8 1% | 28.9 4% |
| Idle Maximum * | 30 | 30 -0% | 37.2 -24% | 30 -0% | 30 -0% | 30 -0% | 29.8 1% | 28.9 4% |
| Load Average * | 51 | 42.08 17% | 42.1 17% | 34.5 32% | 33.5 34% | 45.3 11% | 39.5 23% | 46 10% |
| Load Maximum * | 52.8 | 46.78 11% | 50.7 4% | 42.1 20% | 41.9 21% | 49.7 6% | 43.2 18% | 46 13% |
* ... smaller is better
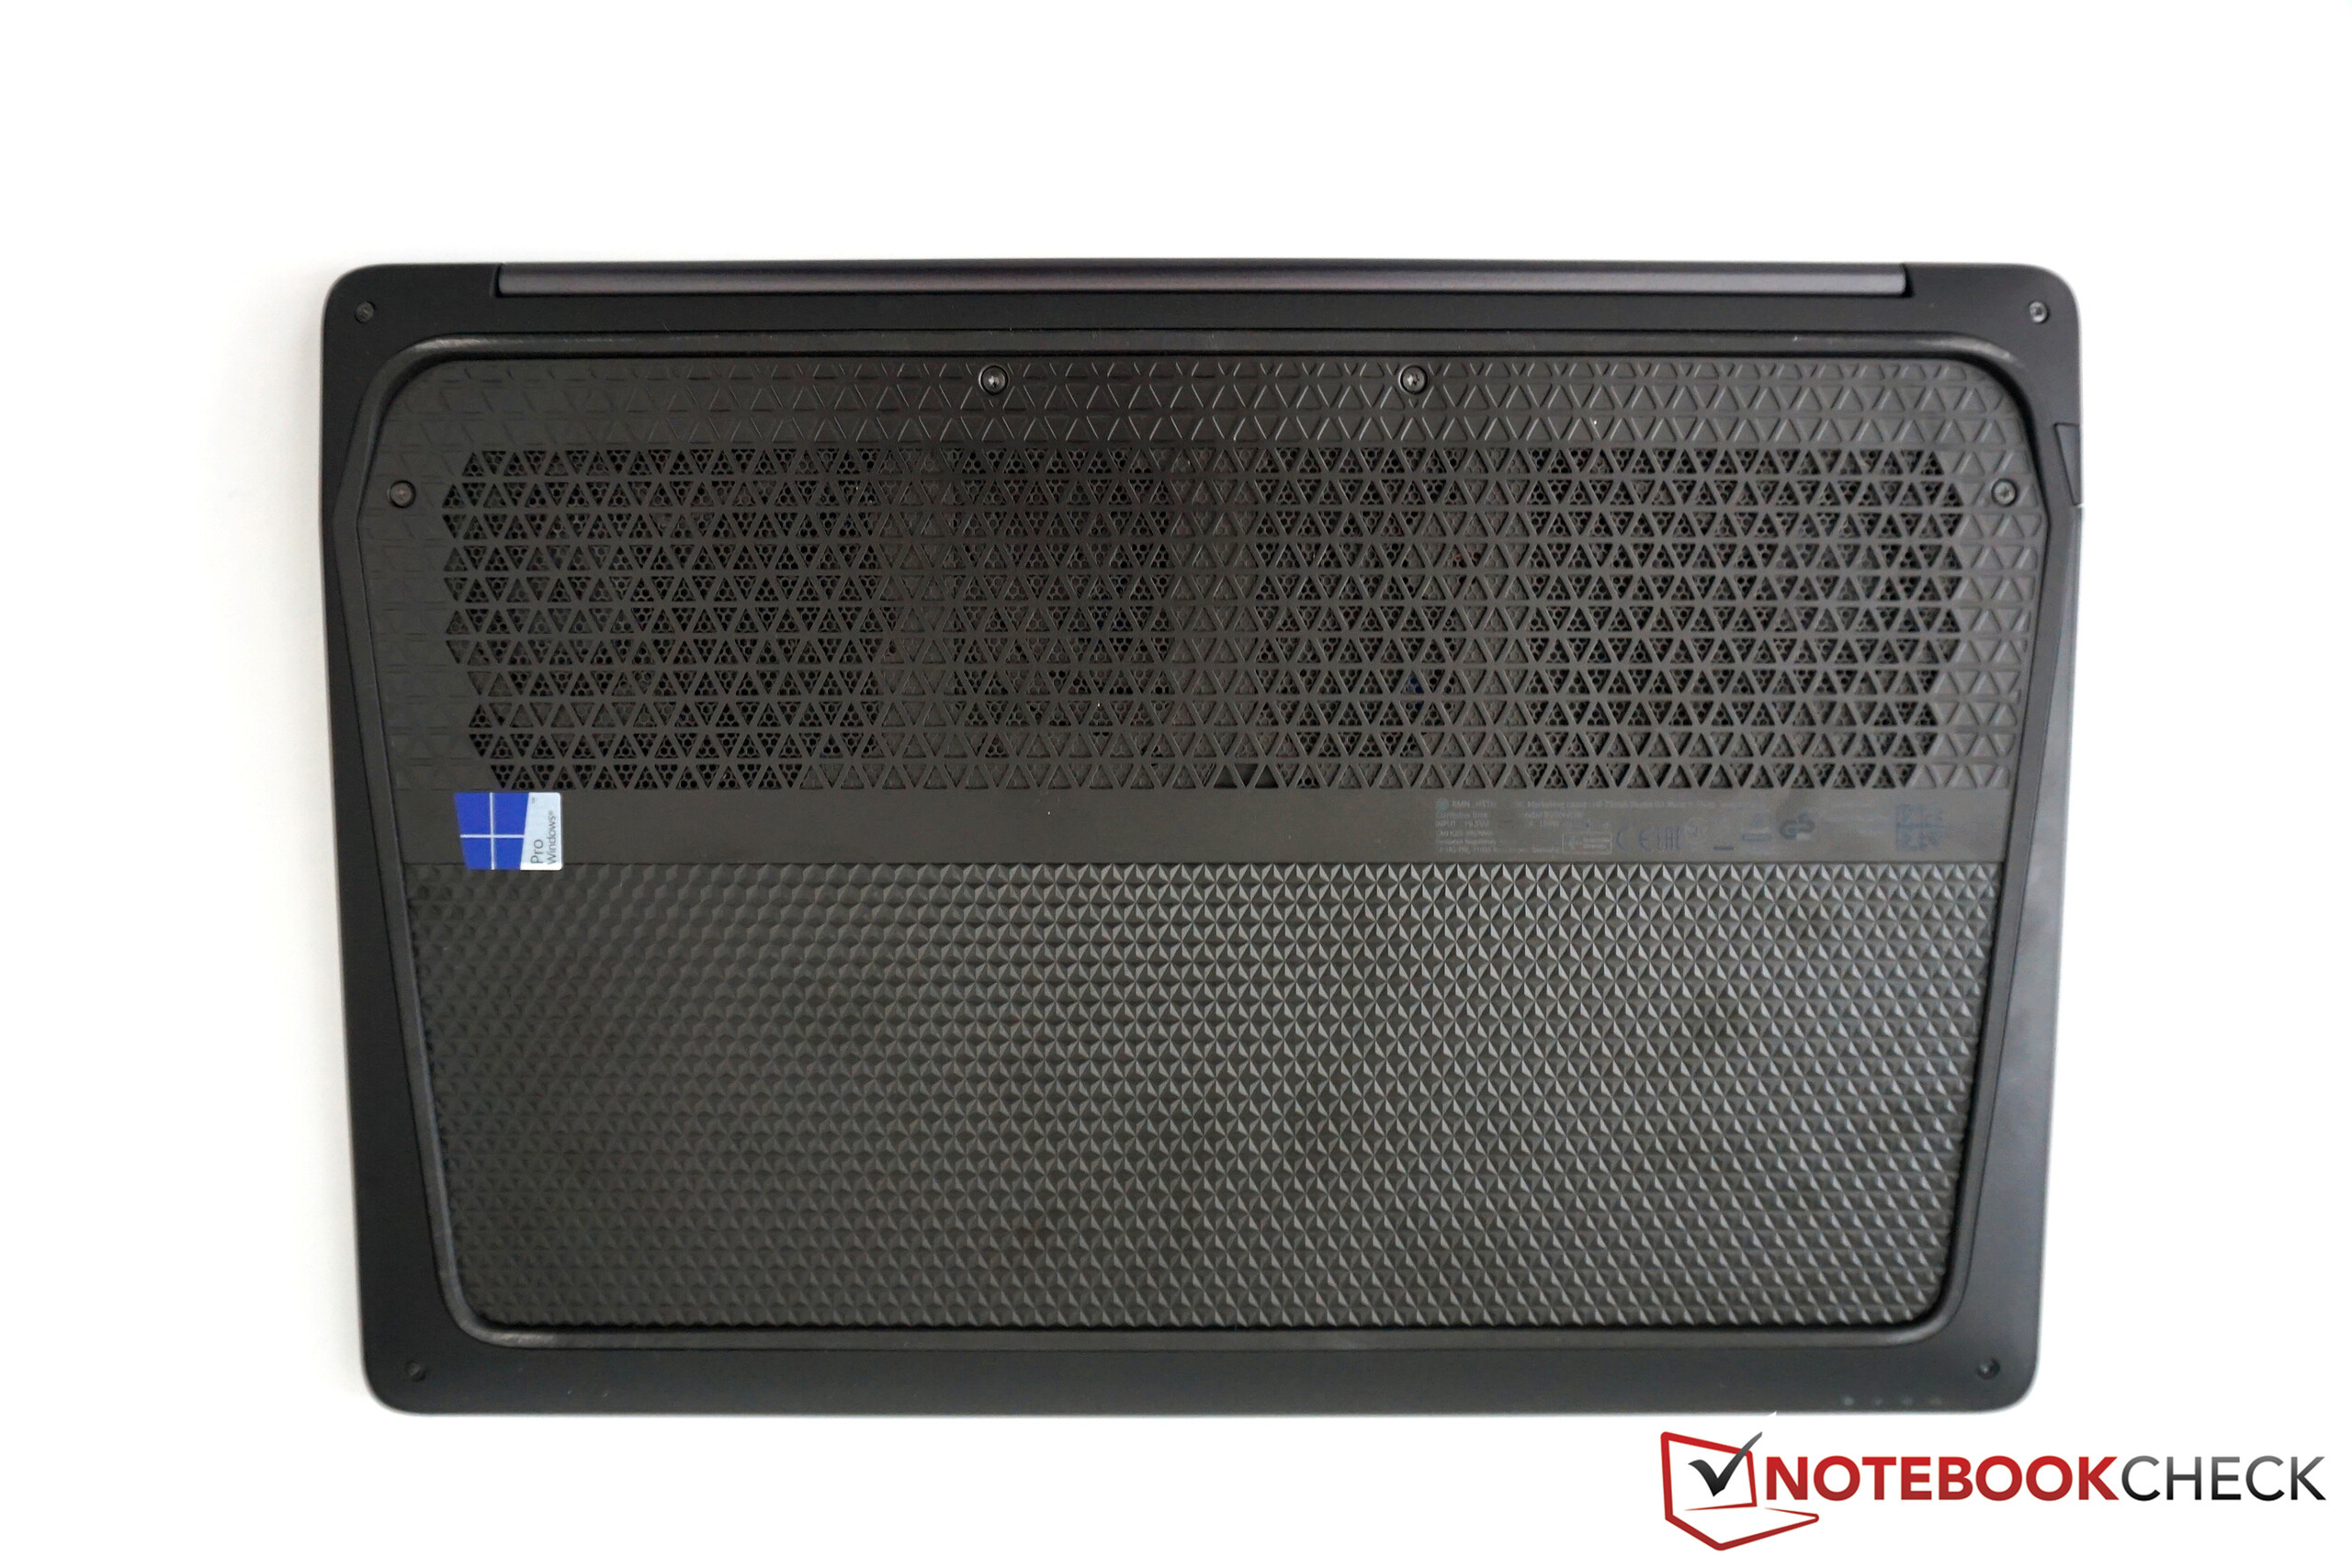
(-) The maximum temperature on the upper side is 69.8 °C / 158 F, compared to the average of 38.1 °C / 101 F, ranging from 22.2 to 69.8 °C for the class Workstation.
(-) The bottom heats up to a maximum of 77.3 °C / 171 F, compared to the average of 41.3 °C / 106 F
(+) In idle usage, the average temperature for the upper side is 30.1 °C / 86 F, compared to the device average of 32 °C / 90 F.
(±) The palmrests and touchpad can get very hot to the touch with a maximum of 38 °C / 100.4 F.
(-) The average temperature of the palmrest area of similar devices was 27.8 °C / 82 F (-10.2 °C / -18.4 F).
| HP ZBook Studio G3 6820HQ, Quadro M1000M | Dell Precision 5510 E3-1505M v5, Quadro M1000M | MSI WS60-6QJE316H11 E3-1505M v5, Quadro M2000M | Lenovo ThinkPad P50 6820HQ, Quadro M2000M | Lenovo ThinkPad P50s-20FKS00400 6500U, Quadro M500M | HP ZBook 15 G3 E3-1505M v5, Quadro M2000M | HP ZBook 15u G3 6600U, FirePro W4190M | Apple MacBook Pro Retina 15 inch 2015-05 4870HQ, Radeon R9 M370X | |
|---|---|---|---|---|---|---|---|---|
| Heat | 22% | 17% | 24% | 26% | 16% | 30% | 29% | |
| Maximum Upper Side * | 69.8 | 45.8 34% | 42.3 39% | 36.7 47% | 44.2 37% | 54.6 22% | 44.6 36% | 43.2 38% |
| Maximum Bottom * | 77.3 | 46.7 40% | 60.1 22% | 41.3 47% | 57.8 25% | 60.8 21% | 46 40% | 39 50% |
| Idle Upper Side * | 37.8 | 31.2 17% | 32.7 13% | 31.1 18% | 26.4 30% | 30.3 20% | 25.8 32% | 30 21% |
| Idle Bottom * | 31.4 | 31.9 -2% | 33.1 -5% | 36.2 -15% | 28.1 11% | 30.7 2% | 27.4 13% | 29.3 7% |
* ... smaller is better
| desligado | |
| Ocioso | |
| Carga |
|
| HP ZBook Studio G3 64 Wh, 3840x2160 | Dell Precision 5510 56 Wh, 3840x2160 | MSI WS60-6QJE316H11 47 Wh, 3840x2160 | Lenovo ThinkPad P50 90 Wh, 1920x1080 | Lenovo ThinkPad P50s-20FKS00400 67 Wh, 2880x1620 | HP ZBook 15 G3 90 Wh, 1920x1080 | HP ZBook 15u G3 90 Wh, 1920x1080 | Apple MacBook Pro Retina 15 inch 2015-05 100 Wh, 2880x1800 | |
|---|---|---|---|---|---|---|---|---|
| Power Consumption | -5% | -71% | 25% | 43% | 11% | 42% | 16% | |
| Idle Minimum * | 8.7 | 8.6 1% | 18.8 -116% | 5.6 36% | 4.3 51% | 5.7 34% | 4.3 51% | 6 31% |
| Idle Average * | 14.2 | 16.2 -14% | 29.6 -108% | 8.6 39% | 9.7 32% | 12.2 14% | 7.9 44% | 12.8 10% |
| Idle Maximum * | 14.4 | 16.7 -16% | 30.3 -110% | 9.3 35% | 10.2 29% | 12.6 12% | 11.5 20% | 13.3 8% |
| Load Average * | 85.6 | 82.6 4% | 90.4 -6% | 89.5 -5% | 45.7 47% | 83.1 3% | 43.3 49% | 82.4 4% |
| Load Maximum * | 129.7 | 131.8 -2% | 150.2 -16% | 105 19% | 55.8 57% | 138.2 -7% | 72.3 44% | 91.8 29% |
* ... smaller is better
| HP ZBook Studio G3 64 Wh | Dell Precision 5510 56 Wh | MSI WS60-6QJE316H11 47 Wh | Lenovo ThinkPad P50 90 Wh | Lenovo ThinkPad P50s-20FKS00400 67 Wh | HP ZBook 15 G3 90 Wh | HP ZBook 15u G3 90 Wh | Apple MacBook Pro Retina 15 inch 2015-05 100 Wh | |
|---|---|---|---|---|---|---|---|---|
| Battery Runtime | 19% | -45% | 104% | 112% | 78% | 72% | 89% | |
| Reader / Idle | 511 | 428 -16% | 160 -69% | 860 68% | 1107 117% | 822 61% | 756 48% | 1039 103% |
| H.264 | 228 | 197 -14% | 141 -38% | 533 134% | 537 136% | 449 97% | 413 81% | |
| WiFi v1.3 | 208 | 286 38% | 106 -49% | 498 139% | 408 96% | 386 86% | 312 50% | 432 108% |
| Load | 65 | 109 68% | 51 -22% | 113 74% | 129 98% | 110 69% | 141 117% | 105 62% |
| WiFi | 298 |
Pro
Contra
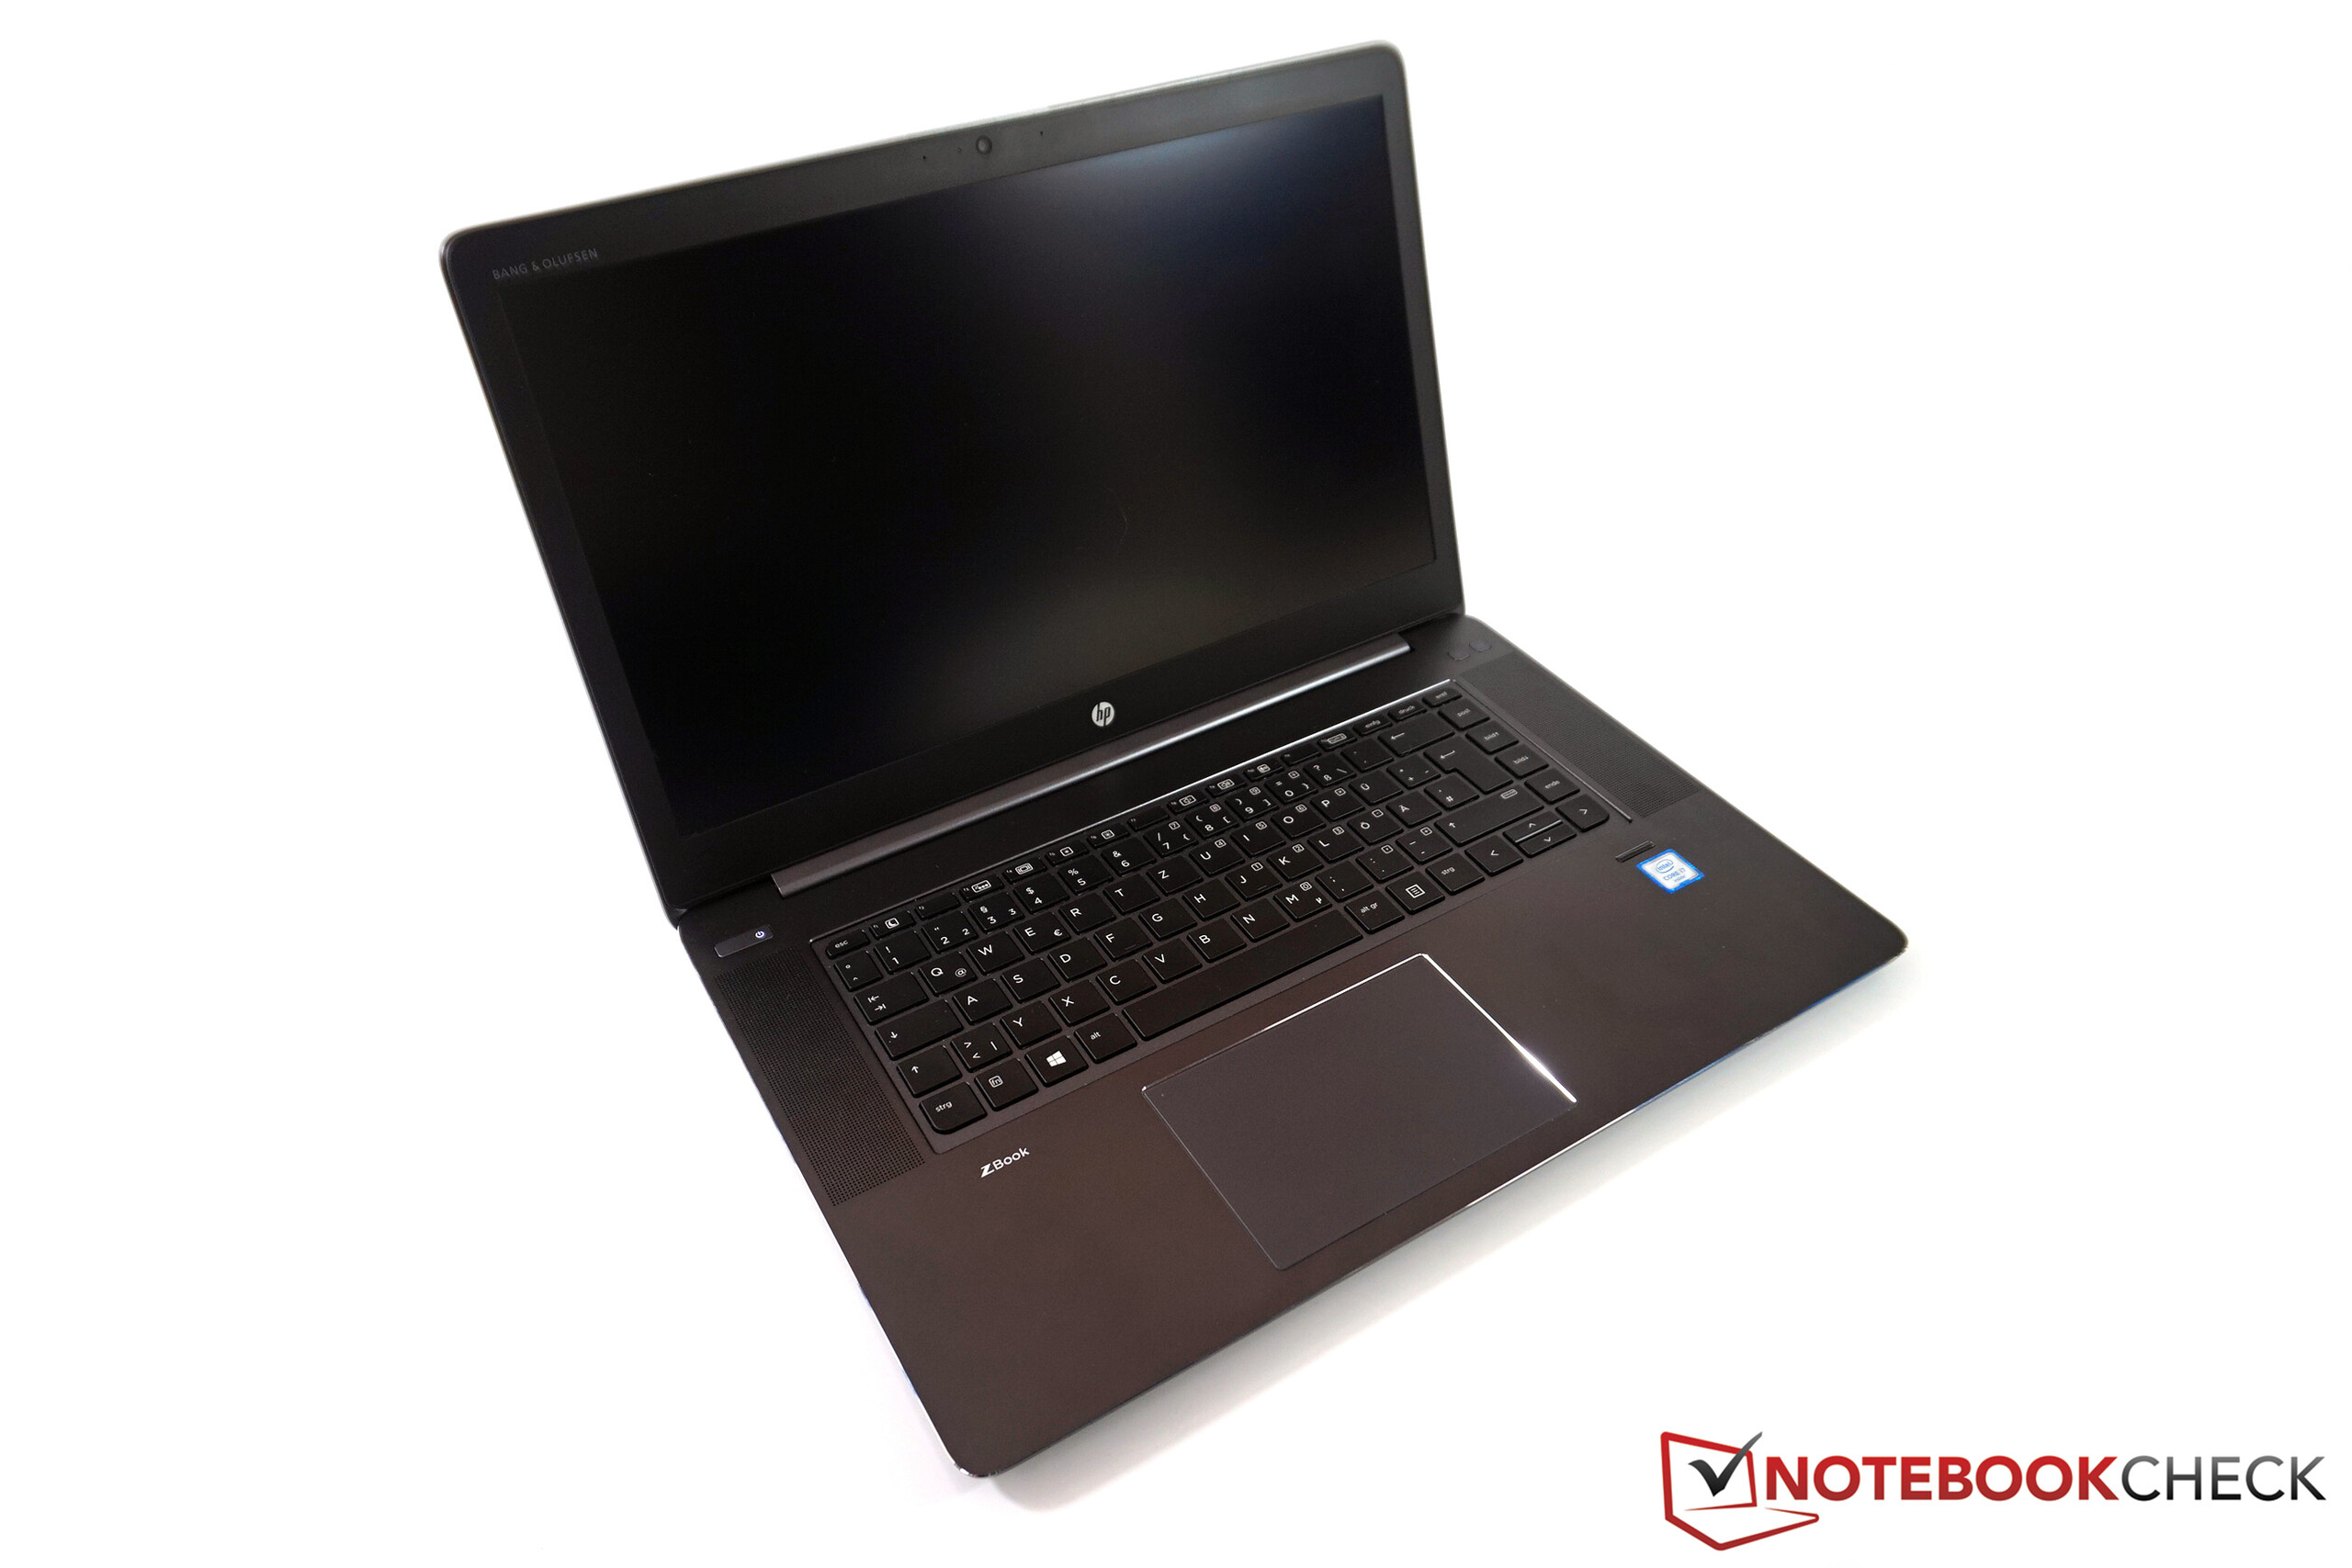
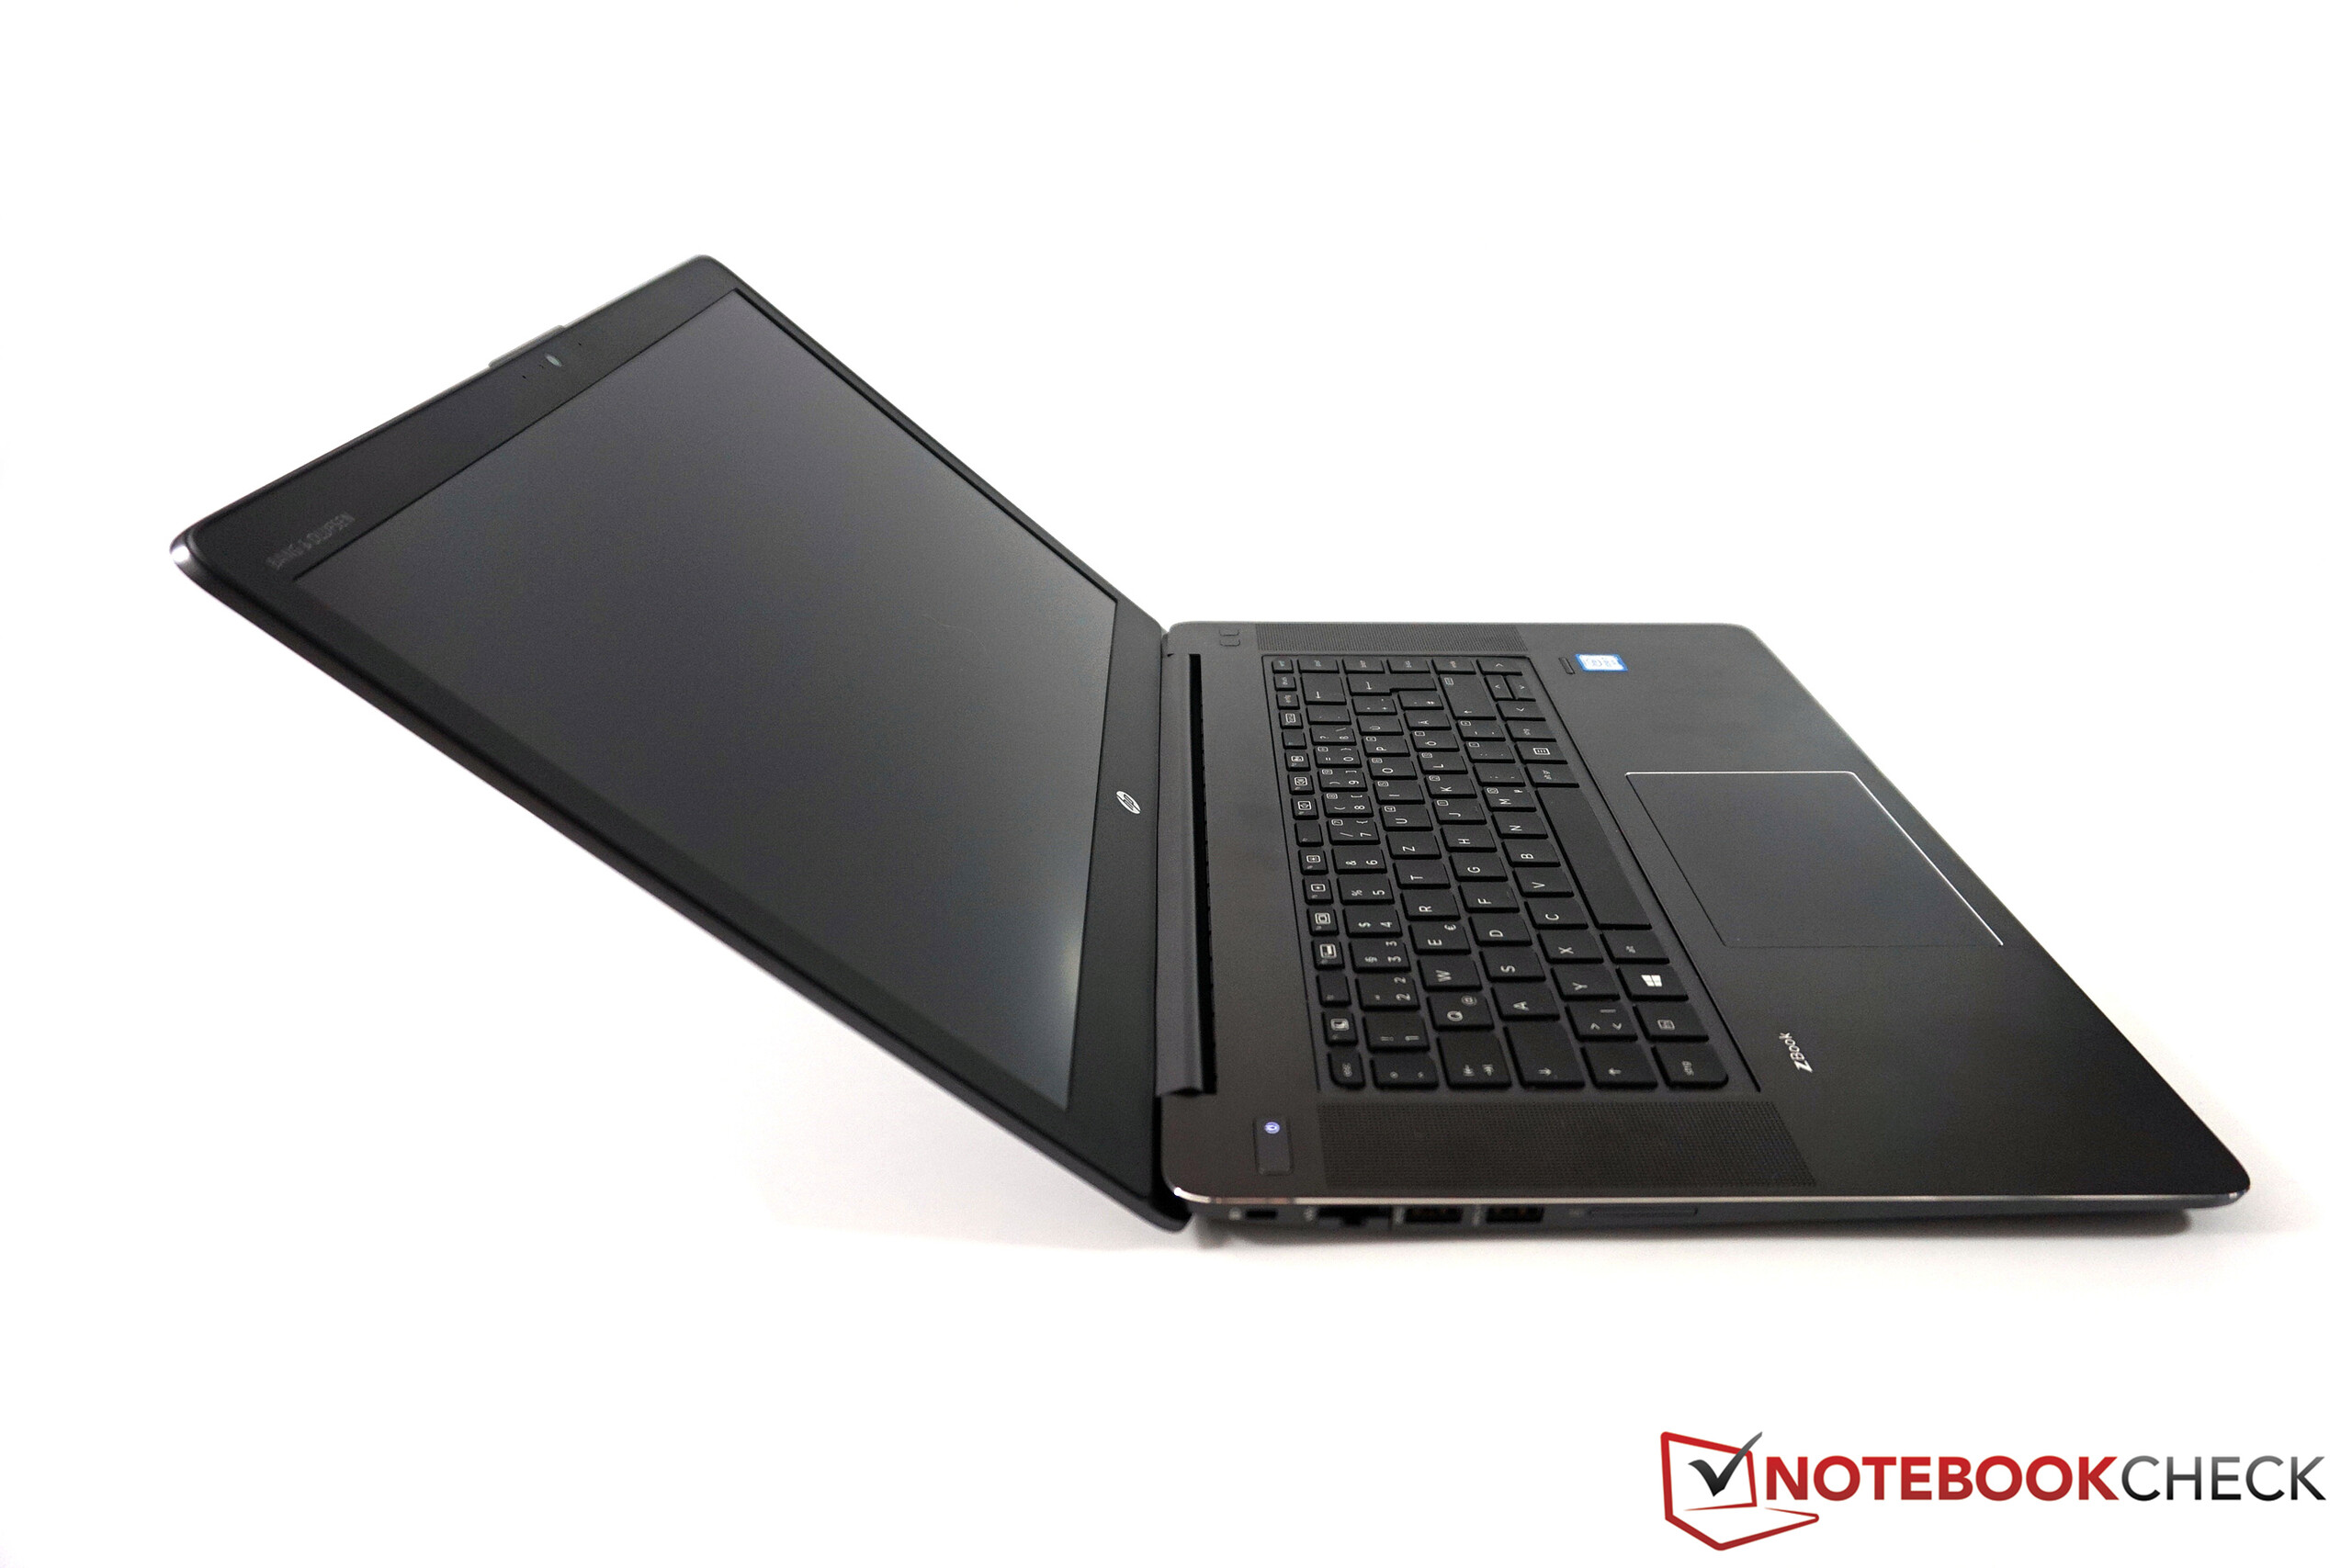
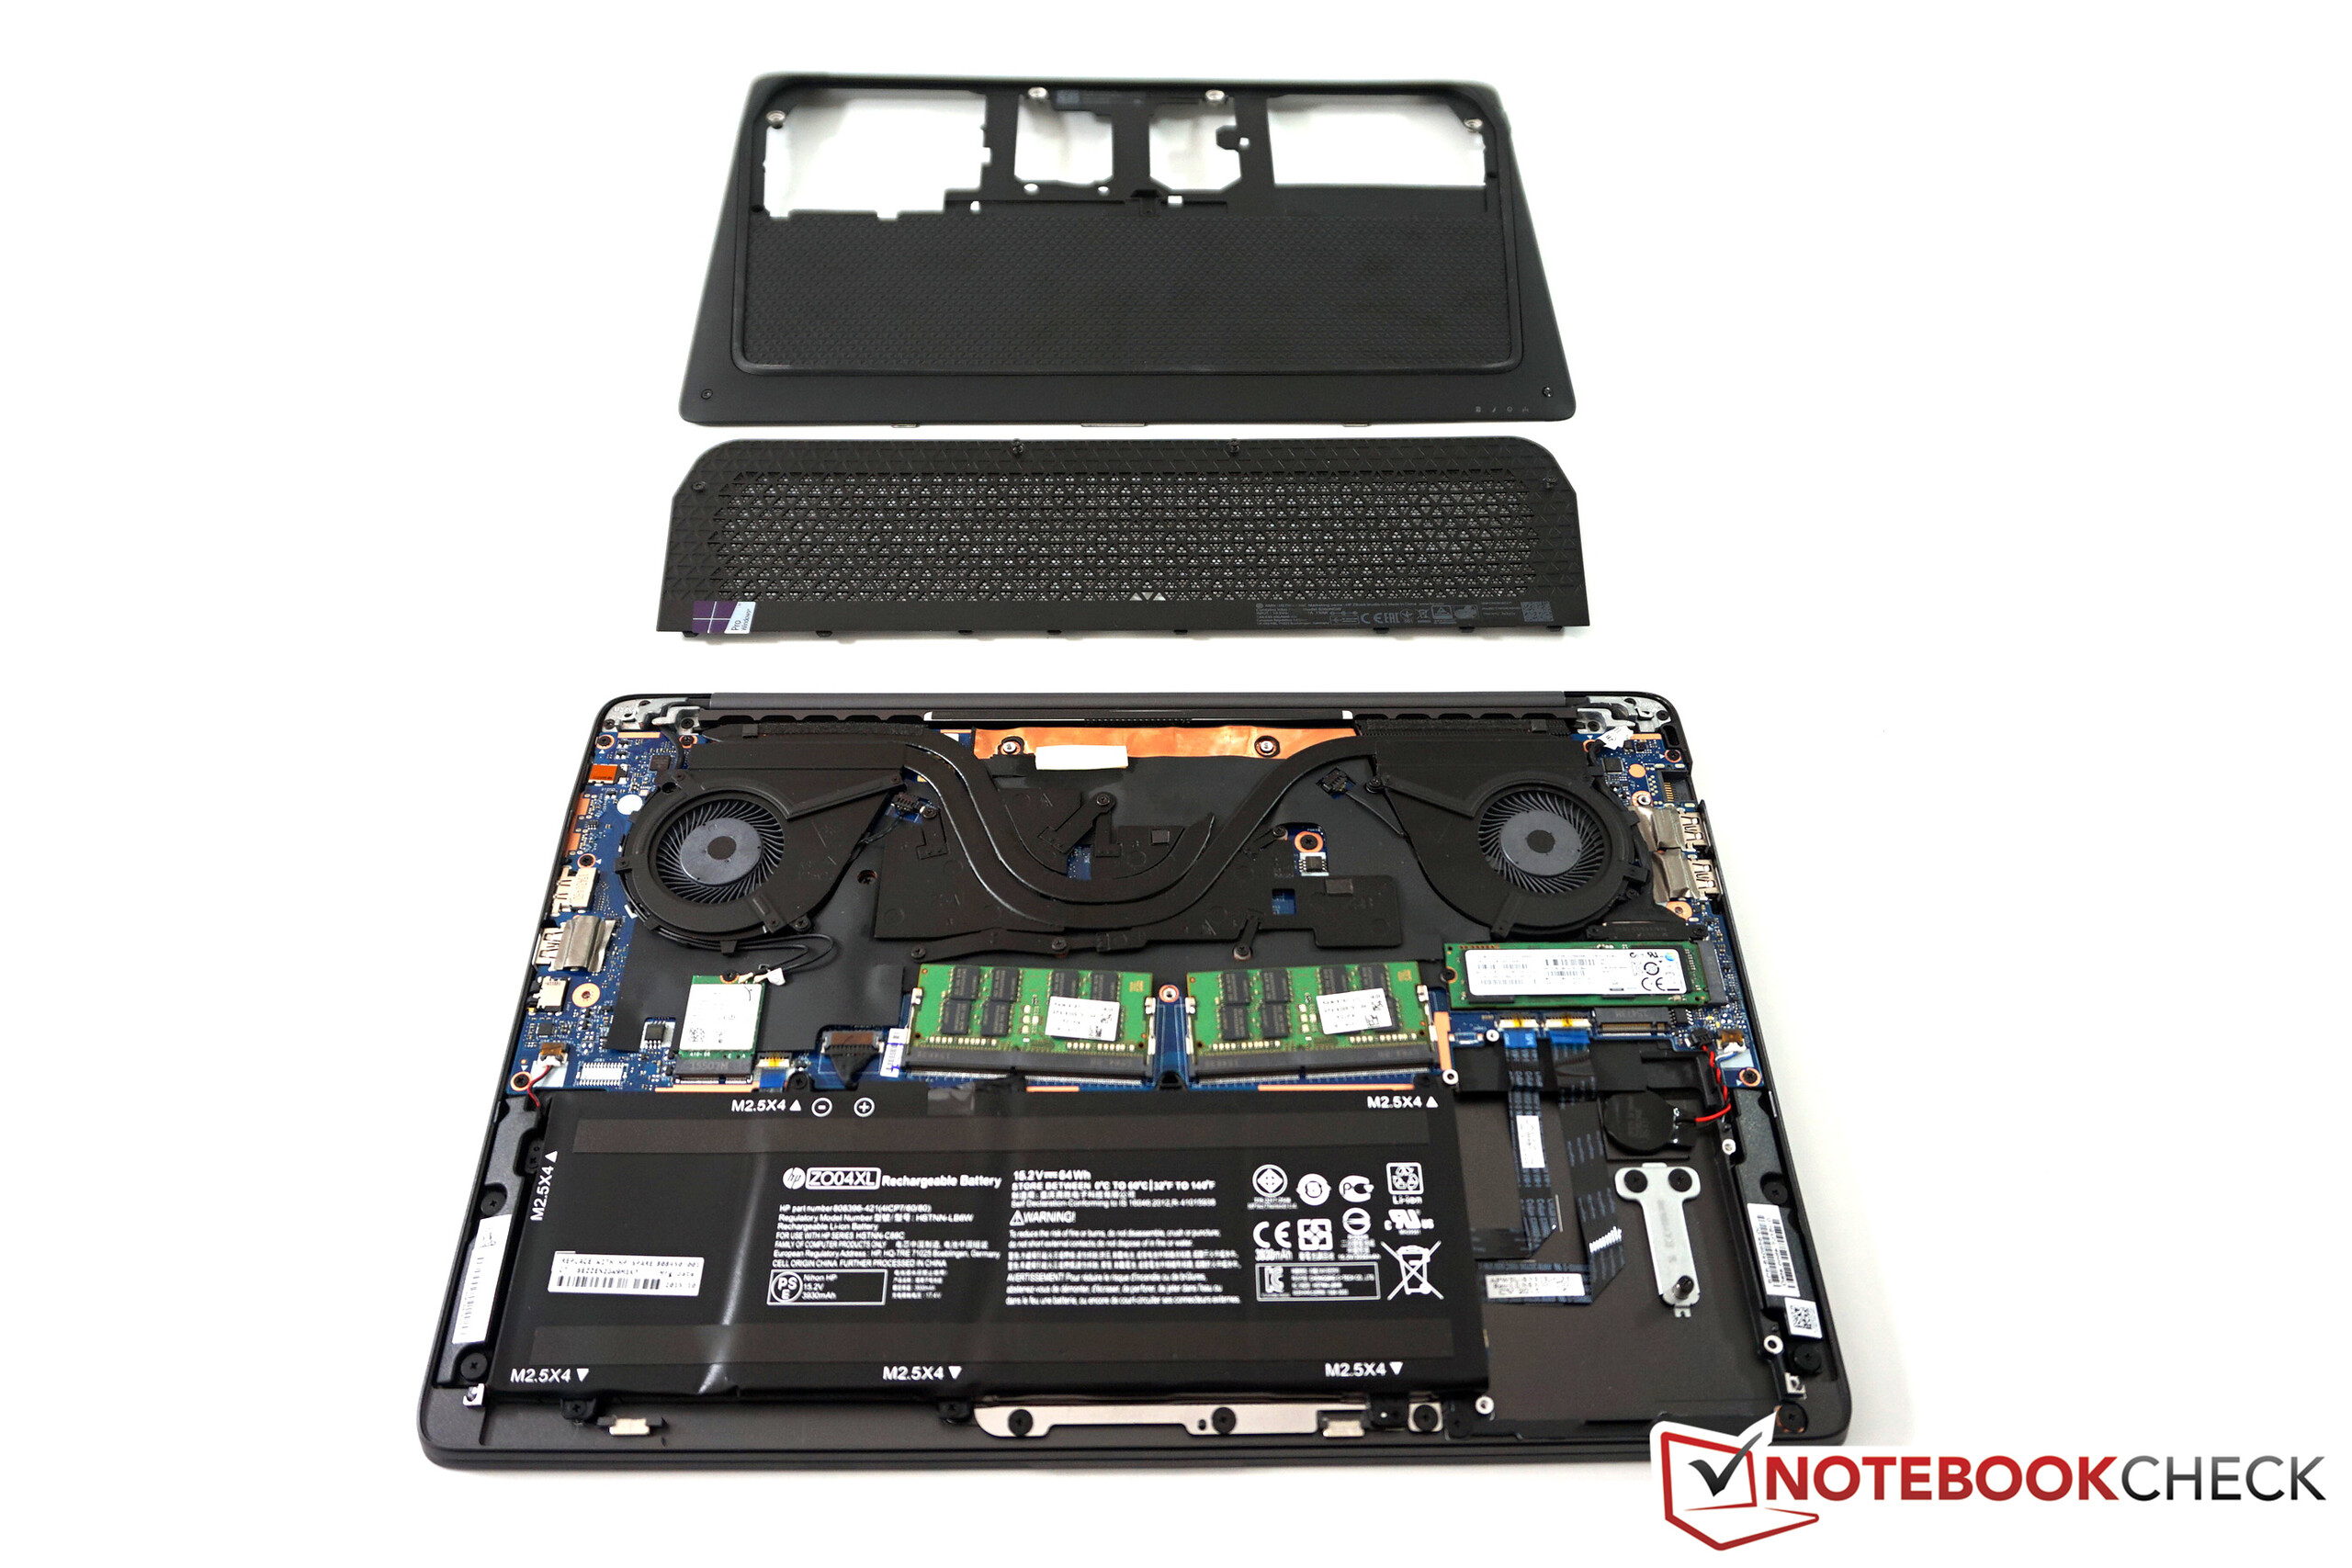
O ZBook Studio G3 é um pequeno mistério para nós. A HP entrega um ótimo produto em alguns aspectos, enquanto decepciona em outras categorias. Infelizmente, em geral, nossa impressão do ambicioso workstation é negativa. Este é o resultado principalmente das emissões, bem como das durações da bateria. As superfícies alcanças temperaturas extremamente altas que podem causar queimaduras, inclusive com o uso normal. O comportamento da ventoinha é muito perturbante, porque ambas as ventoinhas agem de forma independente, se tornam muito barulhentas e pulsam bastante. As durações práticas de menos de quatro horas também são difíceis de justificar para um aparelho que é, de fato, muito móvel. De outra forma, existem apenas pequenos problemas, como a falta de um leitor SmartCard e do módulo WWAN.
O ZBook Studio é um projeto ambicioso. Obtemos muito desempenho em um pacote compacto, mas também recebemos temperaturas extremas e ventoinhas perturbantes. Isto não deveria acontecer para um preço de cerca de 3800 Euros (~$4237).
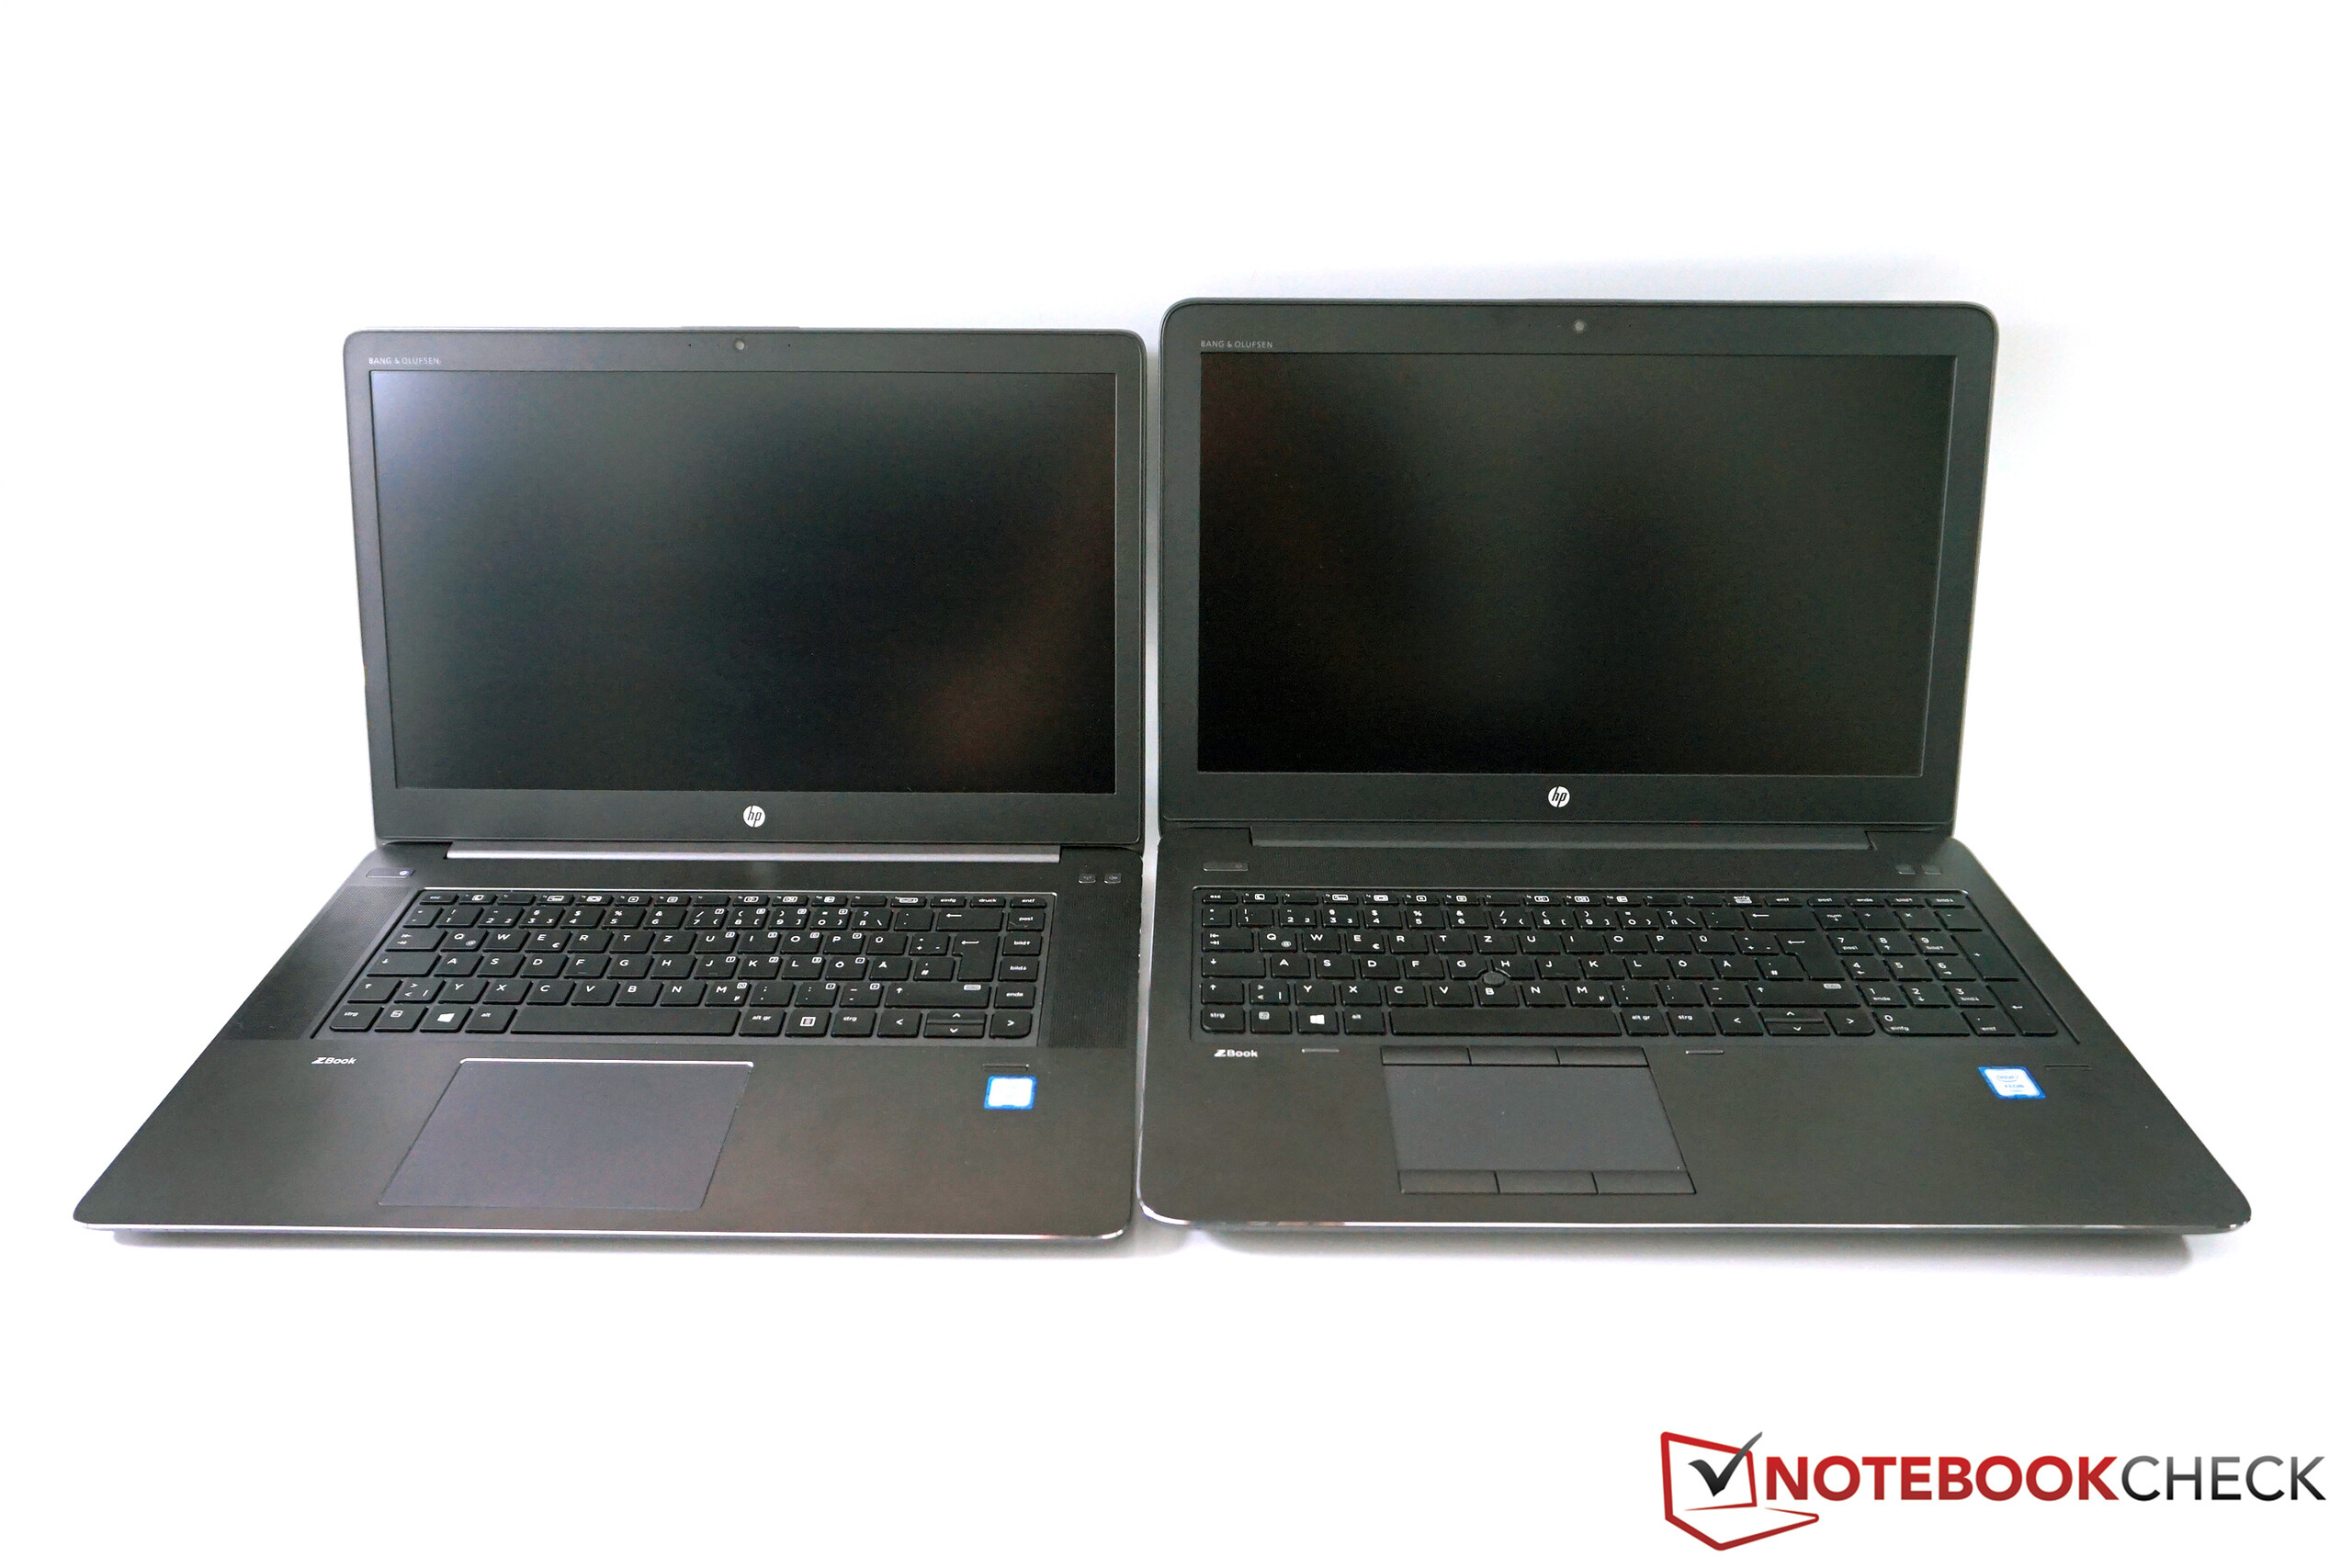
O ZBook Studio, de fato convence em muitos aspectos: Obtemos muito desempenho em um ótimo chassi, combinado com uma ótima tela 4K, bem como bons dispositivos de entrada. Ainda achamos que as limitações são simplesmente severas demais. E também está o preço extremamente alto de cerca de 3800 Euros (~$4237) por nossa configuração de teste, que é difícil de justificar, considerando os problemas. As atualizações do BIOS não melhoraram a situação até agora, mas esperamos que a HP possa, pelo menos, melhorar o perturbante controle das ventoinhas com uma futura atualização. Atualmente, os workstations maiores têm uma vantagem em termos de emissões e também podem ser equipados com componentes ainda mais poderosos.
Esta é uma versão reduzida da análise original. Você pode ler a análise completa em inglês aqui.
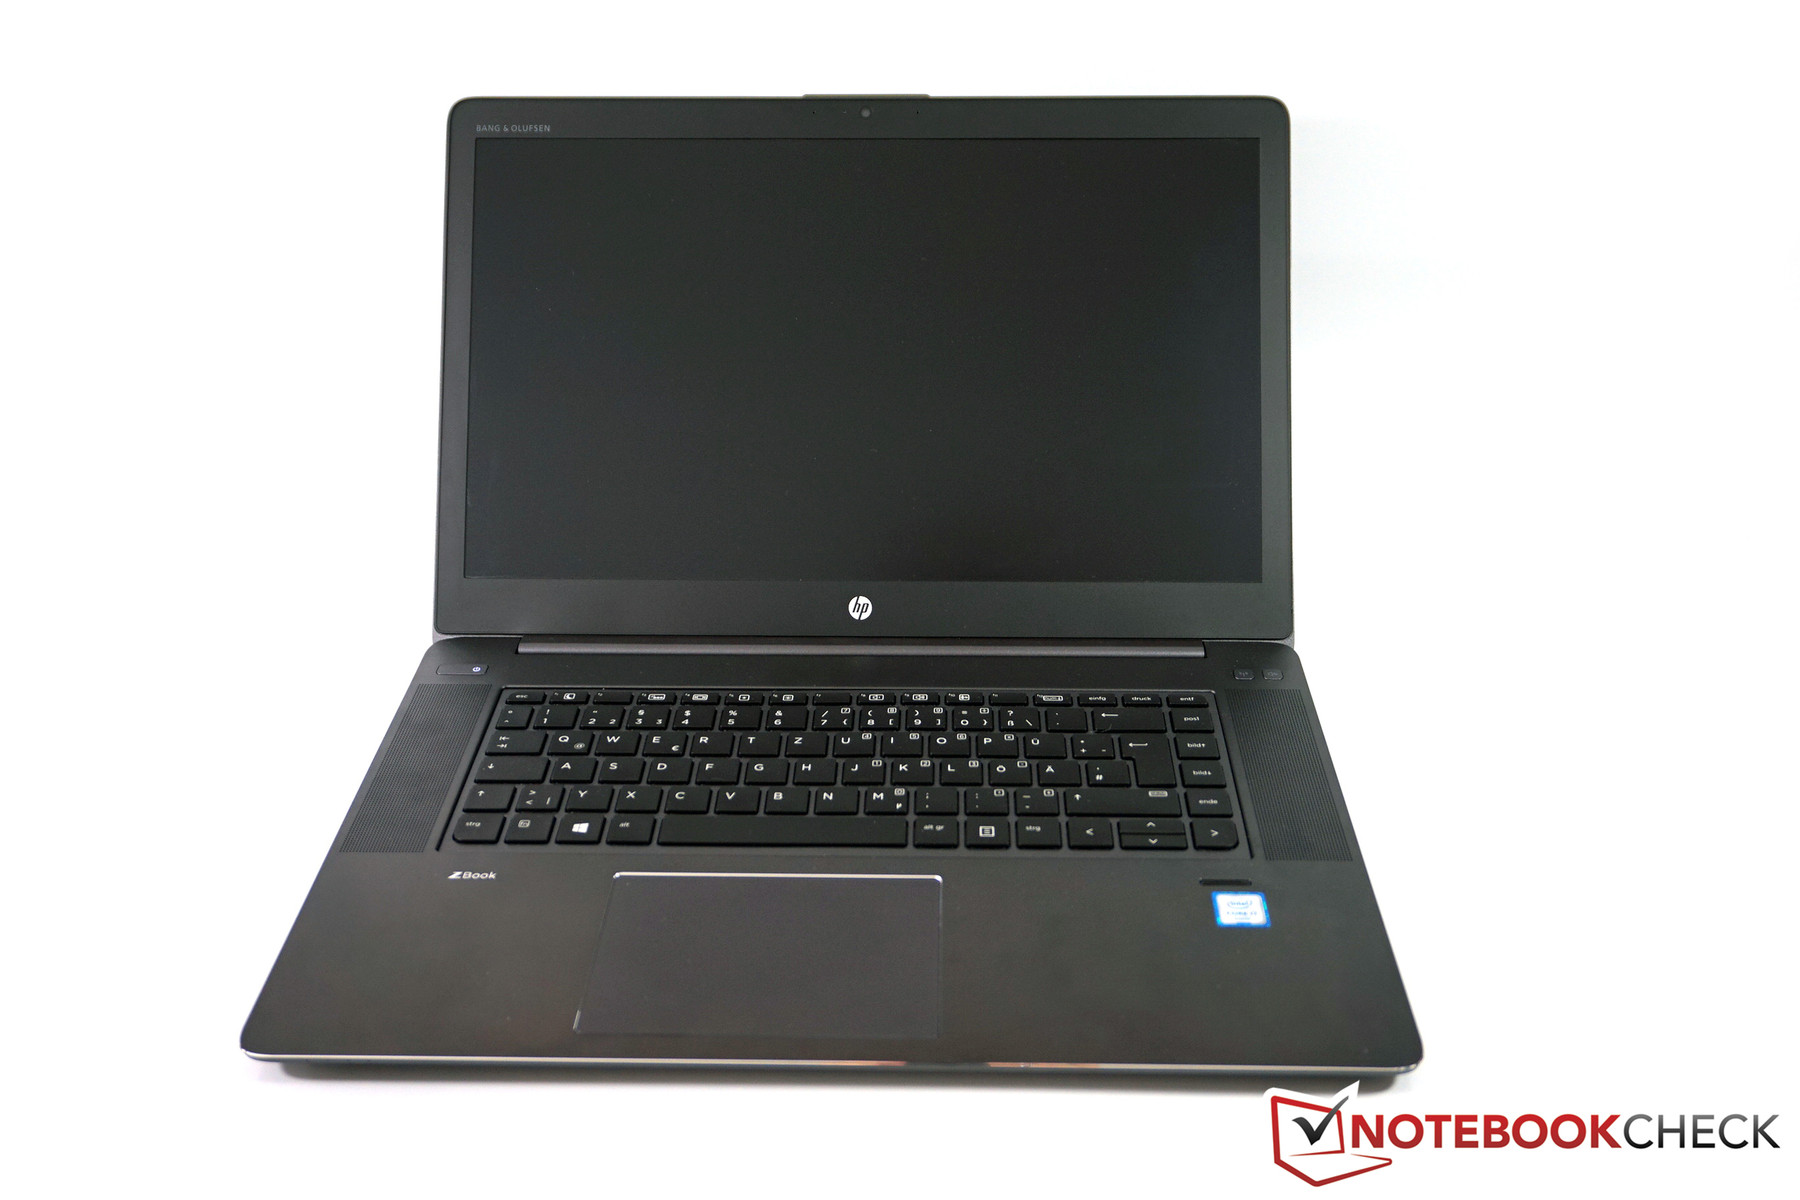
HP ZBook Studio G3
-
05/19/2016 v5.1(old)
Andreas Osthoff
Pricecompare
