 Deutsch
 English
 Español
 Français
 Italiano
 Nederlands
 Polski
 Português
 Русский
 Türkçe
 Svenska
 Chinese
 Magyar
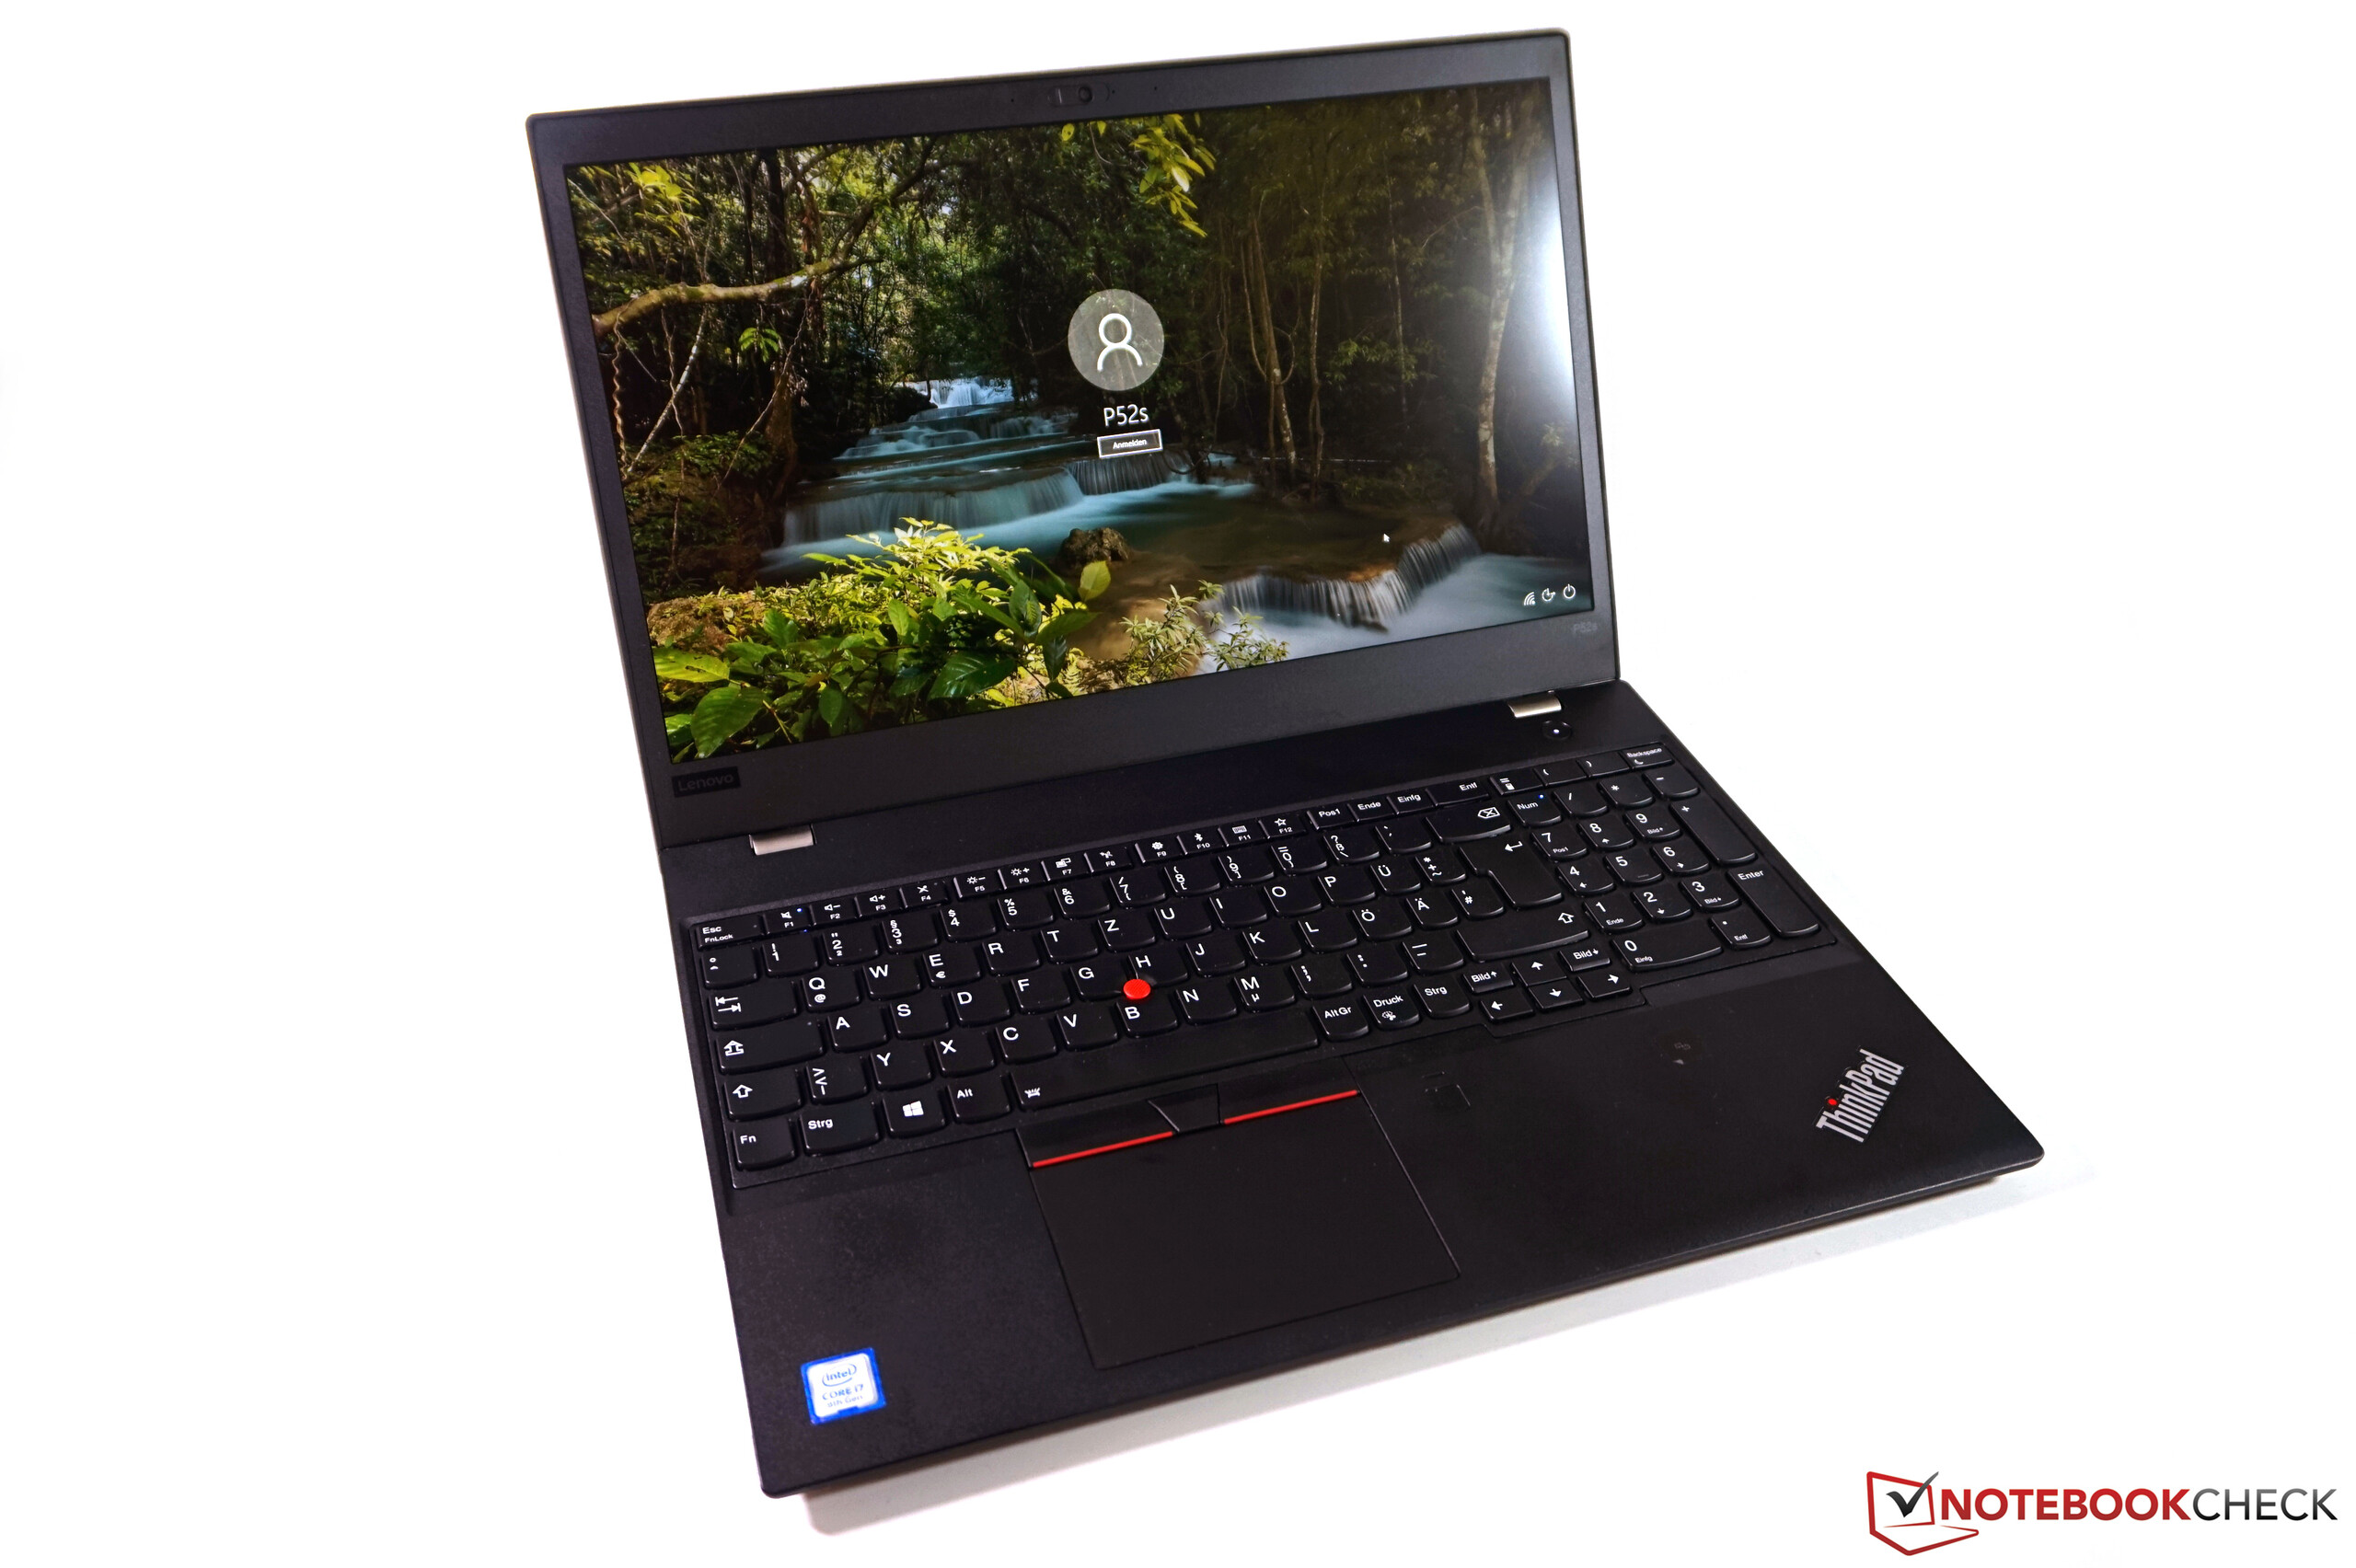
Breve Análise do Workstation Lenovo ThinkPad P52s (i7-8550U, Full HD)

| SD Card Reader | |
| average JPG Copy Test (av. of 3 runs) | |
| Lenovo ThinkPad P51 20HH0016GE (Toshiba Exceria Pro SDXC 64 GB UHS-II) | |
| Average of class Workstation (54.8 - 200, n=16, last 2 years) | |
| Lenovo ThinkPad P52s-20LB000HGE (Toshiba Exceria Pro SDXC 64 GB UHS-II) | |
| Lenovo ThinkPad T580-20LAS01H00 (Toshiba Exceria Pro SDXC 64 GB UHS-II) | |
| Lenovo ThinkPad P51s 20HB000SGE (Toshiba Exceria Pro SDXC 64 GB UHS-II) | |
| maximum AS SSD Seq Read Test (1GB) | |
| Lenovo ThinkPad P51 20HH0016GE (Toshiba Exceria Pro SDXC 64 GB UHS-II) | |
| Average of class Workstation (78.6 - 226, n=16, last 2 years) | |
| Lenovo ThinkPad P51s 20HB000SGE (Toshiba Exceria Pro SDXC 64 GB UHS-II) | |
| Lenovo ThinkPad P52s-20LB000HGE (Toshiba Exceria Pro SDXC 64 GB UHS-II) | |
| Lenovo ThinkPad T580-20LAS01H00 (Toshiba Exceria Pro SDXC 64 GB UHS-II) | |
| |||||||||||||||||||||||||
iluminação: 91 %
iluminação com acumulador: 291 cd/m²
Contraste: 2645:1 (Preto: 0.11 cd/m²)
ΔE Color 6.7 | 0.5-29.43 Ø5, calibrated: 4.5
ΔE Greyscale 4.5 | 0.57-98 Ø5.3
61.7% sRGB (Argyll 1.6.3 3D)
39.6% AdobeRGB 1998 (Argyll 1.6.3 3D)
43.22% AdobeRGB 1998 (Argyll 2.2.0 3D)
62.1% sRGB (Argyll 2.2.0 3D)
41.83% Display P3 (Argyll 2.2.0 3D)
Gamma: 2.28
| Lenovo ThinkPad P52s-20LB000HGE NV156FHM-N47, , 1920x1080, 15.60 | HP ZBook 15u G5 2ZC05EA CMN15E7, , 1920x1080, 15.60 | Lenovo ThinkPad P51 20HH0016GE LEN40BD, B156ZAN02.1, , 3840x2160, 15.60 | Dell Precision 5520 UHD SHP1476, , 3840x2160, 15.60 | HP ZBook Studio G4-Y6K17EA SHP1445, , 3840x2160, 15.60 | Lenovo ThinkPad P51s 20HB000SGE BOE NV156QUM-N44, , 3840x2160, 15.60 | Lenovo ThinkPad T580-20LAS01H00 NV156QUM-N44, , 3840x2160, 15.60 | |
|---|---|---|---|---|---|---|---|
| Display | 3% | 99% | 60% | 94% | 56% | 55% | |
| Display P3 Coverage | 41.83 | 43.05 3% | 86.3 106% | 67.4 61% | 82.6 97% | 69.7 67% | 69.2 65% |
| sRGB Coverage | 62.1 | 64.7 4% | 99.5 60% | 98.5 59% | 98.9 59% | 91.2 47% | 90.7 46% |
| AdobeRGB 1998 Coverage | 43.22 | 44.5 3% | 99.3 130% | 68.9 59% | 98 127% | 66.8 55% | 66.3 53% |
| Response Times | 19% | 24% | -17% | -22% | -14% | -27% | |
| Response Time Grey 50% / Grey 80% * | 47.2 ? | 41.6 ? 12% | 40.8 ? 14% | 59.2 ? -25% | 44.8 ? 5% | 38.4 ? 19% | 51.2 ? -8% |
| Response Time Black / White * | 38.4 ? | 28.8 ? 25% | 25.2 ? 34% | 41.6 ? -8% | 30 ? 22% | 24.8 ? 35% | 29.6 ? 23% |
| PWM Frequency | 21550 ? | 25770 ? 20% | 1497 ? -93% | 980 ? -95% | 952 ? -96% | ||
| Screen | -9% | 8% | -8% | 16% | -3% | 13% | |
| Brightness middle | 291 | 229 -21% | 317 9% | 372.4 28% | 324 11% | 317 9% | 310 7% |
| Brightness | 284 | 212 -25% | 309 9% | 368 30% | 338 19% | 290 2% | 283 0% |
| Brightness Distribution | 91 | 88 -3% | 89 -2% | 90 -1% | 78 -14% | 85 -7% | 87 -4% |
| Black Level * | 0.11 | 0.23 -109% | 0.36 -227% | 0.48 -336% | 0.3 -173% | 0.32 -191% | 0.24 -118% |
| Contrast | 2645 | 996 -62% | 881 -67% | 776 -71% | 1080 -59% | 991 -63% | 1292 -51% |
| Colorchecker dE 2000 * | 6.7 | 4.2 37% | 2.7 60% | 2.6 61% | 1.6 76% | 3.6 46% | 3.1 54% |
| Colorchecker dE 2000 max. * | 20.2 | 18 11% | 4.1 80% | 5.6 72% | 4.6 77% | 6.6 67% | 7.6 62% |
| Colorchecker dE 2000 calibrated * | 4.5 | 4.2 7% | 2.2 51% | ||||
| Greyscale dE 2000 * | 4.5 | 2 56% | 3 33% | 3.7 18% | 2.5 44% | 4.2 7% | 2.3 49% |
| Gamma | 2.28 96% | 2.23 99% | 2.27 97% | 2.14 103% | 2.21 100% | 2.24 98% | 2.21 100% |
| CCT | 7503 87% | 6292 103% | 6077 107% | 7096 92% | 6273 104% | 6740 96% | 6876 95% |
| Color Space (Percent of AdobeRGB 1998) | 39.6 | 41 4% | 87.6 121% | 63 59% | 85.7 116% | 59.5 50% | 59.1 49% |
| Color Space (Percent of sRGB) | 61.7 | 64.5 5% | 99.5 61% | 99 60% | 98.9 60% | 91.1 48% | 90.1 46% |
| Total Average (Program / Settings) | 4% /
-2% | 44% /
28% | 12% /
4% | 29% /
23% | 13% /
6% | 14% /
13% |
* ... smaller is better
Display Response Times
| ↔ Response Time Black to White | ||
|---|---|---|
| 38.4 ms ... rise ↗ and fall ↘ combined | ↗ 22.8 ms rise | 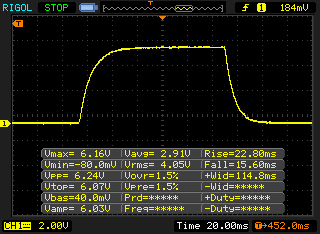 |
| ↘ 15.6 ms fall | ||
| The screen shows slow response rates in our tests and will be unsatisfactory for gamers. In comparison, all tested devices range from 0.1 (minimum) to 240 (maximum) ms. » 96 % of all devices are better. This means that the measured response time is worse than the average of all tested devices (21.5 ms). | ||
| ↔ Response Time 50% Grey to 80% Grey | ||
| 47.2 ms ... rise ↗ and fall ↘ combined | ↗ 25.2 ms rise | 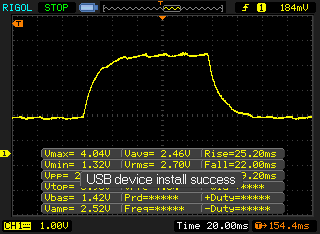 |
| ↘ 22 ms fall | ||
| The screen shows slow response rates in our tests and will be unsatisfactory for gamers. In comparison, all tested devices range from 0.2 (minimum) to 636 (maximum) ms. » 79 % of all devices are better. This means that the measured response time is worse than the average of all tested devices (33.7 ms). | ||
Screen Flickering / PWM (Pulse-Width Modulation)
| Screen flickering / PWM detected | 21550 Hz | ≤ 91 % brightness setting | 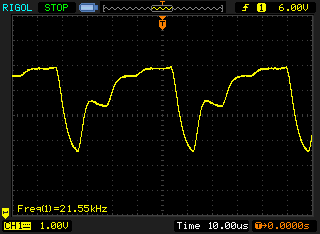 |
The display backlight flickers at 21550 Hz (worst case, e.g., utilizing PWM) Flickering detected at a brightness setting of 91 % and below. There should be no flickering or PWM above this brightness setting. The frequency of 21550 Hz is quite high, so most users sensitive to PWM should not notice any flickering. In comparison: 53 % of all tested devices do not use PWM to dim the display. If PWM was detected, an average of 17924 (minimum: 5 - maximum: 3846000) Hz was measured. | |||
| PCMark 8 Home Score Accelerated v2 | 3728 pontos | |
| PCMark 8 Creative Score Accelerated v2 | 4851 pontos | |
| PCMark 8 Work Score Accelerated v2 | 4980 pontos | |
| PCMark 10 Score | 3498 pontos | |
Ajuda | ||
| Lenovo ThinkPad P52s-20LB000HGE Samsung PM961 MZVLW256HEHP | HP ZBook 15u G5 2ZC05EA Toshiba XG5 KXG50ZNV256G | Lenovo ThinkPad P51 20HH0016GE Samsung PM961 NVMe MZVLW512HMJP | Dell Precision 5520 UHD Samsung SM961 MZVKW512HMJP m.2 PCI-e | HP ZBook Studio G4-Y6K17EA Samsung SM961 MZVKW512HMJP m.2 PCI-e | Lenovo ThinkPad P51s 20HB000SGE Samsung SSD PM961 1TB M.2 PCIe 3.0 x4 NVMe (MZVLW1T0) | Lenovo ThinkPad T580-20LAS01H00 Samsung SSD PM981 MZVLB512HAJQ | Average Samsung PM961 MZVLW256HEHP | |
|---|---|---|---|---|---|---|---|---|
| CrystalDiskMark 3.0 | 3% | 51% | 54% | 46% | 24% | -11% | 16% | |
| Read Seq | 898 | 2040 127% | 1705 90% | 2253 151% | 2229 148% | 1189 32% | 944 5% | 1627 ? 81% |
| Write Seq | 862 | 917 6% | 1541 79% | 1662 93% | 1562 81% | 1138 32% | 924 7% | 1136 ? 32% |
| Read 512 | 557 | 912 64% | 1038 86% | 459.1 -18% | 391.4 -30% | 782 40% | 555 0% | 887 ? 59% |
| Write 512 | 558 | 488.9 -12% | 1157 107% | 1611 189% | 1279 129% | 959 72% | 565 1% | 781 ? 40% |
| Read 4k | 61.6 | 35.5 -42% | 61.3 0% | 56.1 -9% | 56.5 -8% | 54.8 -11% | 63.9 4% | 53 ? -14% |
| Write 4k | 164.8 | 99.1 -40% | 176 7% | 169.4 3% | 182 10% | 161.4 -2% | 135.3 -18% | 126.7 ? -23% |
| Read 4k QD32 | 563 | 276.7 -51% | 664 18% | 633 12% | 645 15% | 642 14% | 336.2 -40% | 419 ? -26% |
| Write 4k QD32 | 470.7 | 351.5 -25% | 560 19% | 506 7% | 595 26% | 549 17% | 264.9 -44% | 384 ? -18% |

| 3DMark 11 Performance | 3338 pontos | |
| 3DMark Fire Strike Score | 2144 pontos | |
| 3DMark Fire Strike Extreme Score | 921 pontos | |
Ajuda | ||
| BioShock Infinite - 1920x1080 Ultra Preset, DX11 (DDOF) | |
| Dell Precision 5520 UHD | |
| HP ZBook Studio G4-Y6K17EA | |
| Lenovo ThinkPad T580-20LAS01H00 | |
| Lenovo ThinkPad P52s-20LB000HGE | |
| Average NVIDIA Quadro P500 () | |
| Lenovo ThinkPad P51s 20HB000SGE | |
| HP ZBook 15u G5 2ZC05EA | |
| The Witcher 3 - 1366x768 Medium Graphics & Postprocessing | |
| Average of class Workstation (73 - 430, n=26, last 2 years) | |
| Lenovo ThinkPad P51 20HH0016GE | |
| HP ZBook Studio G4-Y6K17EA | |
| Lenovo ThinkPad T580-20LAS01H00 | |
| HP ZBook 15u G5 2ZC05EA | |
| Lenovo ThinkPad P52s-20LB000HGE | |
| Average NVIDIA Quadro P500 (23 - 26.3, n=2) | |
| baixo | média | alto | ultra | |
| BioShock Infinite (2013) | 134.9 | 77.8 | 66.4 | 24.7 |
| The Witcher 3 (2015) | 35.8 | 26.3 | 14.5 | 8.2 |
| Dota 2 Reborn (2015) | 92.9 | 85.3 | 49 | 44.8 |
| Rise of the Tomb Raider (2016) | 47.8 | 27.7 | 14.5 | |
| The Division (2016) | 47.7 | 29 | 12.9 | |
| For Honor (2017) | 63.4 | 21.4 | 21 | 16 |
| Ghost Recon Wildlands (2017) | 36.9 | 14.7 | ||
| Assassin´s Creed Origins (2017) | 33 | 14 | ||
| Star Wars Battlefront 2 (2017) | 55.6 | 17.3 | ||
| Far Cry 5 (2018) | 32 | 15 | 13 |
Barulho
| Ocioso |
| 29 / 29 / 31.2 dB |
| Carga |
| 32.5 / 37.5 dB |
 | ||
30 dB silencioso 40 dB(A) audível 50 dB(A) ruidosamente alto |
||
min: | ||
(±) The maximum temperature on the upper side is 41.8 °C / 107 F, compared to the average of 38.1 °C / 101 F, ranging from 22.2 to 69.8 °C for the class Workstation.
(-) The bottom heats up to a maximum of 55.9 °C / 133 F, compared to the average of 41.3 °C / 106 F
(+) In idle usage, the average temperature for the upper side is 25.7 °C / 78 F, compared to the device average of 32 °C / 90 F.
(±) The palmrests and touchpad can get very hot to the touch with a maximum of 36.9 °C / 98.4 F.
(-) The average temperature of the palmrest area of similar devices was 27.8 °C / 82 F (-9.1 °C / -16.4 F).
Lenovo ThinkPad P52s-20LB000HGE audio analysis
(±) | speaker loudness is average but good (80.6 dB)
Bass 100 - 315 Hz
(-) | nearly no bass - on average 15% lower than median
(±) | linearity of bass is average (11.7% delta to prev. frequency)
Mids 400 - 2000 Hz
(±) | higher mids - on average 5.6% higher than median
(+) | mids are linear (5.7% delta to prev. frequency)
Highs 2 - 16 kHz
(+) | balanced highs - only 3.1% away from median
(+) | highs are linear (5.7% delta to prev. frequency)
Overall 100 - 16.000 Hz
(±) | linearity of overall sound is average (17.8% difference to median)
Compared to same class
» 47% of all tested devices in this class were better, 12% similar, 41% worse
» The best had a delta of 7%, average was 18%, worst was 35%
Compared to all devices tested
» 30% of all tested devices were better, 8% similar, 62% worse
» The best had a delta of 4%, average was 25%, worst was 134%
HP ZBook 15u G5 2ZC05EA audio analysis
(+) | speakers can play relatively loud (83.6 dB)
Bass 100 - 315 Hz
(-) | nearly no bass - on average 24.9% lower than median
(±) | linearity of bass is average (9.7% delta to prev. frequency)
Mids 400 - 2000 Hz
(+) | balanced mids - only 1.5% away from median
(+) | mids are linear (5.2% delta to prev. frequency)
Highs 2 - 16 kHz
(+) | balanced highs - only 3.9% away from median
(+) | highs are linear (2.1% delta to prev. frequency)
Overall 100 - 16.000 Hz
(±) | linearity of overall sound is average (17.9% difference to median)
Compared to same class
» 48% of all tested devices in this class were better, 12% similar, 40% worse
» The best had a delta of 7%, average was 18%, worst was 35%
Compared to all devices tested
» 31% of all tested devices were better, 8% similar, 61% worse
» The best had a delta of 4%, average was 25%, worst was 134%
| desligado | |
| Ocioso | |
| Carga |
|
| Lenovo ThinkPad P52s-20LB000HGE i5-8550U, Quadro P500, Samsung PM961 MZVLW256HEHP, IPS LED, 1920x1080, 15.60 | HP ZBook 15u G5 2ZC05EA i5-8550U, Radeon Pro WX 3100, Toshiba XG5 KXG50ZNV256G, IPS LED, 1920x1080, 15.60 | Lenovo ThinkPad P51 20HH0016GE E3-1505M v6, Quadro M2200, Samsung PM961 NVMe MZVLW512HMJP, IPS, 3840x2160, 15.60 | Dell Precision 5520 UHD E3-1505M v6, Quadro M1200, Samsung SM961 MZVKW512HMJP m.2 PCI-e, IPS, 3840x2160, 15.60 | HP ZBook Studio G4-Y6K17EA E3-1505M v6, Quadro M1200, Samsung SM961 MZVKW512HMJP m.2 PCI-e, IPS, 3840x2160, 15.60 | Lenovo ThinkPad P51s 20HB000SGE i7-7600U, Quadro M520, Samsung SSD PM961 1TB M.2 PCIe 3.0 x4 NVMe (MZVLW1T0), IPS, 3840x2160, 15.60 | Lenovo ThinkPad T580-20LAS01H00 i5-8550U, GeForce MX150, Samsung SSD PM981 MZVLB512HAJQ, IPS LED, 3840x2160, 15.60 | |
|---|---|---|---|---|---|---|---|
| Power Consumption | 0% | -97% | -95% | -117% | -27% | -21% | |
| Idle Minimum * | 4.1 | 3.2 22% | 8.6 -110% | 8.9 -117% | 12.6 -207% | 5.8 -41% | 5.3 -29% |
| Idle Average * | 7.7 | 6.1 21% | 15.9 -106% | 13.6 -77% | 17.1 -122% | 10.4 -35% | 10.2 -32% |
| Idle Maximum * | 10.7 | 9.7 9% | 22.1 -107% | 14.1 -32% | 19.3 -80% | 13.5 -26% | 13.6 -27% |
| Load Average * | 52 | 62 -19% | 84.4 -62% | 100.3 -93% | 88.3 -70% | 62.4 -20% | 58.3 -12% |
| Witcher 3 ultra * | 38.8 | 48 -24% | 100.2 -158% | 74.8 -93% | 47.8 -23% | ||
| Load Maximum * | 65 | 71 -9% | 130.6 -101% | 126.3 -94% | 147.3 -127% | 73.1 -12% | 65.3 -0% |
* ... smaller is better


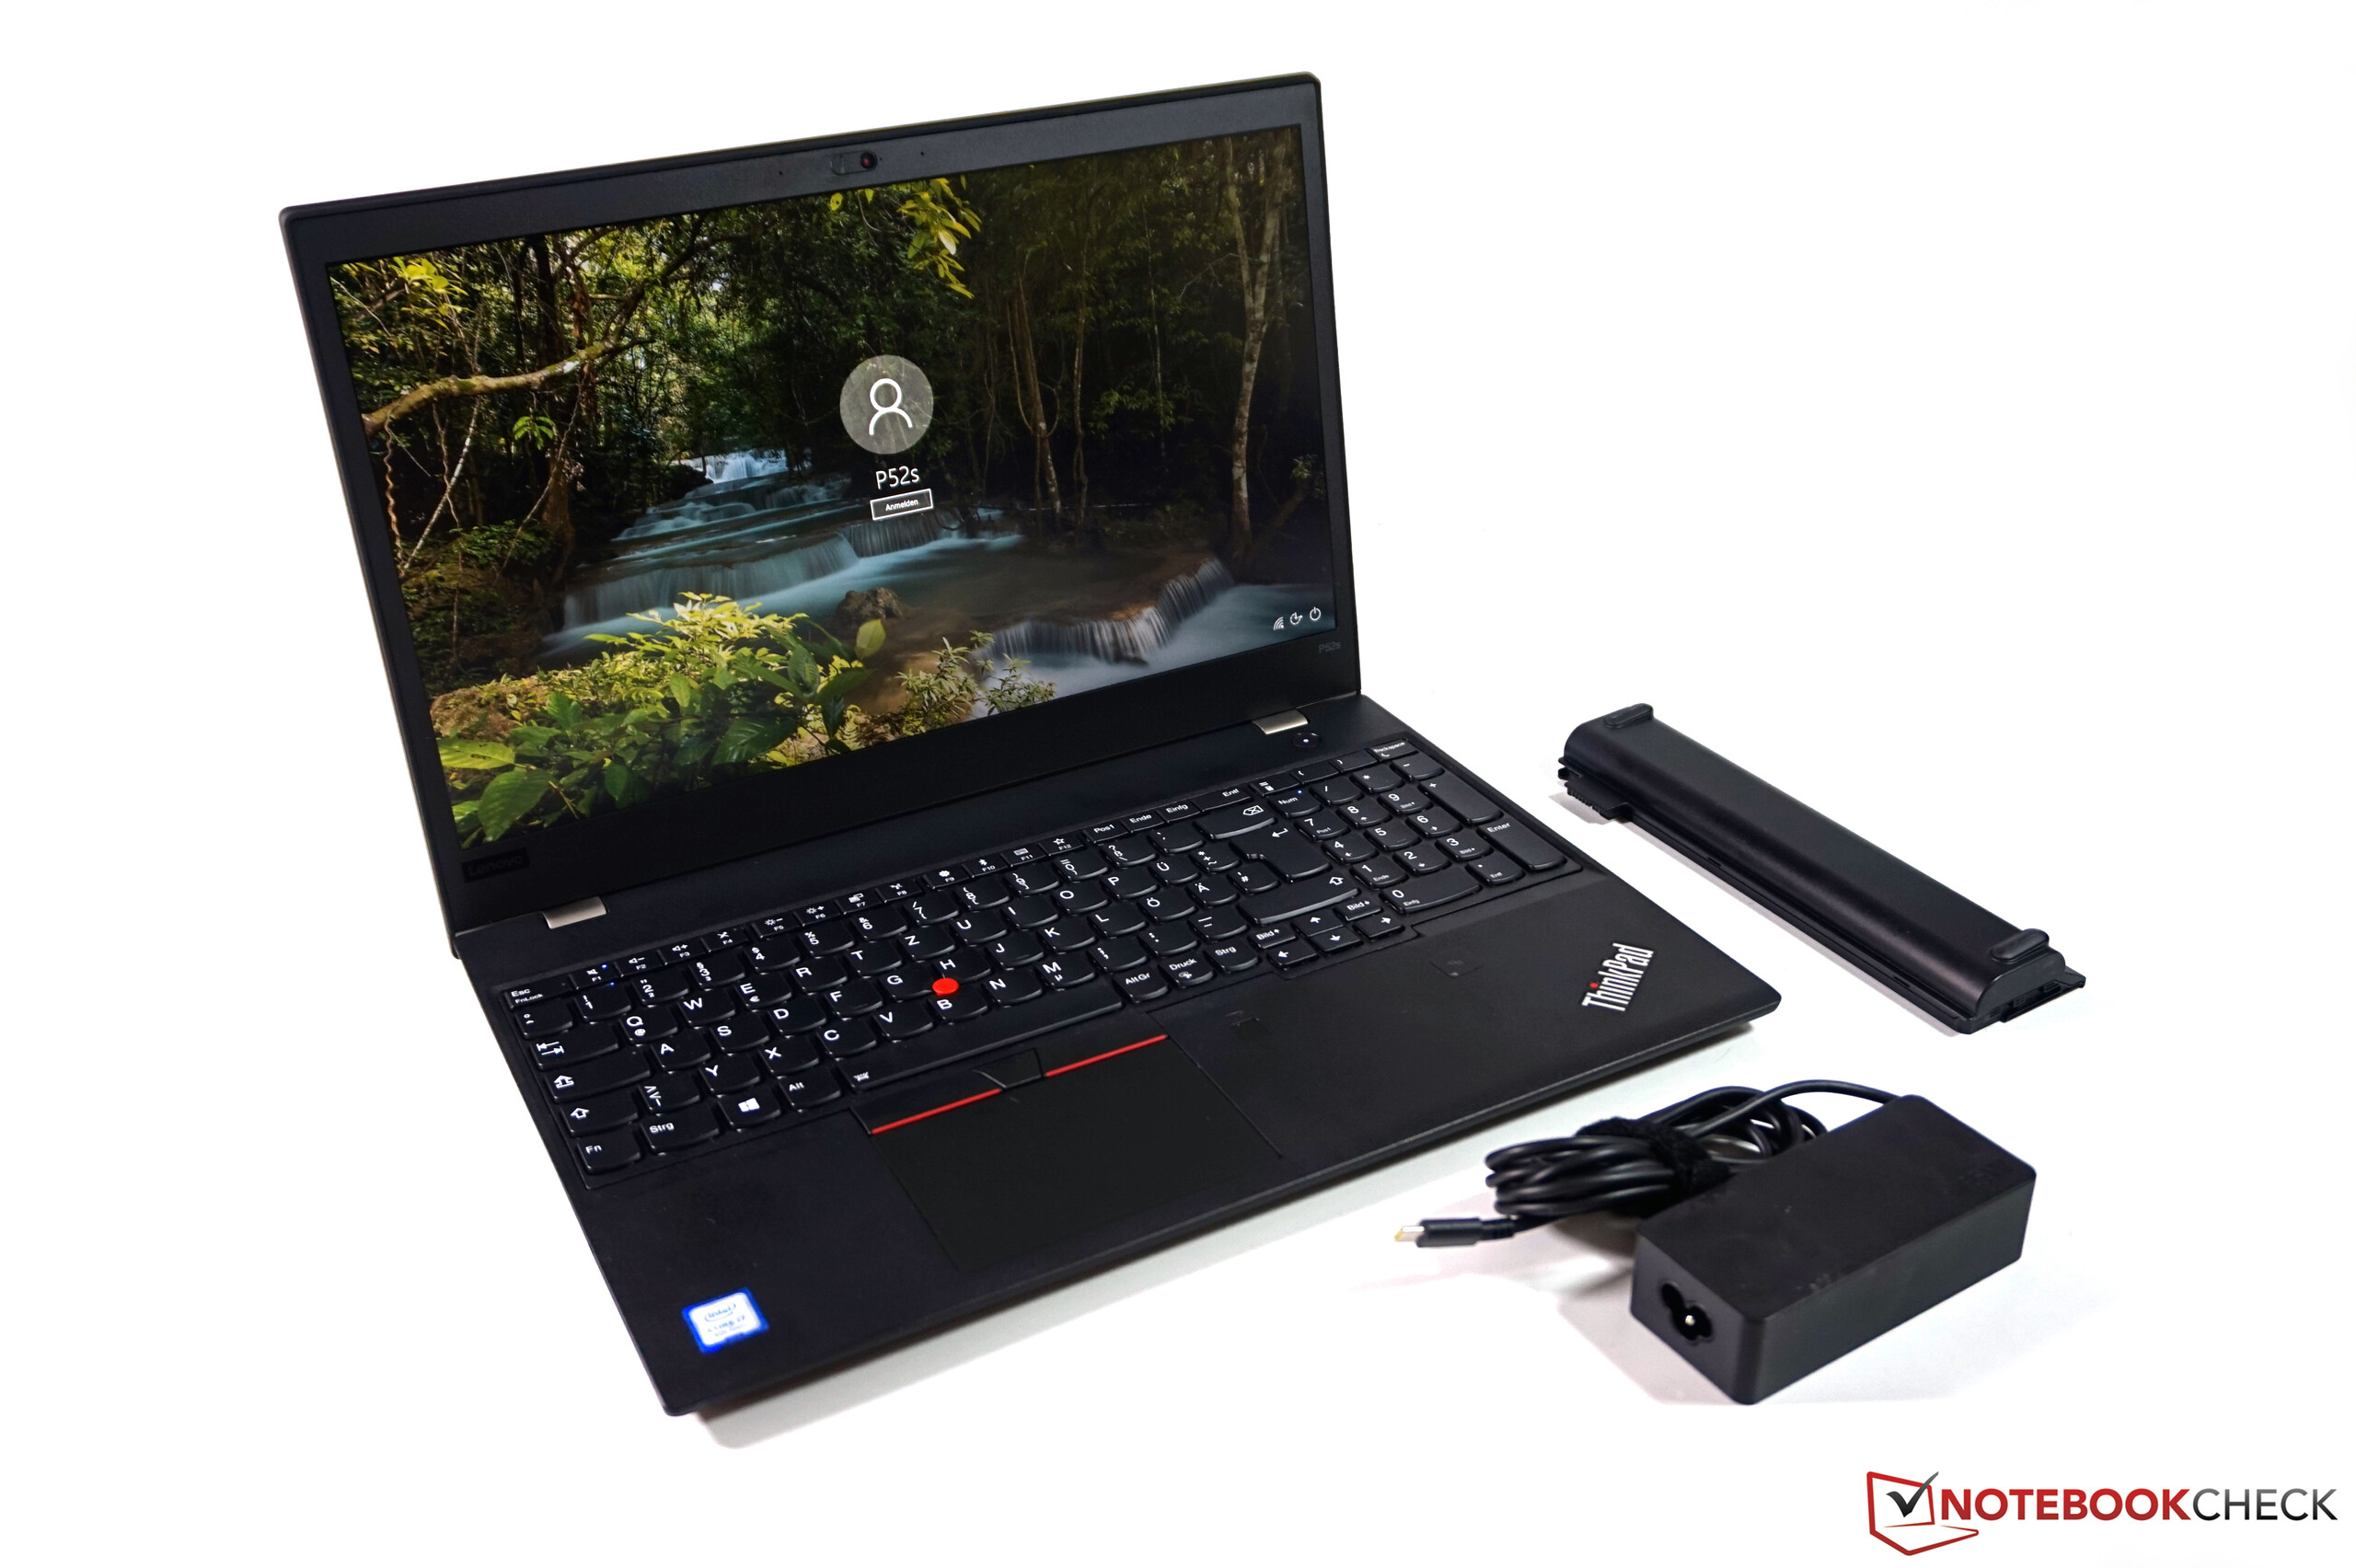
| Lenovo ThinkPad P52s-20LB000HGE i5-8550U, Quadro P500, 104 Wh | HP ZBook 15u G5 2ZC05EA i5-8550U, Radeon Pro WX 3100, 56 Wh | Lenovo ThinkPad P51 20HH0016GE E3-1505M v6, Quadro M2200, 90 Wh | Dell Precision 5520 UHD E3-1505M v6, Quadro M1200, 97 Wh | HP ZBook Studio G4-Y6K17EA E3-1505M v6, Quadro M1200, 64 Wh | Lenovo ThinkPad P51s 20HB000SGE i7-7600U, Quadro M520, 104 Wh | Lenovo ThinkPad T580-20LAS01H00 i5-8550U, GeForce MX150, 105 Wh | Average of class Workstation | |
|---|---|---|---|---|---|---|---|---|
| Battery Runtime | -37% | -58% | -72% | -80% | -13% | -44% | -54% | |
| Reader / Idle | 2360 | 1301 -45% | 981 -58% | 724 -69% | 410 -83% | 1581 -33% | 1181 -50% | 700 ? -70% |
| H.264 | 1131 | 623 -45% | 455 -60% | 700 -38% | 565 -50% | 717 ? -37% | ||
| WiFi v1.3 | 974 | 514 -47% | 413 -58% | 254 -74% | 201 -79% | 712 -27% | 522 -46% | 536 ? -45% |
| Load | 221 | 200 -10% | 95 -57% | 61 -72% | 50 -77% | 323 46% | 158 -29% | 81.3 ? -63% |
Pro
Contra
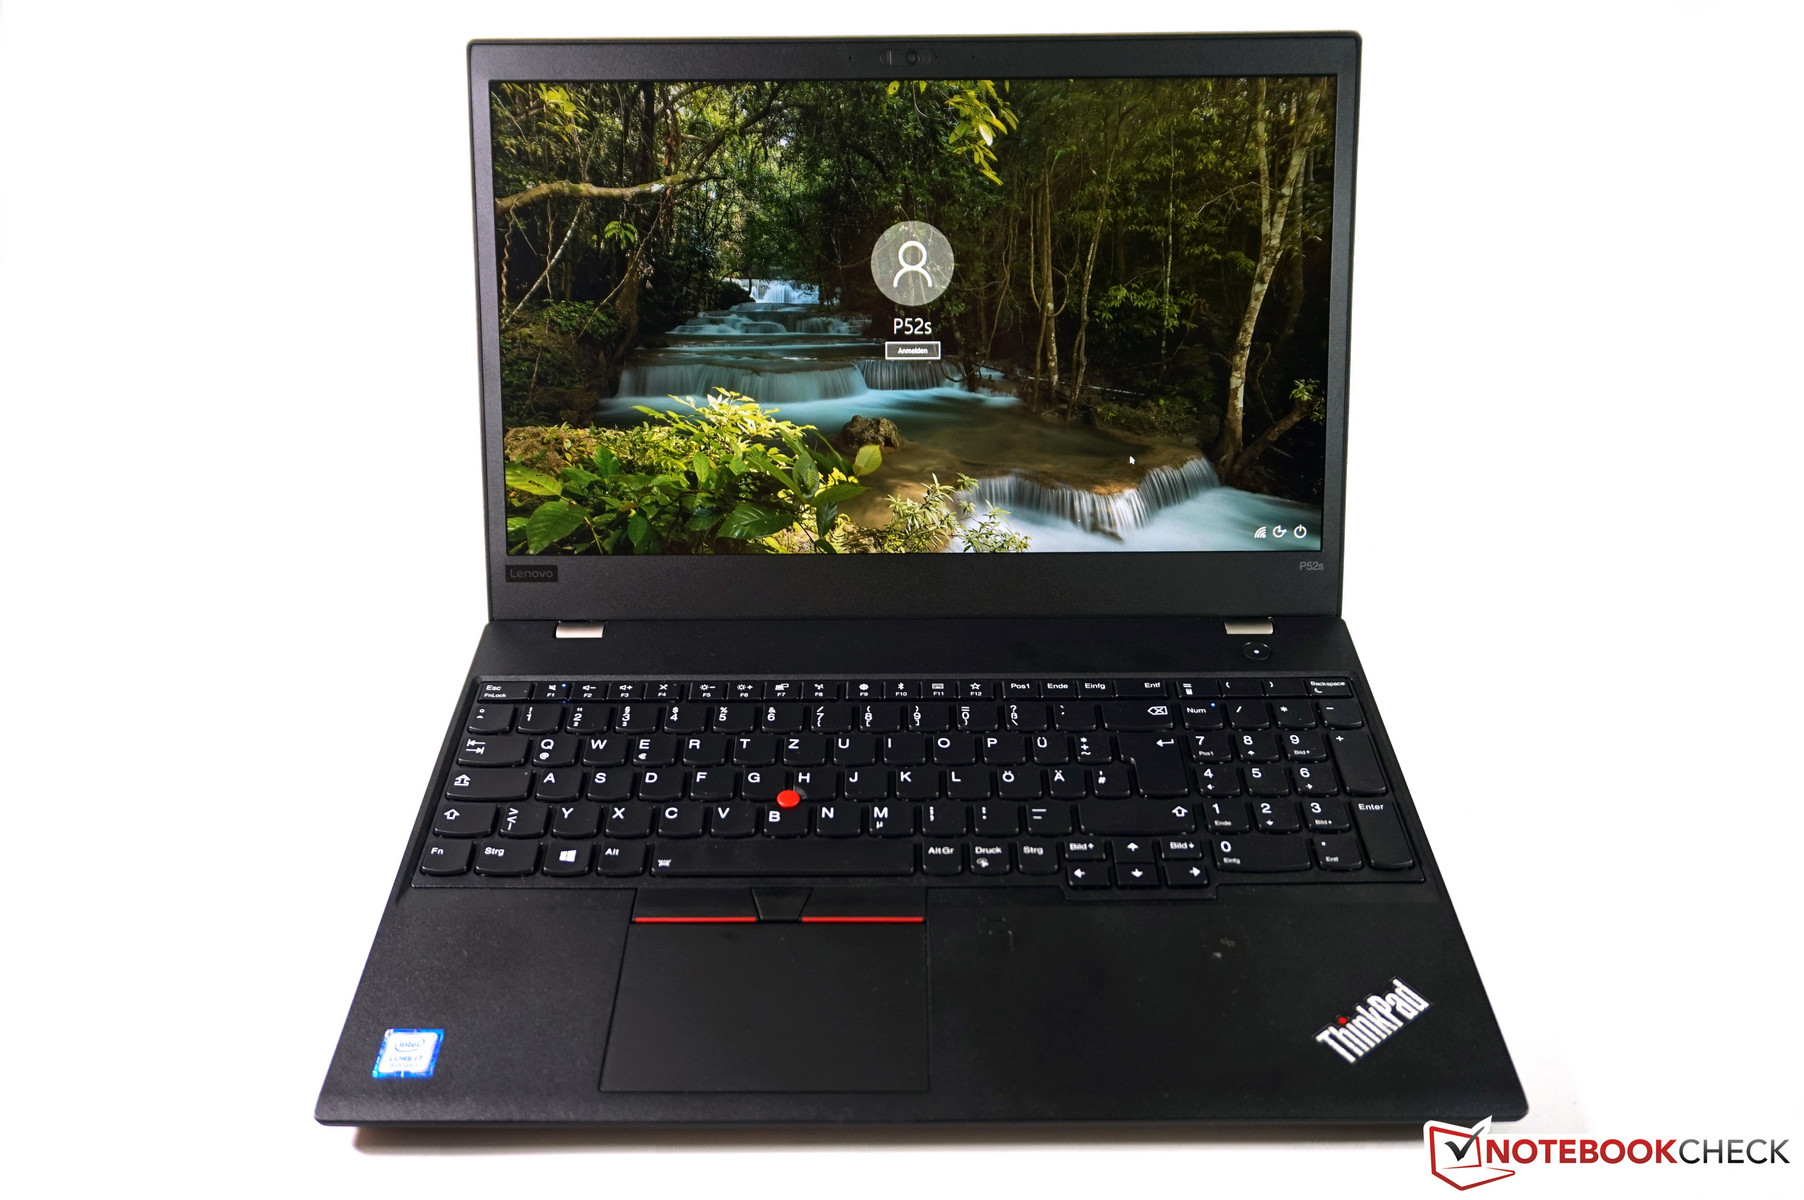

Até agora, a ideia de um portátil workstation com processadores energeticamente eficientes nunca funcionou. O Lenovo ThinkPad P52s é o primeiro portátil onde este conceito está, finalmente, começando a decolar.
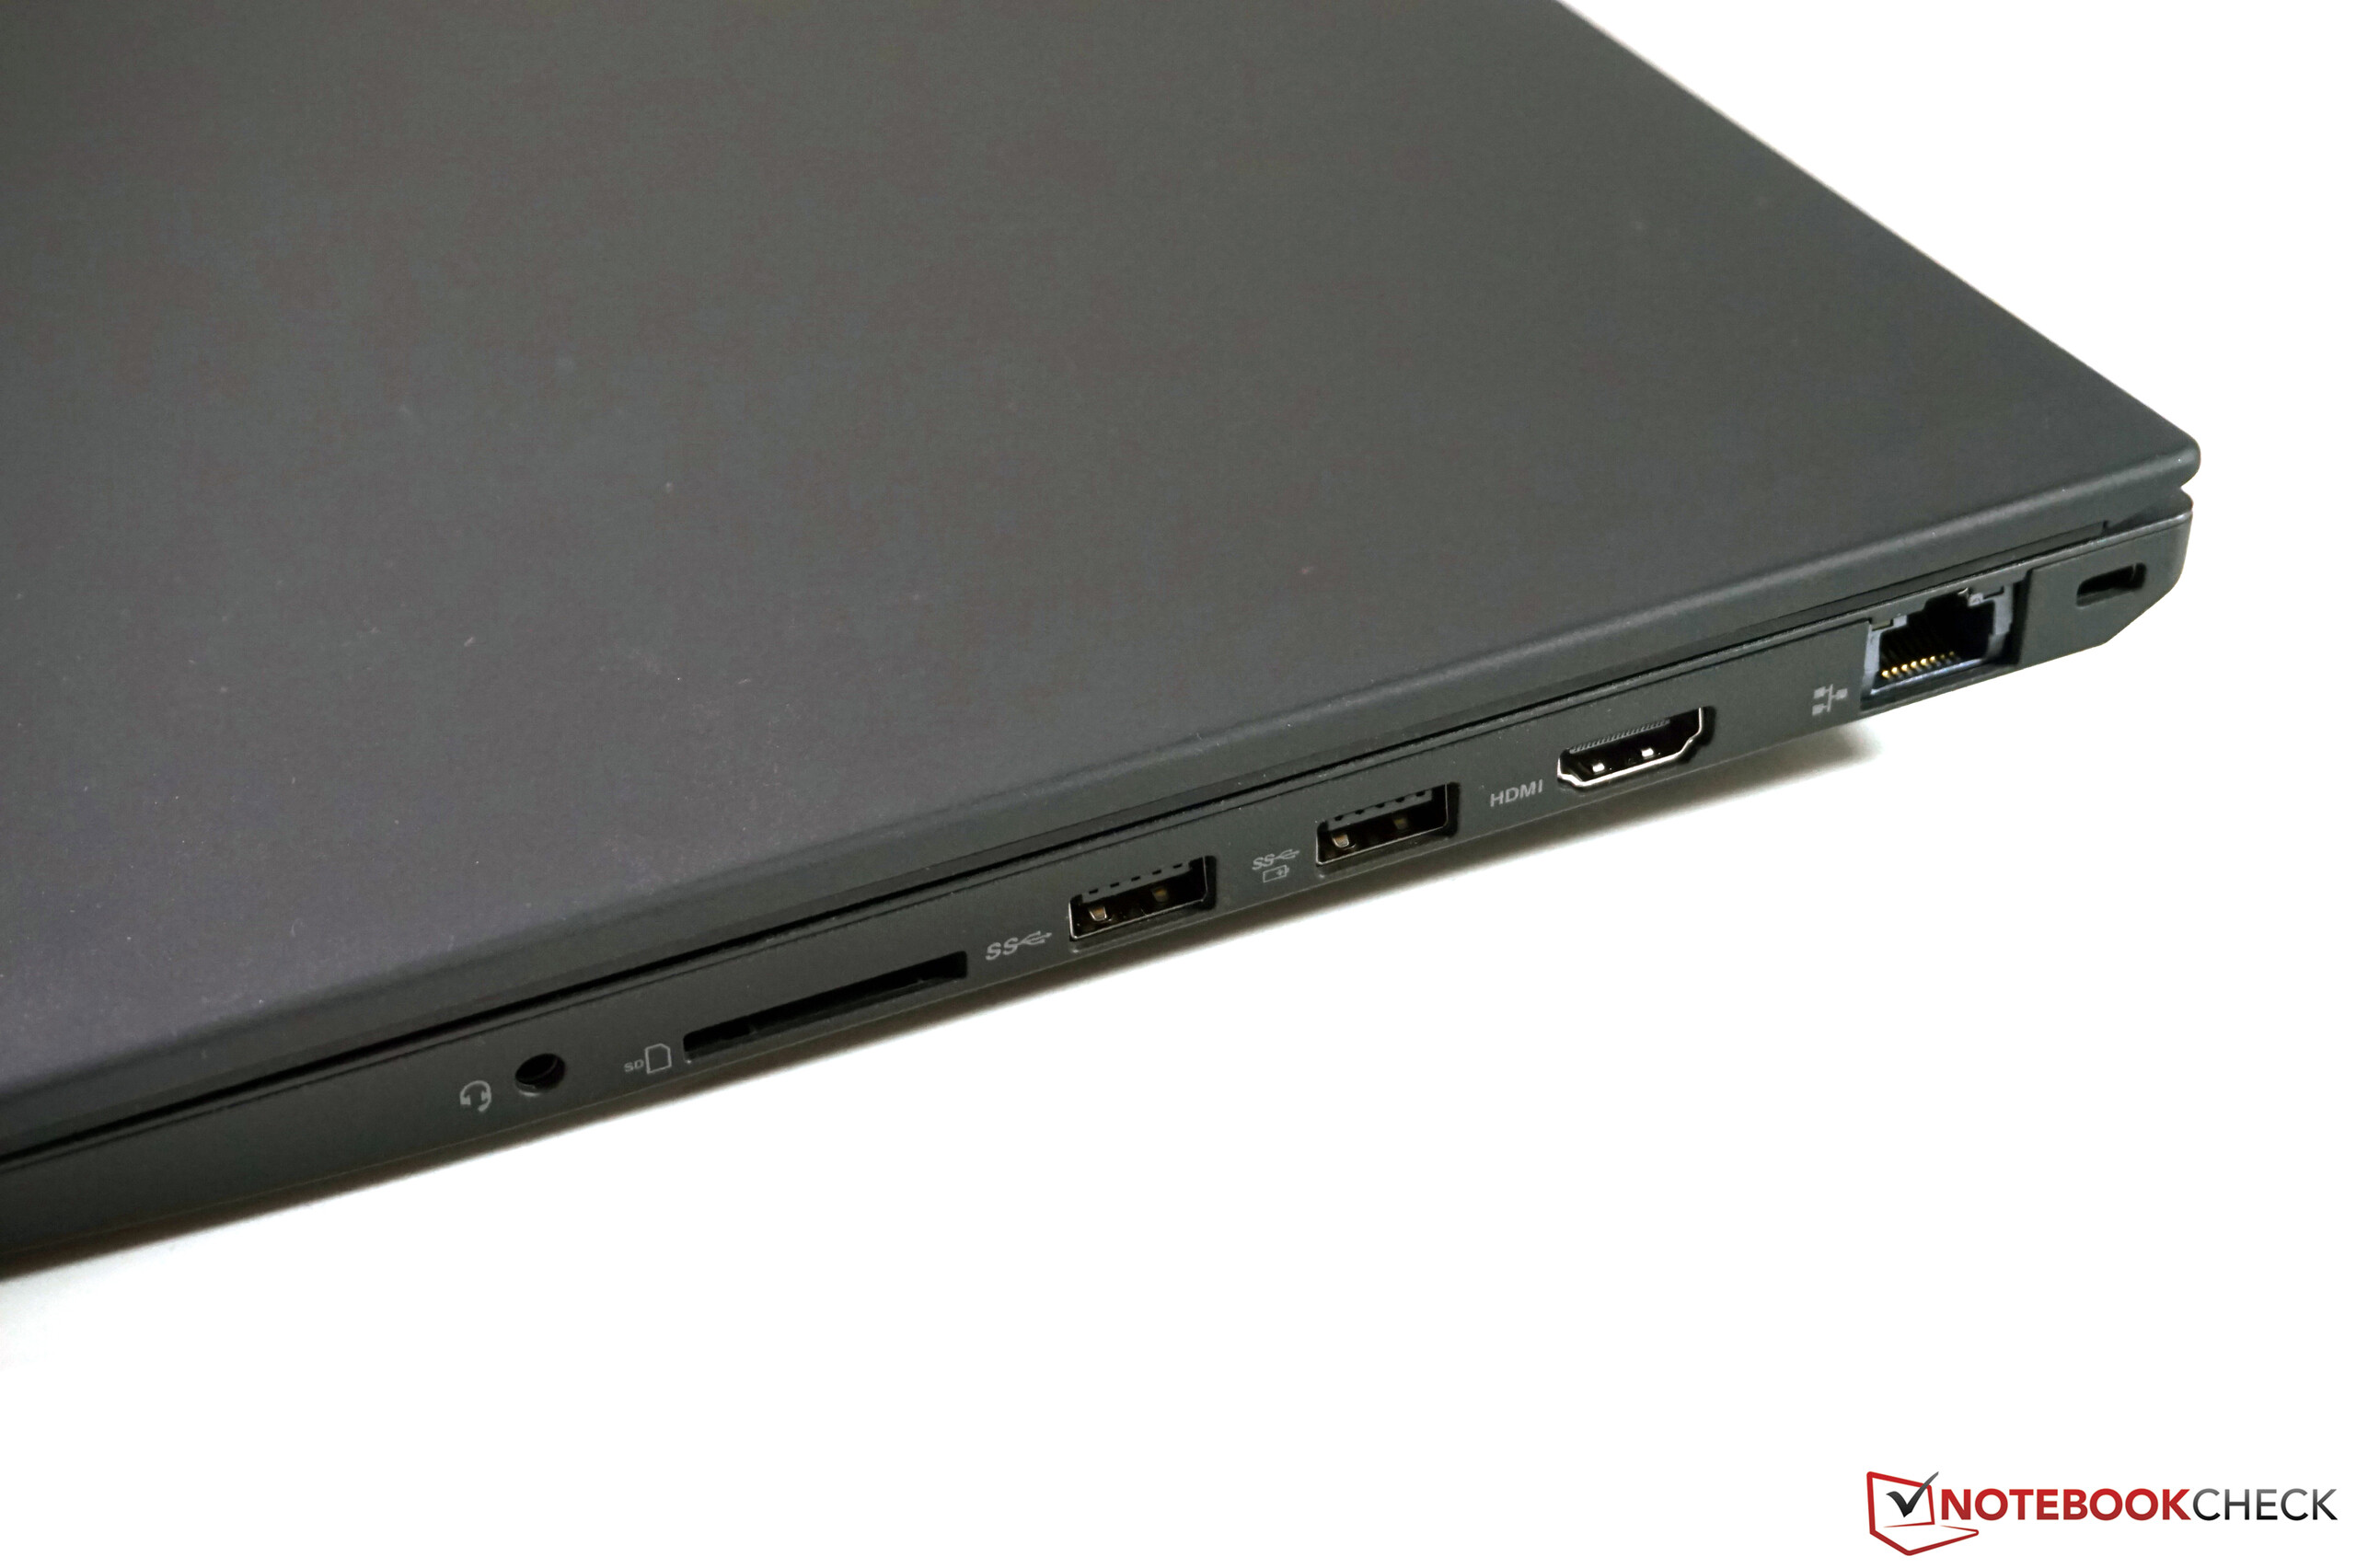
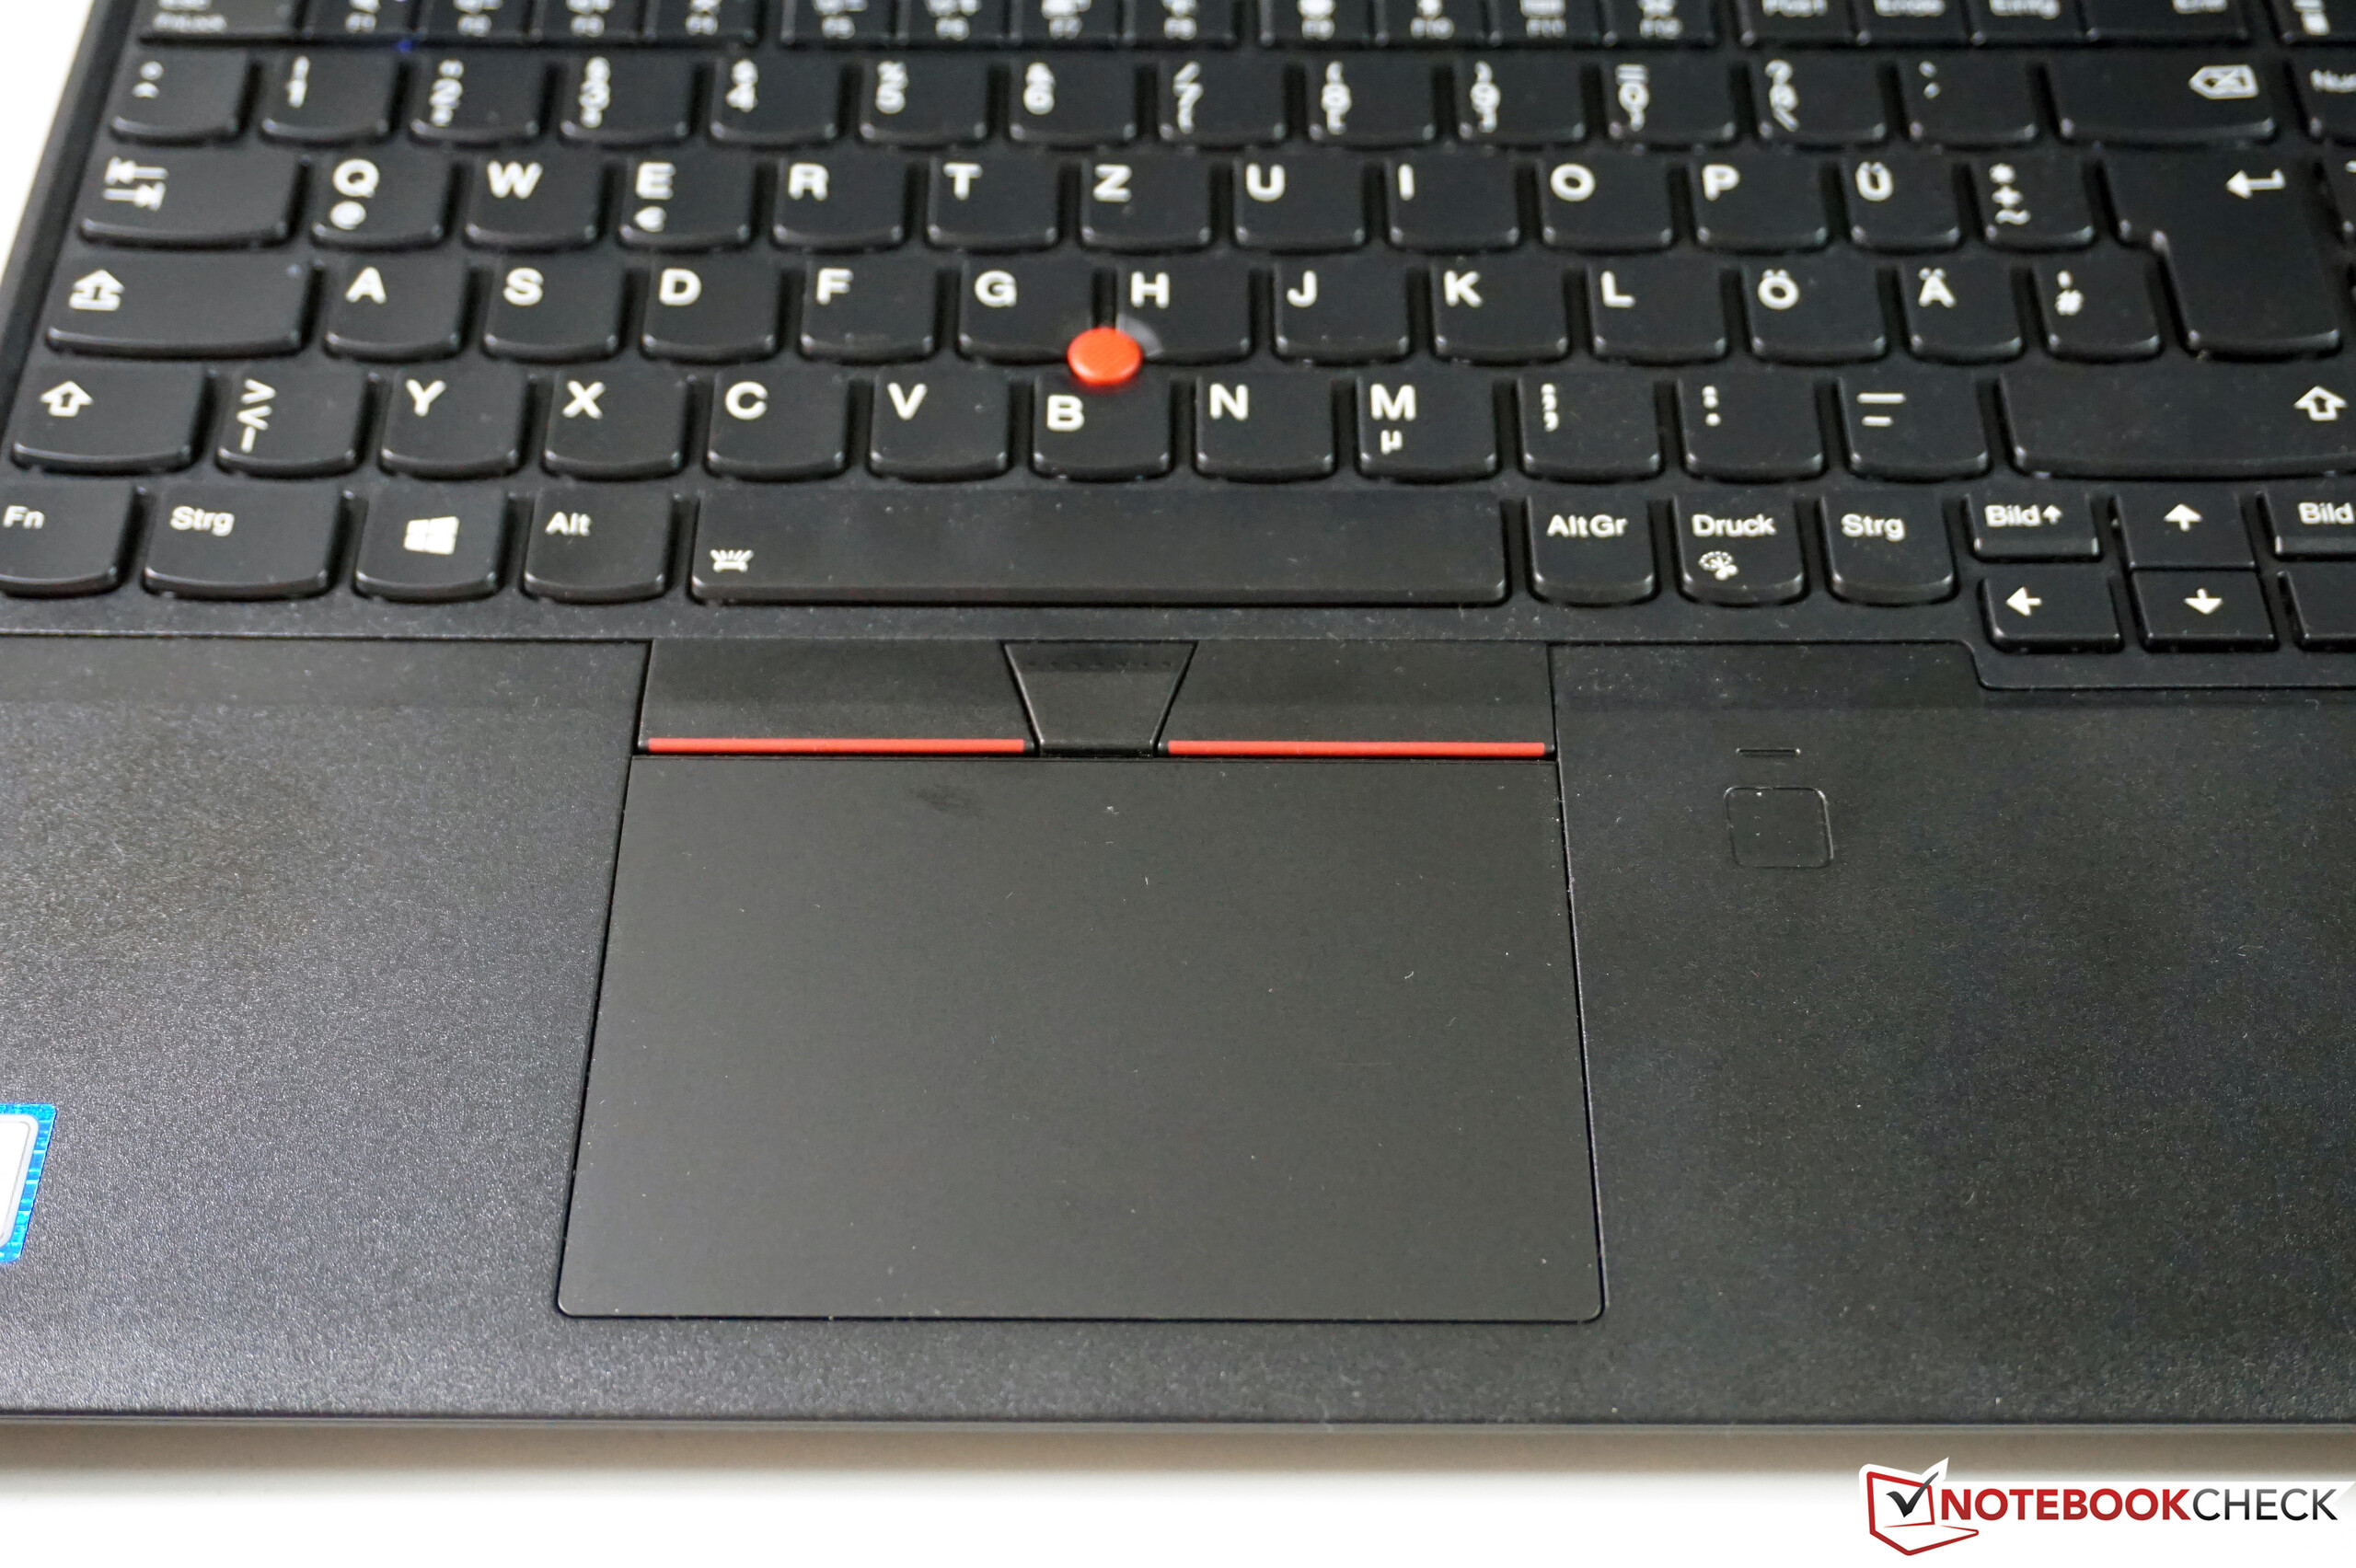
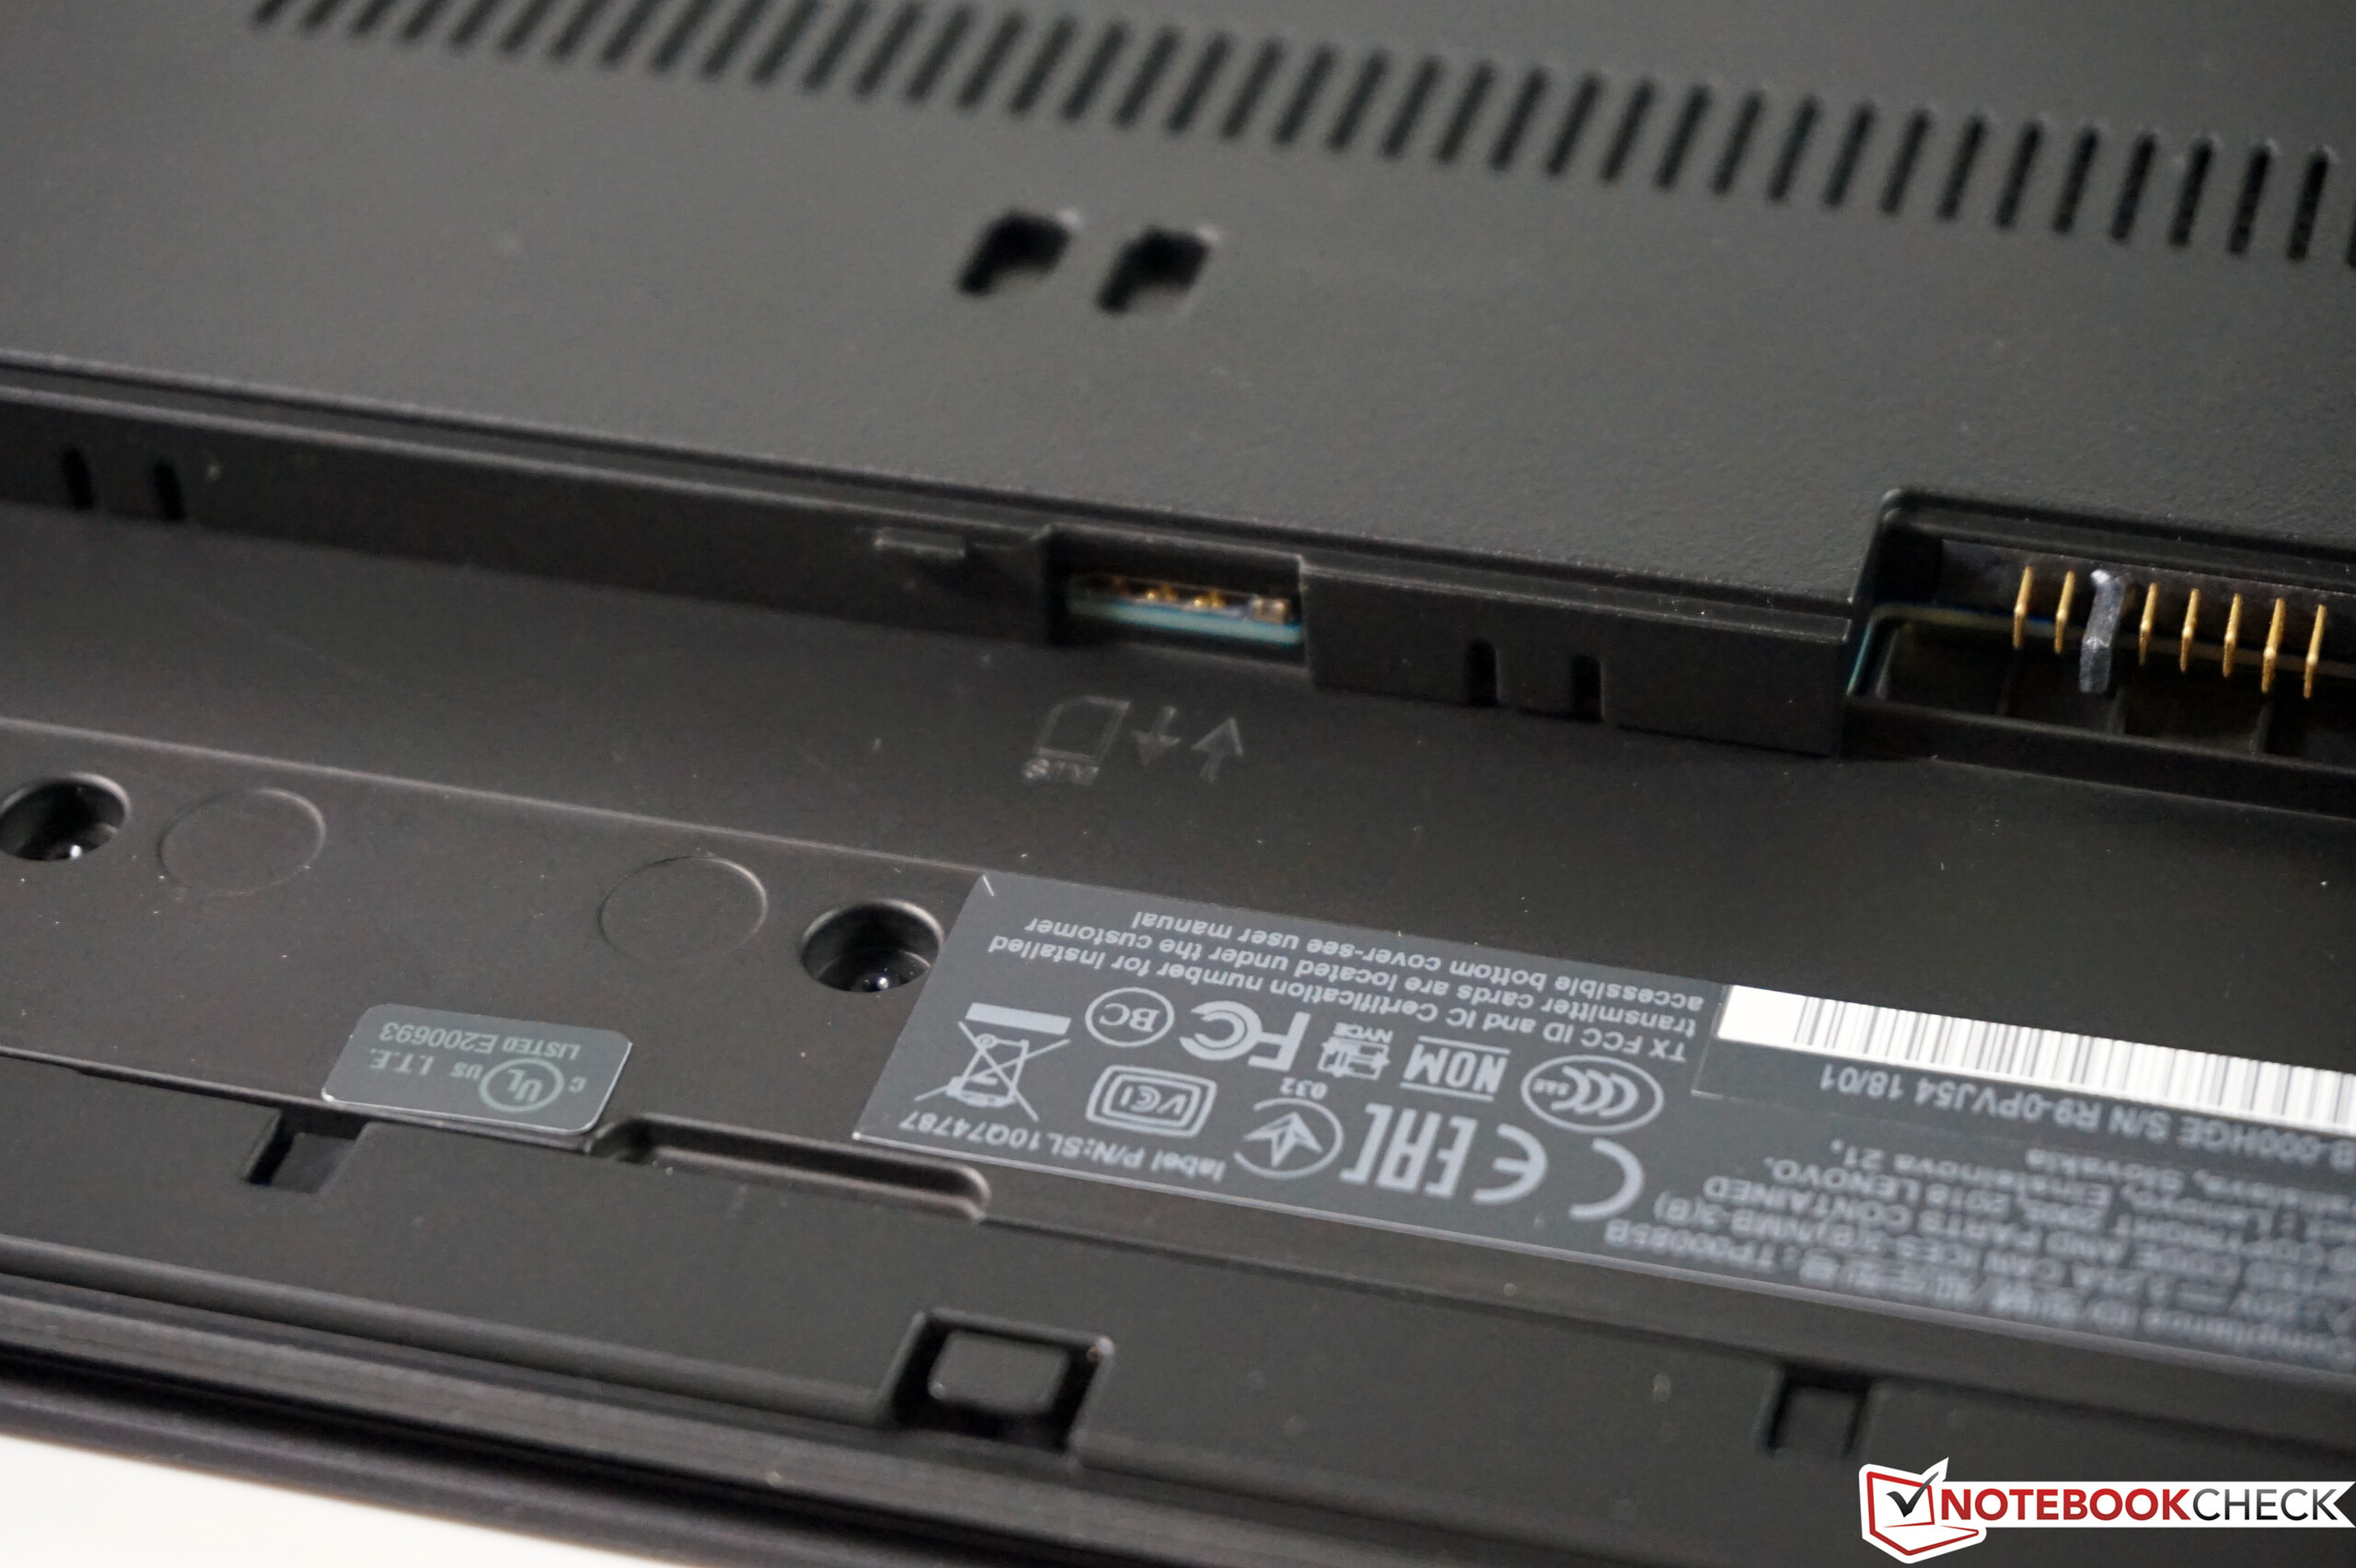
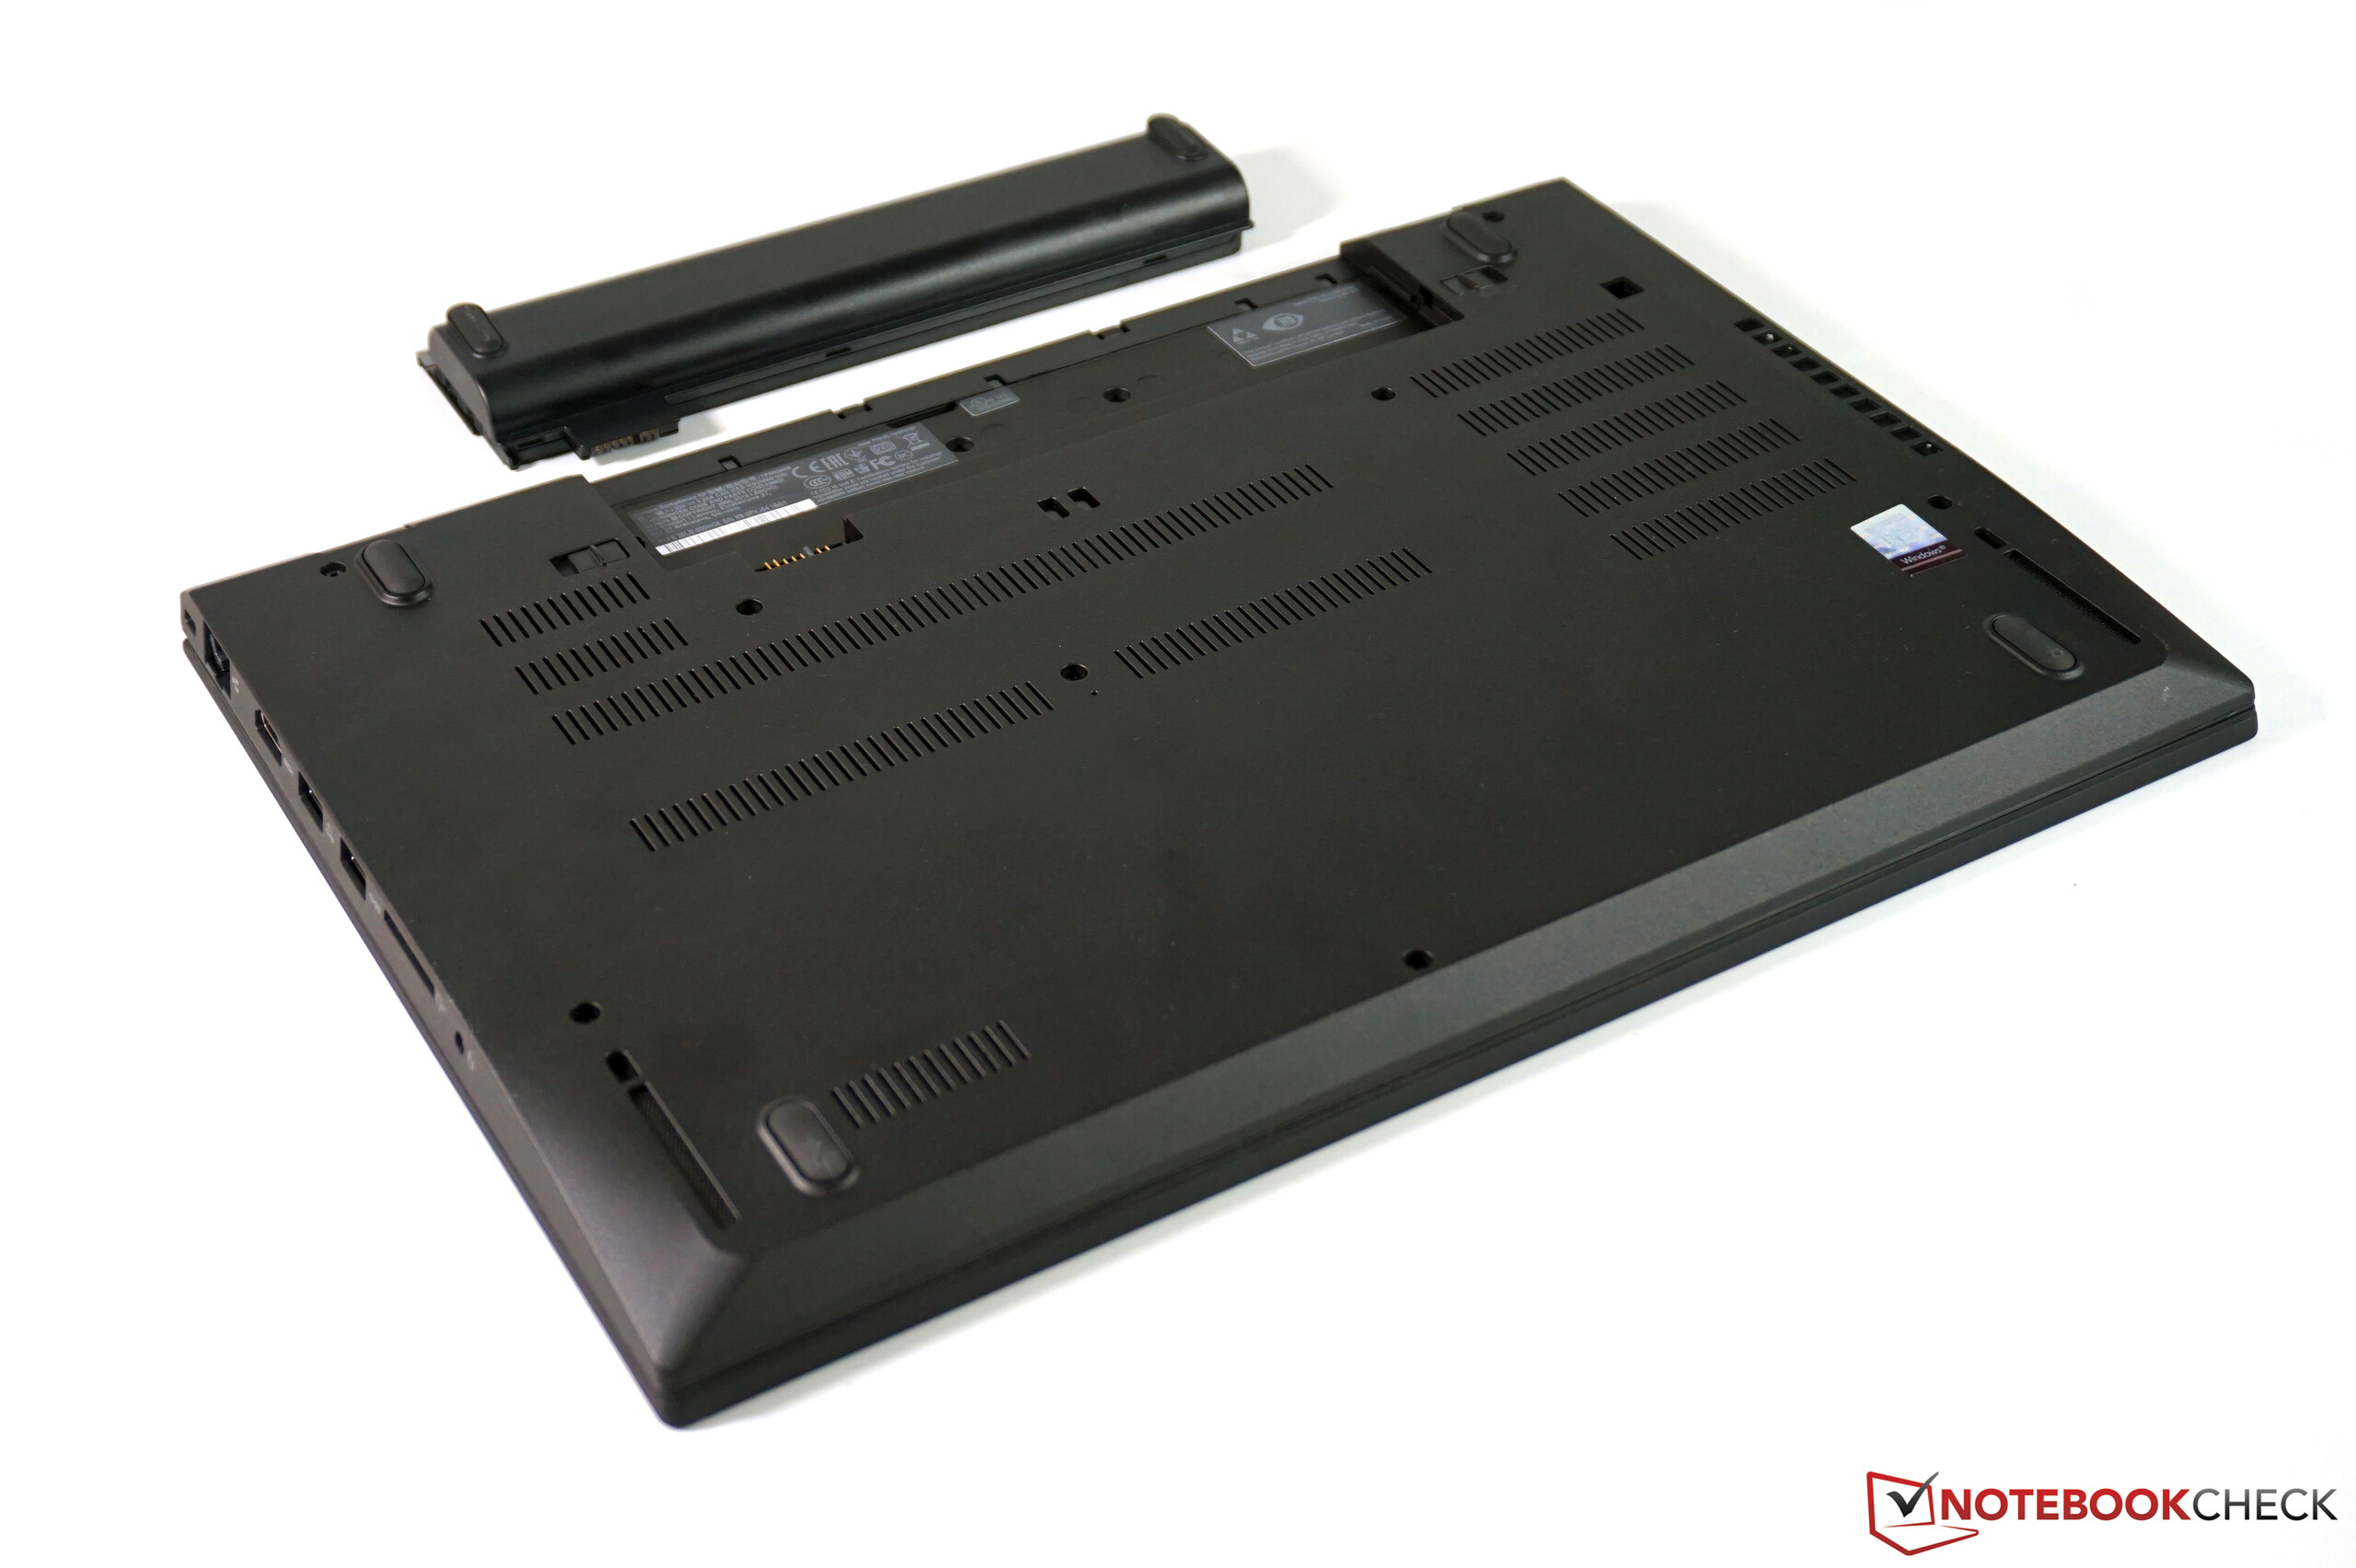
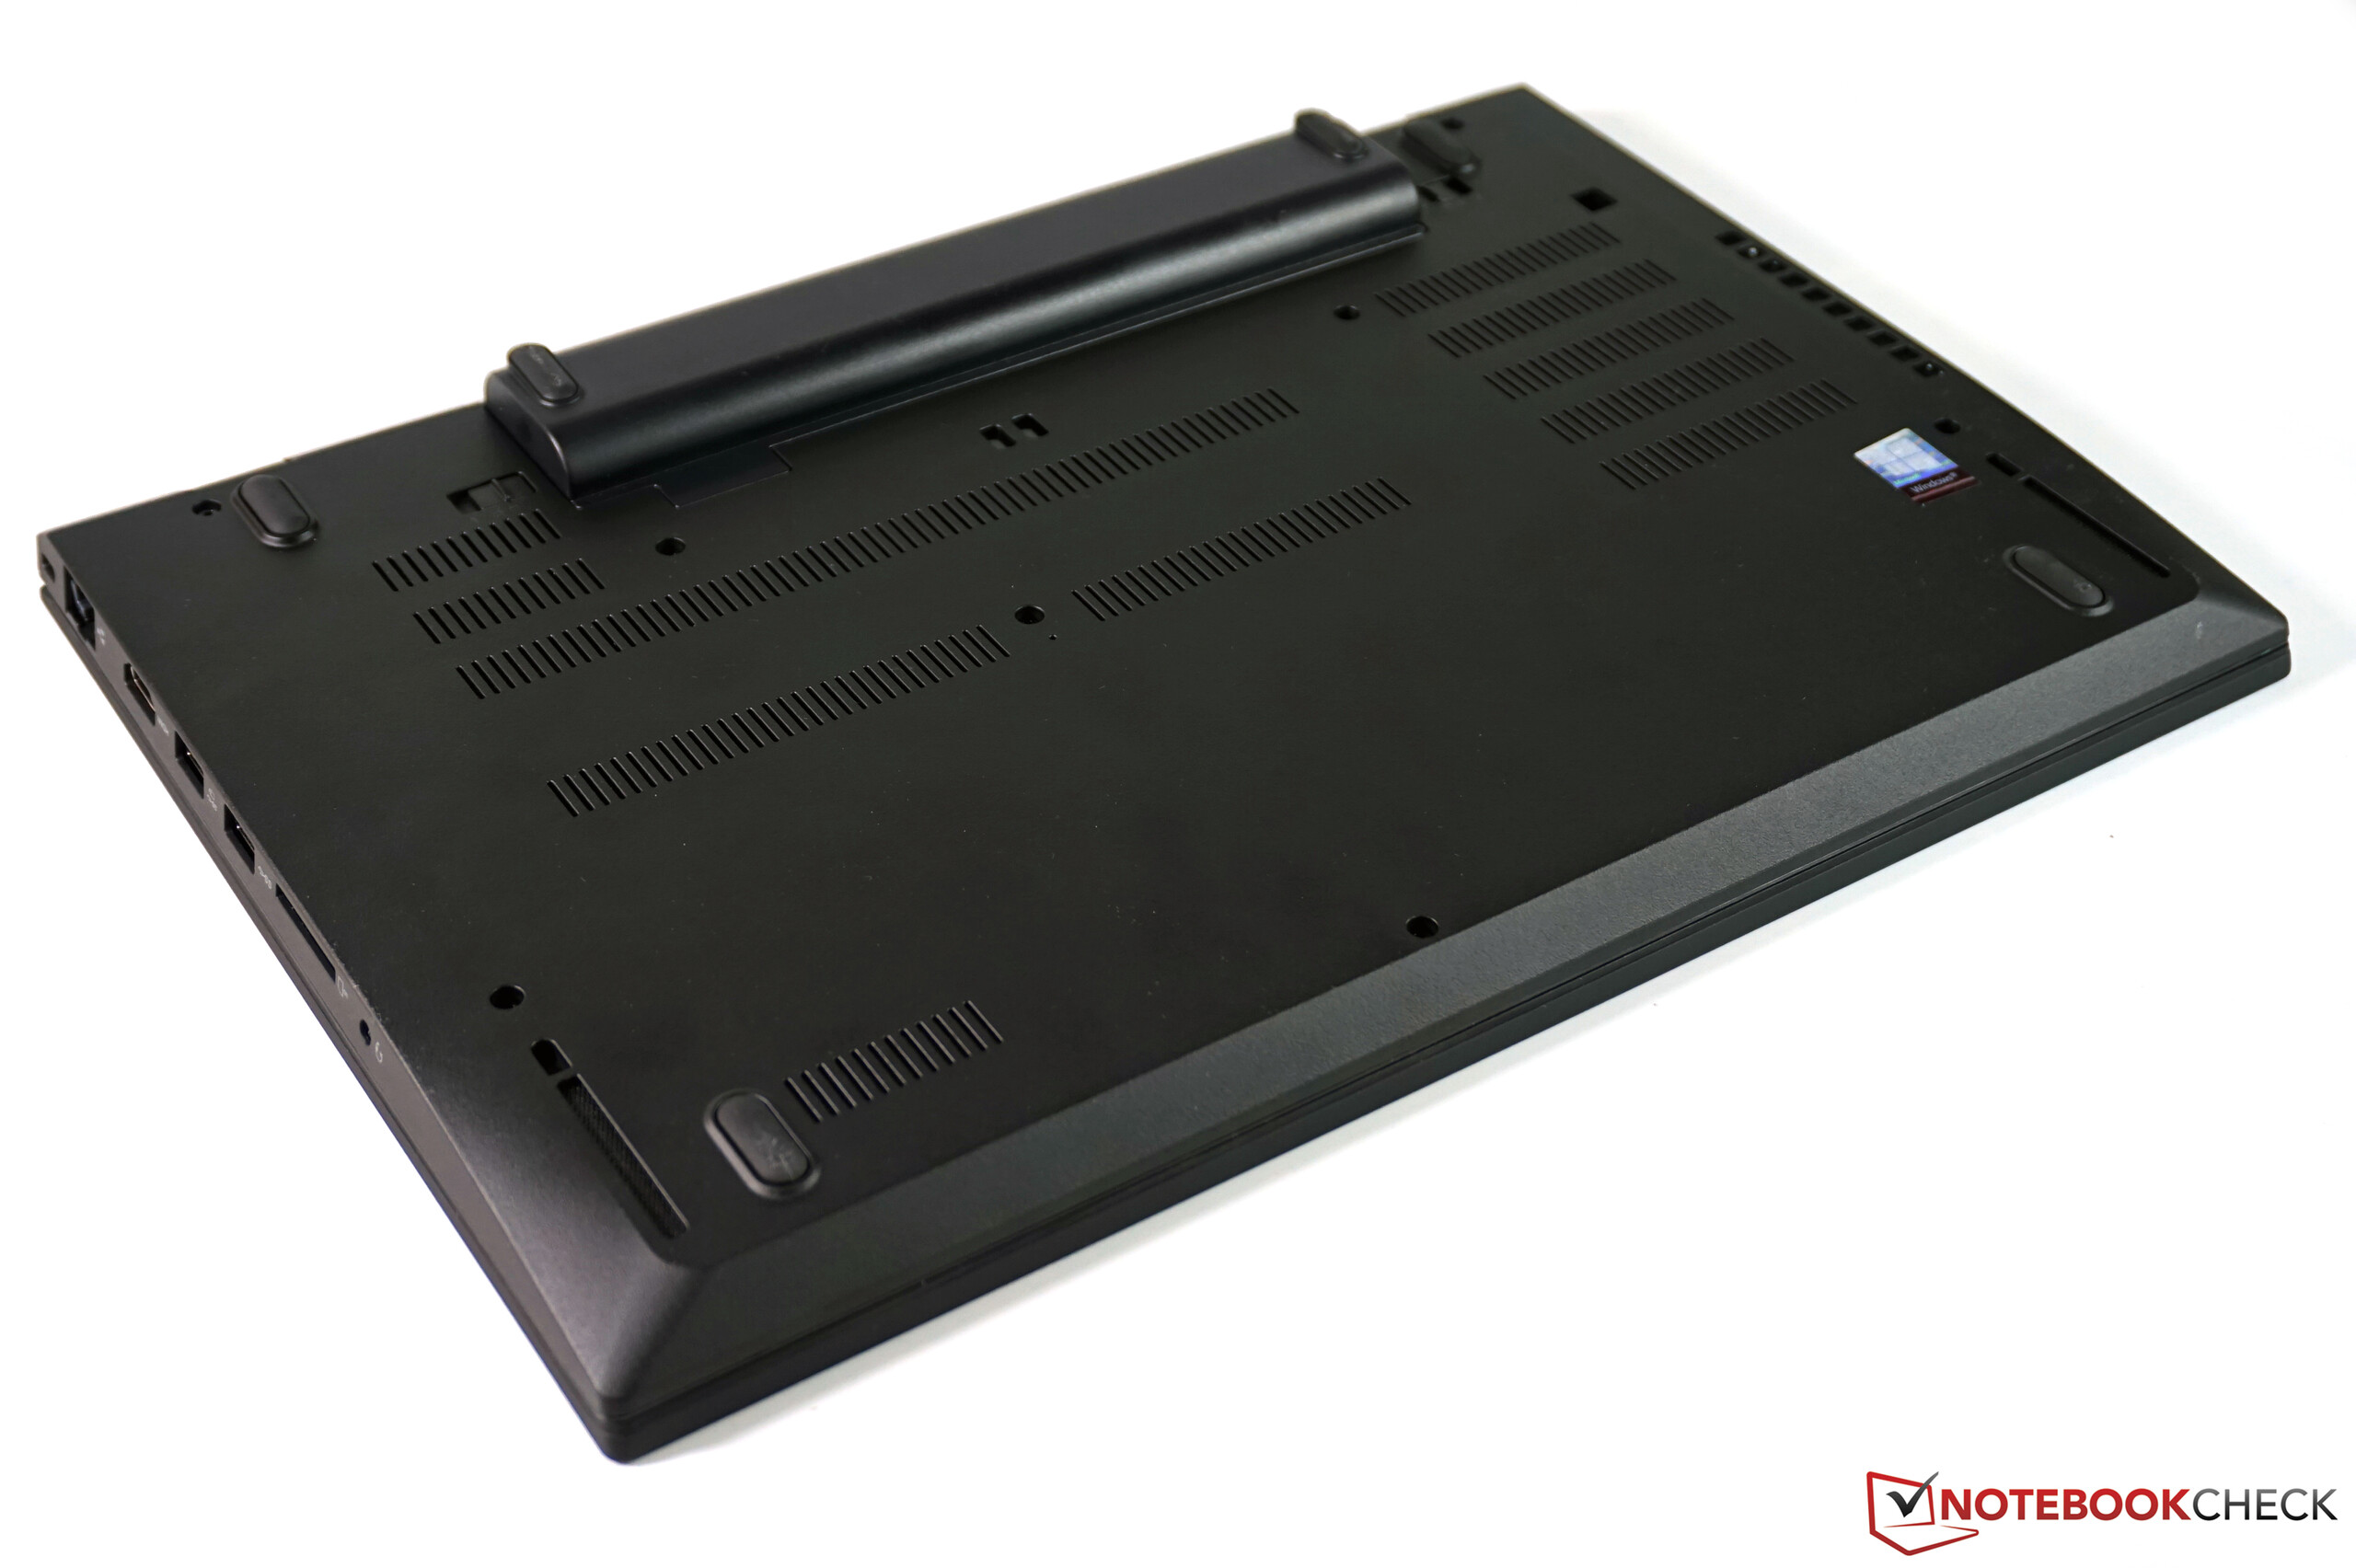
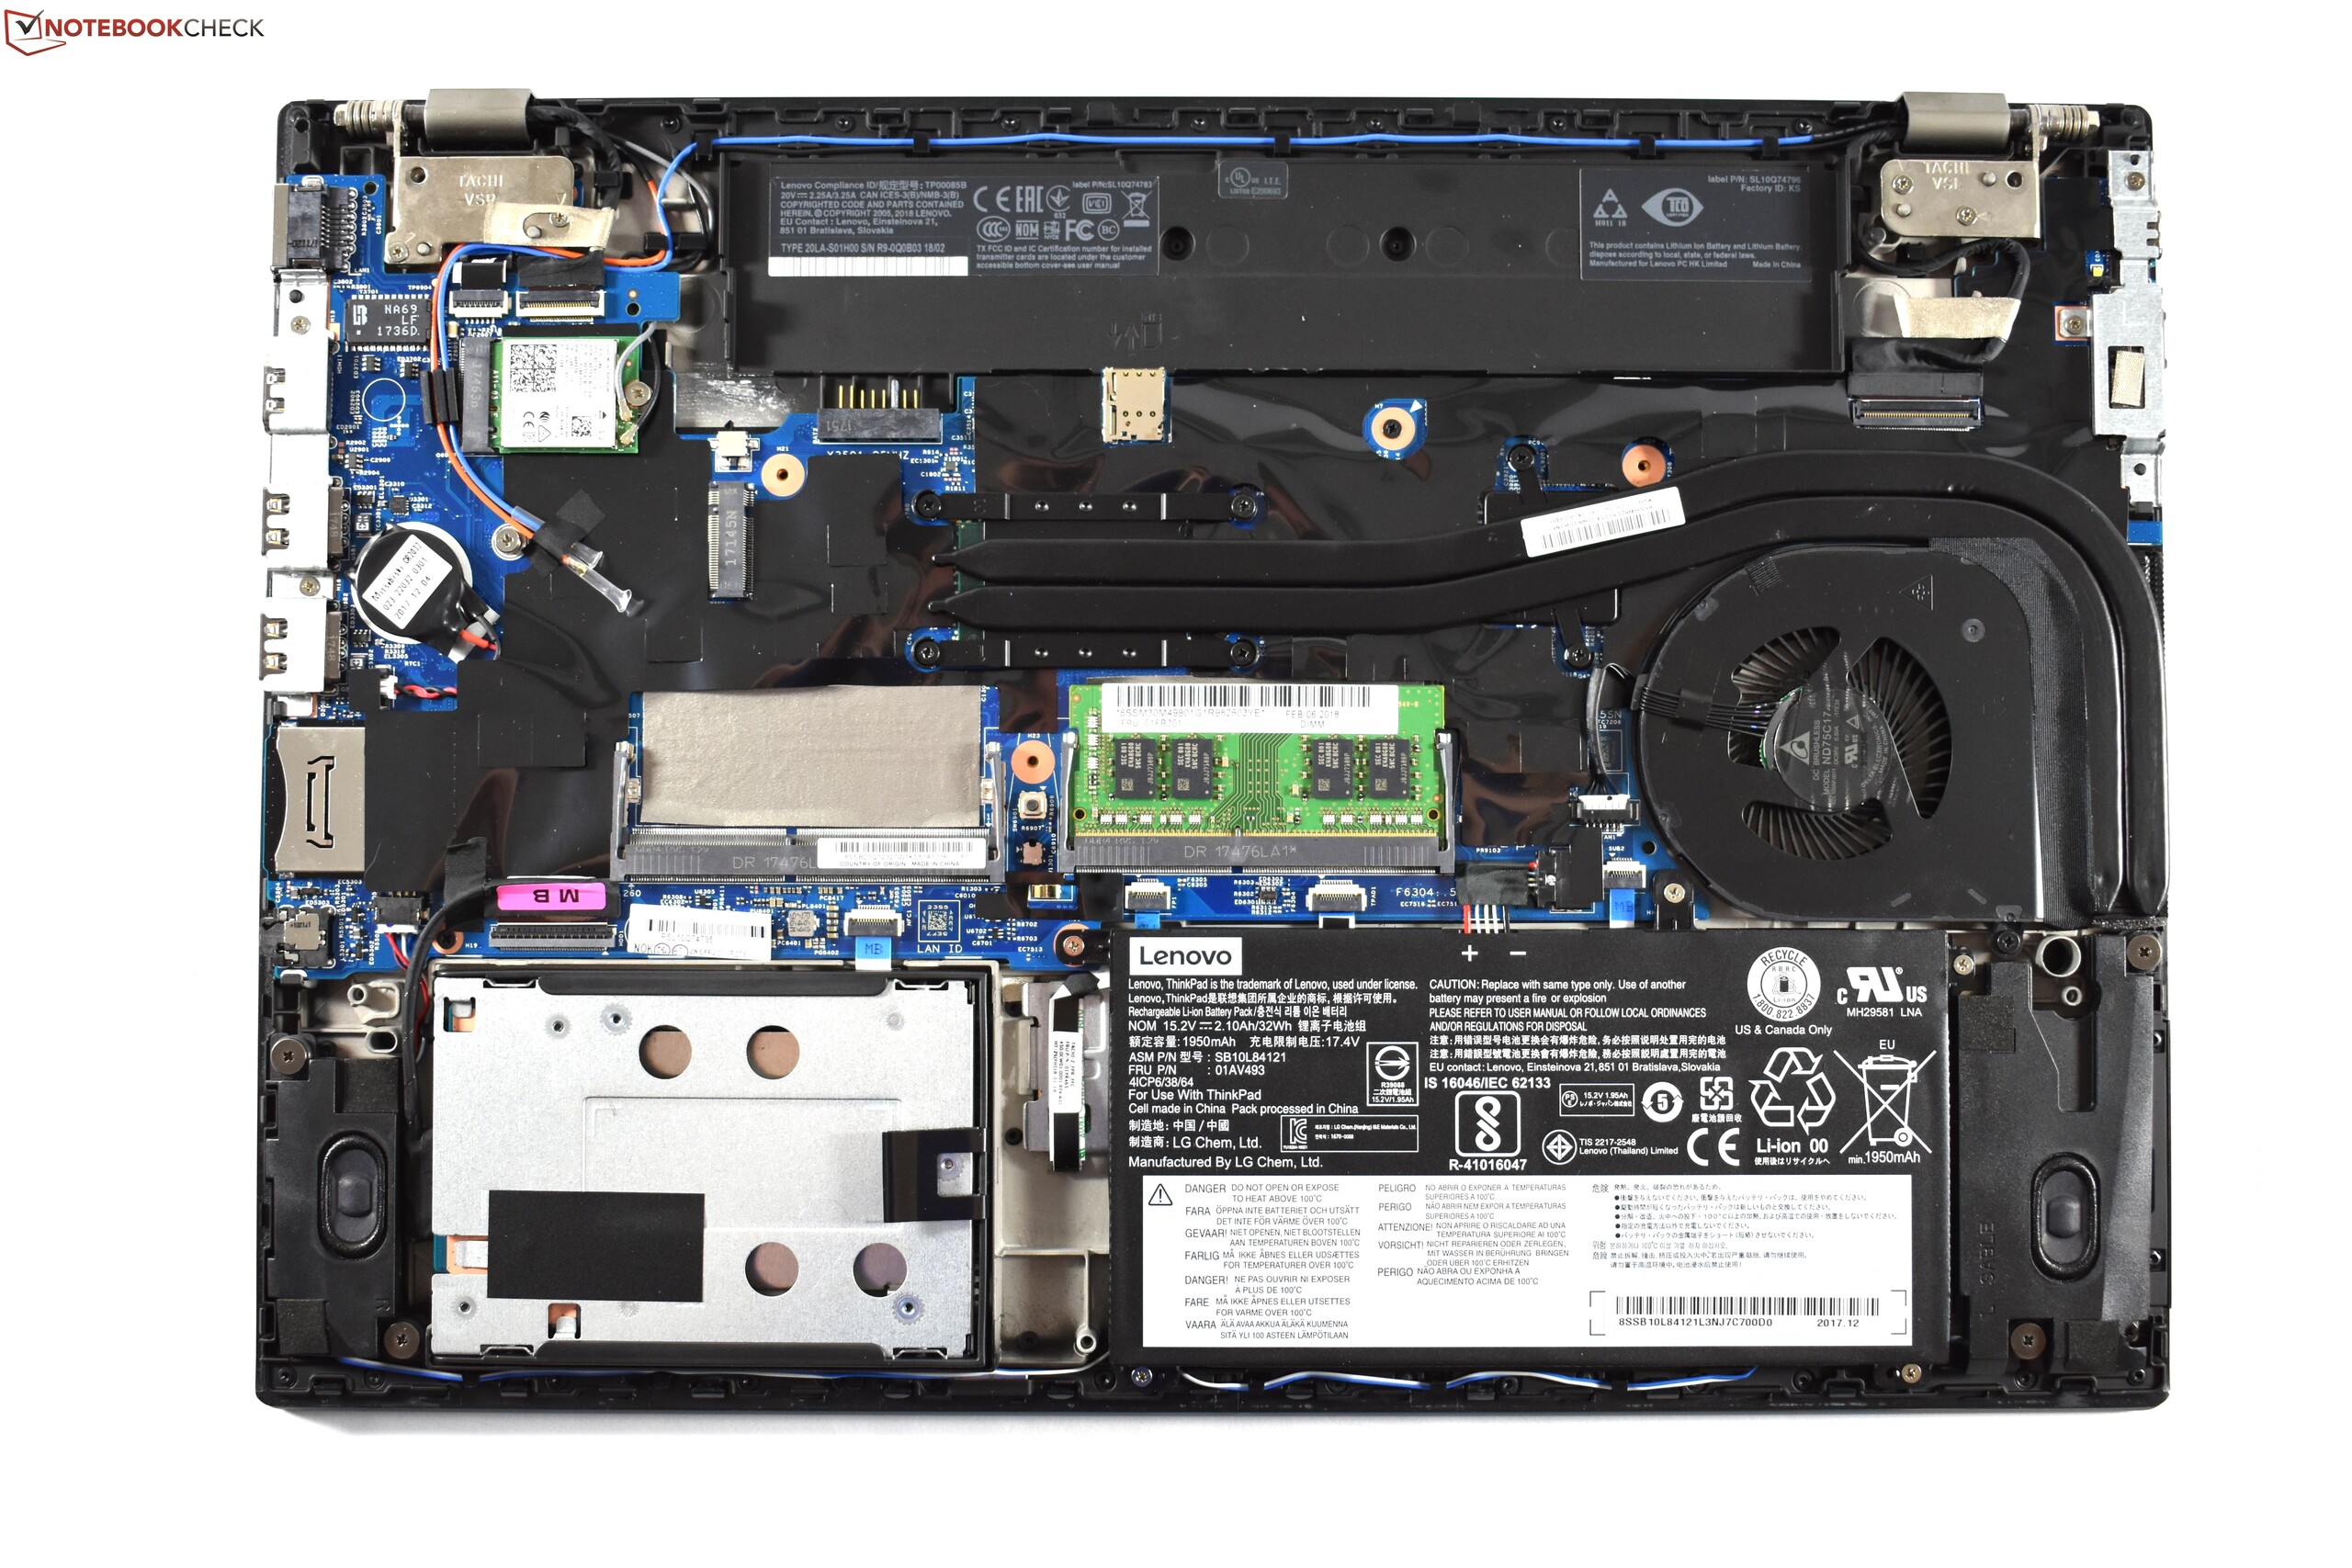
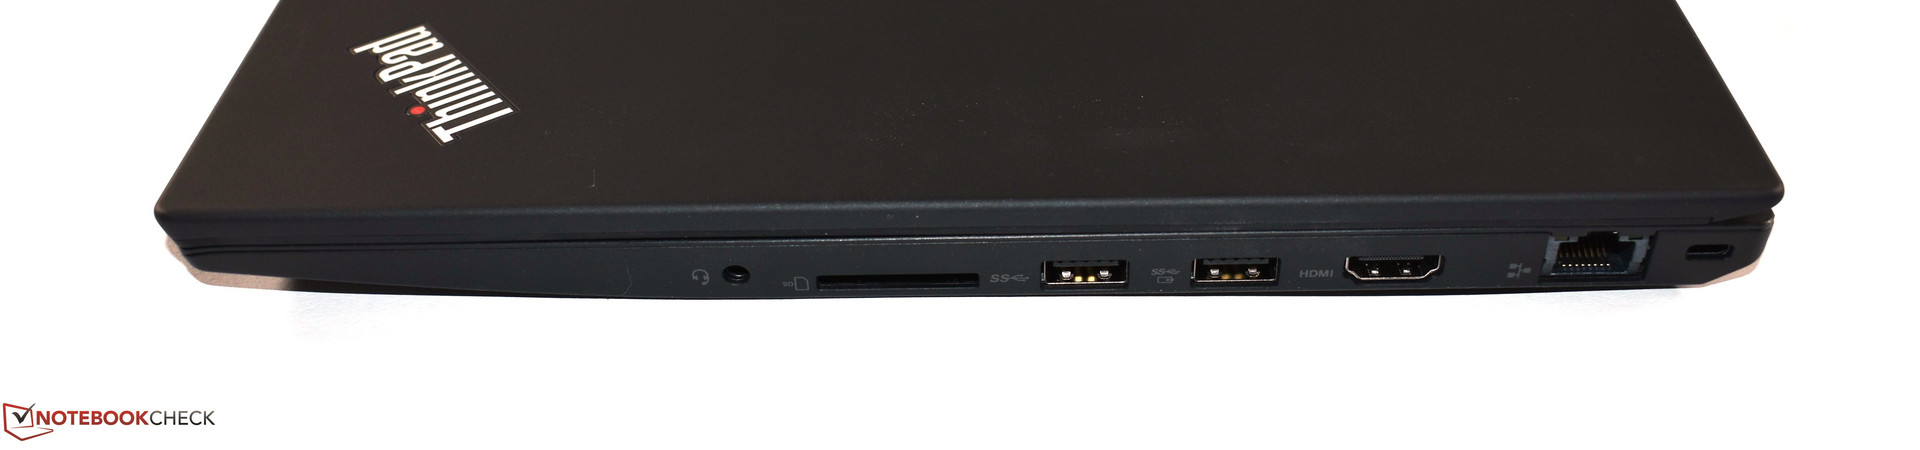
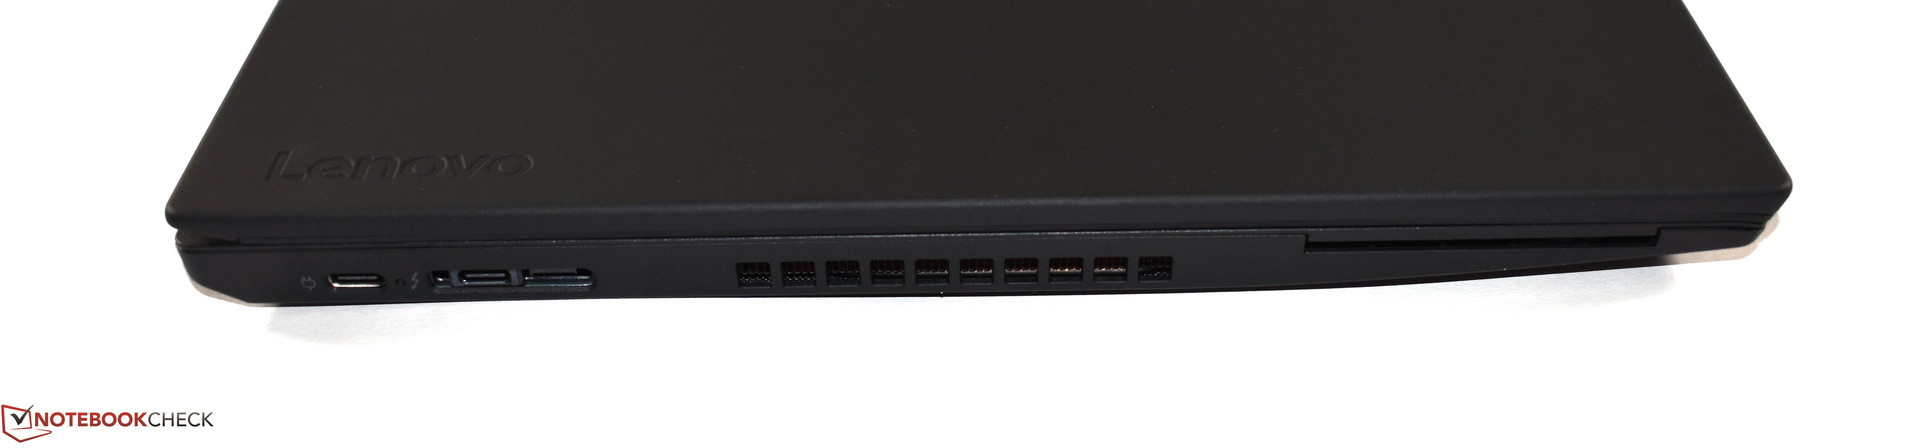
Isso se deve principalmente ao fato de que os processadores Ultra-Low-Voltage da geração Kaby Lake Refresh deram um grande salto quando se trata de desempenho. Embora o desempenho da CPU ainda esteja longe de competir com o dos CPUs de 45-Watt Coffee Lake, ele ainda cumpre os requisitos mínimos para um workstation móvel. Além disso, o desempenho do processador está acima da média no P52s e significativamente melhor que no ZBook 15u G5, que está equipado com o mesmo processador. O P52s também carregou uma série de características positivas do ThinkPad T580, como a carcaça robusta com boas opções de manutenção, os populares dispositivos de entrada ThinkPad, a grande seleção de portas e recursos de segurança e a longa garantia padrão. À diferença do T580, nossa unidade de teste tem bons tempos de duração de bateria e o PowerBridge, que oferece grandes vantagens.
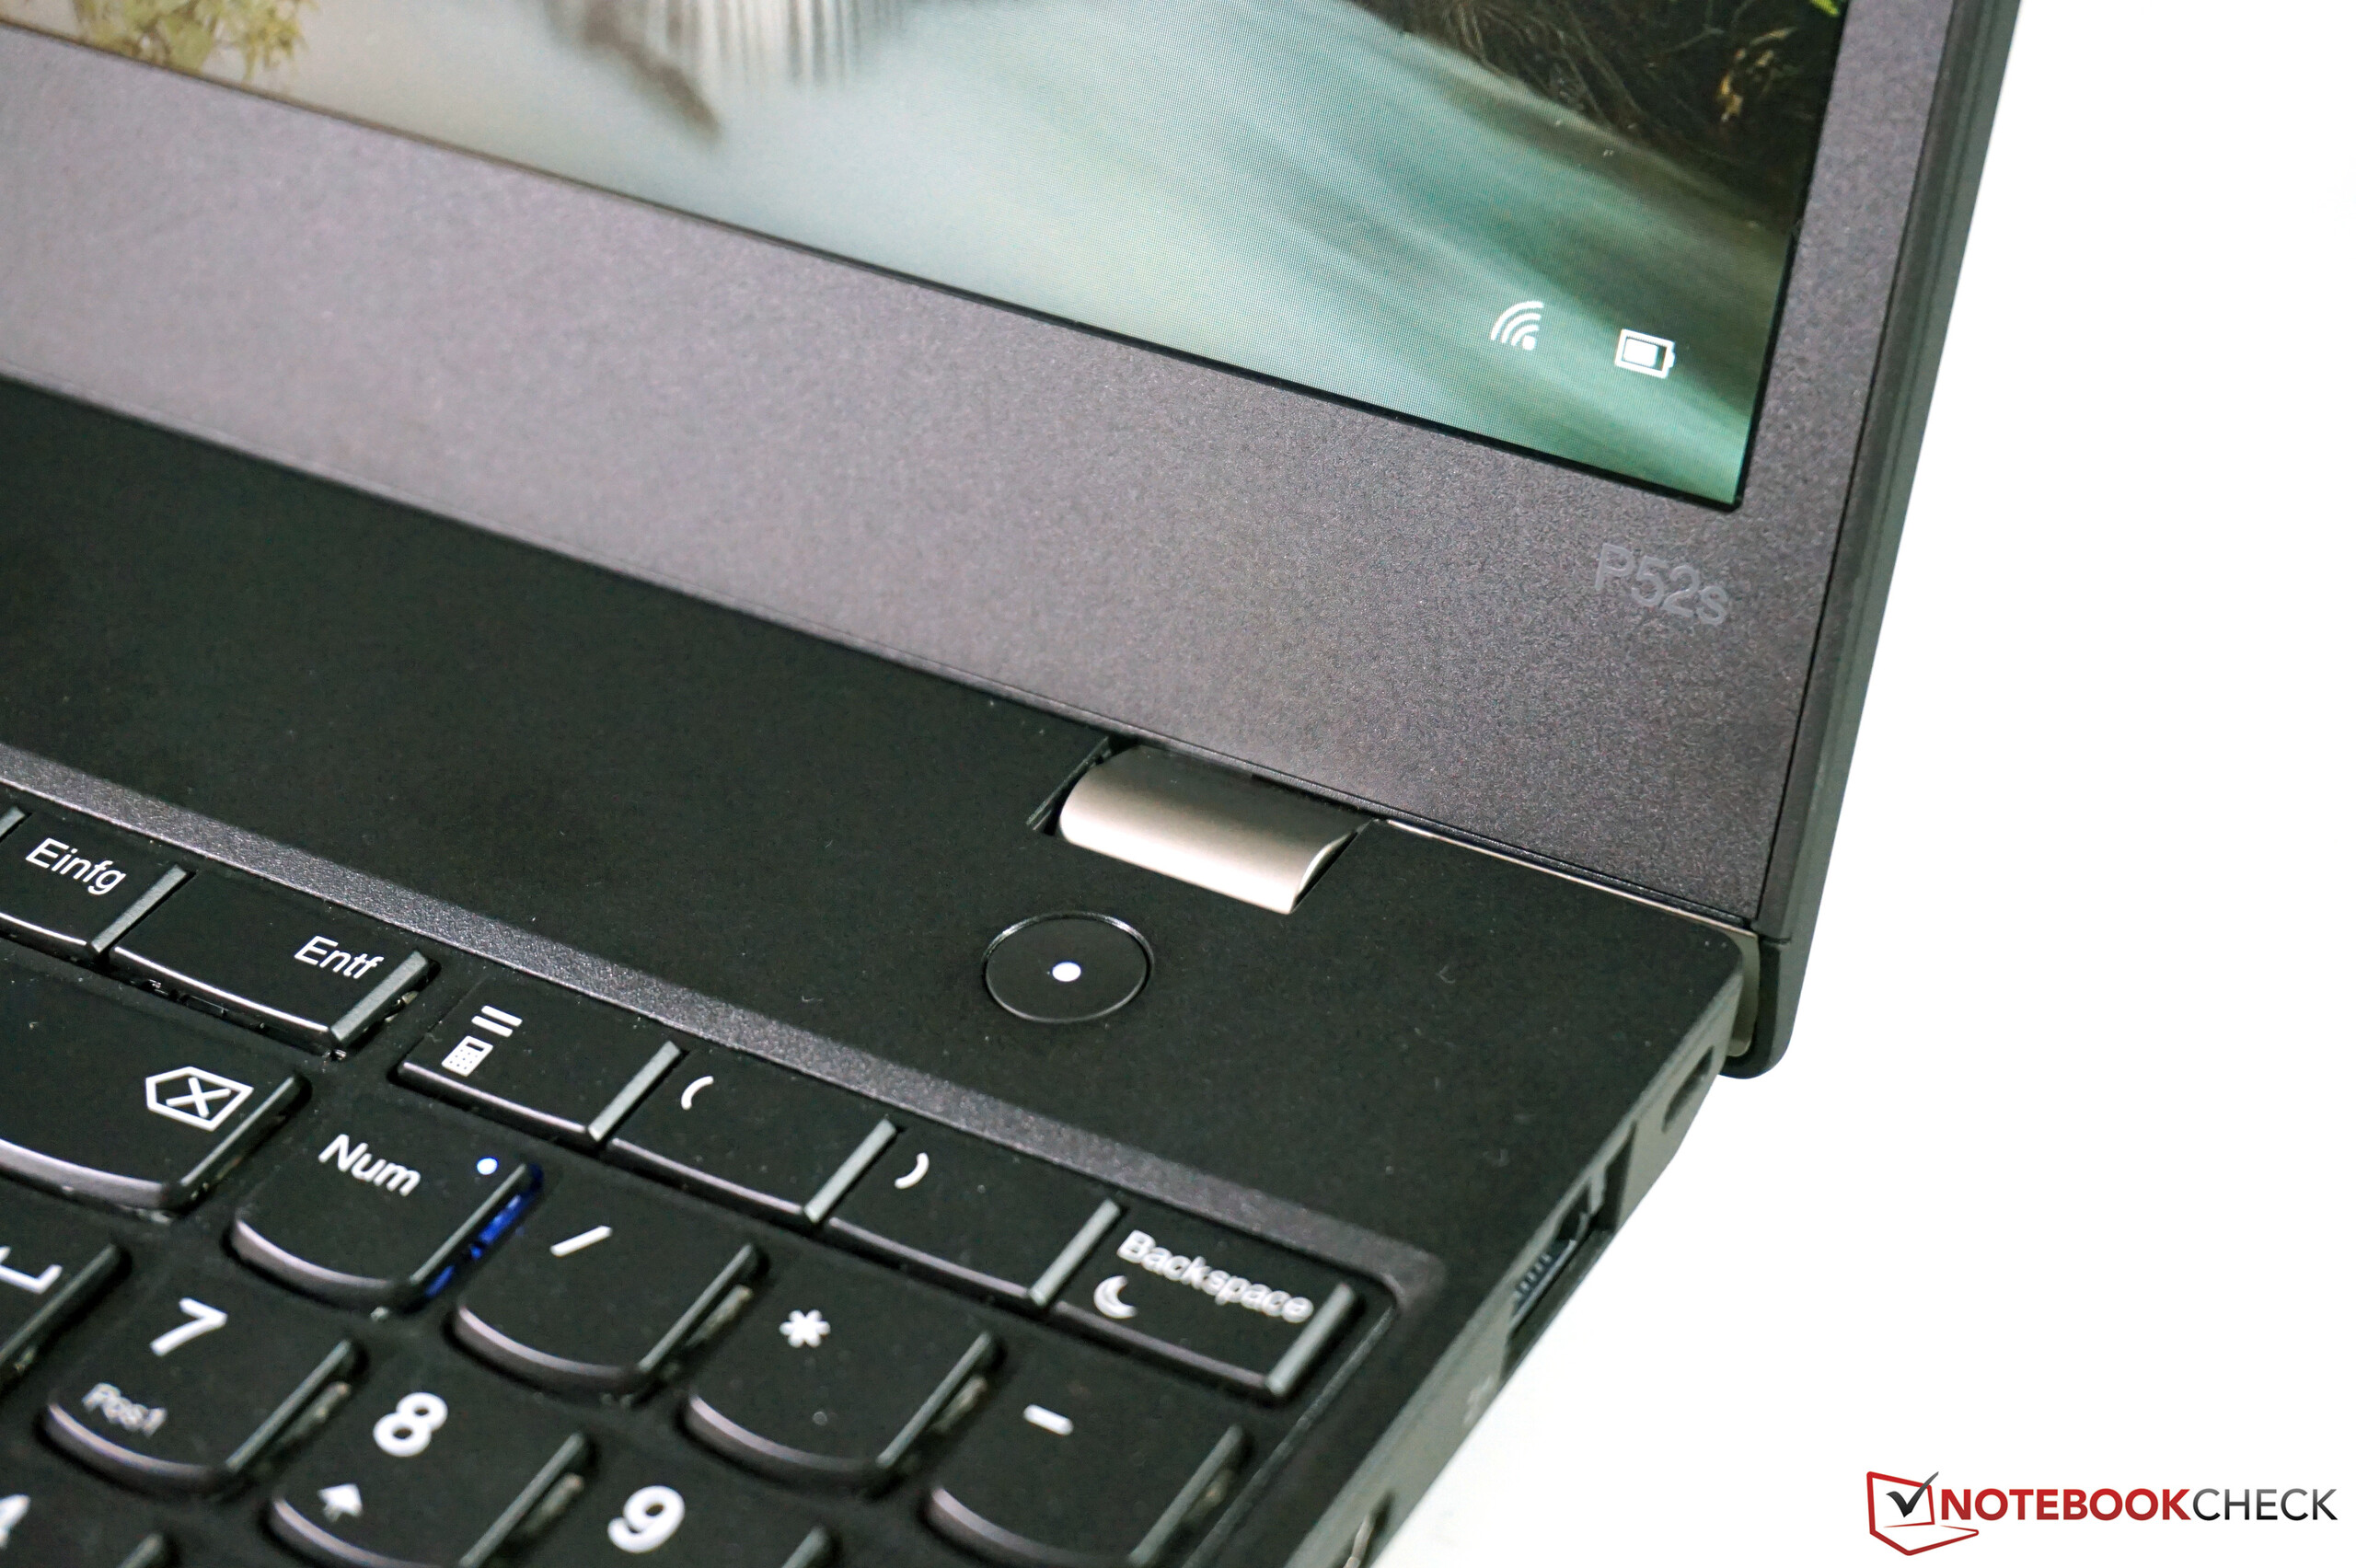
Ironicamente, o Quadro P5000, a única diferença real entre o P52s e o ThinkPad T580, também é a maior fraqueza do dispositivo. O desempenho da GPU Quadro não pode acompanhar o desempenho da GeForce MX150 no T580, devido à quantidade limitada de shaders. Naturalmente, existem também algumas desvantagens do T580 que foram transportadas para o P52, tais como os longos tempos de carga e o forte aquecimento sob uso intenso. A tela do nosso P52s oferece apenas uma resolução Full HD. Algumas das medições estão significativamente acima das especificações da Lenovo - por exemplo, a alta taxa de contraste. No entanto, a cobertura de espaço de cores é tão ruim quanto sempre, o que é uma marca bastante negra para um workstation móvel.
Basicamente, podemos recomendar o Lenovo ThinkPad P52s, mas será realmente interessante para um pequeno grupo de potenciais compradores, pois o Quadro P500 é simplesmente muito fraco.
Podemos dar uma recomendação de compra para o ThinkPad P52s? Basicamene, sim. Ele derrota seu concorrente direto, o HP ZBook 15u em muitas áreas - apenas o gerenciamento de temperatura e a sensação da carcaça são melhores no ZBook. Mas ainda assim, o P52s só será realmente adequado para um pequeno grupo de usuários, dado que o ThinkPad T580 oferece todas as qualidades do P52s e tem uma GPU mais potente. Somente usuários de software CAD podem preferir o P52s - mas novamente a questão é se esses usuários podem preferir comprar um workstation mais grosso e pesado com uma CPU e GPU mais fortes. Isso limita o mercado-alvo a alguns usuários que precisam de longos tempos de duração de bateria e uma GPU otimizada para CAD.
Lenovo ThinkPad P52s-20LB000HGE
-
06/25/2018 v6(old)
Benjamin Herzig
Pricecompare
