 Deutsch
 English
 Español
 Français
 Italiano
 Nederlands
 Polski
 Português
 Русский
 Türkçe
 Svenska
 Chinese
 Magyar
Breve Análise do Workstation Móvel Dell Precision 7510 (4K IGZO)
| |||||||||||||||||||||||||
iluminação: 83 %
iluminação com acumulador: 279.2 cd/m²
Contraste: 1050:1 (Preto: 0.266 cd/m²)
ΔE Color 4.14 | 0.5-29.43 Ø5
ΔE Greyscale 3.26 | 0.57-98 Ø5.3
99.72% sRGB (Argyll 1.6.3 3D)
85.68% AdobeRGB 1998 (Argyll 1.6.3 3D)
99% AdobeRGB 1998 (Argyll 2.2.0 3D)
99.7% sRGB (Argyll 2.2.0 3D)
86.2% Display P3 (Argyll 2.2.0 3D)
Gamma: 2.19
| Dell Precision 7510 (4K IGZO) 15.60, 3840x2160 | HP ZBook 15 G3 15.60, 1920x1080 | MSI WS60-6QJE316H11 15.60, 3840x2160 | Lenovo ThinkPad P50s-20FKS00400 15.50, 2880x1620 | Lenovo ThinkPad P50 15.60, 1920x1080 | Dell Precision 5510 15.60, 3840x2160 | |
|---|---|---|---|---|---|---|
| Display | -19% | -32% | -25% | -52% | 1% | |
| Display P3 Coverage | 86.2 | 66.8 -23% | 55.1 -36% | 63.7 -26% | 39.13 -55% | 88.4 3% |
| sRGB Coverage | 99.7 | 95.5 -4% | 83 -17% | 87.6 -12% | 58.5 -41% | 100 0% |
| AdobeRGB 1998 Coverage | 99 | 69 -30% | 56.9 -43% | 63.8 -36% | 40.45 -59% | 99.5 1% |
| Response Times | -21% | 197% | 4% | -4% | -32% | |
| Response Time Grey 50% / Grey 80% * | 40.4 ? | 54 ? -34% | 34 ? 16% | 38 ? 6% | 46 ? -14% | 56.4 ? -40% |
| Response Time Black / White * | 27.6 ? | 35.6 ? -29% | 24 ? 13% | 28.8 ? -4% | 26 ? 6% | 34 ? -23% |
| PWM Frequency | 198.4 ? | 198 ? 0% | 1316 ? 563% | 219 ? 10% | ||
| Screen | -26% | -19% | -16% | -15% | -1% | |
| Brightness middle | 279.2 | 306 10% | 237 -15% | 319 14% | 263 -6% | 391 40% |
| Brightness | 271 | 289 7% | 208 -23% | 290 7% | 236 -13% | 361 33% |
| Brightness Distribution | 83 | 85 2% | 77 -7% | 82 -1% | 78 -6% | 87 5% |
| Black Level * | 0.266 | 0.34 -28% | 0.26 2% | 0.31 -17% | 0.34 -28% | 0.4 -50% |
| Contrast | 1050 | 900 -14% | 912 -13% | 1029 -2% | 774 -26% | 978 -7% |
| Colorchecker dE 2000 * | 4.14 | 5.1 -23% | 4.42 -7% | 4.8 -16% | 2.35 43% | 4.85 -17% |
| Colorchecker dE 2000 max. * | 6.56 | 9.9 -51% | 8.54 -30% | 7.8 -19% | ||
| Greyscale dE 2000 * | 3.26 | 7.4 -127% | 4.43 -36% | 5.7 -75% | 3.33 -2% | 4.01 -23% |
| Gamma | 2.19 100% | 2.37 93% | 2.23 99% | 2.07 106% | 2.38 92% | 2.18 101% |
| CCT | 6375 102% | 7263 89% | 6133 106% | 6260 104% | 6917 94% | 7340 89% |
| Color Space (Percent of AdobeRGB 1998) | 85.68 | 63 -26% | 52.5 -39% | 56.9 -34% | 37 -57% | 96 12% |
| Color Space (Percent of sRGB) | 99.72 | 95 -5% | 82.9 -17% | 87.4 -12% | 58 -42% | 100 0% |
| Total Average (Program / Settings) | -22% /
-23% | 49% /
19% | -12% /
-14% | -24% /
-21% | -11% /
-5% |
* ... smaller is better
Display Response Times
| ↔ Response Time Black to White | ||
|---|---|---|
| 27.6 ms ... rise ↗ and fall ↘ combined | ↗ 6.8 ms rise | 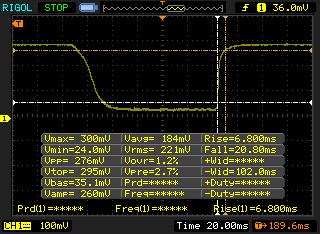 |
| ↘ 20.8 ms fall | ||
| The screen shows relatively slow response rates in our tests and may be too slow for gamers. In comparison, all tested devices range from 0.1 (minimum) to 240 (maximum) ms. » 66 % of all devices are better. This means that the measured response time is worse than the average of all tested devices (21.5 ms). | ||
| ↔ Response Time 50% Grey to 80% Grey | ||
| 40.4 ms ... rise ↗ and fall ↘ combined | ↗ 19.6 ms rise | 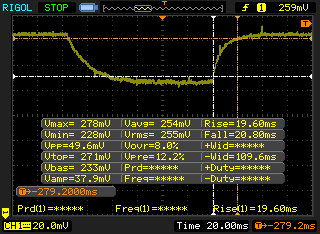 |
| ↘ 20.8 ms fall | ||
| The screen shows slow response rates in our tests and will be unsatisfactory for gamers. In comparison, all tested devices range from 0.2 (minimum) to 636 (maximum) ms. » 58 % of all devices are better. This means that the measured response time is worse than the average of all tested devices (33.7 ms). | ||
Screen Flickering / PWM (Pulse-Width Modulation)
| Screen flickering / PWM detected | 198.4 Hz | ≤ 29 % brightness setting | 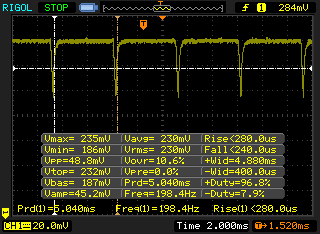 |
The display backlight flickers at 198.4 Hz (worst case, e.g., utilizing PWM) Flickering detected at a brightness setting of 29 % and below. There should be no flickering or PWM above this brightness setting. The frequency of 198.4 Hz is relatively low, so sensitive users will likely notice flickering and experience eyestrain at the stated brightness setting and below. In comparison: 53 % of all tested devices do not use PWM to dim the display. If PWM was detected, an average of 17900 (minimum: 5 - maximum: 3846000) Hz was measured. | |||
| Cinebench R11.5 | |
| CPU Single 64Bit (sort by value) | |
| Dell Precision 7510 (4K IGZO) | |
| HP ZBook 15 G3 | |
| MSI WS60-6QJE316H11 | |
| Lenovo ThinkPad P50s-20FKS00400 | |
| Lenovo ThinkPad P50 | |
| Dell Precision 5510 | |
| CPU Multi 64Bit (sort by value) | |
| Dell Precision 7510 (4K IGZO) | |
| HP ZBook 15 G3 | |
| MSI WS60-6QJE316H11 | |
| Lenovo ThinkPad P50s-20FKS00400 | |
| Lenovo ThinkPad P50 | |
| Dell Precision 5510 | |
| Cinebench R15 | |
| CPU Single 64Bit (sort by value) | |
| Dell Precision 7510 (4K IGZO) | |
| HP ZBook 15 G3 | |
| MSI WS60-6QJE316H11 | |
| Lenovo ThinkPad P50s-20FKS00400 | |
| Lenovo ThinkPad P50 | |
| Dell Precision 5510 | |
| CPU Multi 64Bit (sort by value) | |
| Dell Precision 7510 (4K IGZO) | |
| HP ZBook 15 G3 | |
| MSI WS60-6QJE316H11 | |
| Lenovo ThinkPad P50s-20FKS00400 | |
| Lenovo ThinkPad P50 | |
| Dell Precision 5510 | |
| wPrime 2.10 - 1024m (sort by value) | |
| Dell Precision 7510 (4K IGZO) | |
| Dell Precision 5510 | |
| Super Pi Mod 1.5 XS 32M - 32M (sort by value) | |
| Dell Precision 7510 (4K IGZO) | |
| Dell Precision 5510 | |
* ... smaller is better
| PCMark 8 | |
| Home Score Accelerated v2 (sort by value) | |
| Dell Precision 7510 (4K IGZO) | |
| HP ZBook 15 G3 | |
| MSI WS60-6QJE316H11 | |
| Lenovo ThinkPad P50s-20FKS00400 | |
| Lenovo ThinkPad P50 | |
| Dell Precision 5510 | |
| Work Score Accelerated v2 (sort by value) | |
| Dell Precision 7510 (4K IGZO) | |
| HP ZBook 15 G3 | |
| MSI WS60-6QJE316H11 | |
| Lenovo ThinkPad P50s-20FKS00400 | |
| Lenovo ThinkPad P50 | |
| Dell Precision 5510 | |
| Creative Score Accelerated v2 (sort by value) | |
| Dell Precision 7510 (4K IGZO) | |
| HP ZBook 15 G3 | |
| Dell Precision 5510 | |
| PCMark 8 Home Score Accelerated v2 | 4020 pontos | |
| PCMark 8 Creative Score Accelerated v2 | 5537 pontos | |
| PCMark 8 Work Score Accelerated v2 | 4246 pontos | |
Ajuda | ||

| 3DMark 11 | |
| 1280x720 Performance GPU (sort by value) | |
| Dell Precision 7510 (4K IGZO) | |
| HP ZBook 15 G3 | |
| MSI WS60-6QJE316H11 | |
| Lenovo ThinkPad P50s-20FKS00400 | |
| Lenovo ThinkPad P50 | |
| Dell Precision 5510 | |
| 1280x720 Performance Combined (sort by value) | |
| Dell Precision 7510 (4K IGZO) | |
| HP ZBook 15 G3 | |
| MSI WS60-6QJE316H11 | |
| Lenovo ThinkPad P50s-20FKS00400 | |
| Lenovo ThinkPad P50 | |
| Dell Precision 5510 | |
| 3DMark | |
| 1280x720 Cloud Gate Standard Graphics (sort by value) | |
| Dell Precision 7510 (4K IGZO) | |
| HP ZBook 15 G3 | |
| MSI WS60-6QJE316H11 | |
| Lenovo ThinkPad P50s-20FKS00400 | |
| Lenovo ThinkPad P50 | |
| Dell Precision 5510 | |
| 1920x1080 Fire Strike Graphics (sort by value) | |
| Dell Precision 7510 (4K IGZO) | |
| HP ZBook 15 G3 | |
| MSI WS60-6QJE316H11 | |
| Lenovo ThinkPad P50s-20FKS00400 | |
| Lenovo ThinkPad P50 | |
| Dell Precision 5510 | |
| 3DMark 06 Standard Score | 27269 pontos | |
| 3DMark 11 Performance | 5419 pontos | |
| 3DMark Ice Storm Standard Score | 99266 pontos | |
| 3DMark Cloud Gate Standard Score | 17525 pontos | |
| 3DMark Fire Strike Score | 3919 pontos | |
Ajuda | ||
| baixo | média | alto | ultra | 4K | |
| BioShock Infinite (2013) | 219 | 139 | 123 | 45 | |
| Rise of the Tomb Raider (2016) | 72 | 49 | 28 | 23 | 16 |
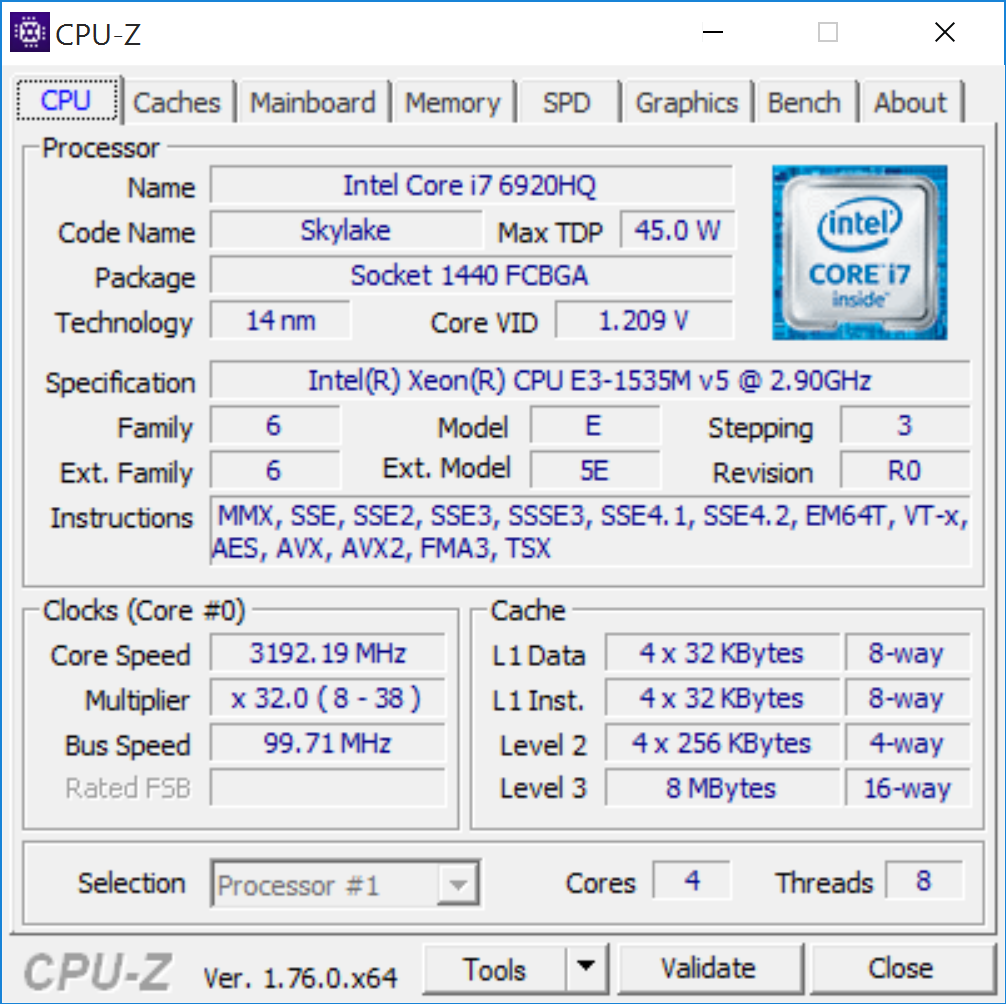
| Dell Precision 7510 (4K IGZO) Quadro M2000M, E3-1535M v5, Samsung SSD SM951a 512GB M.2 PCIe 3.0 x4 NVMe (MZVKV512) | HP ZBook 15 G3 Quadro M2000M, E3-1505M v5, Samsung SM951 MZVPV512HDGL m.2 PCI-e | MSI WS60-6QJE316H11 Quadro M2000M, E3-1505M v5, Toshiba NVMe THNSN5128GP | Lenovo ThinkPad P50s-20FKS00400 Quadro M500M, 6500U, Samsung PM871 MZYLN256HCHP | Lenovo ThinkPad P50 Quadro M2000M, 6820HQ, Samsung SSD PM871 MZNLN256HCHP | Dell Precision 5510 Quadro M1000M, E3-1505M v5, SK hynix SC920 512 GB | |
|---|---|---|---|---|---|---|
| Noise | -5% | -17% | 5% | 5% | -1% | |
| off / environment * | 28.2 | 30 -6% | ||||
| Idle Minimum * | 29.8 | 30 -1% | 37.2 -25% | 30 -1% | 30 -1% | 30 -1% |
| Idle Average * | 29.8 | 30 -1% | 37.2 -25% | 30 -1% | 30 -1% | 30 -1% |
| Idle Maximum * | 31.2 | 30 4% | 37.2 -19% | 30 4% | 30 4% | 30 4% |
| Load Average * | 37.2 | 45.3 -22% | 42.1 -13% | 33.5 10% | 34.5 7% | 42.08 -13% |
| Load Maximum * | 49.4 | 49.7 -1% | 50.7 -3% | 41.9 15% | 42.1 15% | 46.78 5% |
* ... smaller is better
Barulho
| Ocioso |
| 29.8 / 29.8 / 31.2 dB |
| Carga |
| 37.2 / 49.4 dB |
 | ||
30 dB silencioso 40 dB(A) audível 50 dB(A) ruidosamente alto |
||
min: | ||
(±) The maximum temperature on the upper side is 43 °C / 109 F, compared to the average of 38.1 °C / 101 F, ranging from 22.2 to 69.8 °C for the class Workstation.
(±) The bottom heats up to a maximum of 41.2 °C / 106 F, compared to the average of 41.3 °C / 106 F
(+) In idle usage, the average temperature for the upper side is 26.7 °C / 80 F, compared to the device average of 32 °C / 90 F.
(+) The palmrests and touchpad are cooler than skin temperature with a maximum of 24.8 °C / 76.6 F and are therefore cool to the touch.
(+) The average temperature of the palmrest area of similar devices was 27.8 °C / 82 F (+3 °C / 5.4 F).
| Dell Precision 7510 (4K IGZO) Quadro M2000M, E3-1535M v5, Samsung SSD SM951a 512GB M.2 PCIe 3.0 x4 NVMe (MZVKV512) | HP ZBook 15 G3 Quadro M2000M, E3-1505M v5, Samsung SM951 MZVPV512HDGL m.2 PCI-e | MSI WS60-6QJE316H11 Quadro M2000M, E3-1505M v5, Toshiba NVMe THNSN5128GP | Lenovo ThinkPad P50s-20FKS00400 Quadro M500M, 6500U, Samsung PM871 MZYLN256HCHP | Lenovo ThinkPad P50 Quadro M2000M, 6820HQ, Samsung SSD PM871 MZNLN256HCHP | Dell Precision 5510 Quadro M1000M, E3-1505M v5, SK hynix SC920 512 GB | |
|---|---|---|---|---|---|---|
| Power Consumption | 43% | 5% | 66% | 51% | 36% | |
| Idle Minimum * | 23.9 | 5.7 76% | 18.8 21% | 4.3 82% | 5.6 77% | 8.6 64% |
| Idle Average * | 28.9 | 12.2 58% | 29.6 -2% | 9.7 66% | 8.6 70% | 16.2 44% |
| Idle Maximum * | 30 | 12.6 58% | 30.3 -1% | 10.2 66% | 9.3 69% | 16.7 44% |
| Load Average * | 95.2 | 83.1 13% | 90.4 5% | 45.7 52% | 89.5 6% | 82.6 13% |
| Load Maximum * | 157.1 | 138.2 12% | 150.2 4% | 55.8 64% | 105 33% | 131.8 16% |
* ... smaller is better
| desligado | |
| Ocioso | |
| Carga |
|
| Dell Precision 7510 (4K IGZO) Quadro M2000M, E3-1535M v5, Samsung SSD SM951a 512GB M.2 PCIe 3.0 x4 NVMe (MZVKV512) | HP ZBook 15 G3 Quadro M2000M, E3-1505M v5, Samsung SM951 MZVPV512HDGL m.2 PCI-e | MSI WS60-6QJE316H11 Quadro M2000M, E3-1505M v5, Toshiba NVMe THNSN5128GP | Lenovo ThinkPad P50s-20FKS00400 Quadro M500M, 6500U, Samsung PM871 MZYLN256HCHP | Lenovo ThinkPad P50 Quadro M2000M, 6820HQ, Samsung SSD PM871 MZNLN256HCHP | Dell Precision 5510 Quadro M1000M, E3-1505M v5, SK hynix SC920 512 GB | |
|---|---|---|---|---|---|---|
| Battery Runtime | 109% | -41% | 156% | 130% | 45% | |
| Reader / Idle | 268 | 822 207% | 160 -40% | 1107 313% | 860 221% | 428 60% |
| WiFi v1.3 | 239 | 386 62% | 106 -56% | 408 71% | 498 108% | 286 20% |
| Load | 70 | 110 57% | 51 -27% | 129 84% | 113 61% | 109 56% |
| WiFi | 298 |
Pro
Contra
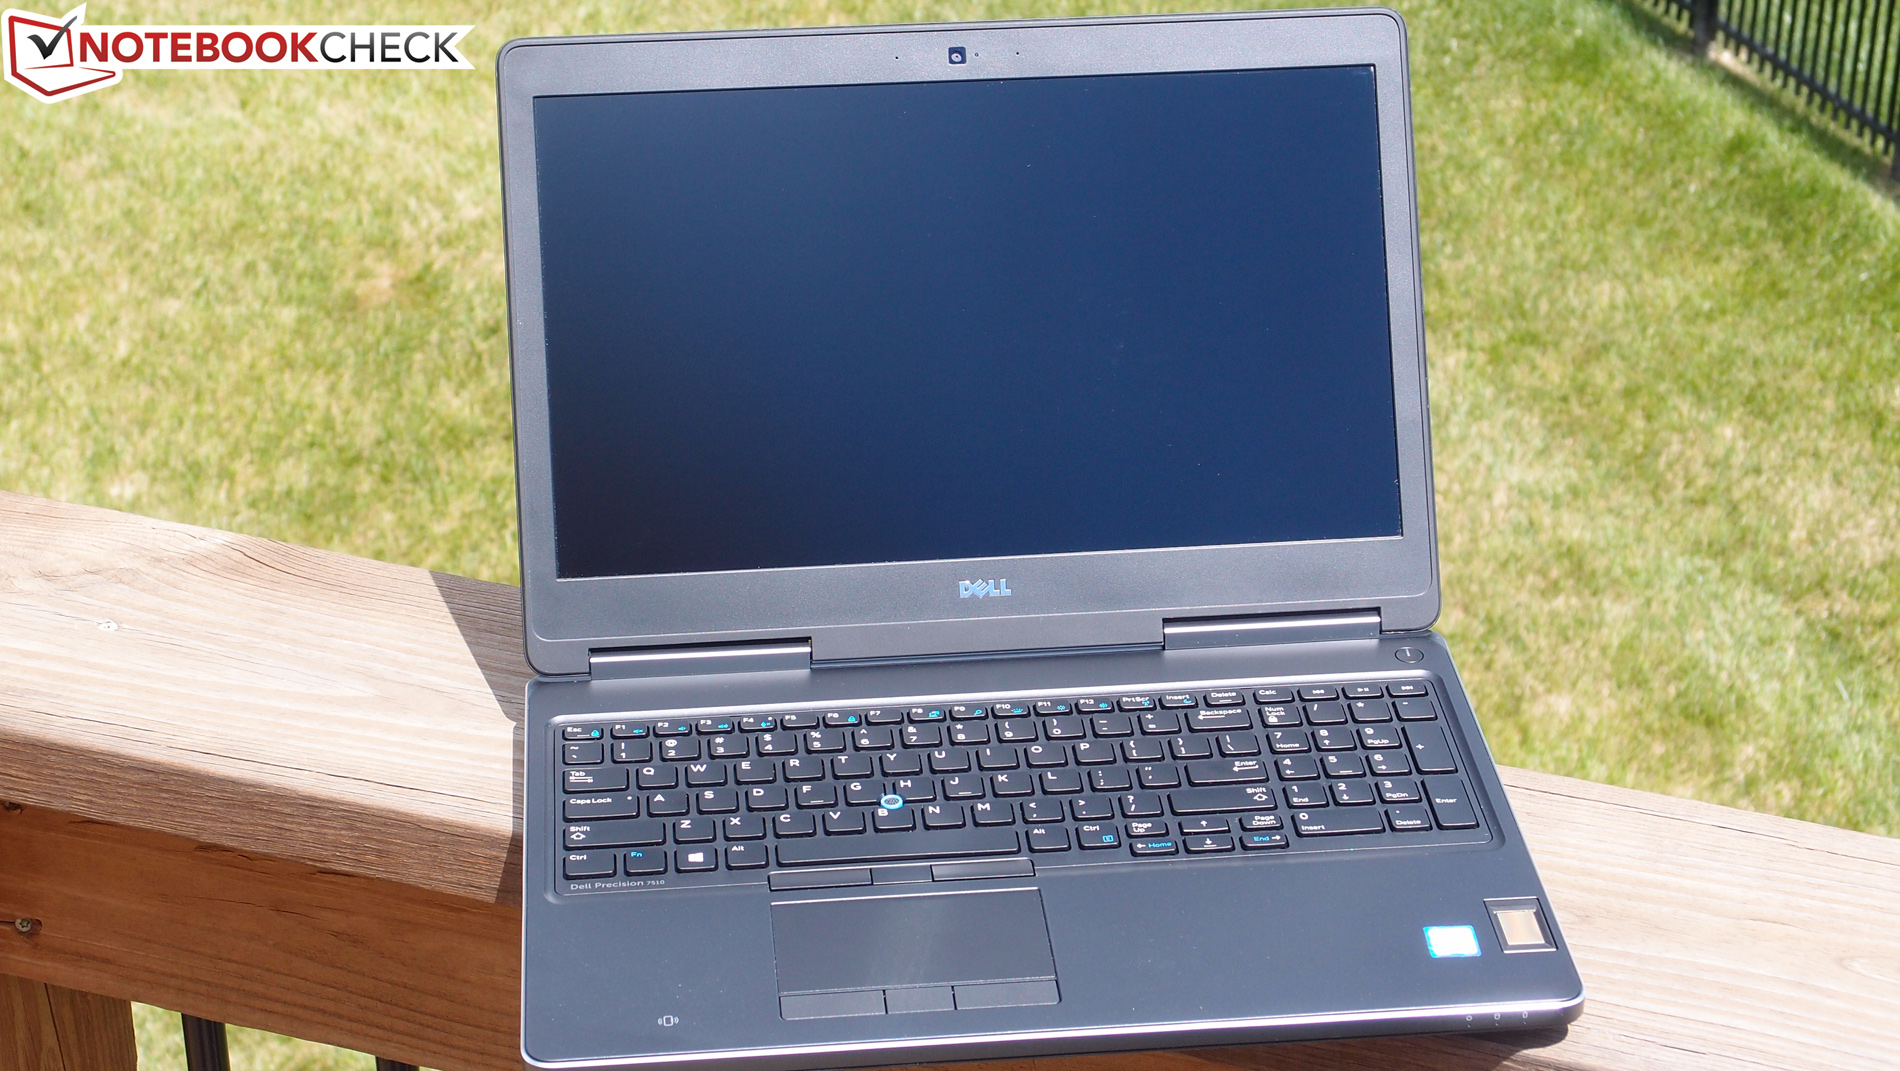
A busca pelo workstation móvel perfeito de 15,6 polegadas não é fácil; quase toda máquina nesta categoria leva consigo pelo menos uma ou duas falhas significantes. Embora o Precision 7510 não seja a exceção a esta tendência, parece sofrer a desvantagem mais prática — e menos debilitante — de todas as máquinas que avaliamos.
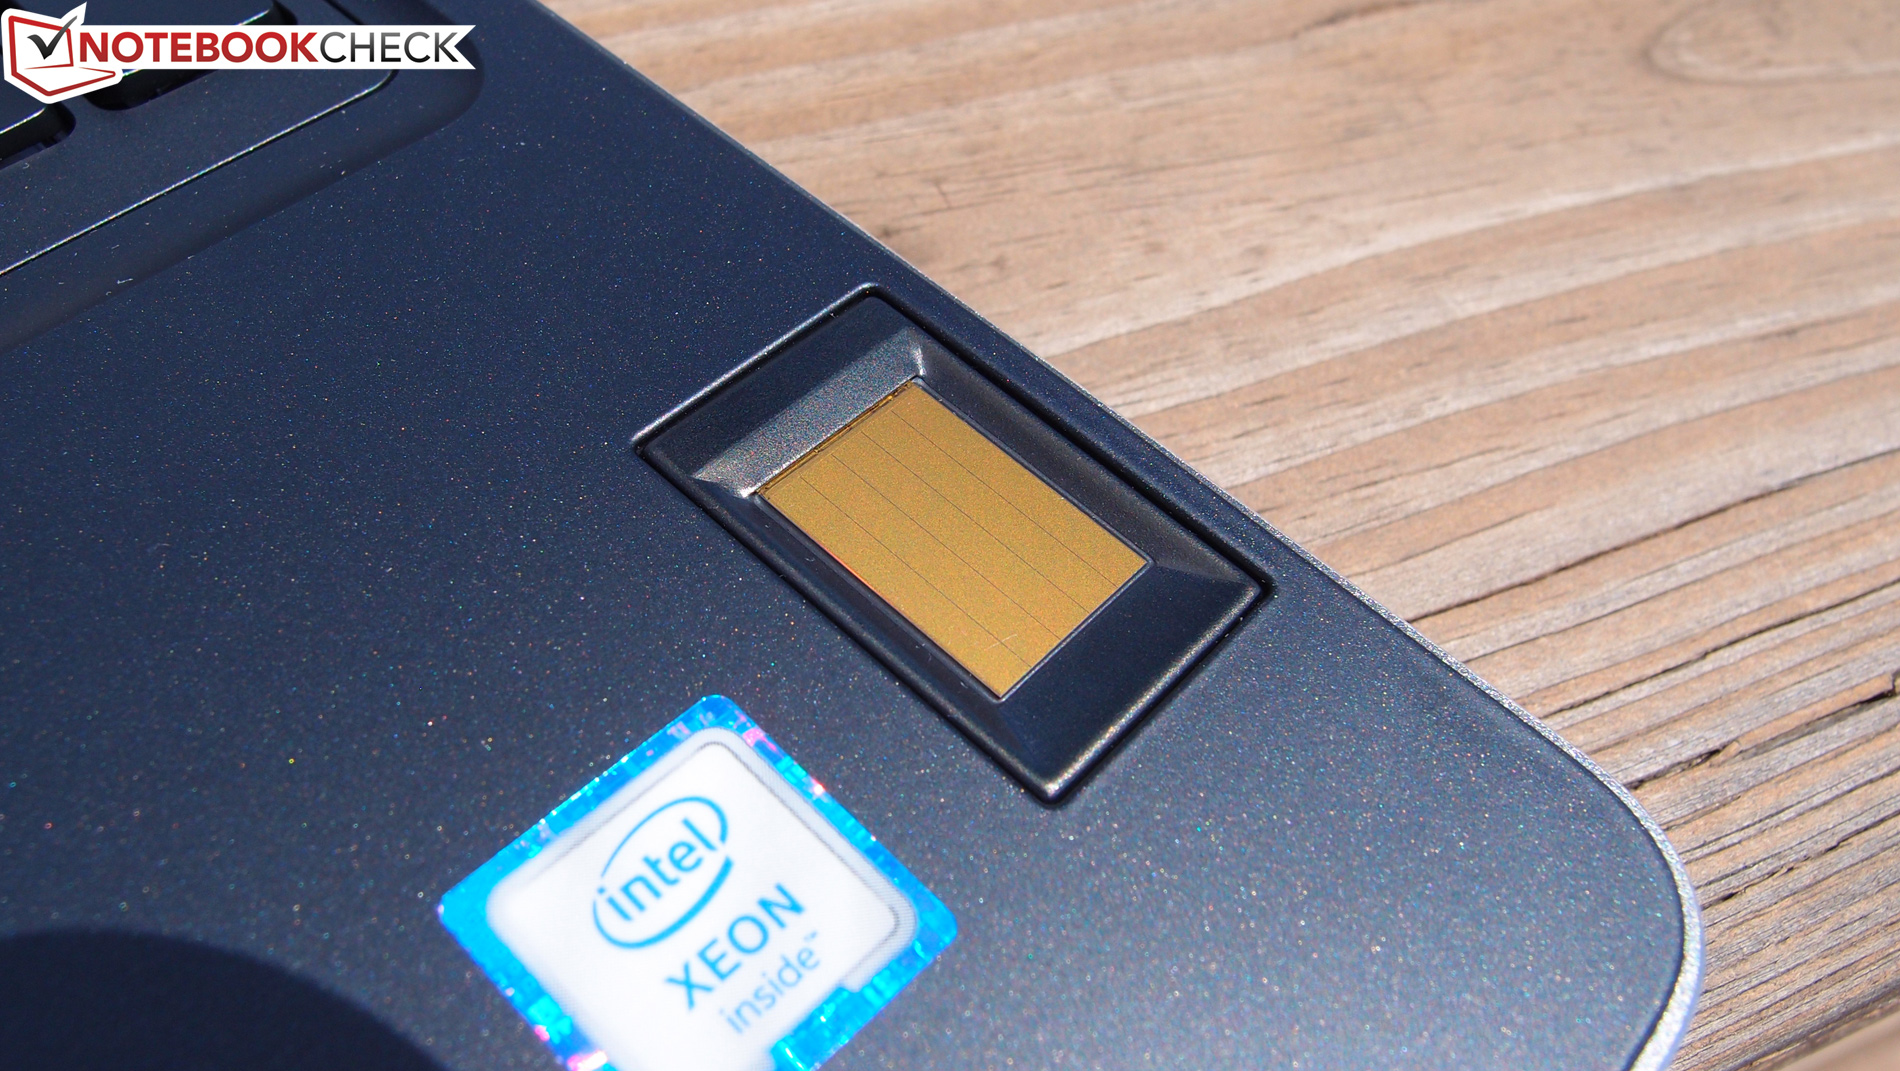
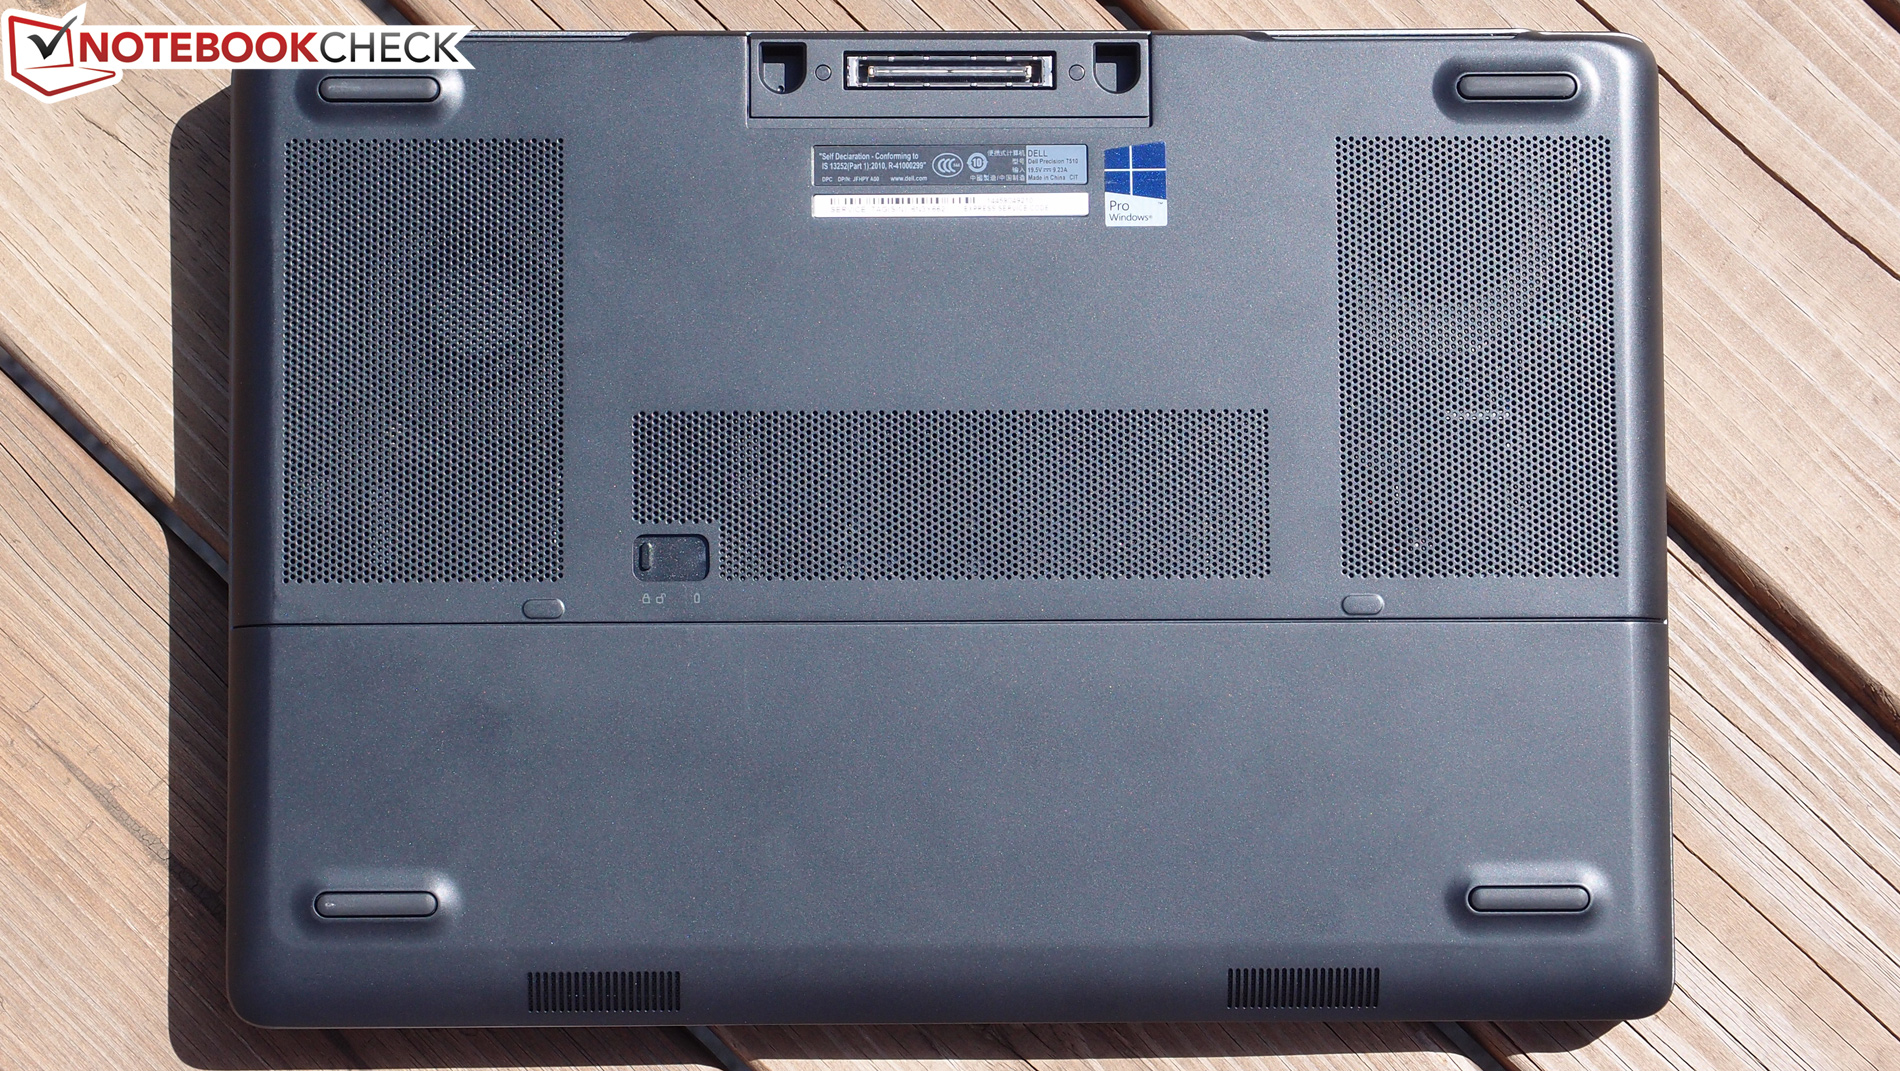
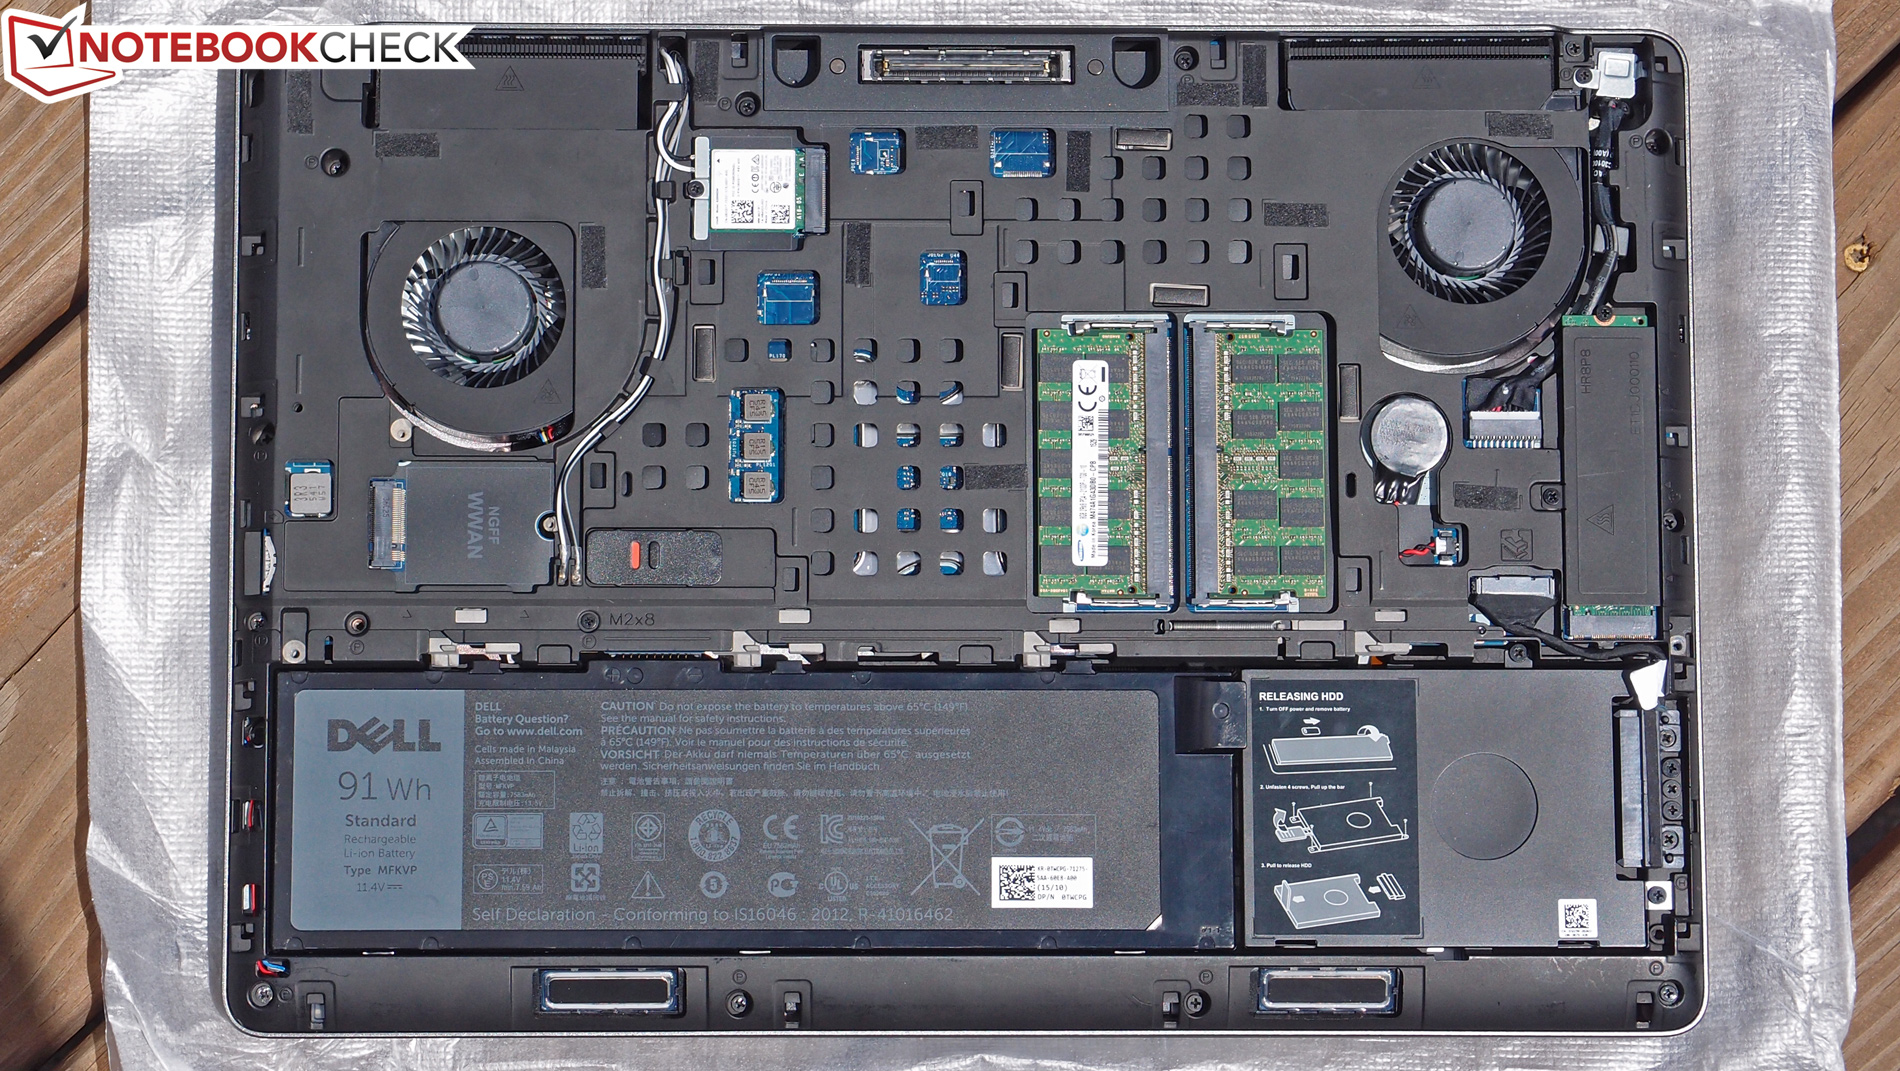
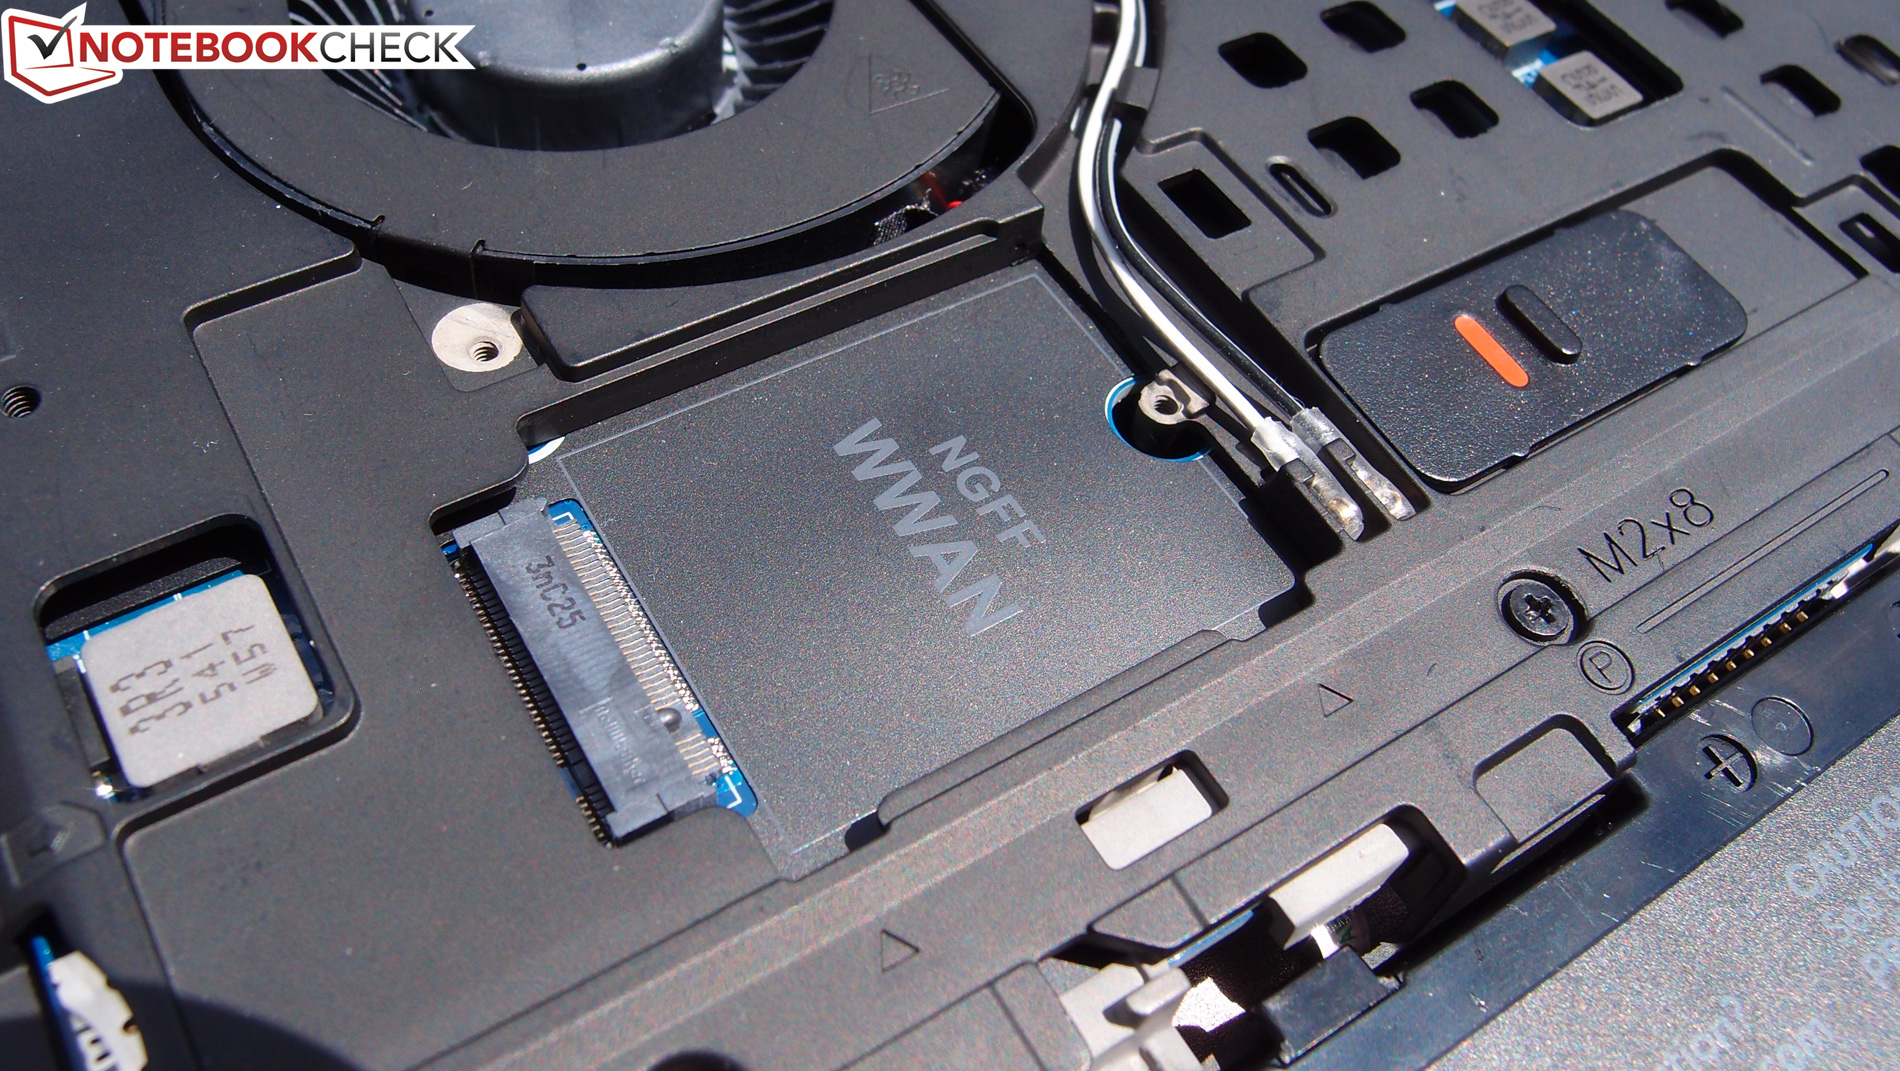
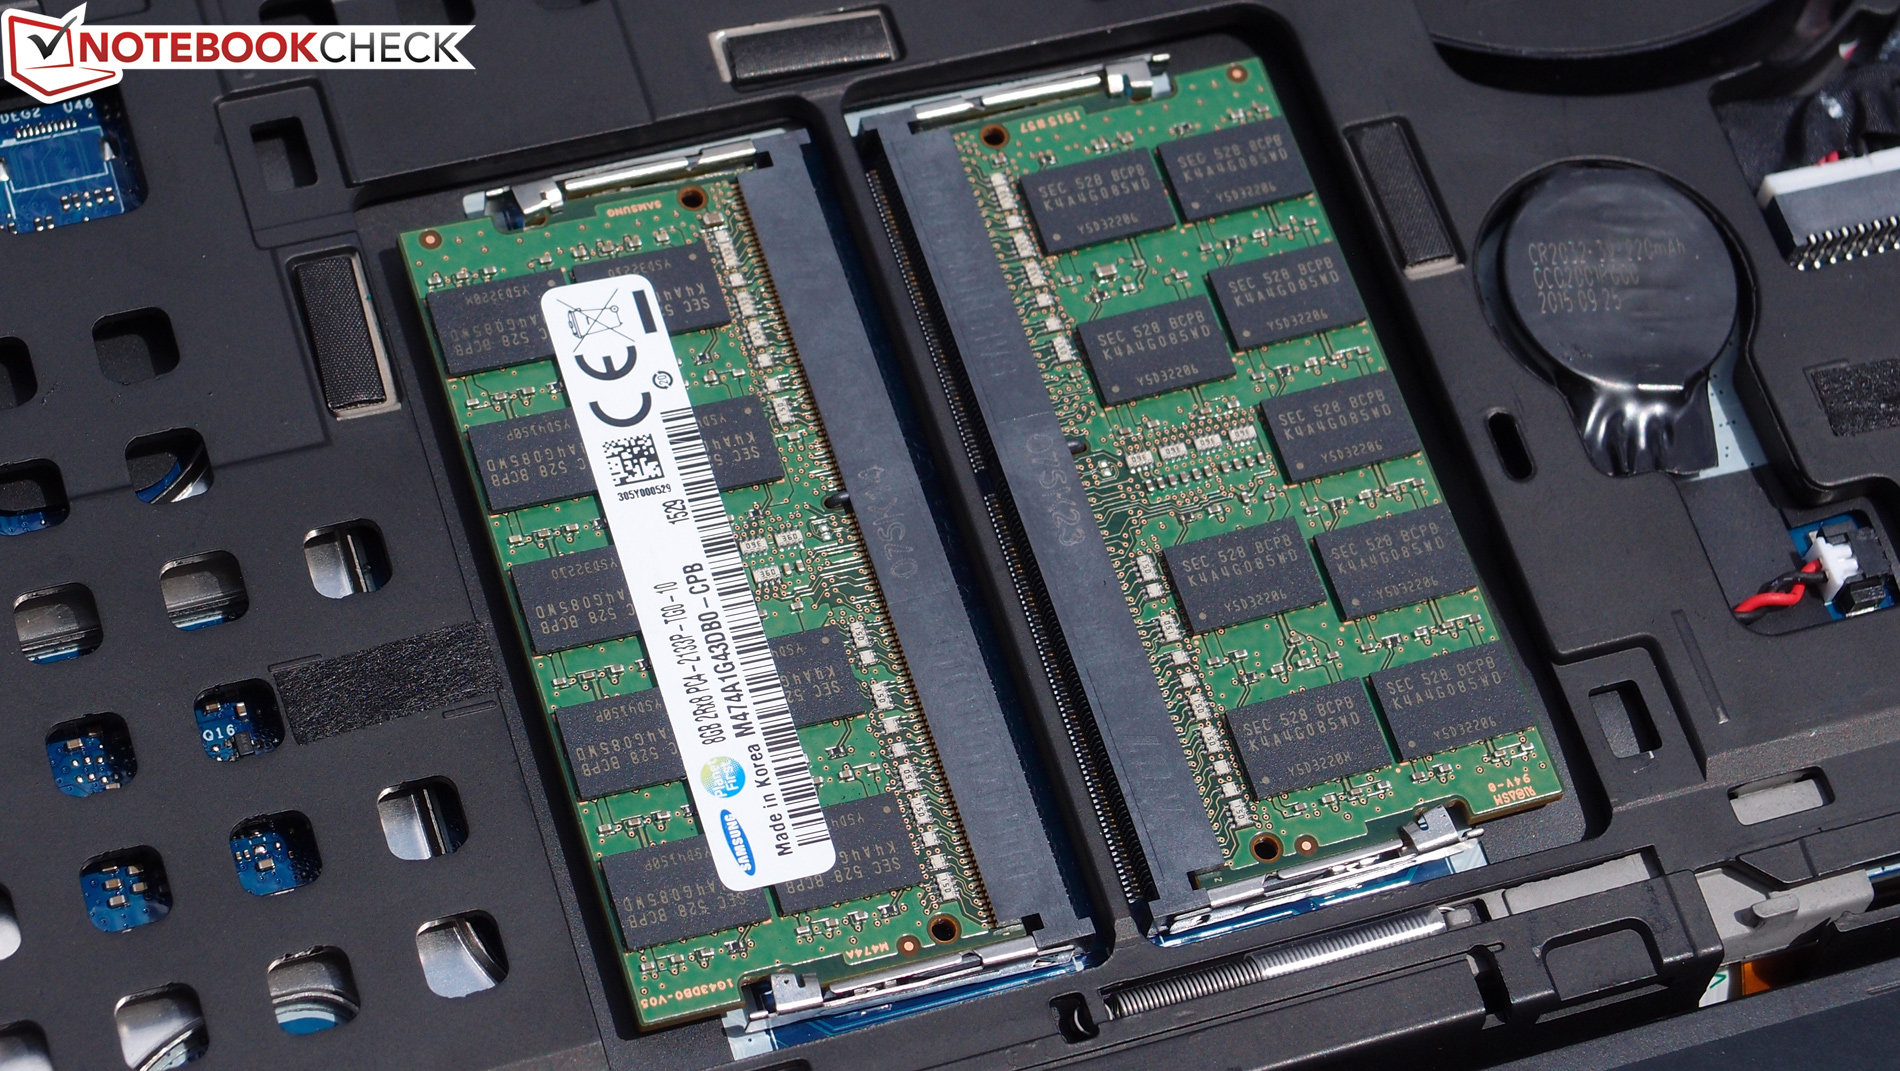
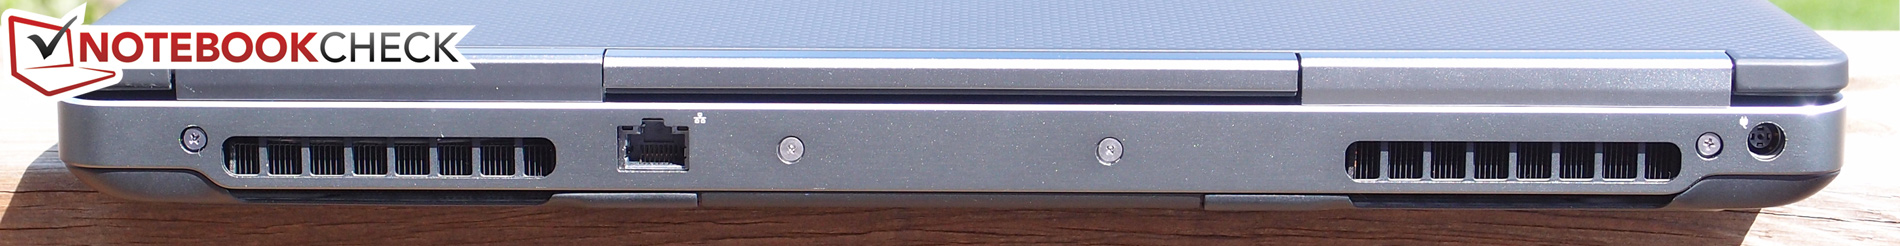
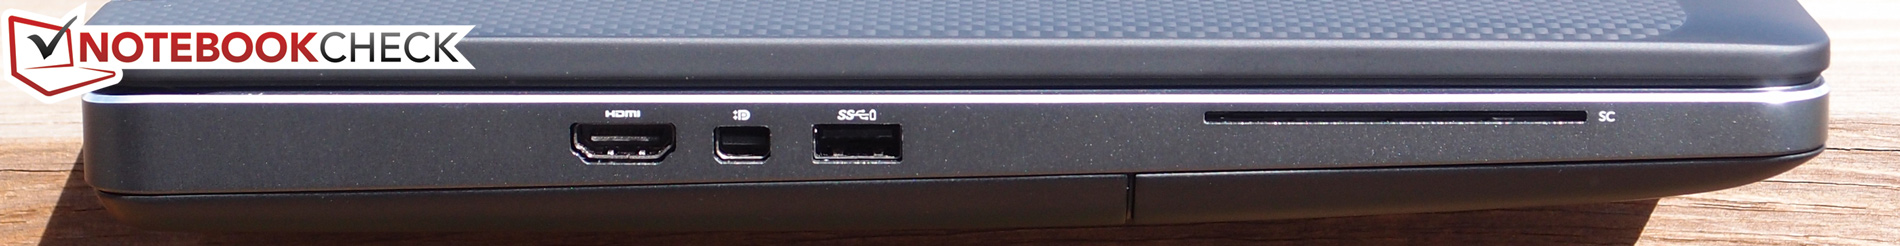
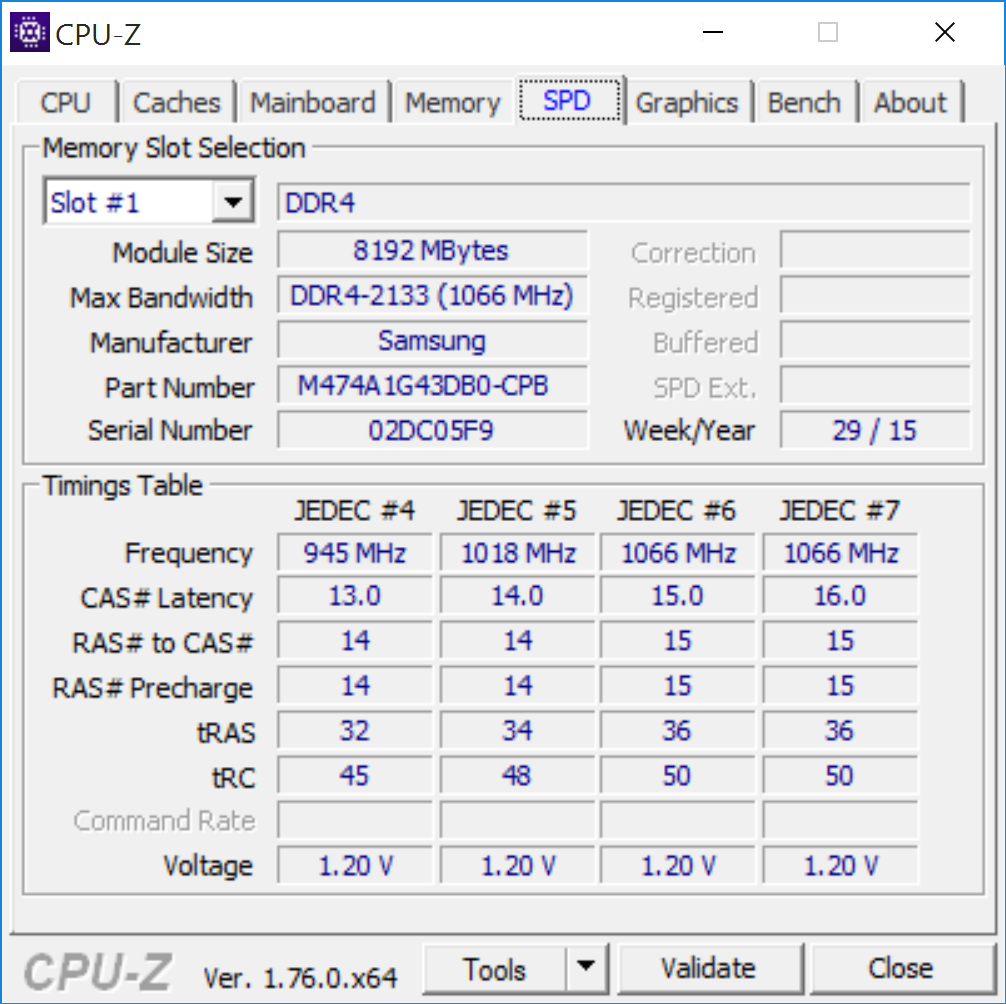
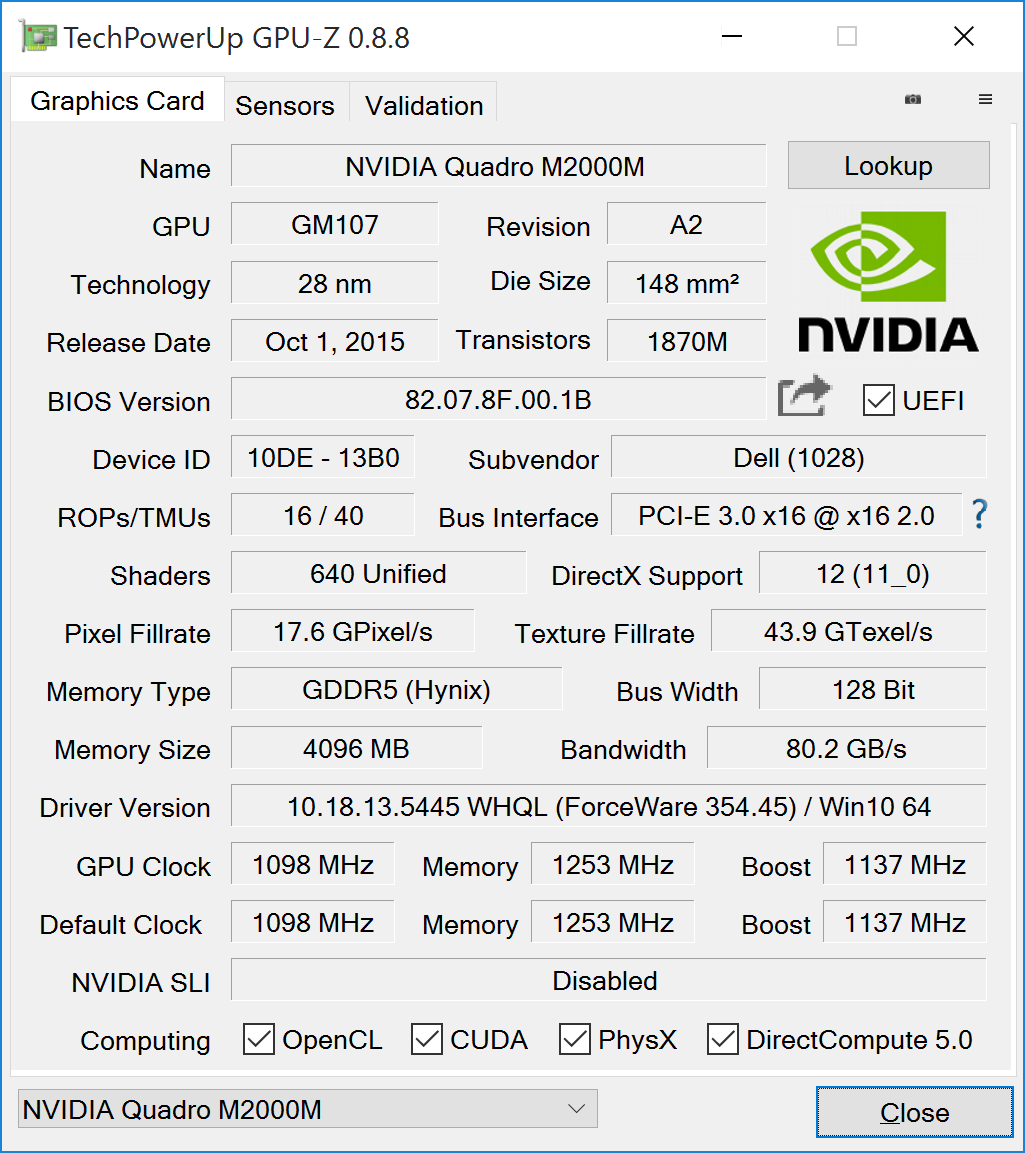
Primeiro, o bom: o 7510 traz uma evolução bem planejada (conservadora) do design da carcaça do M4800 sem sucumbir a qualquer compromisso significante. A seleção de portas ainda é boa, e a estabilidade da carcaça (incluindo dobradiças, rigidez, e durabilidade percebida) parece ser forte, embora a tampa da tela mostre mais fragilidade quando flexionada. A manutenção é também fácil, com quase todos os principais componentes acessíveis através do painel de acesso inferior. O desempenho é top de linha sob quase qualquer circunstância, com excelentes velocidades da CPU disponíveis, sem importar a fonte de alimentação, uma GPU de gama média profissional com controladores sólidos como rocha, e excelentes velocidades de armazenamento —ou seja, uma vez que a interface AHCI é habilitada no firmware. Tudo isto é conseguido por térmicos razoáveis e níveis de ruído geralmente discretos sob quase qualquer tipo de uso. Enquanto isso, a tela 4K fornece contraste forte, excelente gama, e boa precisão das cores (calibrado de fábrica), embora o brilho seja um pouco baixo.
Então, onde estão os compromissos que se anunciava? Primeiramente, no campo da duração da bateria, onde, inclusive equipado com uma massiva bateria de 91 Wh, o Precision 7510 supera quase todas as outras máquinas em sua classe. Outros pontos negativos que devem ser notados, são o afogamento da GPU sob uso combinado da CPU + GPU, e os alto falantes ruins. E finalmente, o processo de mudar de RAID para AHCI para libertar todo o poder de desempenho do SSD NVMe é, infelizmente, complexo— mas a maioria dos usuários provavelmente optará por fazer isso, graças aos consideráveis benefícios.
Em vista de suas imperfeições, o Precision 7510 parece sofrer a desvantagem mais prática — e menos debilitante — de todas as máquinas que avaliamos.
A $3.267 (configurado como tal), não é uma decisão pequena — mas para aqueles à procura de um potente workstation móvel entre o escritório e casa, a mais recente revisão do aparelho de 15, 6 polegadas da Dell vai para a lista de desejos.
Esta é uma versão reduzida da análise original. Você pode ler a análise completa em inglês aqui.
Dell Precision 7510 (4K IGZO)
-
06/19/2016 v5.1(old)
Steve Schardein
Pricecompare
