 Deutsch
 English
 Español
 Français
 Italiano
 Nederlands
 Polski
 Português
 Русский
 Türkçe
 Svenska
 Chinese
 Magyar
Breve análise do Portátil MSI GL62M 7RD-077

| SD Card Reader | |
| average JPG Copy Test (av. of 3 runs) | |
| HP Omen 15-ax007ng | |
| Asus Strix GL502VM-FY039T | |
| MSI GL62M 7RD-077 | |
| MSI GL62-6QFi781H11 | |
| Acer Aspire VX5-591G-D0DD | |
| maximum AS SSD Seq Read Test (1GB) | |
| HP Omen 15-ax007ng | |
| Asus Strix GL502VM-FY039T | |
| Acer Aspire VX5-591G-D0DD | |
| MSI GL62M 7RD-077 | |
| MSI GL62-6QFi781H11 | |
| Networking | |
| iperf3 transmit AX12 | |
| Acer Aspire VX5-591G-D0DD | |
| Asus Strix GL502VM-FY039T | |
| MSI GL62M 7RD-077 (jseb) | |
| iperf3 receive AX12 | |
| Asus Strix GL502VM-FY039T | |
| Acer Aspire VX5-591G-D0DD | |
| MSI GL62M 7RD-077 (jseb) | |
| |||||||||||||||||||||||||
iluminação: 79 %
iluminação com acumulador: 256 cd/m²
Contraste: 478:1 (Preto: 0.54 cd/m²)
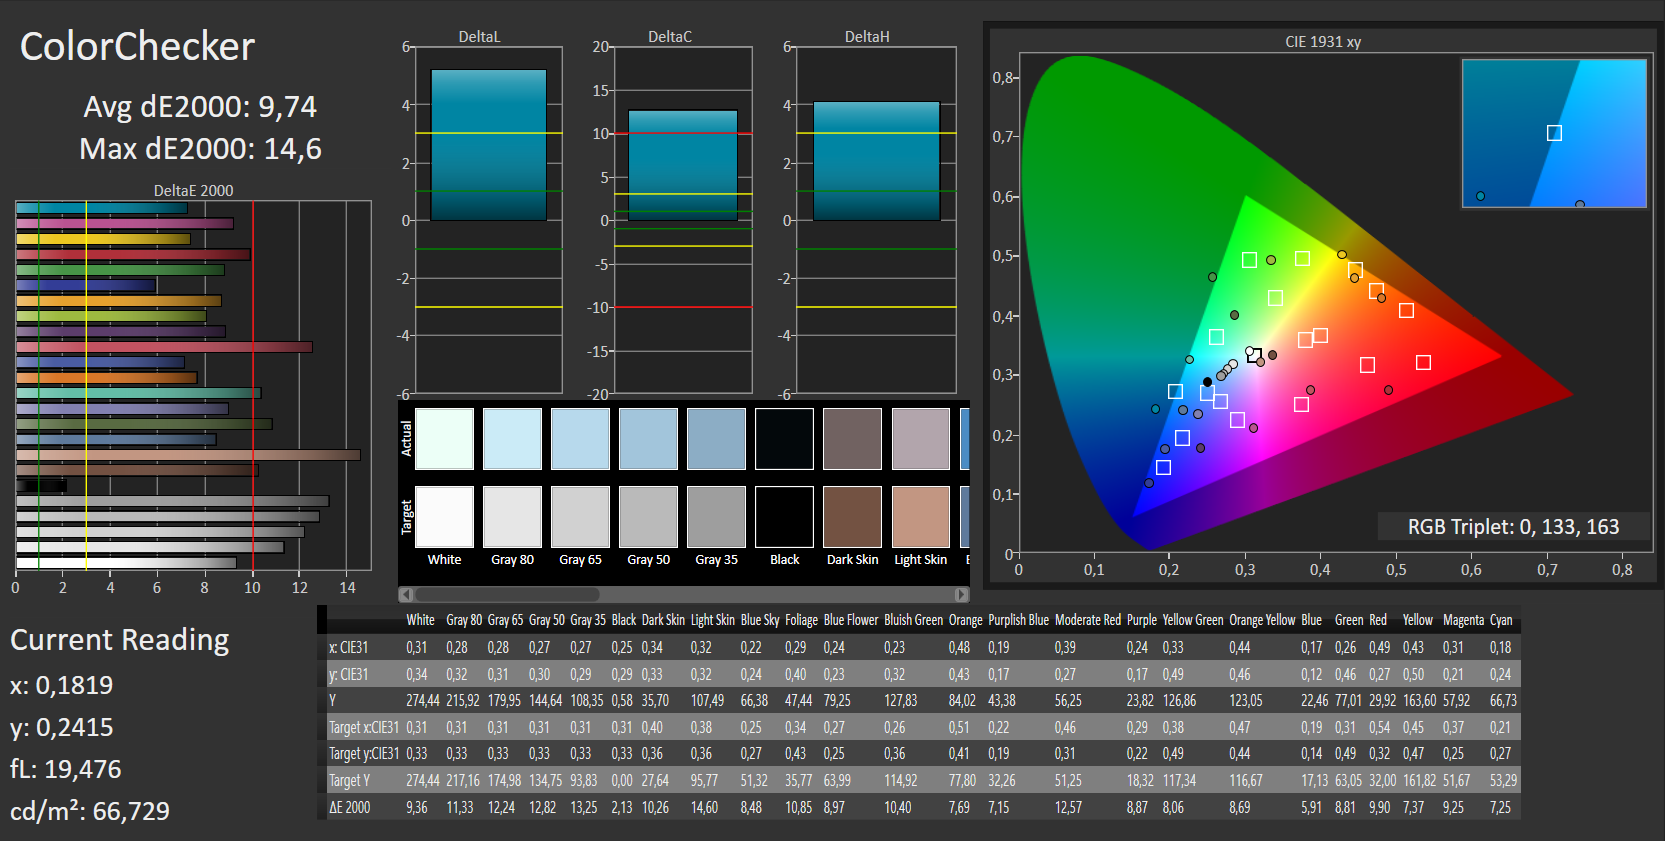
ΔE Color 9.74 | 0.5-29.43 Ø5
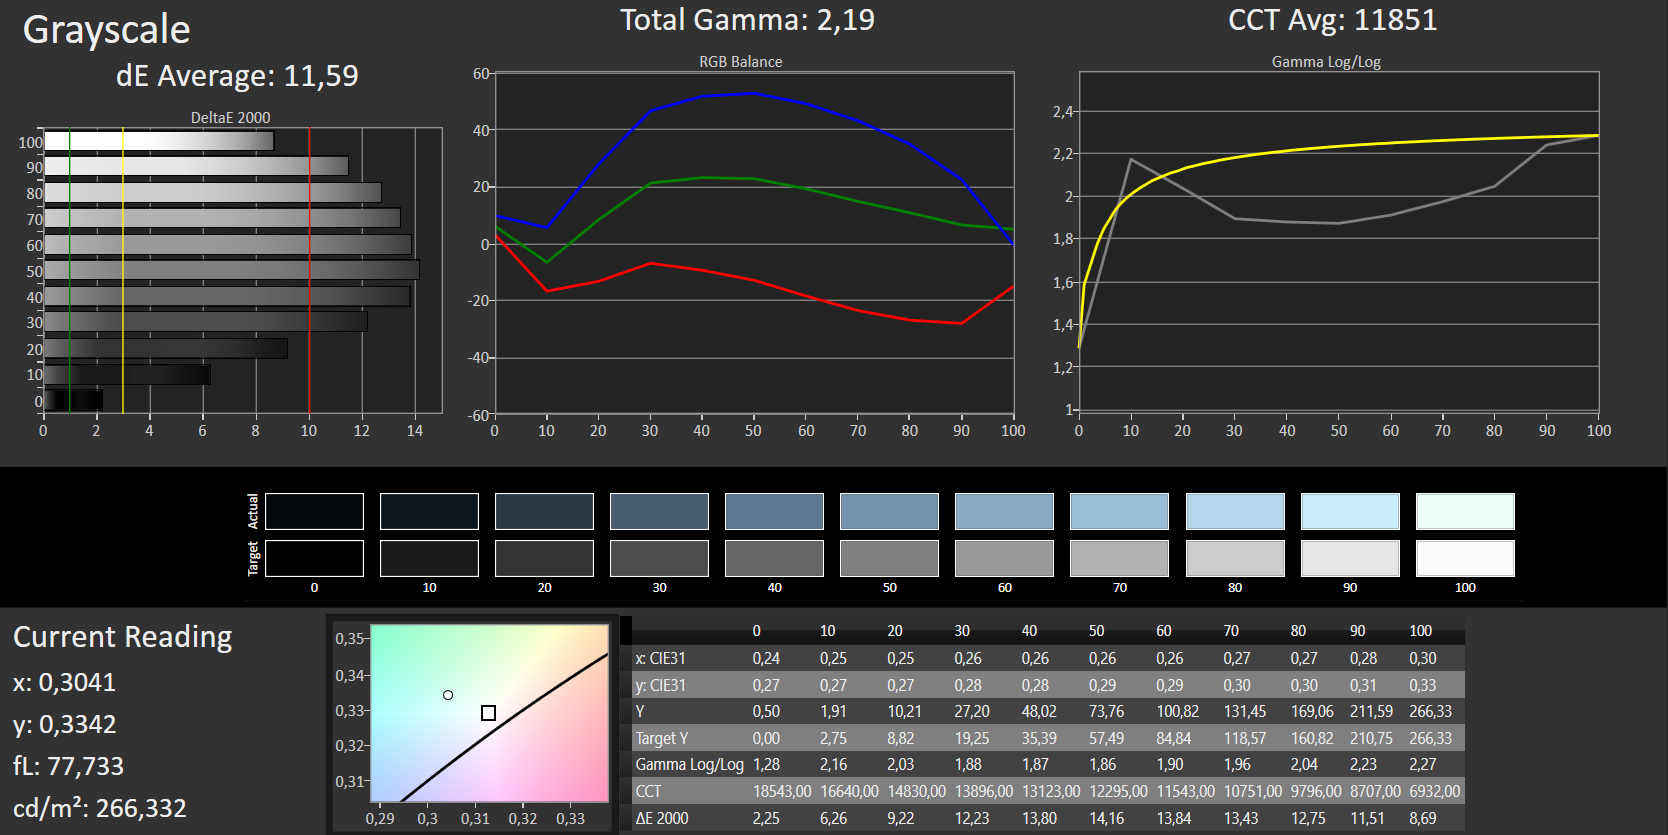
ΔE Greyscale 11.59 | 0.57-98 Ø5.3
100% sRGB (Argyll 1.6.3 3D)
76% AdobeRGB 1998 (Argyll 1.6.3 3D)
83.8% AdobeRGB 1998 (Argyll 2.2.0 3D)
100% sRGB (Argyll 2.2.0 3D)
85.4% Display P3 (Argyll 2.2.0 3D)
Gamma: 2.19
| MSI GL62M 7RD-077 TN LED, 1920x1080, 15.60 | MSI GL62-6QFi781H11 TN LED, 1920x1080, 15.60 | Asus Strix GL502VM-FY039T IPS, 1920x1080, 15.60 | HP Omen 15-ax007ng IPS, 1920x1080, 15.60 | |
|---|---|---|---|---|
| Display | 0% | -23% | -36% | |
| Display P3 Coverage | 85.4 | 85.8 0% | 64.5 -24% | 59.9 -30% 40.34 -53% |
| sRGB Coverage | 100 | 99.8 0% | 83.4 -17% | 85.9 -14% 60.3 -40% |
| AdobeRGB 1998 Coverage | 83.8 | 84.1 0% | 60.9 -27% | 61.6 -26% 41.73 -50% |
| Response Times | 143% | 12% | -16% | |
| Response Time Grey 50% / Grey 80% * | 44 ? | 43 ? 2% | 40 ? 9% | 55 ? -25% |
| Response Time Black / White * | 29 ? | 23 ? 21% | 25 ? 14% | 31 ? -7% |
| PWM Frequency | 198 ? | 1000 ? 405% | ||
| Screen | -3% | 32% | 9% | |
| Brightness middle | 258 | 216 -16% | 321 24% | 214 -17% |
| Brightness | 234 | 202 -14% | 296 26% | 203 -13% |
| Brightness Distribution | 79 | 83 5% | 88 11% | 79 0% |
| Black Level * | 0.54 | 0.48 11% | 0.33 39% | 0.28 48% |
| Contrast | 478 | 450 -6% | 973 104% | 764 60% |
| Colorchecker dE 2000 * | 9.74 | 9.98 -2% | 4.42 55% | 6.04 38% |
| Colorchecker dE 2000 max. * | 14.6 | 17.12 -17% | 9.78 33% | 12 18% |
| Greyscale dE 2000 * | 11.59 | 10.91 6% | 3.34 71% | 5.91 49% |
| Gamma | 2.19 100% | 2.31 95% | 2.4 92% | 2.44 90% |
| CCT | 11851 55% | 13185 49% | 6213 105% | 7362 88% |
| Color Space (Percent of AdobeRGB 1998) | 76 | 75 -1% | 55 -28% | 38 -50% |
| Color Space (Percent of sRGB) | 100 | 100 0% | 83 -17% | 60 -40% |
| Total Average (Program / Settings) | 47% /
25% | 7% /
18% | -14% /
-8% |
* ... smaller is better
Screen Flickering / PWM (Pulse-Width Modulation)
| Screen flickering / PWM detected | 198 Hz | ≤ 90 % brightness setting | 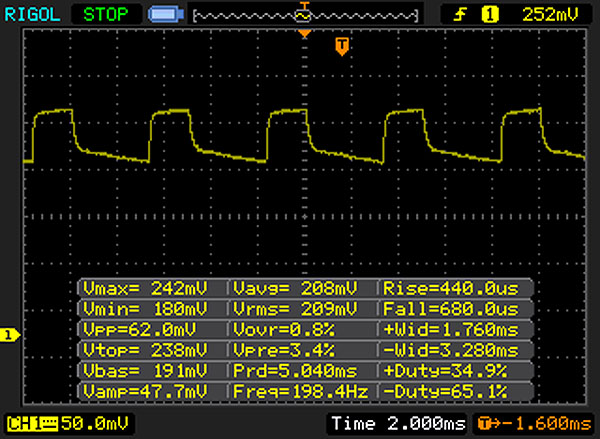 |
The display backlight flickers at 198 Hz (worst case, e.g., utilizing PWM) Flickering detected at a brightness setting of 90 % and below. There should be no flickering or PWM above this brightness setting. The frequency of 198 Hz is relatively low, so sensitive users will likely notice flickering and experience eyestrain at the stated brightness setting and below. In comparison: 53 % of all tested devices do not use PWM to dim the display. If PWM was detected, an average of 17915 (minimum: 5 - maximum: 3846000) Hz was measured. | |||
Display Response Times
| ↔ Response Time Black to White | ||
|---|---|---|
| 29 ms ... rise ↗ and fall ↘ combined | ↗ 12 ms rise | 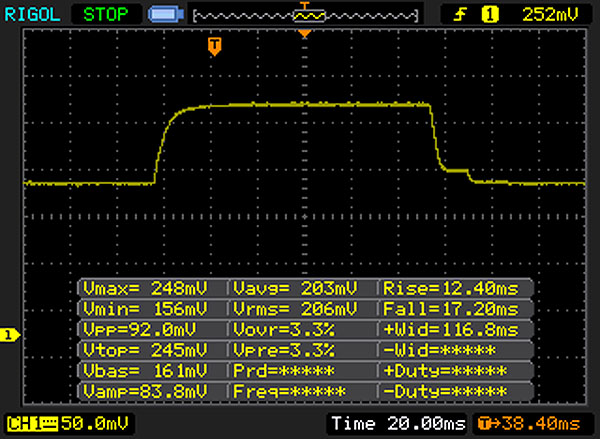 |
| ↘ 17 ms fall | ||
| The screen shows relatively slow response rates in our tests and may be too slow for gamers. In comparison, all tested devices range from 0.1 (minimum) to 240 (maximum) ms. » 73 % of all devices are better. This means that the measured response time is worse than the average of all tested devices (21.5 ms). | ||
| ↔ Response Time 50% Grey to 80% Grey | ||
| 44 ms ... rise ↗ and fall ↘ combined | ↗ 24 ms rise | 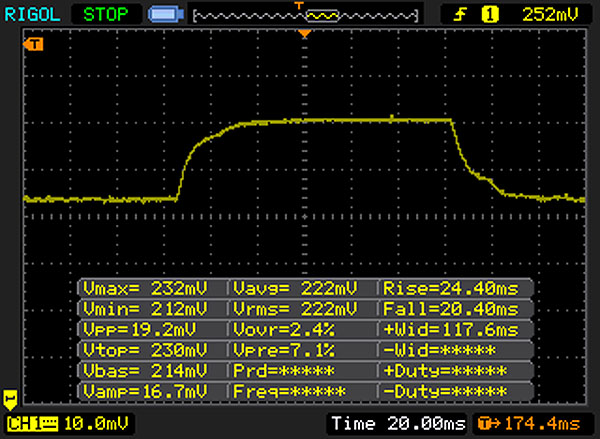 |
| ↘ 20 ms fall | ||
| The screen shows slow response rates in our tests and will be unsatisfactory for gamers. In comparison, all tested devices range from 0.2 (minimum) to 636 (maximum) ms. » 69 % of all devices are better. This means that the measured response time is worse than the average of all tested devices (33.7 ms). | ||
| Cinebench R11.5 | |
| CPU Multi 64Bit | |
| MSI GL62M 7RD-077 | |
| Asus Strix GL753VD-GC045T | |
| Gigabyte P57X v7 | |
| Asus Strix GL502VM-FY039T | |
| MSI GL62-6QFi781H11 | |
| HP Omen 15-ax007ng | |
| Acer Aspire V15 Nitro BE VN7-592G-79DV | |
| CPU Single 64Bit | |
| Asus Strix GL753VD-GC045T | |
| Gigabyte P57X v7 | |
| HP Omen 15-ax007ng | |
| Asus Strix GL502VM-FY039T | |
| MSI GL62M 7RD-077 | |
| Acer Aspire V15 Nitro BE VN7-592G-79DV | |
| MSI GL62-6QFi781H11 | |
| Cinebench R10 | |
| Rendering Multiple CPUs 32Bit | |
| MSI GL62M 7RD-077 | |
| Asus Strix GL502VM-FY039T | |
| Acer Aspire V15 Nitro BE VN7-592G-79DV | |
| Rendering Single 32Bit | |
| MSI GL62M 7RD-077 | |
| Asus Strix GL502VM-FY039T | |
| Acer Aspire V15 Nitro BE VN7-592G-79DV | |
| Geekbench 3 | |
| 32 Bit Single-Core Score | |
| Asus Strix GL502VM-FY039T | |
| Acer Aspire V15 Nitro BE VN7-592G-79DV | |
| MSI GL62M 7RD-077 | |
| 32 Bit Multi-Core Score | |
| MSI GL62M 7RD-077 | |
| Acer Aspire V15 Nitro BE VN7-592G-79DV | |
| Asus Strix GL502VM-FY039T | |
| Geekbench 4.0 | |
| 64 Bit Single-Core Score | |
| Asus Strix GL502VM-FY039T | |
| MSI GL62M 7RD-077 | |
| 64 Bit Multi-Core Score | |
| Asus Strix GL502VM-FY039T | |
| MSI GL62M 7RD-077 | |
| JetStream 1.1 - Total Score | |
| MSI GL62M 7RD-077 | |
| Asus Strix GL502VM-FY039T | |
| Acer Aspire V15 Nitro BE VN7-592G-79DV | |
| Octane V2 - Total Score | |
| MSI GL62M 7RD-077 | |
| Asus Strix GL502VM-FY039T | |
| Acer Aspire V15 Nitro BE VN7-592G-79DV | |
| Mozilla Kraken 1.1 - Total | |
| Acer Aspire V15 Nitro BE VN7-592G-79DV | |
| MSI GL62M 7RD-077 | |
| Asus Strix GL502VM-FY039T | |
* ... smaller is better
| PCMark 7 Score | 3818 pontos | |
| PCMark 8 Home Score Accelerated v2 | 3899 pontos | |
| PCMark 8 Creative Score Accelerated v2 | 4679 pontos | |
| PCMark 8 Work Score Accelerated v2 | 4831 pontos | |
Ajuda | ||
| PCMark 8 | |
| Home Score Accelerated v2 | |
| Asus Strix GL502VM-FY039T | |
| Asus Strix GL753VD-GC045T | |
| HP Omen 15-ax007ng | |
| MSI GL62M 7RD-077 | |
| Acer Aspire VX5-591G-D0DD | |
| MSI GL62-6QFi781H11 | |
| Gigabyte P57X v7 | |
| Acer Aspire V15 Nitro BE VN7-592G-79DV | |
| Work Score Accelerated v2 | |
| Asus Strix GL502VM-FY039T | |
| HP Omen 15-ax007ng | |
| MSI GL62-6QFi781H11 | |
| MSI GL62M 7RD-077 | |
| Gigabyte P57X v7 | |
| Acer Aspire V15 Nitro BE VN7-592G-79DV | |

| MSI GL62M 7RD-077 HGST Travelstar 7K1000 HTS721010A9E630 | MSI GL62-6QFi781H11 Toshiba HG6 THNSNJ128G8NY | Asus Strix GL502VM-FY039T Micron SSD 1100 (MTFDDAV256TBN) | HP Omen 15-ax007ng Adata IM2S3138E-128GM-B | Acer Aspire VX5-591G-D0DD SK Hynix Canvas SC300 512GB M.2 (HFS512G39MND) | |
|---|---|---|---|---|---|
| CrystalDiskMark 3.0 | 6466% | 7690% | 6732% | 8809% | |
| Read Seq | 112.4 | 530 372% | 462.5 311% | 475.7 323% | 494.2 340% |
| Write Seq | 107.3 | 442.7 313% | 462.7 331% | 169.2 58% | 449.6 319% |
| Read 512 | 43.19 | 409.1 847% | 335 676% | 327.6 659% | 348.1 706% |
| Write 512 | 57 | 417.3 632% | 407.1 614% | 169.6 198% | 418.2 634% |
| Read 4k | 0.494 | 21.81 4315% | 25.61 5084% | 33.14 6609% | 16.97 3335% |
| Write 4k | 1.122 | 93 8189% | 86.3 7592% | 81.4 7155% | 38.36 3319% |
| Read 4k QD32 | 1.088 | 257 23521% | 246.7 22575% | 276.8 25341% | 394.9 36196% |
| Write 4k QD32 | 1.234 | 168.3 13539% | 301.5 24333% | 168 13514% | 317.4 25621% |
| 3DMark 06 Standard Score | 28117 pontos | |
| 3DMark Vantage P Result | 26560 pontos | |
| 3DMark 11 Performance | 7980 pontos | |
| 3DMark Ice Storm Standard Score | 73713 pontos | |
| 3DMark Cloud Gate Standard Score | 19877 pontos | |
| 3DMark Fire Strike Score | 5729 pontos | |
| 3DMark Fire Strike Extreme Score | 2743 pontos | |
| 3DMark Time Spy Score | 1897 pontos | |
Ajuda | ||
| 3DMark 11 - 1280x720 Performance GPU | |
| Gigabyte P57X v7 | |
| Asus Strix GL502VM-FY039T | |
| Acer Aspire VX5-591G-D0DD | |
| MSI GL62M 7RD-077 | |
| HP Omen 15-ax007ng | |
| Asus X550IU | |
| Asus Strix GL753VD-GC045T | |
| Apple MacBook Pro 15 2016 (2.9 GHz, 460) | |
| Apple MacBook Pro 15 2016 (2.7 GHz, 455) | |
| Acer Aspire V15 Nitro BE VN7-592G-79DV | |
| MSI GL62-6QFi781H11 | |
| GFXBench (DX / GLBenchmark) 2.7 | |
| 1920x1080 T-Rex Offscreen | |
| MSI GL62M 7RD-077 | |
| Apple MacBook Pro 15 2016 (2.9 GHz, 460) | |
| Apple MacBook Pro 15 2016 (2.7 GHz, 455) | |
| T-Rex Onscreen | |
| MSI GL62M 7RD-077 | |
| Apple MacBook Pro 15 2016 (2.7 GHz, 455) | |
| GFXBench 3.0 | |
| 1920x1080 1080p Manhattan Offscreen | |
| MSI GL62M 7RD-077 | |
| Apple MacBook Pro 15 2016 (2.9 GHz, 460) | |
| Apple MacBook Pro 15 2016 (2.7 GHz, 455) | |
| on screen Manhattan Onscreen OGL | |
| MSI GL62M 7RD-077 | |
| Apple MacBook Pro 15 2016 (2.7 GHz, 455) | |
| GFXBench 3.1 | |
| 1920x1080 Manhattan ES 3.1 Offscreen | |
| MSI GL62M 7RD-077 | |
| on screen Manhattan ES 3.1 Onscreen | |
| MSI GL62M 7RD-077 | |
| GFXBench | |
| 1920x1080 Car Chase Offscreen | |
| MSI GL62M 7RD-077 | |
| on screen Car Chase Onscreen | |
| MSI GL62M 7RD-077 | |
| Geekbench 4.0 - Compute OpenCL Score | |
| MSI GL62M 7RD-077 | |
| Apple MacBook Pro 15 2016 (2.9 GHz, 460) | |
| Apple MacBook Pro 15 2016 (2.7 GHz, 455) | |
| baixo | média | alto | ultra | QHD | 4K | |
| Tomb Raider (2013) | 301.7 | 240.3 | 170.3 | 80.6 | ||
| BioShock Infinite (2013) | 196.6 | 160.4 | 156.2 | 66.2 | ||
| Battlefield 4 (2013) | 150.8 | 135 | 116.8 | 52 | ||
| Thief (2014) | 71.1 | 67.7 | 65.8 | 43.6 | ||
| Middle-earth: Shadow of Mordor (2014) | 156 | 102.7 | 59.4 | 45.3 | ||
| Dragon Age: Inquisition (2014) | 136 | 105 | 44.3 | 29.7 | ||
| Battlefield Hardline (2015) | 91.8 | 89.7 | 79.8 | 52.6 | ||
| GTA V (2015) | 129.4 | 116.9 | 65.9 | 17.9 | ||
| Dirt Rally (2015) | 223.2 | 117.1 | 88.4 | 53 | ||
| Batman: Arkham Knight (2015) | 94 | 84 | 39 | 28 | ||
| Call of Duty: Black Ops 3 (2015) | 119.7 | 73.9 | 52.2 | 49.1 | ||
| Star Wars Battlefront (2015) | 138 | 124.1 | 60.2 | 52.7 | ||
| Just Cause 3 (2015) | 101 | 86.1 | 48 | 45.1 | ||
| Rise of the Tomb Raider (2016) | 115.3 | 70 | 39.5 | 33.7 | ||
| Hitman 2016 (2016) | 58.4 | 57.3 | 42.3 | 41.1 | ||
| Need for Speed 2016 (2016) | 105 | 99.3 | 63.4 | 47.2 | ||
| Ashes of the Singularity (2016) | 50.5 | 34.4 | 29.1 | |||
| Overwatch (2016) | 56 | |||||
| Mirror's Edge Catalyst (2016) | 110.3 | 83.7 | 40.4 | 32.4 | ||
| Deus Ex Mankind Divided (2016) | 74.3 | 59.3 | 32.2 | 14.7 | ||
| Battlefield 1 (2016) | 114.7 | 97.6 | 49.9 | 44.4 | ||
| Civilization VI (2016) | 66.8 | 54.5 | 42.4 | 34.1 | ||
| Titanfall 2 (2016) | 143.1 | 118 | 53.4 | 45.5 | ||
| Resident Evil 7 (2017) | 223.8 | 98.1 | 57.6 | 19.8 | ||
| Ghost Recon Wildlands (2017) | 90.8 | 39.3 | 32.6 | 4.1 | ||
| Mass Effect Andromeda (2017) | 96 | 43.8 | 24.6 | 20.4 | ||
| Rocket League (2017) | 109 | |||||
| Dirt 4 (2017) | 63.7 | 31 | ||||
| Ark Survival Evolved (2017) | 76 | 24.3 | 16.5 | |||
| FIFA 18 (2017) | 132 | 55.6 | ||||
| Fortnite (2018) | 187 | 135 | 51 | 40 | ||
| Final Fantasy XV Benchmark (2018) | 62 | 30.2 | 18.6 | |||
| Kingdom Come: Deliverance (2018) | 93 | 41.6 | 33.3 | 25.1 | ||
| World of Tanks enCore (2018) | 335 | 139 | 49.3 | 32 | 15.5 | |
| The Crew 2 (2018) | 60 | 42.7 | 36.8 | 32.2 | 9.2 | |
| FIFA 19 (2018) | 187 | 129 | 116 | 96 | 35.6 | |
| Apex Legends (2019) | 36.7 | 35.2 | ||||
| Far Cry New Dawn (2019) | 63 | 36 | 36 | 32 | ||
| Metro Exodus (2019) | 45.1 | 18.8 | 14.5 | 12 | ||
| Dirt Rally 2.0 (2019) | 53.1 | 44.8 | 23.9 | |||
| The Division 2 (2019) | 95 | 37.9 | 34.1 | 21.2 | ||
| Total War: Three Kingdoms (2019) | 152 | 56.2 | 31 | 20.5 | ||
| League of Legends (2019) | 157 | 148 | 135 | 146 | 138 | 113 |
| Control (2019) | 80 | 24.4 | 17.4 | |||
| FIFA 20 (2019) | 108 | 65 | 32.6 |
| BioShock Infinite - 1920x1080 Ultra Preset, DX11 (DDOF) | |
| Gigabyte P57X v7 | |
| Asus Strix GL502VM-FY039T | |
| MSI GL62M 7RD-077 | |
| Acer Aspire V15 Nitro BE VN7-592G-79DV | |
| Apple MacBook Pro 15 2016 (2.7 GHz, 455) | |
| Battlefield 4 - 1920x1080 Ultra Preset AA:4x MS | |
| Asus Strix GL502VM-FY039T | |
| MSI GL62M 7RD-077 | |
| Acer Aspire V15 Nitro BE VN7-592G-79DV | |
| Tomb Raider - 1920x1080 Ultra Preset AA:FX AF:16x | |
| Asus Strix GL502VM-FY039T | |
| MSI GL62M 7RD-077 | |
| Acer Aspire V15 Nitro BE VN7-592G-79DV | |
| Star Wars Battlefront - 1920x1080 Ultra Preset AA:FX | |
| MSI GL62M 7RD-077 | |
| Battlefield 1 - 1920x1080 High Preset AA:T | |
| Acer Aspire VX5-591G-D0DD | |
| MSI GL62M 7RD-077 | |
| Asus Strix GL753VD-GC045T | |
| Apple MacBook Pro 15 2016 (2.9 GHz, 460) | |
| Apple MacBook Pro 15 2016 (2.7 GHz, 455) | |
| Ashes of the Singularity - 1280x768 low | |
| Asus Strix GL502VM-FY039T | |
| MSI GL62M 7RD-077 | |
| Apple MacBook Pro 15 2016 (2.7 GHz, 455) | |
| Deus Ex Mankind Divided - 1366x768 Medium Preset AF:2x | |
| MSI GL62M 7RD-077 | |
| Asus Strix GL753VD-GC045T | |
| Rise of the Tomb Raider - 1366x768 Medium Preset AF:2x | |
| Acer Aspire VX5-591G-D0DD | |
| MSI GL62M 7RD-077 | |
| HP Omen 15-ax007ng | |
| Asus Strix GL753VD-GC045T | |
| Acer Aspire V15 Nitro BE VN7-592G-79DV | |
Barulho
| Ocioso |
| 32.5 / 32.5 / 32.5 dB |
| HDD |
| 32.6 dB |
| Carga |
| 36.4 / 52.4 dB |
 | ||
30 dB silencioso 40 dB(A) audível 50 dB(A) ruidosamente alto |
||
min: | ||
| MSI GL62M 7RD-077 i7-7700HQ, GeForce GTX 1050 Mobile | MSI GL62-6QFi781H11 6700HQ, GeForce GTX 960M | Asus Strix GL502VM-FY039T 6700HQ, GeForce GTX 1060 Mobile | HP Omen 15-ax007ng 6700HQ, GeForce GTX 965M | Gigabyte P57X v7 i7-7700HQ, GeForce GTX 1070 Mobile | Asus Strix GL753VD-GC045T i7-7700HQ, GeForce GTX 1050 Mobile | |
|---|---|---|---|---|---|---|
| Noise | -5% | -5% | -4% | -2% | -4% | |
| off / environment * | 30.6 | 30 2% | 31 -1% | 30 2% | 29 5% | 28.8 6% |
| Idle Minimum * | 32.5 | 35 -8% | 32 2% | 32 2% | 30.4 6% | 33.9 -4% |
| Idle Average * | 32.5 | 36 -11% | 33 -2% | 33 -2% | 32.1 1% | 33.9 -4% |
| Idle Maximum * | 32.5 | 37 -14% | 34 -5% | 36 -11% | 32.1 1% | 37.8 -16% |
| Load Average * | 36.4 | 41 -13% | 44 -21% | 43 -18% | 45.6 -25% | 42.7 -17% |
| Load Maximum * | 52.4 | 46 12% | 53 -1% | 49 6% | 51.5 2% | 47.4 10% |
* ... smaller is better
(±) The maximum temperature on the upper side is 44.9 °C / 113 F, compared to the average of 40.4 °C / 105 F, ranging from 21.2 to 68.8 °C for the class Gaming.
(+) The bottom heats up to a maximum of 38.2 °C / 101 F, compared to the average of 43.2 °C / 110 F
(+) In idle usage, the average temperature for the upper side is 25.6 °C / 78 F, compared to the device average of 33.8 °C / 93 F.
(±) The palmrests and touchpad can get very hot to the touch with a maximum of 38 °C / 100.4 F.
(-) The average temperature of the palmrest area of similar devices was 28.9 °C / 84 F (-9.1 °C / -16.4 F).
| MSI GL62M 7RD-077 i7-7700HQ, GeForce GTX 1050 Mobile | MSI GL62-6QFi781H11 6700HQ, GeForce GTX 960M | Asus Strix GL502VM-FY039T 6700HQ, GeForce GTX 1060 Mobile | HP Omen 15-ax007ng 6700HQ, GeForce GTX 965M | Gigabyte P57X v7 i7-7700HQ, GeForce GTX 1070 Mobile | Asus Strix GL753VD-GC045T i7-7700HQ, GeForce GTX 1050 Mobile | |
|---|---|---|---|---|---|---|
| Heat | -8% | -38% | -14% | -18% | 11% | |
| Maximum Upper Side * | 44.9 | 49.1 -9% | 65.3 -45% | 48.5 -8% | 51.2 -14% | 37.7 16% |
| Maximum Bottom * | 38.2 | 43.4 -14% | 64.4 -69% | 59 -54% | 56.8 -49% | 36.3 5% |
| Idle Upper Side * | 27.4 | 29.2 -7% | 35.4 -29% | 28.7 -5% | 29.2 -7% | 25.7 6% |
| Idle Bottom * | 29 | 29.6 -2% | 31.6 -9% | 25.7 11% | 29.2 -1% | 24.4 16% |
* ... smaller is better
MSI GL62M 7RD-077 audio analysis
(+) | speakers can play relatively loud (86 dB)
Bass 100 - 315 Hz
(-) | nearly no bass - on average 28.4% lower than median
(±) | linearity of bass is average (9.6% delta to prev. frequency)
Mids 400 - 2000 Hz
(±) | higher mids - on average 9% higher than median
(±) | linearity of mids is average (8.2% delta to prev. frequency)
Highs 2 - 16 kHz
(±) | higher highs - on average 7% higher than median
(+) | highs are linear (6.8% delta to prev. frequency)
Overall 100 - 16.000 Hz
(±) | linearity of overall sound is average (27.7% difference to median)
Compared to same class
» 92% of all tested devices in this class were better, 2% similar, 6% worse
» The best had a delta of 6%, average was 18%, worst was 132%
Compared to all devices tested
» 81% of all tested devices were better, 4% similar, 15% worse
» The best had a delta of 4%, average was 25%, worst was 134%
Apple MacBook 12 (Early 2016) 1.1 GHz audio analysis
(+) | speakers can play relatively loud (83.6 dB)
Bass 100 - 315 Hz
(±) | reduced bass - on average 11.3% lower than median
(±) | linearity of bass is average (14.2% delta to prev. frequency)
Mids 400 - 2000 Hz
(+) | balanced mids - only 2.4% away from median
(+) | mids are linear (5.5% delta to prev. frequency)
Highs 2 - 16 kHz
(+) | balanced highs - only 2% away from median
(+) | highs are linear (4.5% delta to prev. frequency)
Overall 100 - 16.000 Hz
(+) | overall sound is linear (10.2% difference to median)
Compared to same class
» 5% of all tested devices in this class were better, 2% similar, 93% worse
» The best had a delta of 5%, average was 19%, worst was 53%
Compared to all devices tested
» 3% of all tested devices were better, 1% similar, 96% worse
» The best had a delta of 4%, average was 25%, worst was 134%
| desligado | |
| Ocioso | |
| Carga |
|
| MSI GL62M 7RD-077 i7-7700HQ, GeForce GTX 1050 Mobile | MSI GL62-6QFi781H11 6700HQ, GeForce GTX 960M | Asus Strix GL502VM-FY039T 6700HQ, GeForce GTX 1060 Mobile | HP Omen 15-ax007ng 6700HQ, GeForce GTX 965M | Gigabyte P57X v7 i7-7700HQ, GeForce GTX 1070 Mobile | Asus Strix GL753VD-GC045T i7-7700HQ, GeForce GTX 1050 Mobile | |
|---|---|---|---|---|---|---|
| Power Consumption | 1% | -25% | 11% | -69% | 15% | |
| Idle Minimum * | 10.6 | 10 6% | 16 -51% | 7 34% | 15.7 -48% | 6.2 42% |
| Idle Average * | 14.5 | 14 3% | 19 -31% | 11 24% | 23.4 -61% | 12.2 16% |
| Idle Maximum * | 15 | 19 -27% | 23 -53% | 19 -27% | 23.5 -57% | 14.8 1% |
| Load Average * | 90 | 82 9% | 68 24% | 79 12% | 184.6 -105% | 84.9 6% |
| Load Maximum * | 135 | 118 13% | 157 -16% | 119 12% | 233.1 -73% | 120.7 11% |
* ... smaller is better
| MSI GL62M 7RD-077 i7-7700HQ, GeForce GTX 1050 Mobile, 41 Wh | MSI GL62-6QFi781H11 6700HQ, GeForce GTX 960M, 41.4 Wh | Asus Strix GL502VM-FY039T 6700HQ, GeForce GTX 1060 Mobile, 64 Wh | HP Omen 15-ax007ng 6700HQ, GeForce GTX 965M, 61.5 Wh | Gigabyte P57X v7 i7-7700HQ, GeForce GTX 1070 Mobile, 75.81 Wh | Asus Strix GL753VD-GC045T i7-7700HQ, GeForce GTX 1050 Mobile, 48 Wh | Acer Aspire VX5-591G-D0DD i7-7700HQ, GeForce GTX 1050 Ti Mobile, 52 Wh | |
|---|---|---|---|---|---|---|---|
| Battery Runtime | 10% | 25% | 45% | 25% | 20% | 62% | |
| Reader / Idle | 387 | 339 -12% | 315 -19% | 467 21% | 256 -34% | 515 33% | |
| H.264 | 217 | 235 8% | 244 12% | ||||
| WiFi v1.3 | 225 | 158 -30% | 220 -2% | 272 21% | 155 -31% | 261 16% | 365 62% |
| Load | 41 | 71 73% | 87 112% | 93 127% | 98 139% | 45 10% |
Pro
Contra
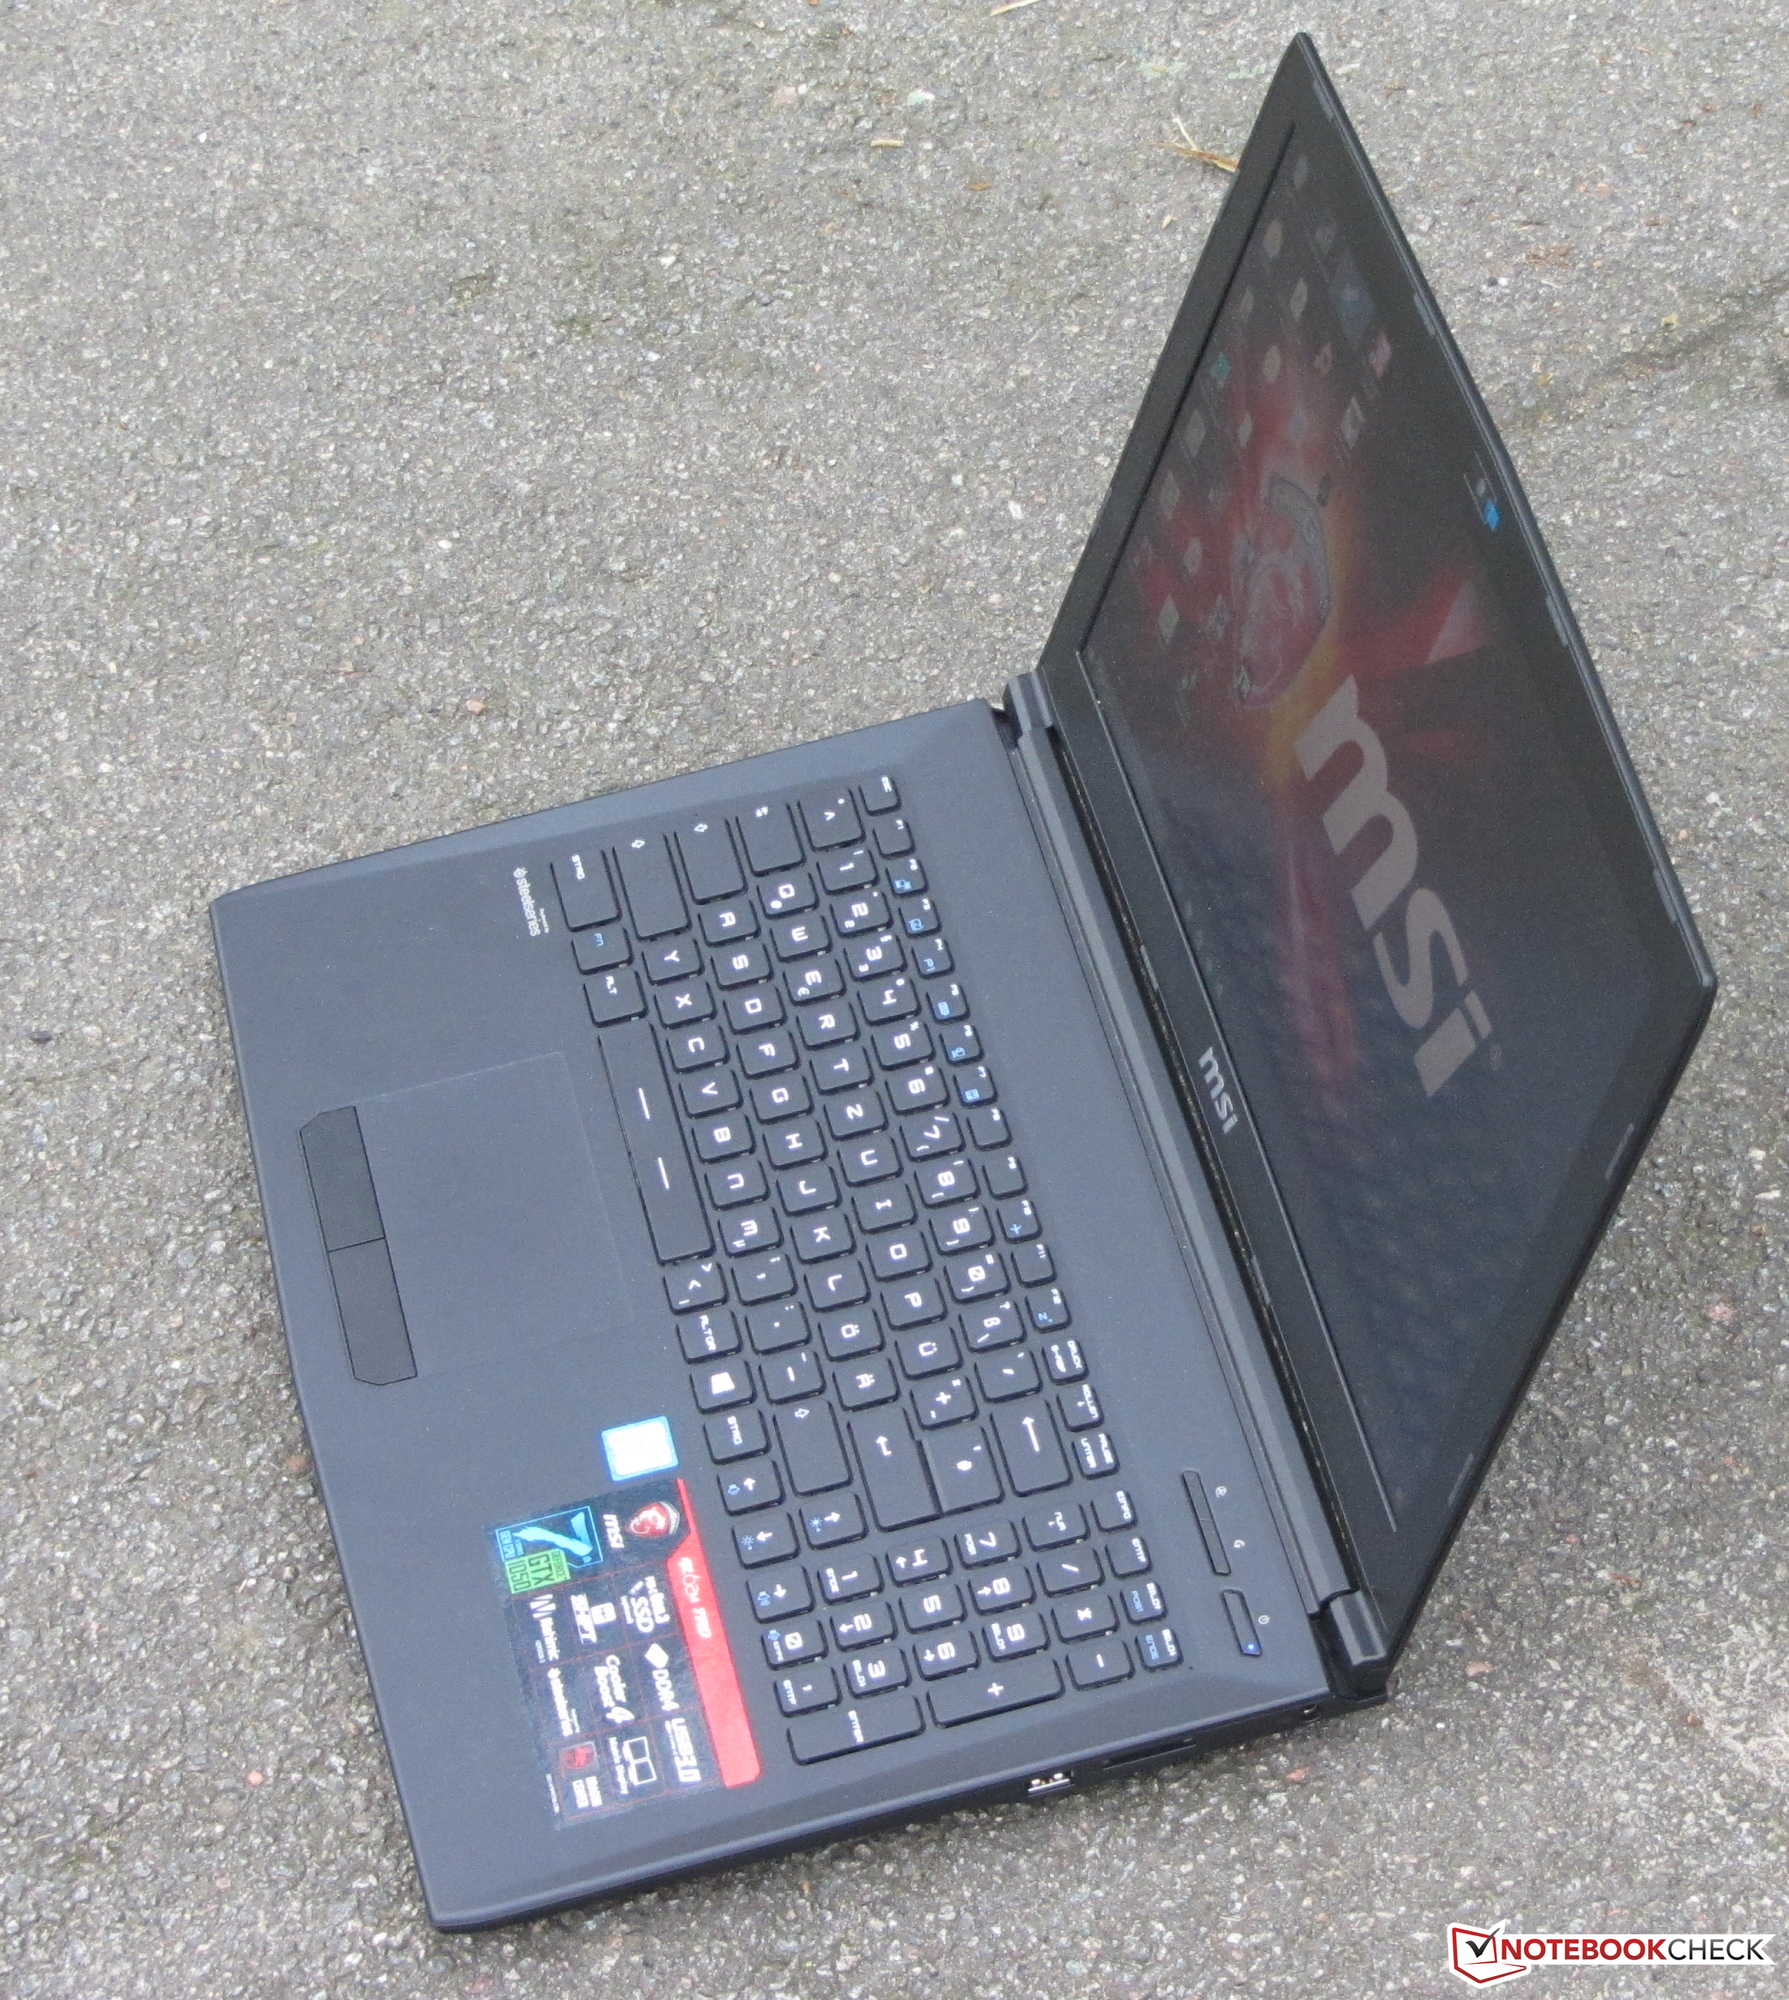
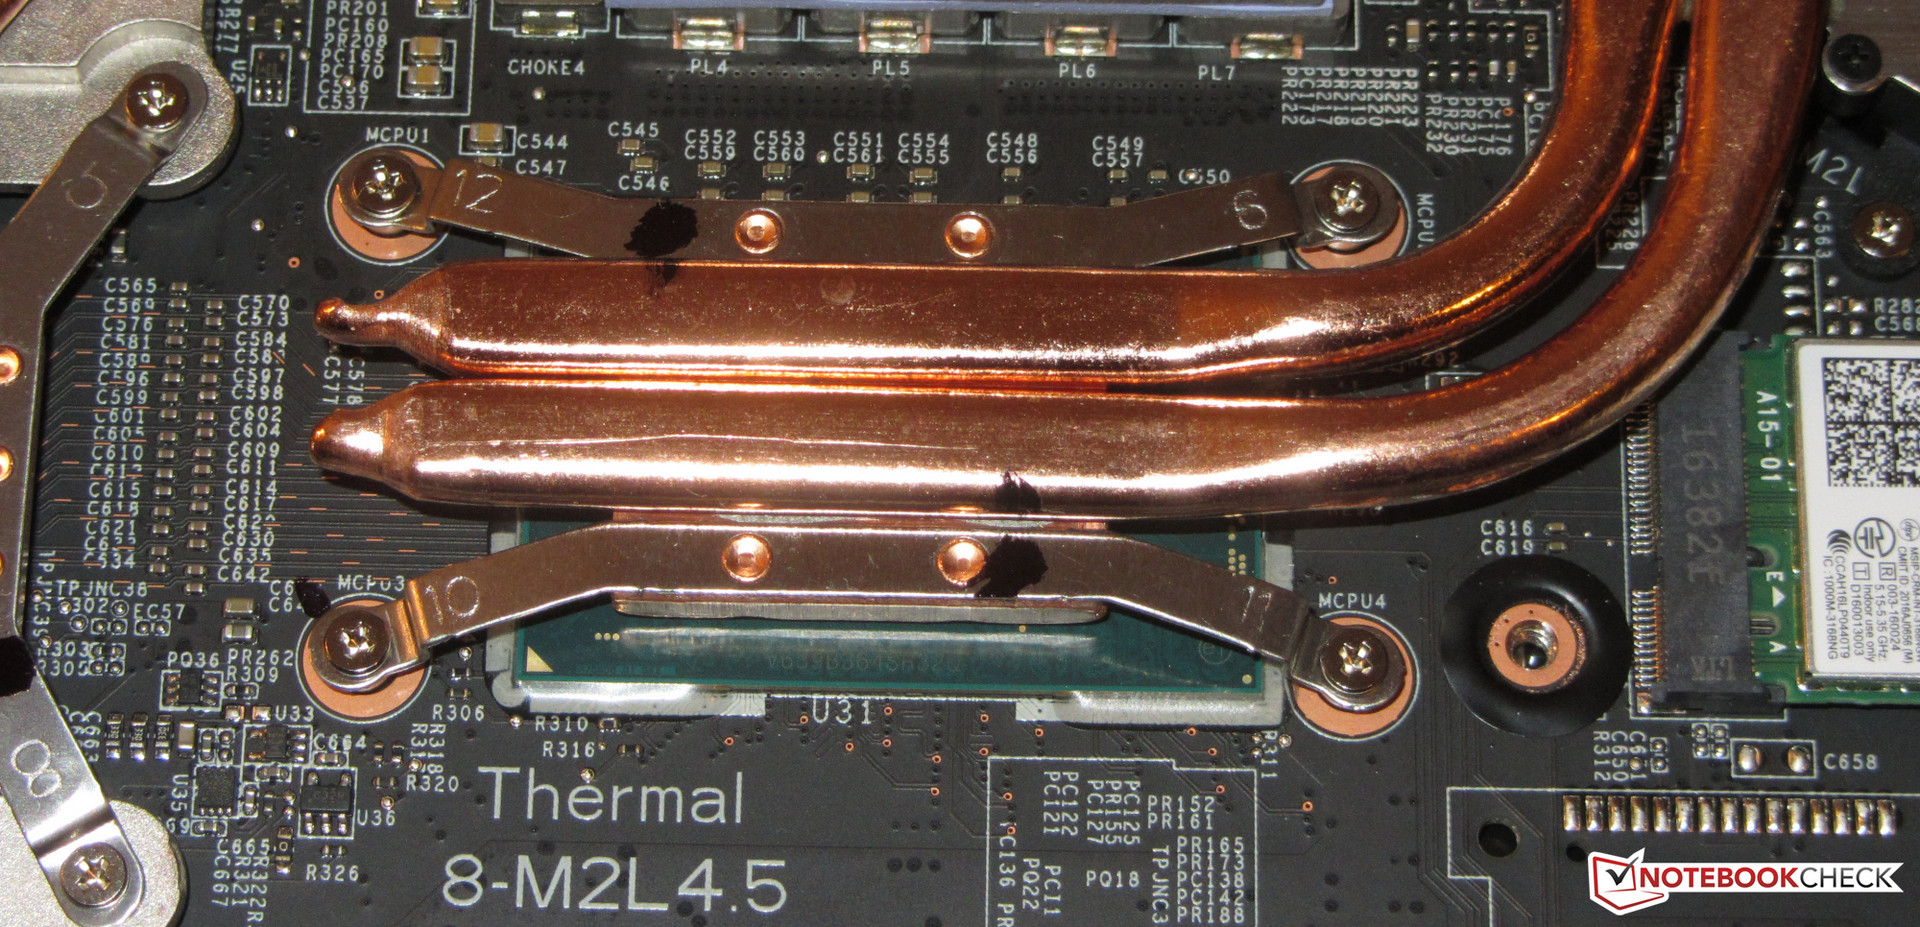
O GL62M quer ser um aparelho econômico do nível de entrada no mundo dos portáteis para jogos. Consequentemente é capaz de rodar jogos atuais em altas resoluções e com configurações de alta qualidade em sua tela Full HD mate. A placa de vídeo Nvidia GeForce GTX 1050 torna isso possível. Ela traz um desempenho bastante mais alto que o do predecessor. No entanto, o portátil não apenas se desempenha bem nos jogos, mas também em todos os outros campos de aplicação. Seu poderoso processador Kaby Lake garante isso. Apesar de seu poderoso hardware, o computador não esquenta muito, sem importar a carga.
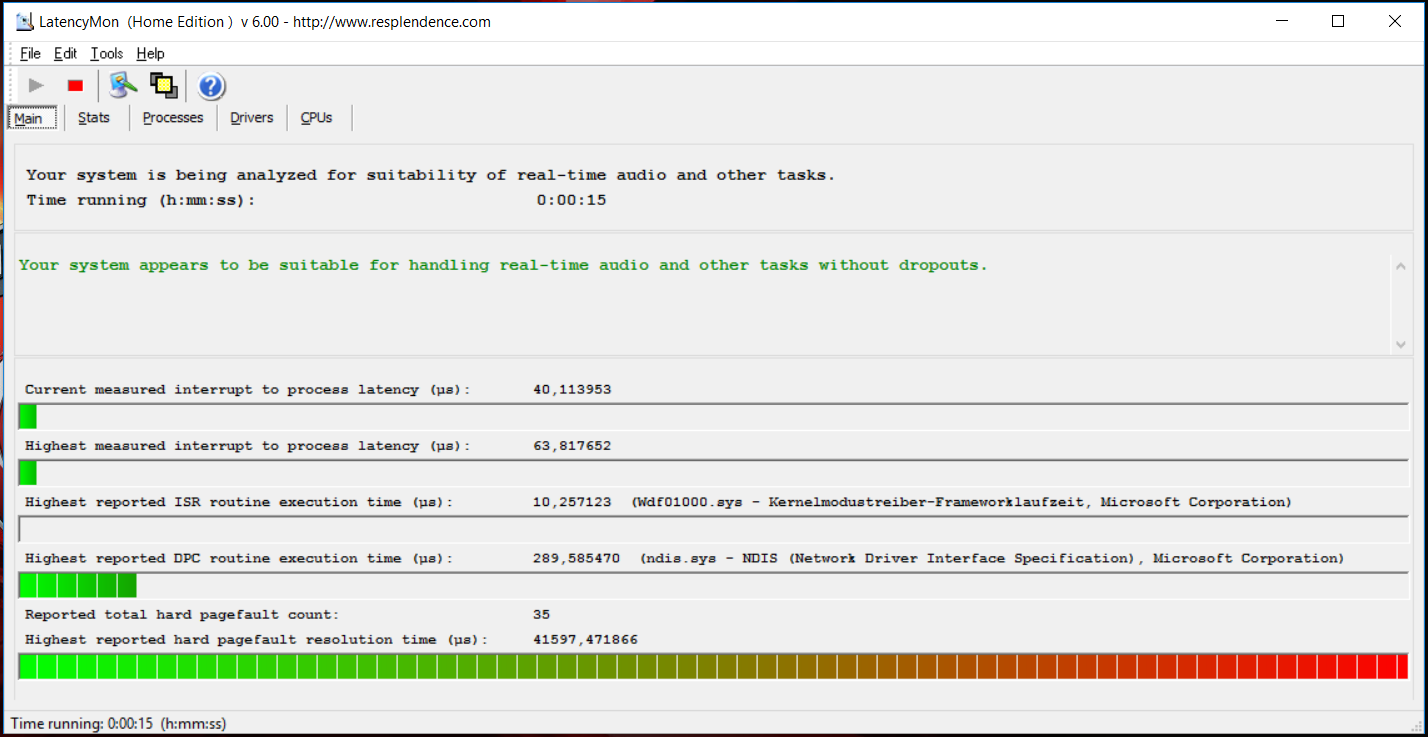
A MSI deveria melhorar o controle automático da ventoinha com uma atualização do BIOS. A ventoinha da CPU funciona de forma permanente quando o sistema está no modo inativo e gera um ruído de assobio pulsante. Os usuários devem resolver isso, por si mesmos - isto não deve ocorrer.
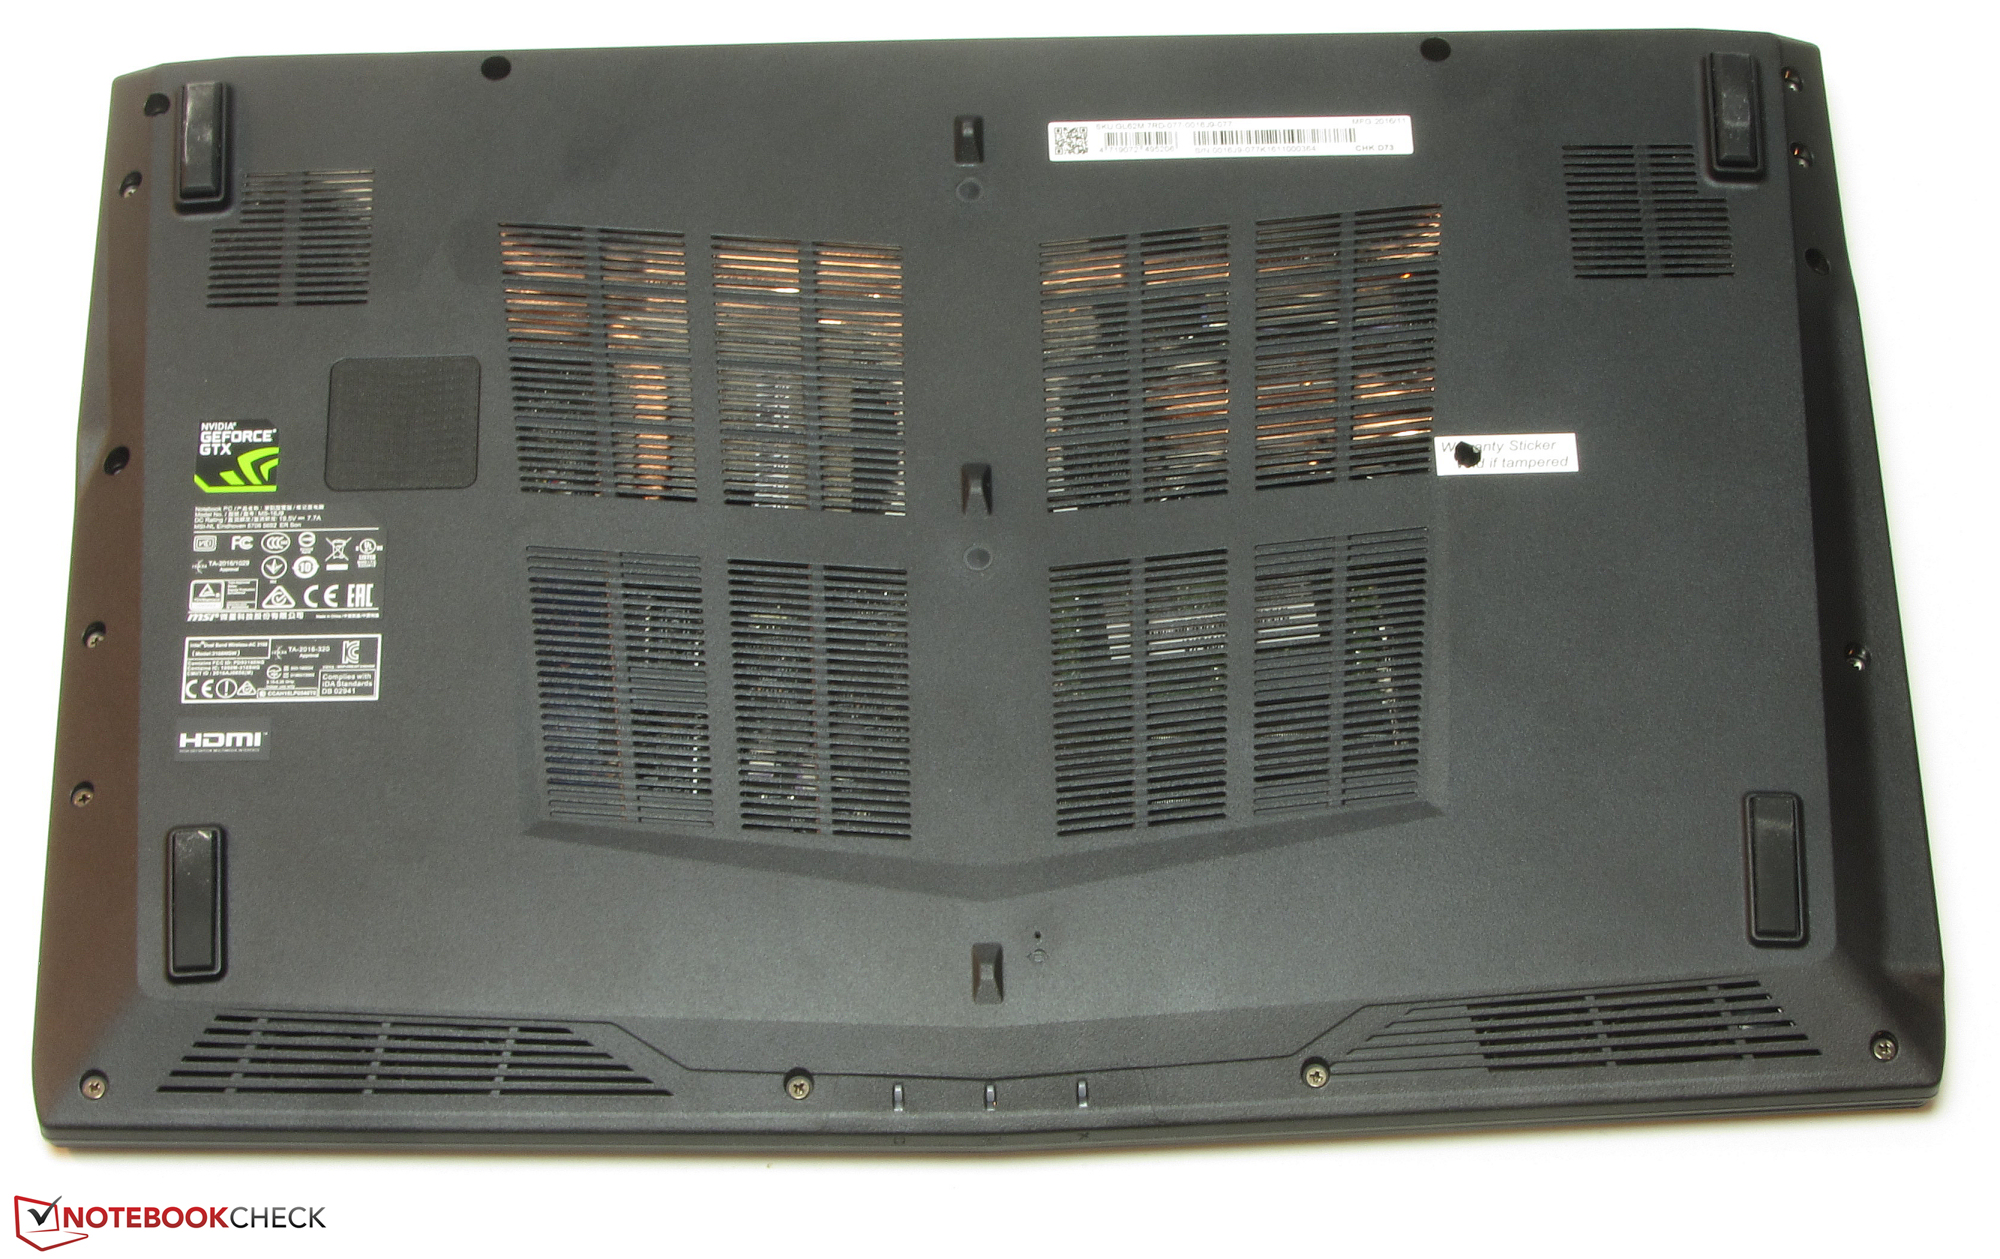
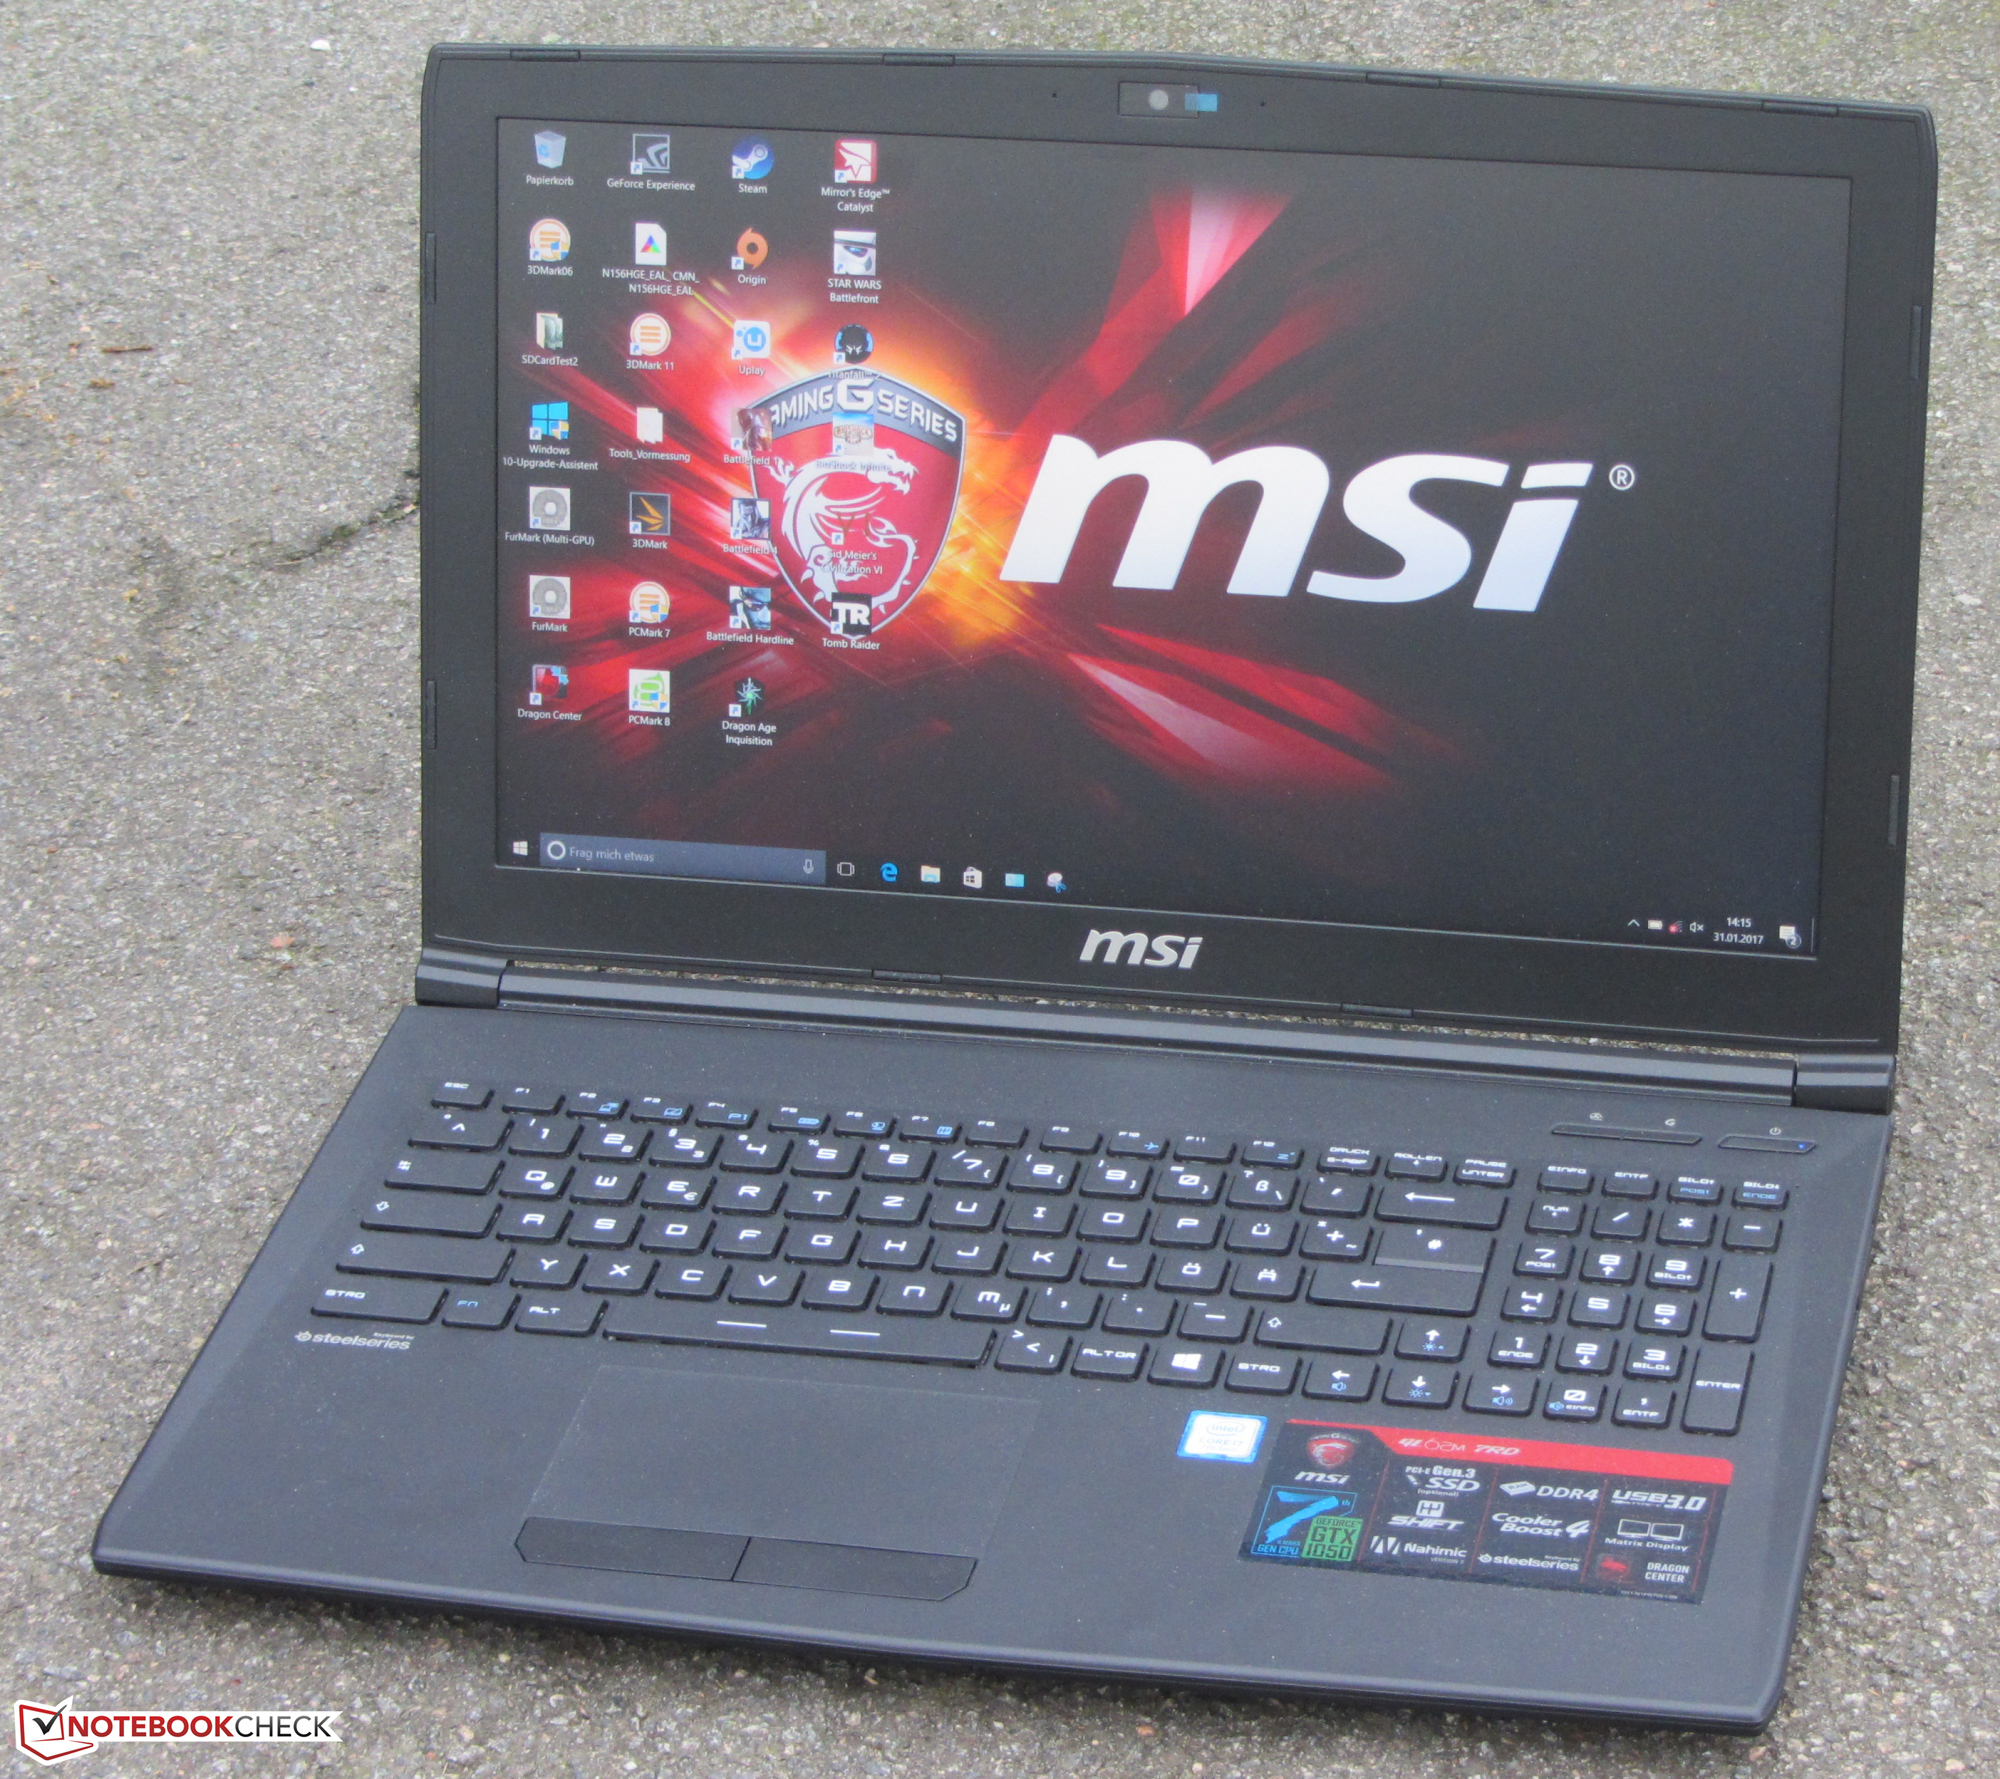
O teclado é bom e apto para o uso doméstico. No entanto, falta a iluminação do teclado. Graças a um disco rígido de 1 TB de 2,5 polegadas, há suficiente espaço de armazenamento. É possível substituir o HD depois de remover o lado inferior do computador. Ao mesmo tempo, você também pode adicionar um SSD M.2. O slot existente suporta SATA-3 e modelos PCIe/NVMe.
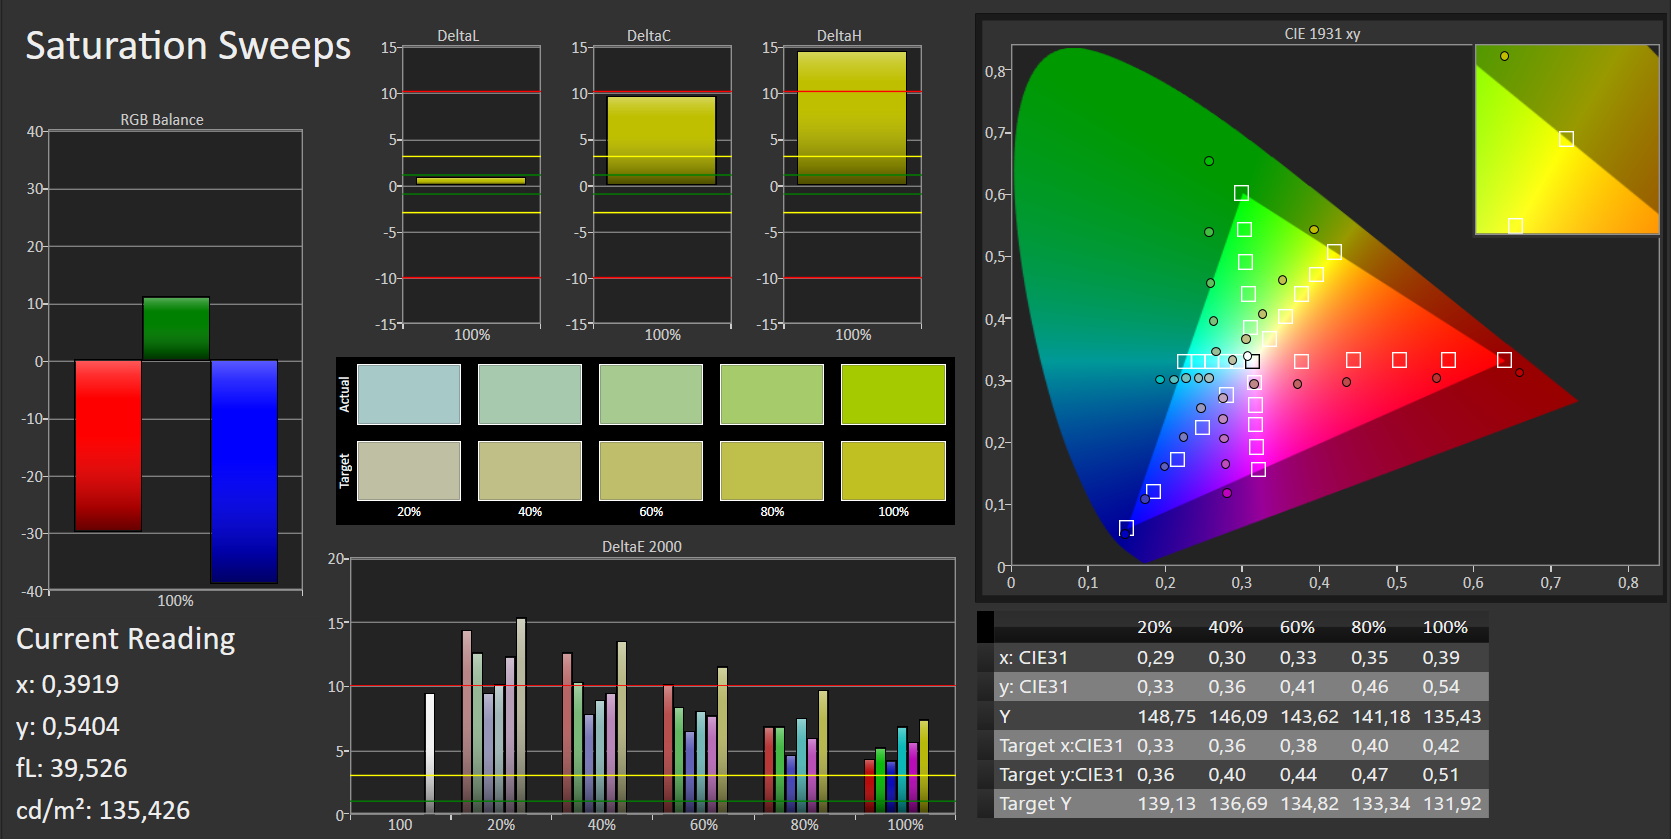
A tela do GL62M é decepcionante.
A MSI incorporou um modelo TN escuro e de baixo contraste com ângulos de visão estreito. Por um preço de mais de 1000 Euros (~$1064) esperamos um painel IPS brilhante e rico em contraste. As durações da bateria também não são convincentes.
No geral, a MSI fez muito recortes para posicionar o computador no segmento de nível de entrada. Vários concorrentes oferecem modelos mais balanceados, por exemplo, o HP Omen 15-ax206ng. Ele usa a mesma combinação de CPU/GPU que o GL62M, mas adicionalmente tem uma tela IPS, um teclado iluminado, e uma combinação SSD/HD abordo. Ele tem um preço similar ao do computador da MSI.
MSI GL62M 7RD-077
-
02/07/2017 v6(old)
Sascha Mölck