 Deutsch
 English
 Español
 Français
 Italiano
 Nederlands
 Polski
 Português
 Русский
 Türkçe
 Svenska
 Chinese
 Magyar
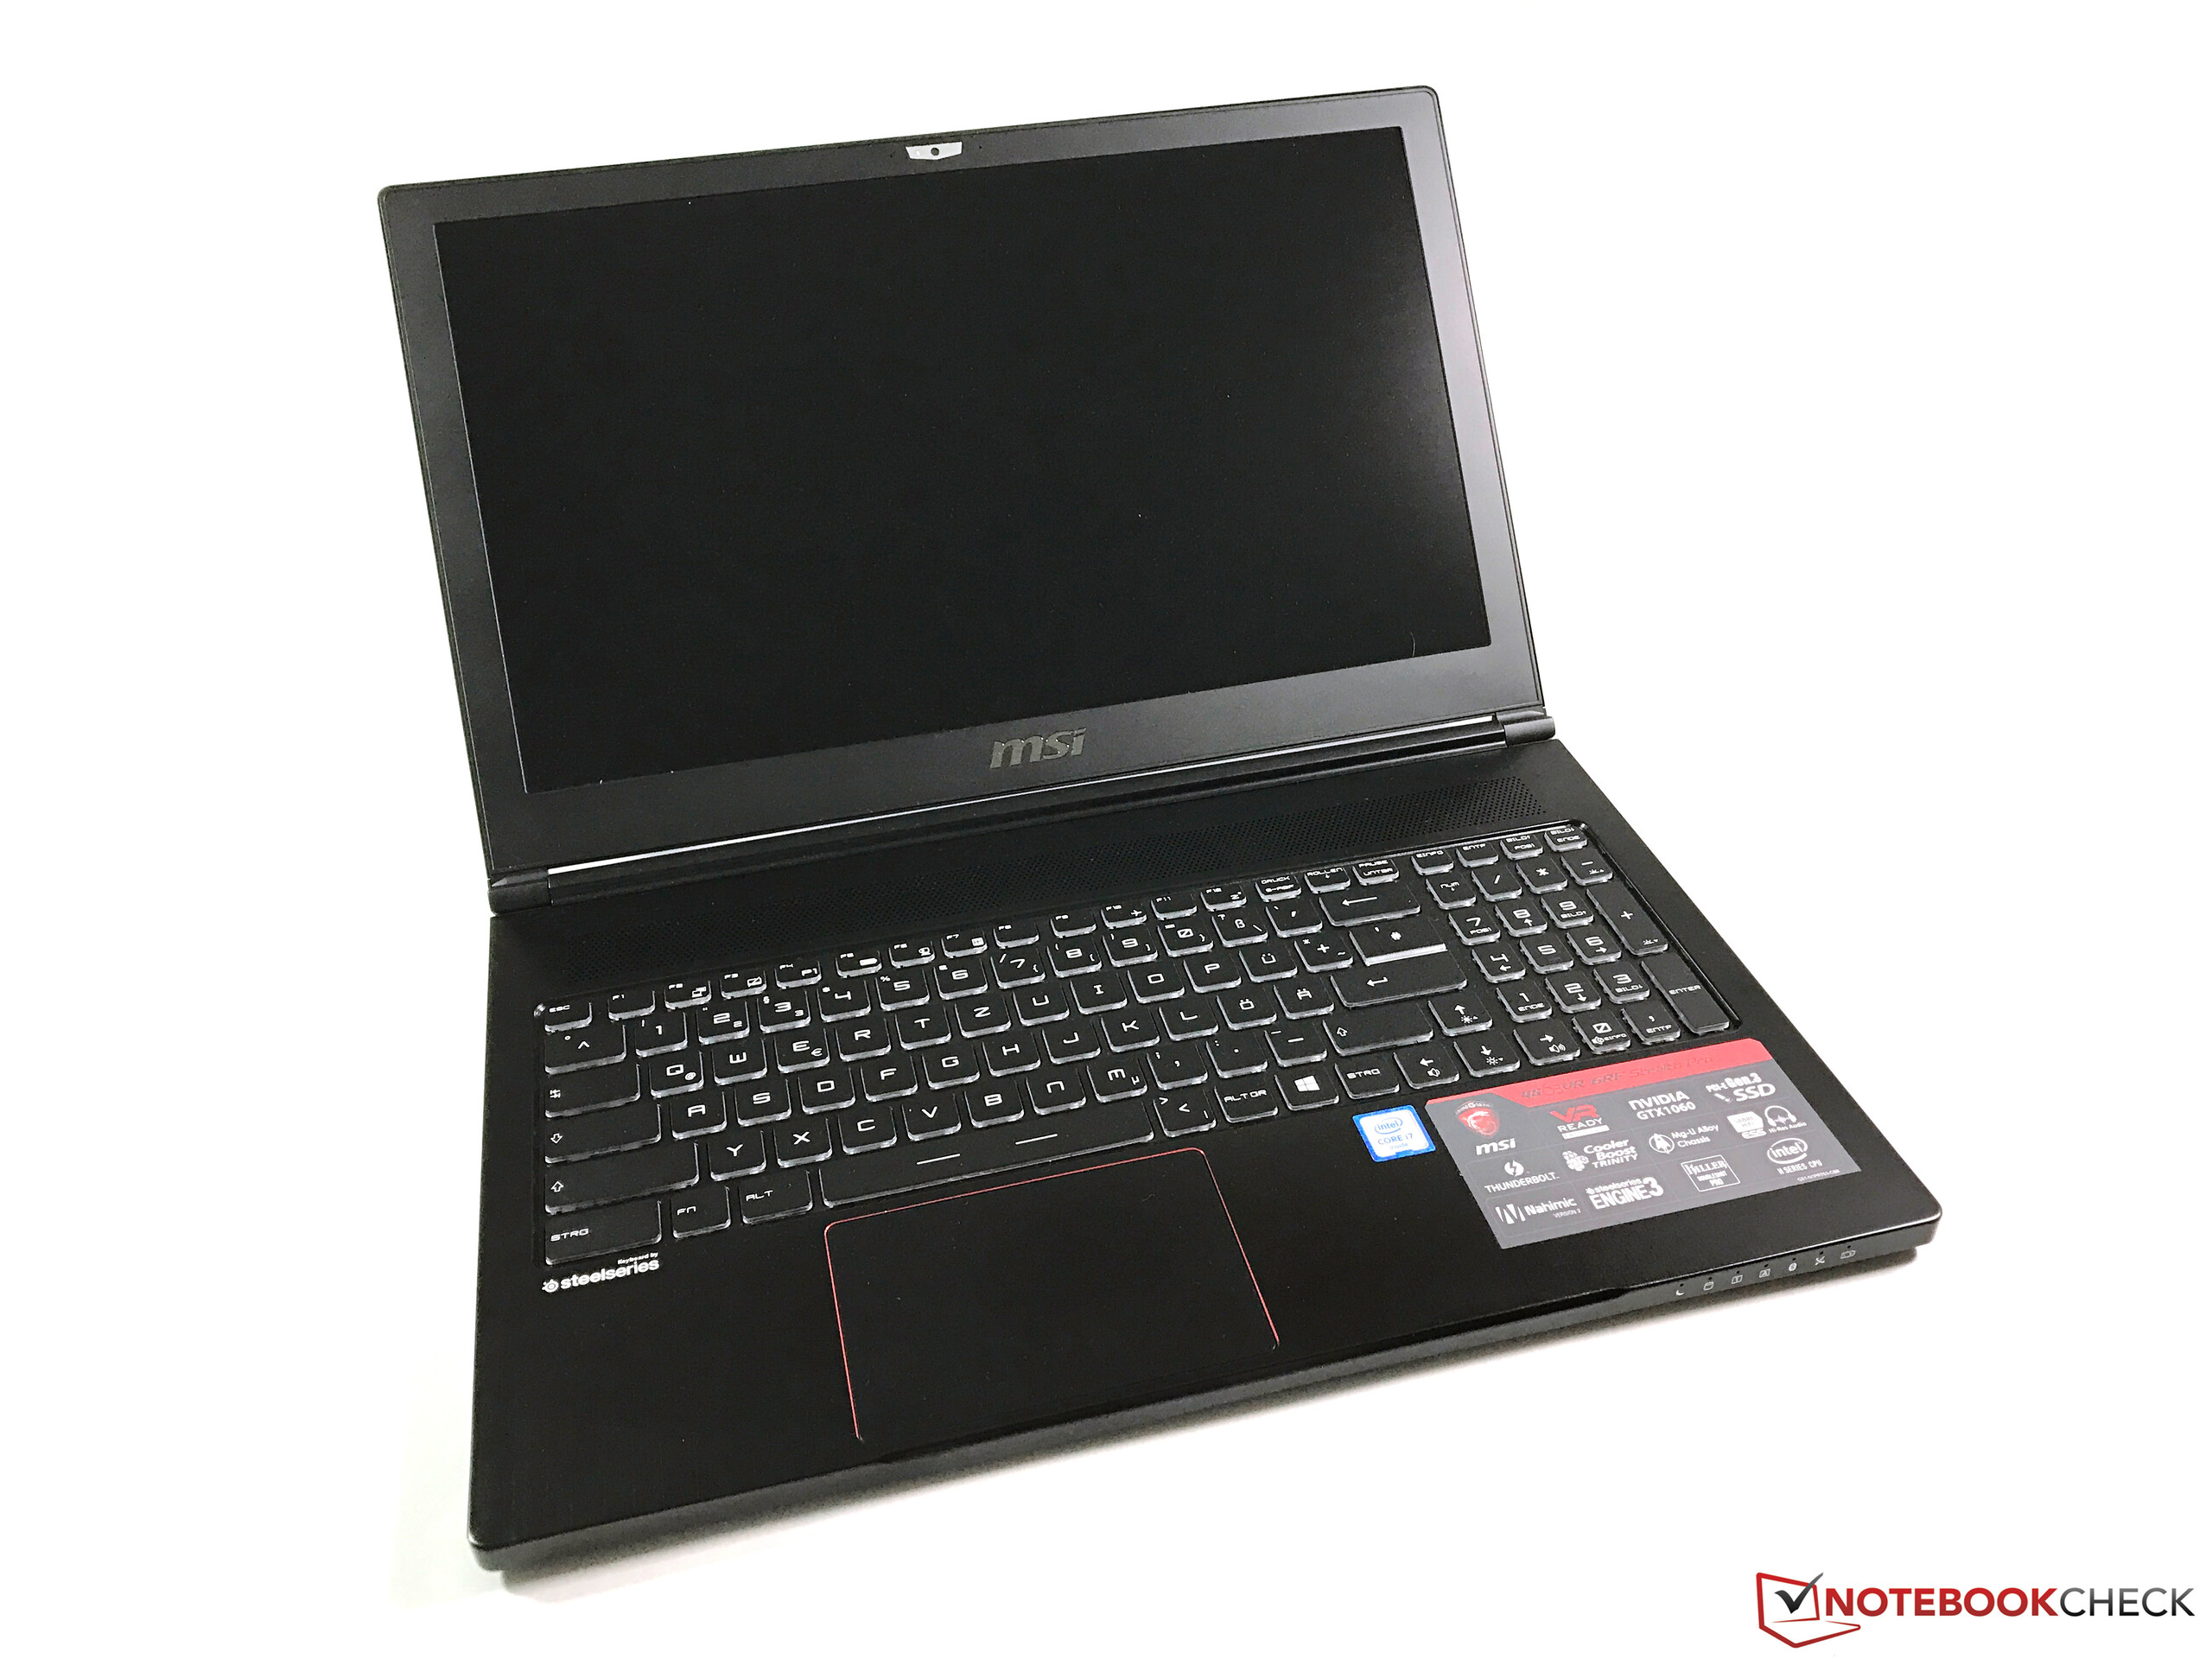
Breve análise do Portátil MSI GS63VR 6RF Stealth Pro


| SD Card Reader | |
| average JPG Copy Test (av. of 3 runs) | |
| MSI GS60-6QE4K16H21 | |
| SCHENKER XMG P507 | |
| Asus Strix GL502VS-FY032T | |
| Asus G501VW-FY081T | |
| MSI GS63VR-6RF16H22 Stealth Pro | |
| MSI GE62VR 6RF-001US | |
| maximum AS SSD Seq Read Test (1GB) | |
| MSI GS60-6QE4K16H21 | |
| SCHENKER XMG P507 | |
| Asus Strix GL502VS-FY032T | |
| Asus G501VW-FY081T | |
| MSI GS63VR-6RF16H22 Stealth Pro | |
| MSI GE62VR 6RF-001US | |
| Networking | |
| iperf Server (receive) TCP 1 m | |
| Asus Strix GL502VS-FY032T | |
| SCHENKER XMG P507 | |
| MSI GS63VR-6RF16H22 Stealth Pro | |
| iperf Client (transmit) TCP 1 m | |
| MSI GS63VR-6RF16H22 Stealth Pro | |
| Asus Strix GL502VS-FY032T | |
| SCHENKER XMG P507 | |
Screen Flickering / PWM (Pulse-Width Modulation)
| Screen flickering / PWM detected | 202 Hz | ≤ 100 % brightness setting | 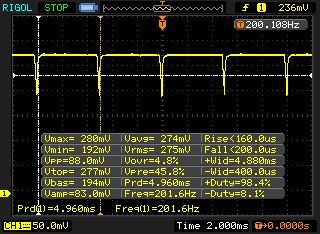 |
The display backlight flickers at 202 Hz (worst case, e.g., utilizing PWM) Flickering detected at a brightness setting of 100 % and below. There should be no flickering or PWM above this brightness setting. The frequency of 202 Hz is relatively low, so sensitive users will likely notice flickering and experience eyestrain at the stated brightness setting and below. In comparison: 53 % of all tested devices do not use PWM to dim the display. If PWM was detected, an average of 17900 (minimum: 5 - maximum: 3846000) Hz was measured. | |||
| |||||||||||||||||||||||||
iluminação: 84 %
iluminação com acumulador: 293 cd/m²
Contraste: 888:1 (Preto: 0.33 cd/m²)
ΔE Color 3.59 | 0.5-29.43 Ø5
ΔE Greyscale 3.86 | 0.57-98 Ø5.3
97% sRGB (Argyll 1.6.3 3D)
63% AdobeRGB 1998 (Argyll 1.6.3 3D)
69.7% AdobeRGB 1998 (Argyll 2.2.0 3D)
97.4% sRGB (Argyll 2.2.0 3D)
67.8% Display P3 (Argyll 2.2.0 3D)
Gamma: 2.53
| MSI GS63VR-6RF16H22 Stealth Pro Samsung 156HL01-104 (SDC324C) , 1920x1080 | MSI GS60-6QE4K16H21 Samsung 156FL02-P01 (SDC424B), 3840x2160 | Asus G501VW-FY081T Samsung 156HL01-104, 1920x1080 | Asus Strix GL502VS-FY032T LG Philips LP156WF6-SPB6 (LGD046F), 1920x1080 | MSI GE62VR 6RF-001US 1920x1080 | SCHENKER XMG P507 LG Philips LP156WF6 (LGD046F), 1920x1080 | |
|---|---|---|---|---|---|---|
| Display | -20% | -1% | -11% | -9% | -10% | |
| Display P3 Coverage | 67.8 | 53.1 -22% | 66.8 -1% | 64.5 -5% | 65.6 -3% | 64.5 -5% |
| sRGB Coverage | 97.4 | 80 -18% | 97.3 0% | 83.1 -15% | 84.3 -13% | 83.4 -14% |
| AdobeRGB 1998 Coverage | 69.7 | 54.8 -21% | 68.6 -2% | 60.8 -13% | 61.7 -11% | 61 -12% |
| Response Times | 276% | -26% | 12% | -2% | 12% | |
| Response Time Grey 50% / Grey 80% * | 40 ? | 50 ? | 38 ? | 36.8 ? | 36 ? | |
| Response Time Black / White * | 26 ? | 26 ? -0% | 39 ? -50% | 23 ? 12% | 26.4 ? -2% | 23 ? 12% |
| PWM Frequency | 202 ? | 1316 ? 551% | 200 ? -1% | |||
| Screen | -39% | -3% | -10% | 6% | -12% | |
| Brightness middle | 293 | 212 -28% | 341 16% | 315 8% | 302 3% | 288 -2% |
| Brightness | 279 | 197 -29% | 312 12% | 290 4% | 303 9% | 292 5% |
| Brightness Distribution | 84 | 78 -7% | 83 -1% | 85 1% | 87 4% | 87 4% |
| Black Level * | 0.33 | 0.49 -48% | 0.32 3% | 0.32 3% | 0.169 49% | 0.3 9% |
| Contrast | 888 | 433 -51% | 1066 20% | 984 11% | 1787 101% | 960 8% |
| Colorchecker dE 2000 * | 3.59 | 7.8 -117% | 4.23 -18% | 4.88 -36% | 4.61 -28% | 5.1 -42% |
| Colorchecker dE 2000 max. * | 5.79 | 8.02 -39% | 8.88 -53% | 9.98 -72% | 9.44 -63% | |
| Greyscale dE 2000 * | 3.86 | 5.23 -35% | 4.69 -22% | 4.17 -8% | 3.32 14% | 4.43 -15% |
| Gamma | 2.53 87% | 3.05 72% | 2.53 87% | 2.53 87% | 2.24 98% | 2.46 89% |
| CCT | 7229 90% | 6693 97% | 7549 86% | 6683 97% | 6358 102% | 6687 97% |
| Color Space (Percent of AdobeRGB 1998) | 63 | 50 -21% | 63 0% | 55 -13% | 55.4 -12% | 55 -13% |
| Color Space (Percent of sRGB) | 97 | 80 -18% | 97 0% | 83 -14% | 84.4 -13% | 83 -14% |
| Total Average (Program / Settings) | 72% /
10% | -10% /
-6% | -3% /
-8% | -2% /
2% | -3% /
-10% |
* ... smaller is better
Display Response Times
| ↔ Response Time Black to White | ||
|---|---|---|
| 26 ms ... rise ↗ and fall ↘ combined | ↗ 8 ms rise | 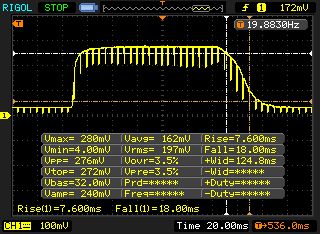 |
| ↘ 18 ms fall | ||
| The screen shows relatively slow response rates in our tests and may be too slow for gamers. In comparison, all tested devices range from 0.1 (minimum) to 240 (maximum) ms. » 57 % of all devices are better. This means that the measured response time is worse than the average of all tested devices (21.5 ms). | ||
| Cinebench R15 | |
| CPU Single 64Bit | |
| Asus G501VW-FY081T | |
| SCHENKER XMG P507 | |
| Asus Strix GL502VS-FY032T | |
| MSI GS63VR-6RF16H22 Stealth Pro | |
| MSI GE62VR 6RF-001US | |
| MSI GS60-6QE4K16H21 | |
| CPU Multi 64Bit | |
| SCHENKER XMG P507 | |
| Asus Strix GL502VS-FY032T | |
| Asus G501VW-FY081T | |
| MSI GS63VR-6RF16H22 Stealth Pro | |
| MSI GS60-6QE4K16H21 | |
| MSI GE62VR 6RF-001US | |
| Cinebench R11.5 | |
| CPU Single 64Bit | |
| Asus G501VW-FY081T | |
| MSI GE62VR 6RF-001US | |
| MSI GS63VR-6RF16H22 Stealth Pro | |
| SCHENKER XMG P507 | |
| Asus Strix GL502VS-FY032T | |
| MSI GS60-6QE4K16H21 | |
| CPU Multi 64Bit | |
| SCHENKER XMG P507 | |
| Asus G501VW-FY081T | |
| MSI GE62VR 6RF-001US | |
| MSI GS60-6QE4K16H21 | |
| MSI GS63VR-6RF16H22 Stealth Pro | |
| Asus Strix GL502VS-FY032T | |
| PCMark 8 | |
| Home Score Accelerated v2 | |
| Asus Strix GL502VS-FY032T | |
| MSI GS63VR-6RF16H22 Stealth Pro | |
| MSI GE62VR 6RF-001US | |
| Asus G501VW-FY081T | |
| MSI GS60-6QE4K16H21 | |
| Work Score Accelerated v2 | |
| MSI GE62VR 6RF-001US | |
| Asus Strix GL502VS-FY032T | |
| MSI GS63VR-6RF16H22 Stealth Pro | |
| Asus G501VW-FY081T | |
| PCMark 7 - Score | |
| SCHENKER XMG P507 | |
| MSI GS60-6QE4K16H21 | |
| MSI GS63VR-6RF16H22 Stealth Pro | |
| Asus G501VW-FY081T | |
| PCMark 7 Score | 5321 pontos | |
| PCMark 8 Home Score Accelerated v2 | 4060 pontos | |
| PCMark 8 Creative Score Accelerated v2 | 5171 pontos | |
| PCMark 8 Work Score Accelerated v2 | 4859 pontos | |
Ajuda | ||
| MSI GS63VR-6RF16H22 Stealth Pro Samsung SM951 MZVPV256HDGL m.2 PCI-e | MSI GS60-6QE4K16H21 Hynix HFS256G3MND | Asus G501VW-FY081T Samsung CM871 MZNLF128HCHP | Asus Strix GL502VS-FY032T SanDisk SD8SNAT256G1002 | MSI GE62VR 6RF-001US Samsung SM951 MZVPV512HDGL m.2 PCI-e | SCHENKER XMG P507 Samsung SM951 MZVPV256HDGL m.2 PCI-e | |
|---|---|---|---|---|---|---|
| CrystalDiskMark 3.0 | -51% | -82% | -65% | 5% | 3% | |
| Read Seq | 1973 | 518 -74% | 447.1 -77% | 485.4 -75% | 1696 -14% | 1857 -6% |
| Write Seq | 1292 | 407.2 -68% | 136 -89% | 312.4 -76% | 1584 23% | 1240 -4% |
| Read 512 | 1279 | 388 -70% | 297.1 -77% | 294.8 -77% | 1044 -18% | 971 -24% |
| Write 512 | 1288 | 392.2 -70% | 86.5 -93% | 287.8 -78% | 1562 21% | 1239 -4% |
| Read 4k | 52.3 | 31.83 -39% | 15.84 -70% | 21.44 -59% | 50.8 -3% | 54.1 3% |
| Write 4k | 153.2 | 96.7 -37% | 31.96 -79% | 75.7 -51% | 139.2 -9% | 167.4 9% |
| Read 4k QD32 | 464.4 | 308.4 -34% | 96.9 -79% | 149.4 -68% | 591 27% | 695 50% |
| Write 4k QD32 | 384.4 | 318 -17% | 20.29 -95% | 256.3 -33% | 422.8 10% | 386.8 1% |

| 3DMark | |
| 1920x1080 Fire Strike Graphics | |
| Asus Strix GL502VS-FY032T | |
| MSI GE62VR 6RF-001US | |
| MSI GS63VR-6RF16H22 Stealth Pro | |
| SCHENKER XMG P507 | |
| MSI GS60-6QE4K16H21 | |
| Asus G501VW-FY081T | |
| 2560x1440 Time Spy Graphics | |
| MSI GS63VR-6RF16H22 Stealth Pro | |
| SCHENKER XMG P507 | |
| 3DMark 11 - 1280x720 Performance GPU | |
| Asus Strix GL502VS-FY032T | |
| MSI GE62VR 6RF-001US | |
| MSI GS63VR-6RF16H22 Stealth Pro | |
| SCHENKER XMG P507 | |
| MSI GS60-6QE4K16H21 | |
| Asus G501VW-FY081T | |
| 3DMark 11 Performance | 12411 pontos | |
| 3DMark Ice Storm Standard Score | 79935 pontos | |
| 3DMark Cloud Gate Standard Score | 21915 pontos | |
| 3DMark Fire Strike Score | 9704 pontos | |
| 3DMark Time Spy Score | 3630 pontos | |
Ajuda | ||
| Rise of the Tomb Raider | |
| 1920x1080 Very High Preset AA:FX AF:16x | |
| Asus Strix GL502VS-FY032T | |
| SCHENKER XMG P507 | |
| MSI GS63VR-6RF16H22 Stealth Pro | |
| MSI GE62VR 6RF-001US | |
| Asus G501VW-FY081T | |
| 1920x1080 High Preset AA:FX AF:4x | |
| Asus Strix GL502VS-FY032T | |
| SCHENKER XMG P507 | |
| MSI GS63VR-6RF16H22 Stealth Pro | |
| Asus G501VW-FY081T | |
| The Witcher 3 | |
| 1920x1080 High Graphics & Postprocessing (Nvidia HairWorks Off) | |
| Asus Strix GL502VS-FY032T | |
| MSI GS63VR-6RF16H22 Stealth Pro | |
| SCHENKER XMG P507 | |
| 1920x1080 Ultra Graphics & Postprocessing (HBAO+) | |
| Asus Strix GL502VS-FY032T | |
| MSI GS63VR-6RF16H22 Stealth Pro | |
| SCHENKER XMG P507 | |
| baixo | média | alto | ultra | |
| BioShock Infinite (2013) | 101.8 | |||
| The Witcher 3 (2015) | 74.6 | 40.4 | ||
| Rainbow Six Siege (2015) | 107.3 | |||
| Rise of the Tomb Raider (2016) | 65.3 | 55.5 | ||
| Deus Ex Mankind Divided (2016) | 49.1 | 26.9 |
Barulho
| Ocioso |
| 32 / 33 / 34 dB |
| HDD |
| 33 dB |
| Carga |
| 37 / 46 dB |
 | ||
30 dB silencioso 40 dB(A) audível 50 dB(A) ruidosamente alto |
||
min: | ||
| MSI GS63VR-6RF16H22 Stealth Pro GeForce GTX 1060 Mobile, 6700HQ | MSI GS60-6QE4K16H21 GeForce GTX 970M, 6700HQ | Asus G501VW-FY081T GeForce GTX 960M, 6700HQ | Asus Strix GL502VS-FY032T GeForce GTX 1070 Mobile, 6700HQ | MSI GE62VR 6RF-001US GeForce GTX 1060 Mobile, 6700HQ | SCHENKER XMG P507 GeForce GTX 1060 Mobile, 6700HQ | |
|---|---|---|---|---|---|---|
| Noise | -9% | -1% | -3% | -4% | -6% | |
| off / environment * | 30 | 31.2 -4% | 30 -0% | 28.2 6% | 30 -0% | |
| Idle Minimum * | 32 | 35 -9% | 32.1 -0% | 32 -0% | 32.8 -3% | 31 3% |
| Idle Average * | 33 | 36 -9% | 32.1 3% | 33 -0% | 32.9 -0% | 32 3% |
| Idle Maximum * | 34 | 37 -9% | 32.1 6% | 34 -0% | 32.9 3% | 38 -12% |
| Load Average * | 37 | 40 -8% | 43.3 -17% | 39 -5% | 41.6 -12% | 46 -24% |
| Load Maximum * | 46 | 50 -9% | 44.3 4% | 51 -11% | 55 -20% | 49 -7% |
* ... smaller is better
(-) The maximum temperature on the upper side is 45.3 °C / 114 F, compared to the average of 40.4 °C / 105 F, ranging from 21.2 to 68.8 °C for the class Gaming.
(-) The bottom heats up to a maximum of 62.6 °C / 145 F, compared to the average of 43.2 °C / 110 F
(+) In idle usage, the average temperature for the upper side is 24.2 °C / 76 F, compared to the device average of 33.8 °C / 93 F.
(+) The palmrests and touchpad are reaching skin temperature as a maximum (32 °C / 89.6 F) and are therefore not hot.
(-) The average temperature of the palmrest area of similar devices was 28.9 °C / 84 F (-3.1 °C / -5.6 F).
| MSI GS63VR-6RF16H22 Stealth Pro GeForce GTX 1060 Mobile, 6700HQ | MSI GS60-6QE4K16H21 GeForce GTX 970M, 6700HQ | Asus G501VW-FY081T GeForce GTX 960M, 6700HQ | Asus Strix GL502VS-FY032T GeForce GTX 1070 Mobile, 6700HQ | MSI GE62VR 6RF-001US GeForce GTX 1060 Mobile, 6700HQ | SCHENKER XMG P507 GeForce GTX 1060 Mobile, 6700HQ | |
|---|---|---|---|---|---|---|
| Heat | -10% | 8% | -7% | -19% | -8% | |
| Maximum Upper Side * | 45.3 | 51.4 -13% | 41 9% | 48 -6% | 53.2 -17% | 49.3 -9% |
| Maximum Bottom * | 62.6 | 68.9 -10% | 48.2 23% | 46.8 25% | 59.4 5% | 52.7 16% |
| Idle Upper Side * | 25.3 | 27.1 -7% | 26.4 -4% | 33.7 -33% | 35.6 -41% | 32.6 -29% |
| Idle Bottom * | 27.3 | 30.4 -11% | 26.7 2% | 30.5 -12% | 33.2 -22% | 29.5 -8% |
* ... smaller is better
MSI GS63VR-6RF16H22 Stealth Pro audio analysis
(±) | speaker loudness is average but good (79 dB)
Bass 100 - 315 Hz
(-) | nearly no bass - on average 21.6% lower than median
(±) | linearity of bass is average (14.1% delta to prev. frequency)
Mids 400 - 2000 Hz
(±) | higher mids - on average 5.1% higher than median
(+) | mids are linear (6.2% delta to prev. frequency)
Highs 2 - 16 kHz
(+) | balanced highs - only 3.3% away from median
(+) | highs are linear (6.6% delta to prev. frequency)
Overall 100 - 16.000 Hz
(±) | linearity of overall sound is average (21.9% difference to median)
Compared to same class
» 76% of all tested devices in this class were better, 6% similar, 18% worse
» The best had a delta of 6%, average was 18%, worst was 132%
Compared to all devices tested
» 58% of all tested devices were better, 7% similar, 35% worse
» The best had a delta of 4%, average was 25%, worst was 134%
Asus Strix GL502VS-FY032T audio analysis
(±) | speaker loudness is average but good (77 dB)
Bass 100 - 315 Hz
(-) | nearly no bass - on average 16.2% lower than median
(±) | linearity of bass is average (11.9% delta to prev. frequency)
Mids 400 - 2000 Hz
(+) | balanced mids - only 0.7% away from median
(+) | mids are linear (3.1% delta to prev. frequency)
Highs 2 - 16 kHz
(+) | balanced highs - only 3.5% away from median
(±) | linearity of highs is average (7.4% delta to prev. frequency)
Overall 100 - 16.000 Hz
(±) | linearity of overall sound is average (16.8% difference to median)
Compared to same class
» 41% of all tested devices in this class were better, 11% similar, 48% worse
» The best had a delta of 6%, average was 18%, worst was 132%
Compared to all devices tested
» 24% of all tested devices were better, 7% similar, 68% worse
» The best had a delta of 4%, average was 25%, worst was 134%
SCHENKER XMG P507 audio analysis
(±) | speaker loudness is average but good (75 dB)
Bass 100 - 315 Hz
(-) | nearly no bass - on average 20.7% lower than median
(±) | linearity of bass is average (8.8% delta to prev. frequency)
Mids 400 - 2000 Hz
(+) | balanced mids - only 2.2% away from median
(±) | linearity of mids is average (7.6% delta to prev. frequency)
Highs 2 - 16 kHz
(+) | balanced highs - only 2.3% away from median
(+) | highs are linear (5.3% delta to prev. frequency)
Overall 100 - 16.000 Hz
(±) | linearity of overall sound is average (19% difference to median)
Compared to same class
» 61% of all tested devices in this class were better, 8% similar, 31% worse
» The best had a delta of 6%, average was 18%, worst was 132%
Compared to all devices tested
» 39% of all tested devices were better, 8% similar, 53% worse
» The best had a delta of 4%, average was 25%, worst was 134%
| desligado | |
| Ocioso | |
| Carga |
|
| MSI GS63VR-6RF16H22 Stealth Pro GeForce GTX 1060 Mobile, 6700HQ | MSI GS60-6QE4K16H21 GeForce GTX 970M, 6700HQ | Asus G501VW-FY081T GeForce GTX 960M, 6700HQ | Asus Strix GL502VS-FY032T GeForce GTX 1070 Mobile, 6700HQ | MSI GE62VR 6RF-001US GeForce GTX 1060 Mobile, 6700HQ | SCHENKER XMG P507 GeForce GTX 1060 Mobile, 6700HQ | |
|---|---|---|---|---|---|---|
| Power Consumption | 1% | 41% | -8% | -26% | 17% | |
| Idle Minimum * | 18 | 17 6% | 6.9 62% | 20 -11% | 25.4 -41% | 11 39% |
| Idle Average * | 22 | 22 -0% | 10.7 51% | 24 -9% | 30.3 -38% | 16 27% |
| Idle Maximum * | 30 | 28 7% | 13.2 56% | 29 3% | 31.5 -5% | 21 30% |
| Load Average * | 77 | 91 -18% | 82 -6% | 86 -12% | 111.8 -45% | 80 -4% |
| Load Maximum * | 165 | 149 10% | 94 43% | 183 -11% | 163.2 1% | 174 -5% |
* ... smaller is better
| MSI GS63VR-6RF16H22 Stealth Pro 65 Wh | MSI GS60-6QE4K16H21 47 Wh | Asus G501VW-FY081T 60 Wh | Asus Strix GL502VS-FY032T 62 Wh | MSI GE62VR 6RF-001US 51 Wh | SCHENKER XMG P507 60 Wh | |
|---|---|---|---|---|---|---|
| Battery Runtime | -29% | 31% | -21% | -56% | 35% | |
| Reader / Idle | 358 | 213 -41% | 610 70% | 243 -32% | 137 -62% | 409 14% |
| H.264 | 271 | 303 12% | ||||
| WiFi v1.3 | 210 | 157 -25% | 330 57% | 196 -7% | 101 -52% | 274 30% |
| Load | 76 | 61 -20% | 64 -16% | 58 -24% | 35 -54% | 123 62% |
Pro
Contra
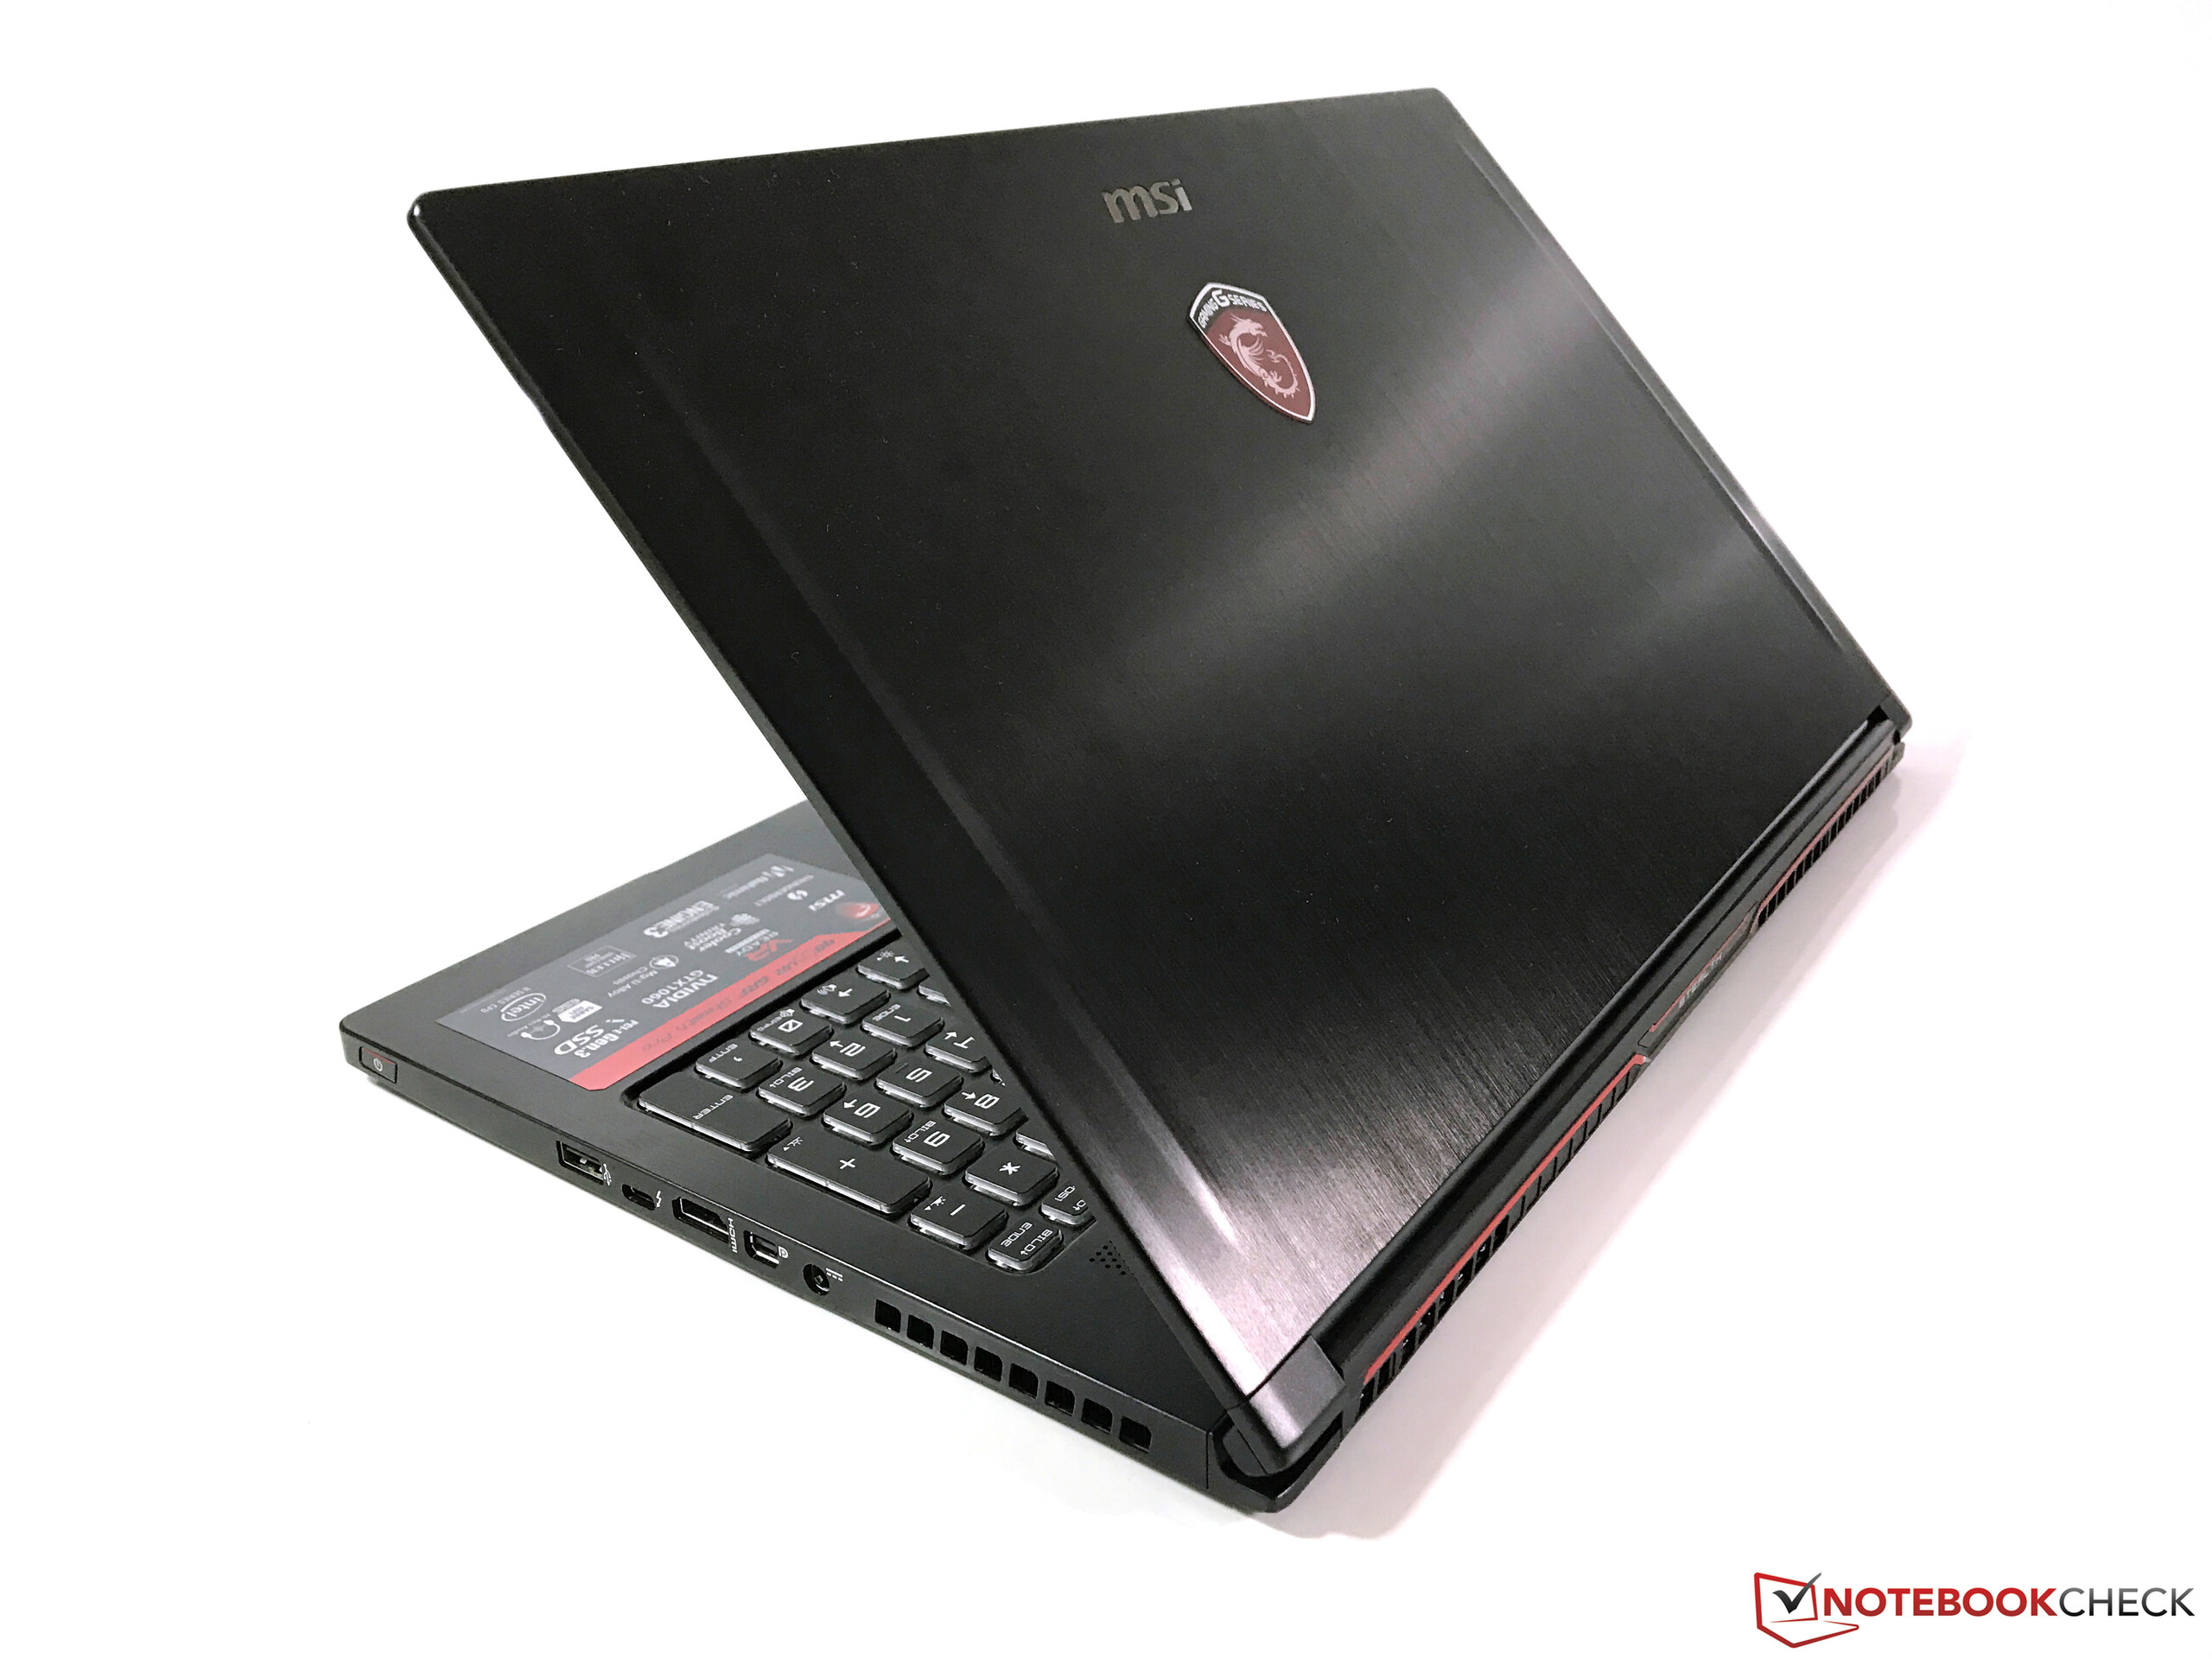
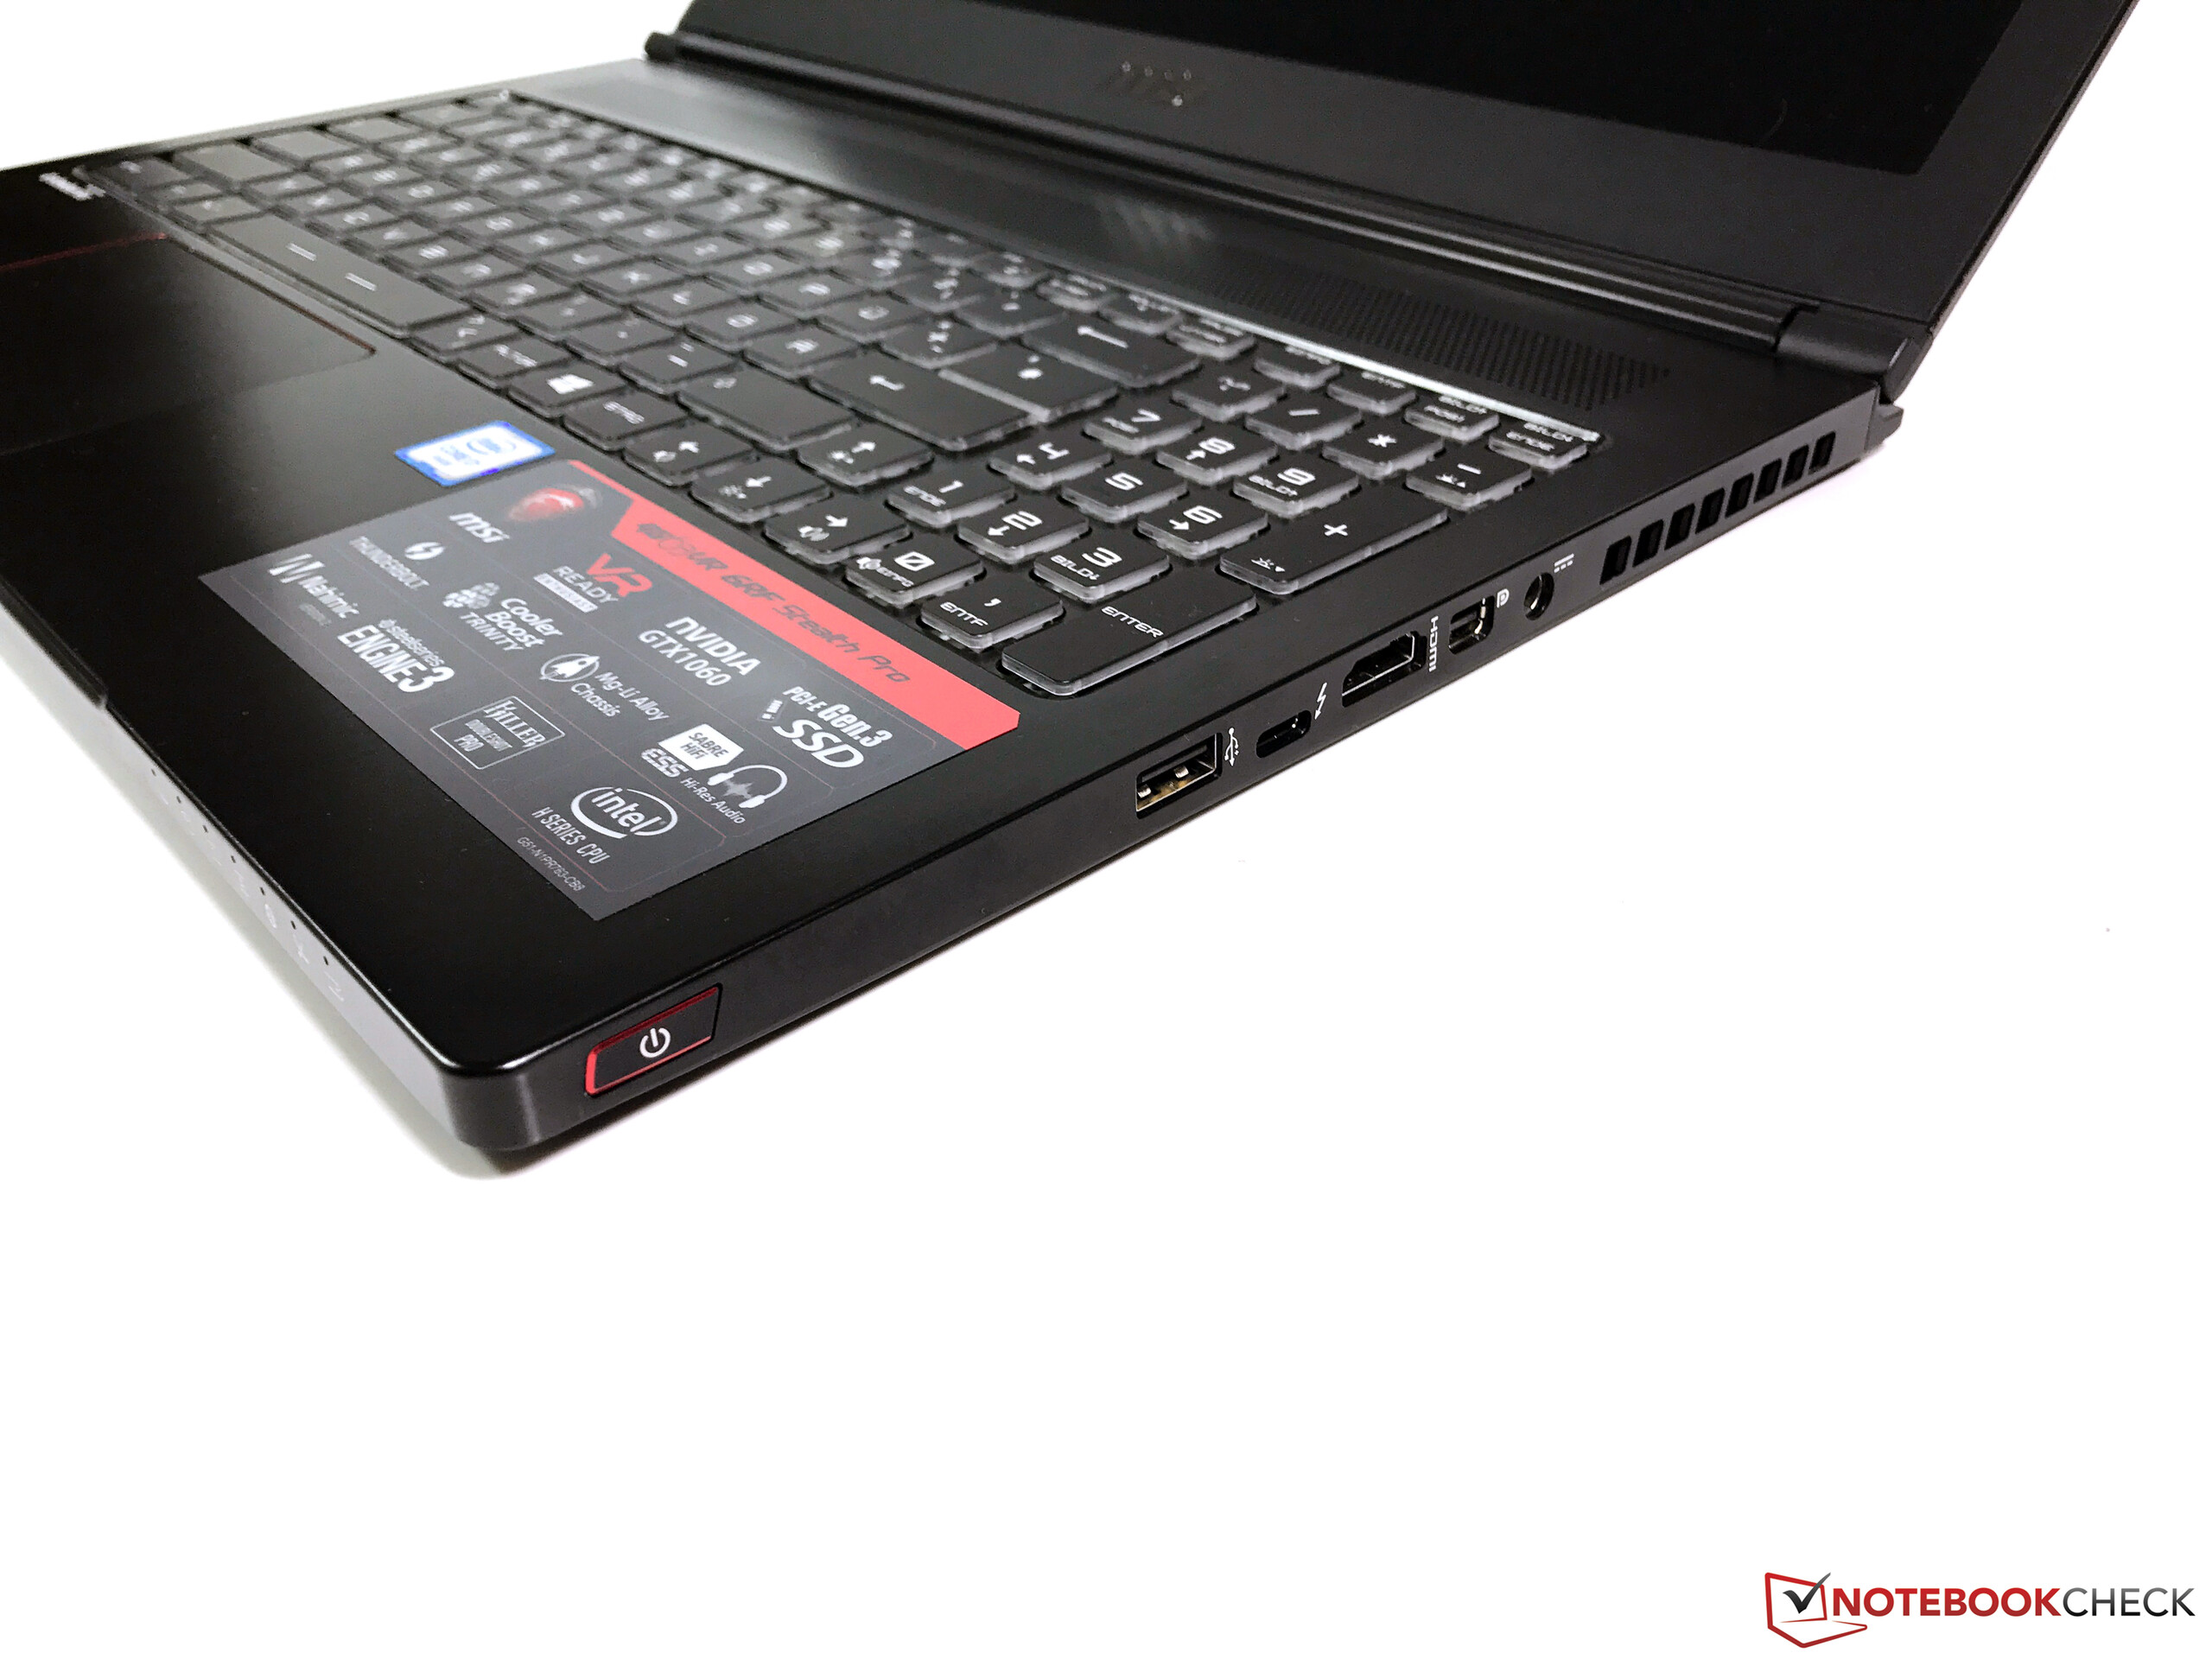
O MSI GS63VR Stealth Pro é uma boa evolução do predecessor. O chassi é inclusive um pouco mais fino que antes e o desempenho da GPU aumentou dramaticamente graças à nova geração de placas de vídeo da Nvidia. As temperaturas ainda são bastante altas, mas os valores são inferiores, em comparação com o GS60 em geral. O portátil também pode utilizar o desempenho dos componentes na maioria dos cenários – somente as cargas extremas e a operação da bateria resultarão em um desempenho reduzido da GPU.
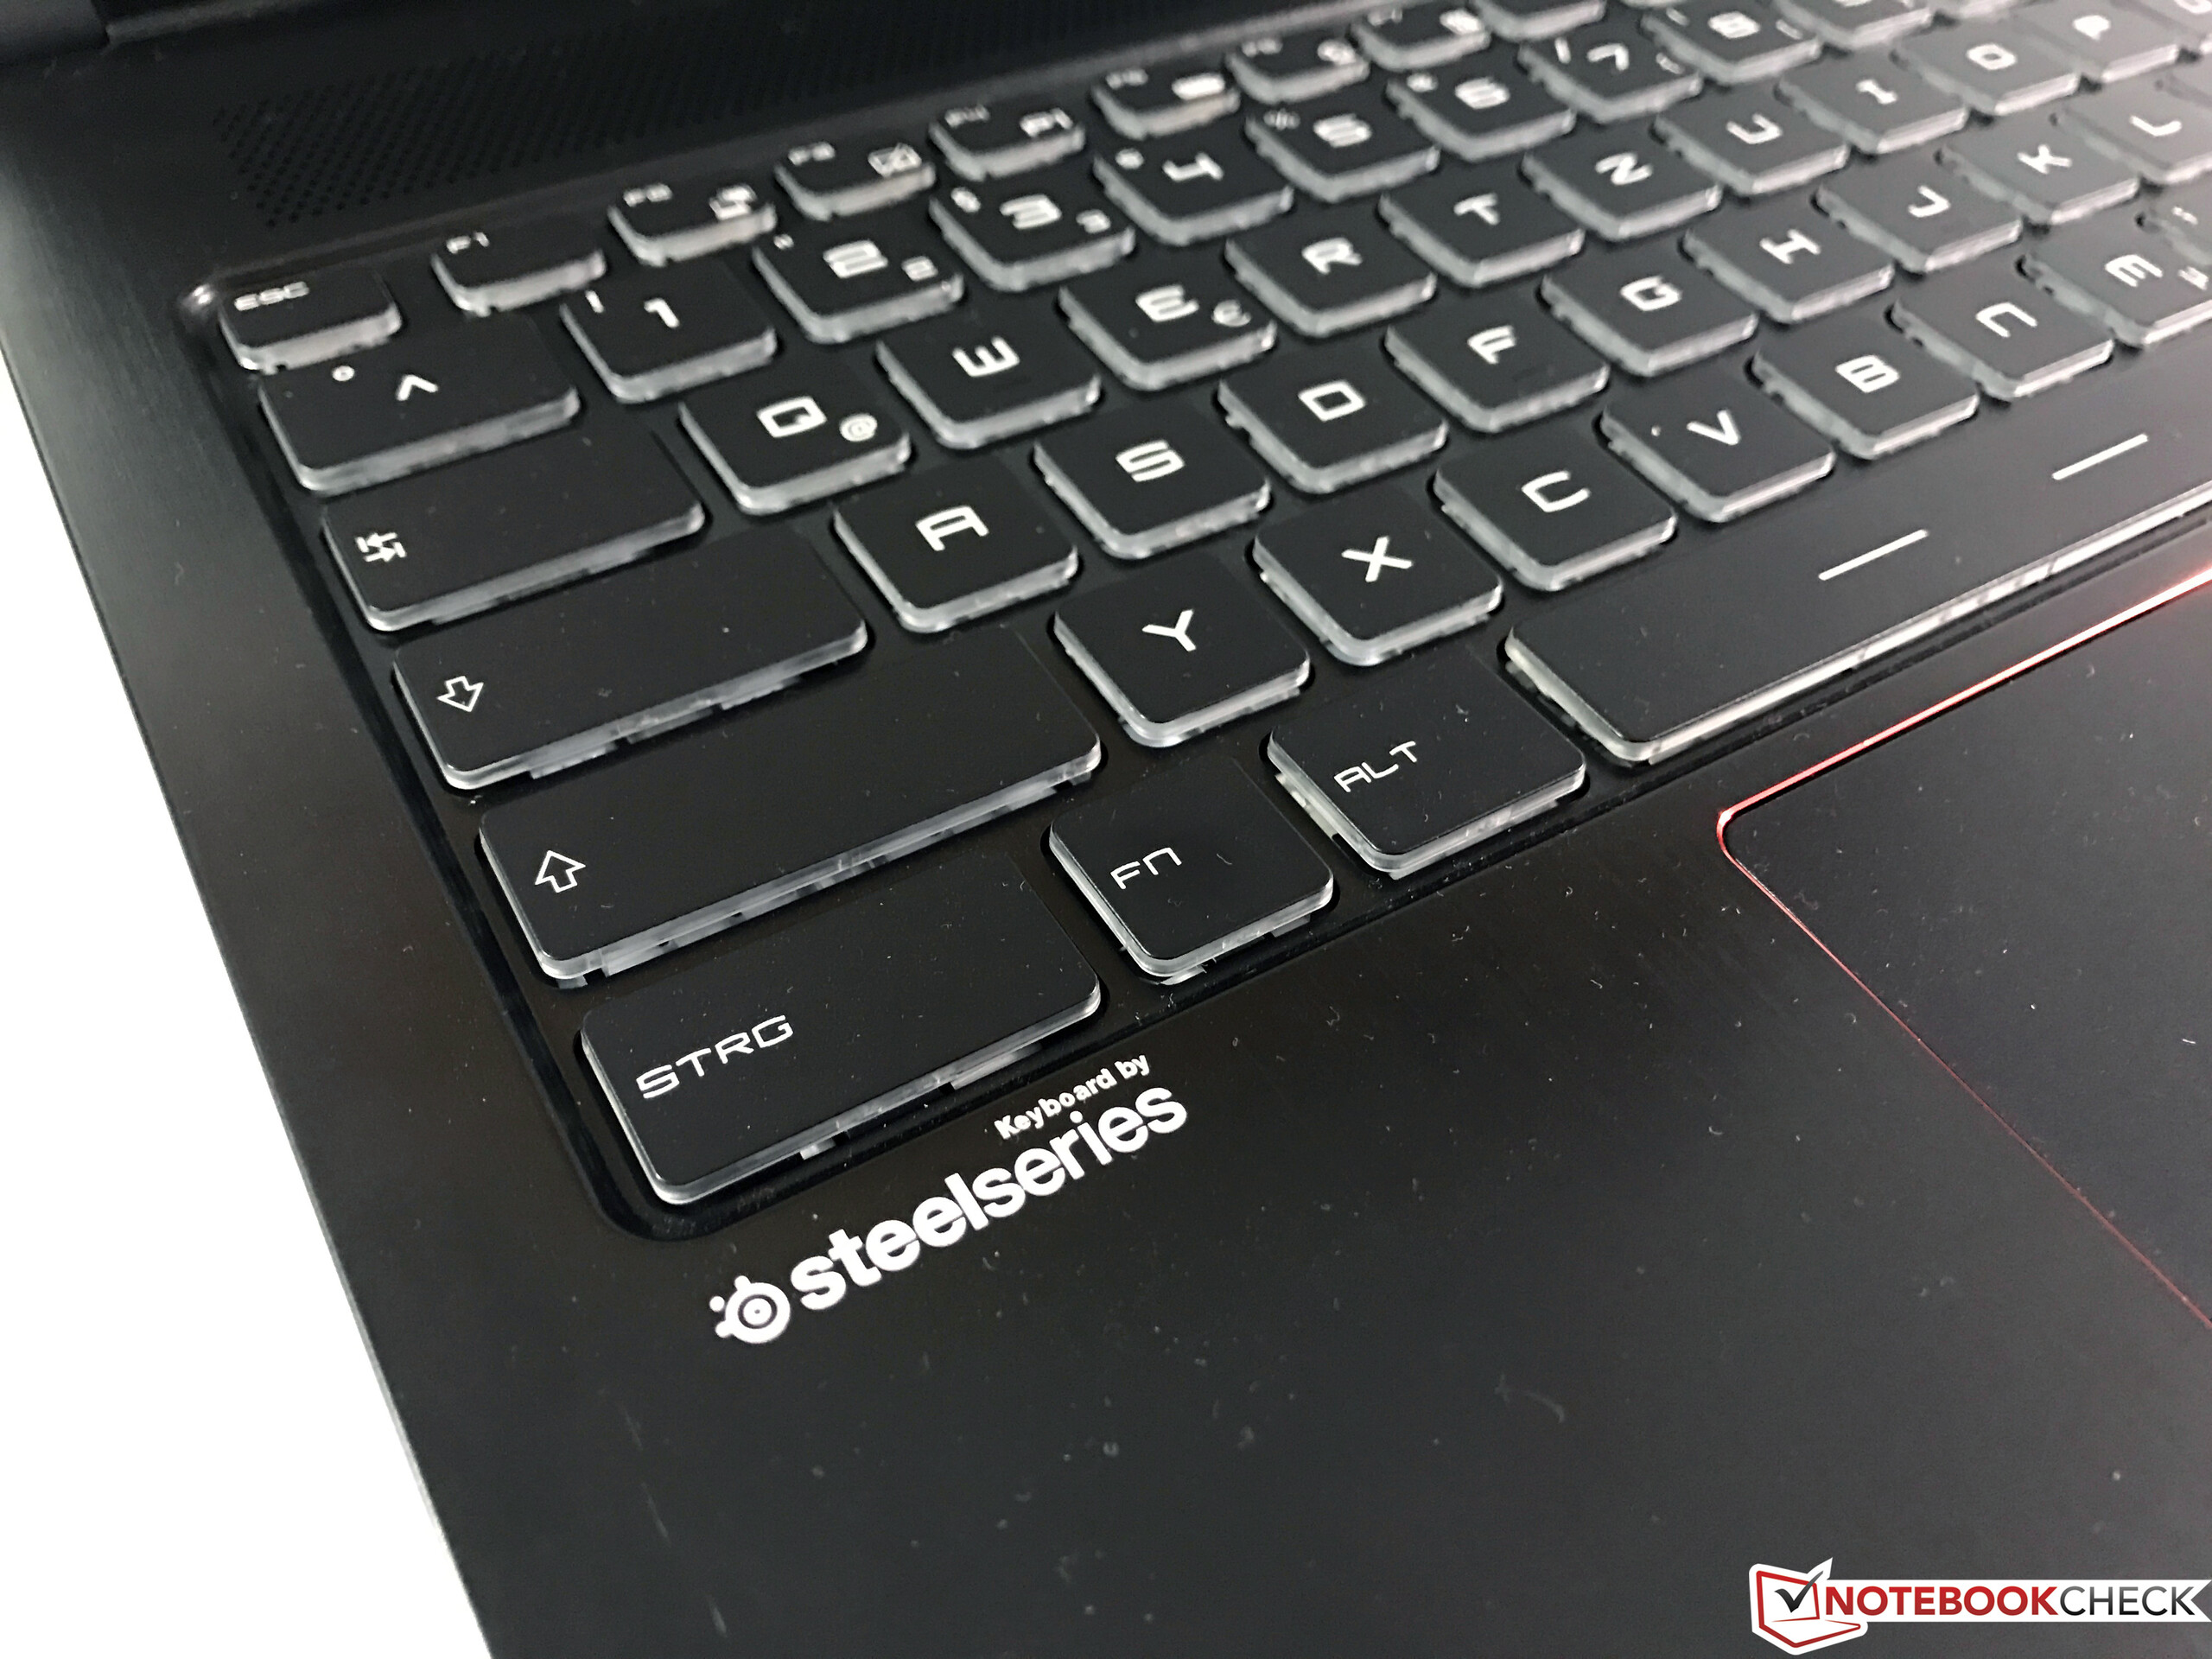
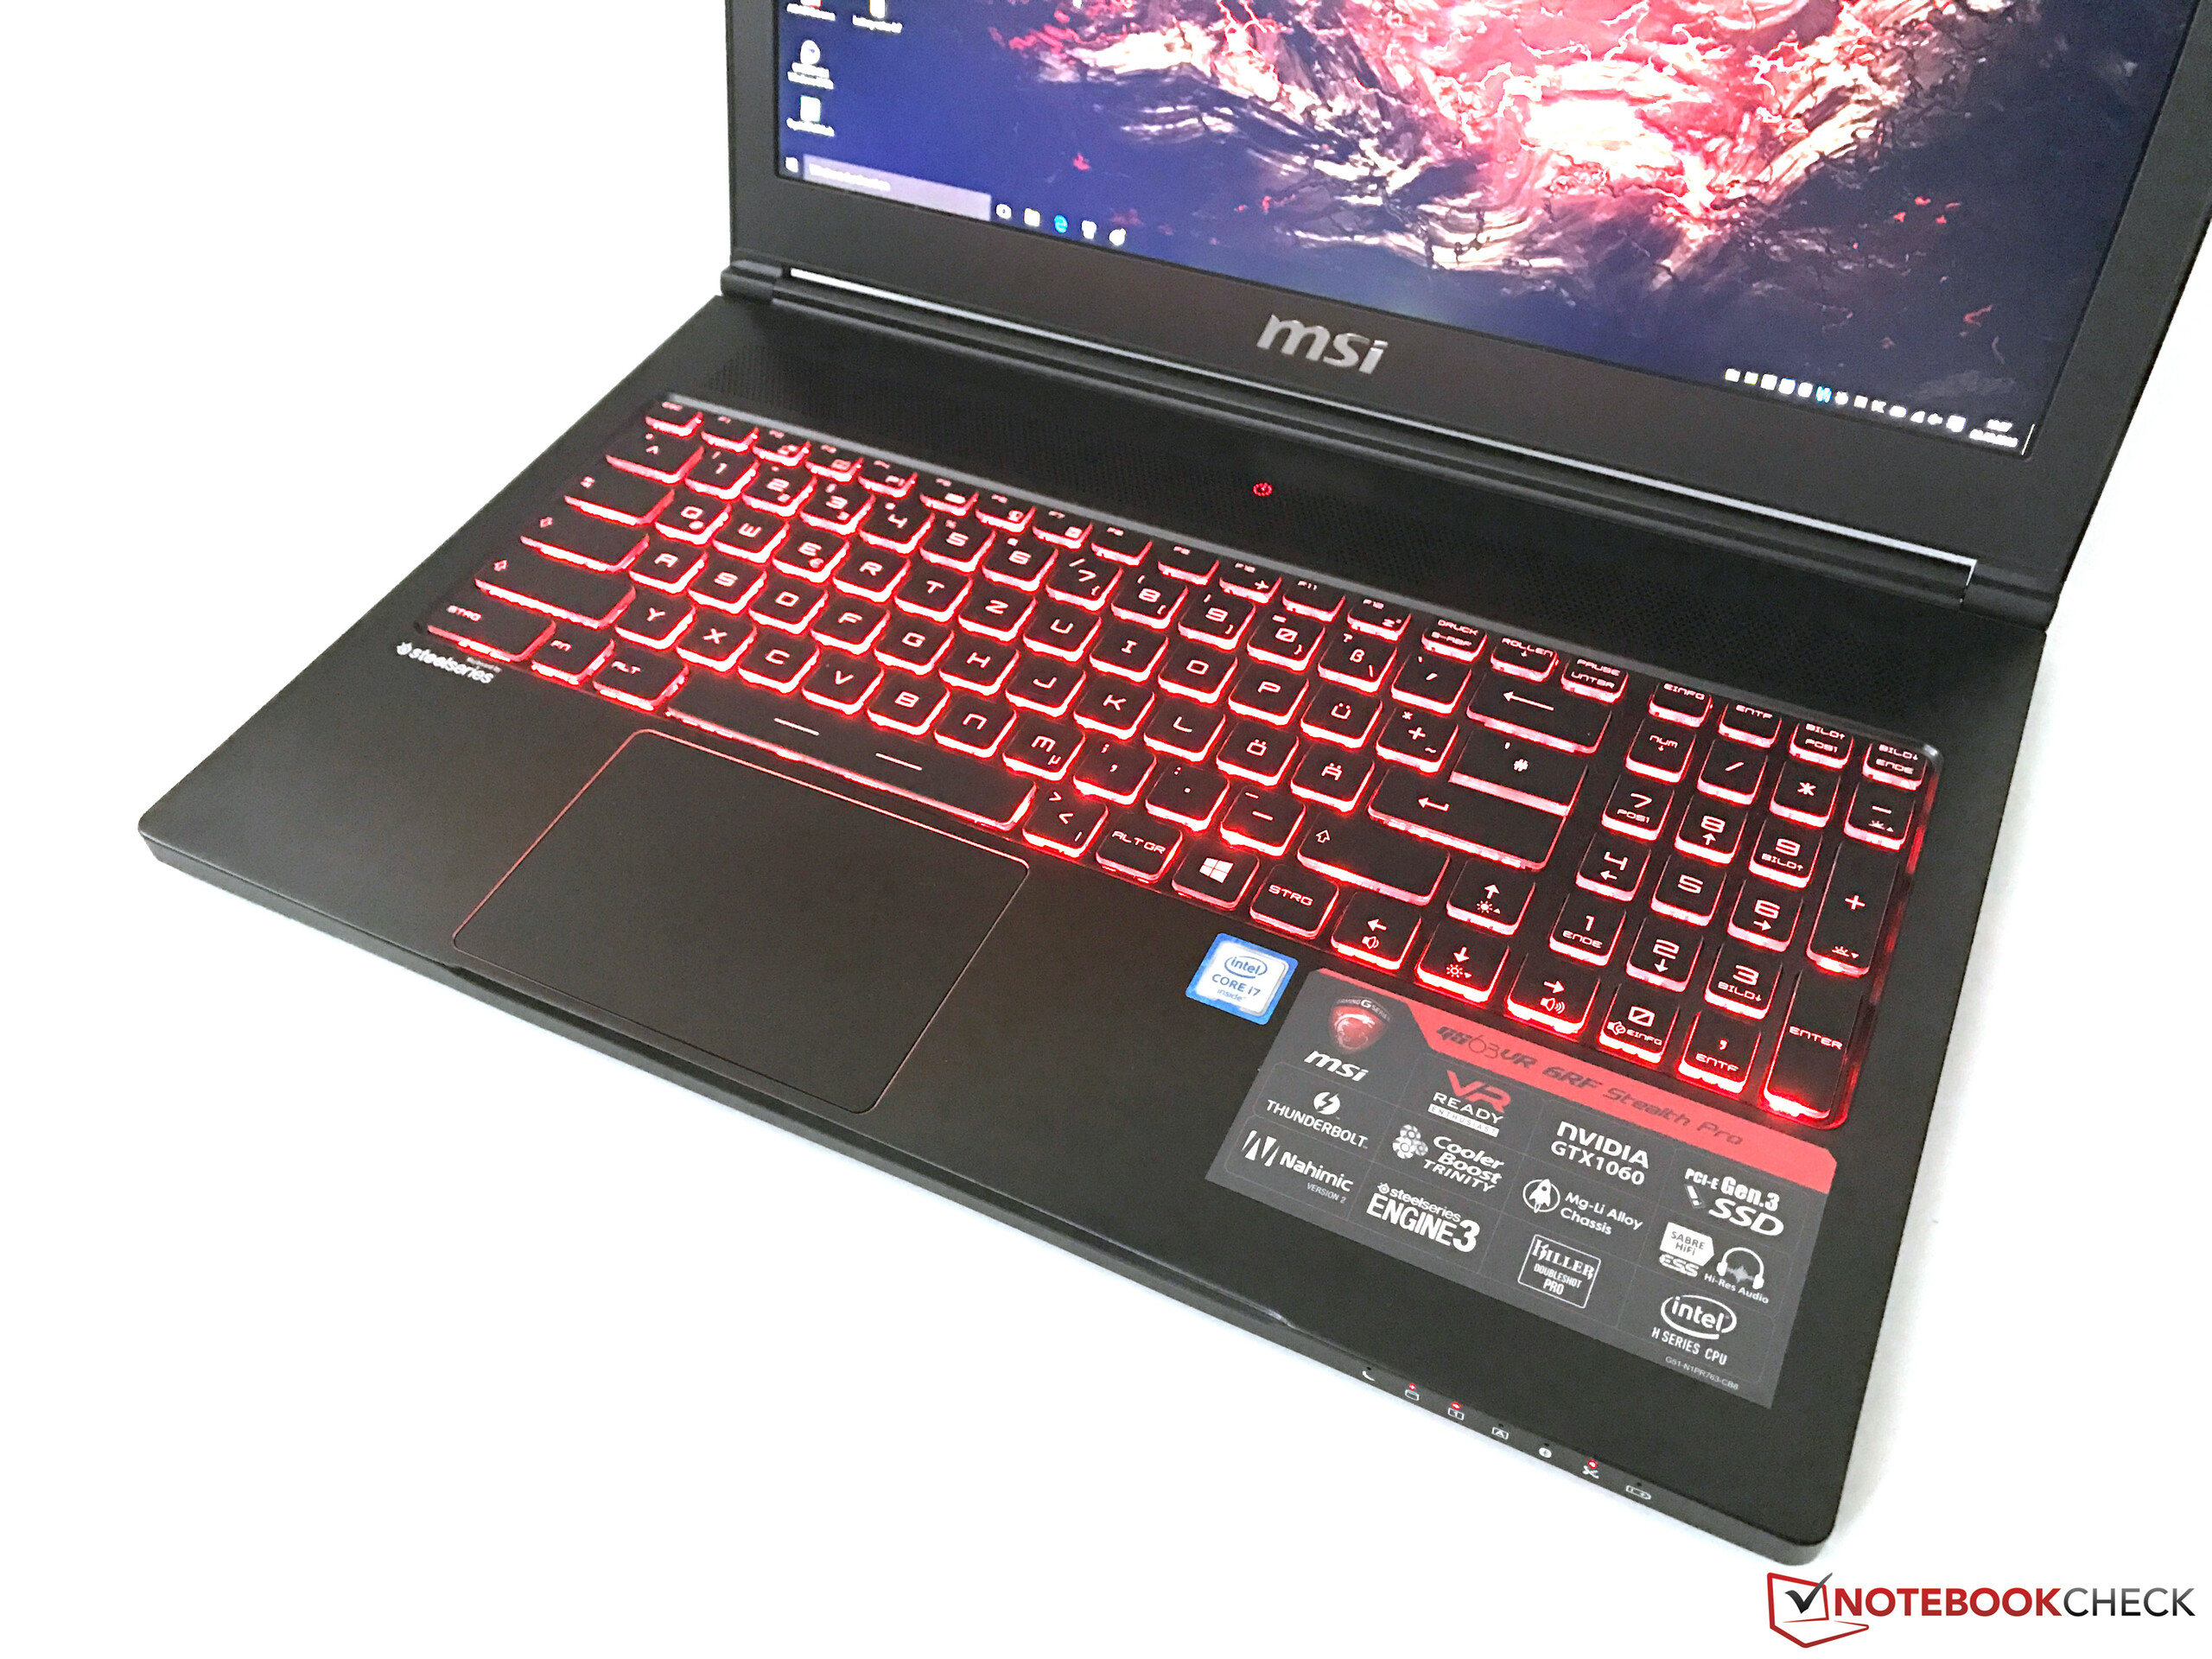
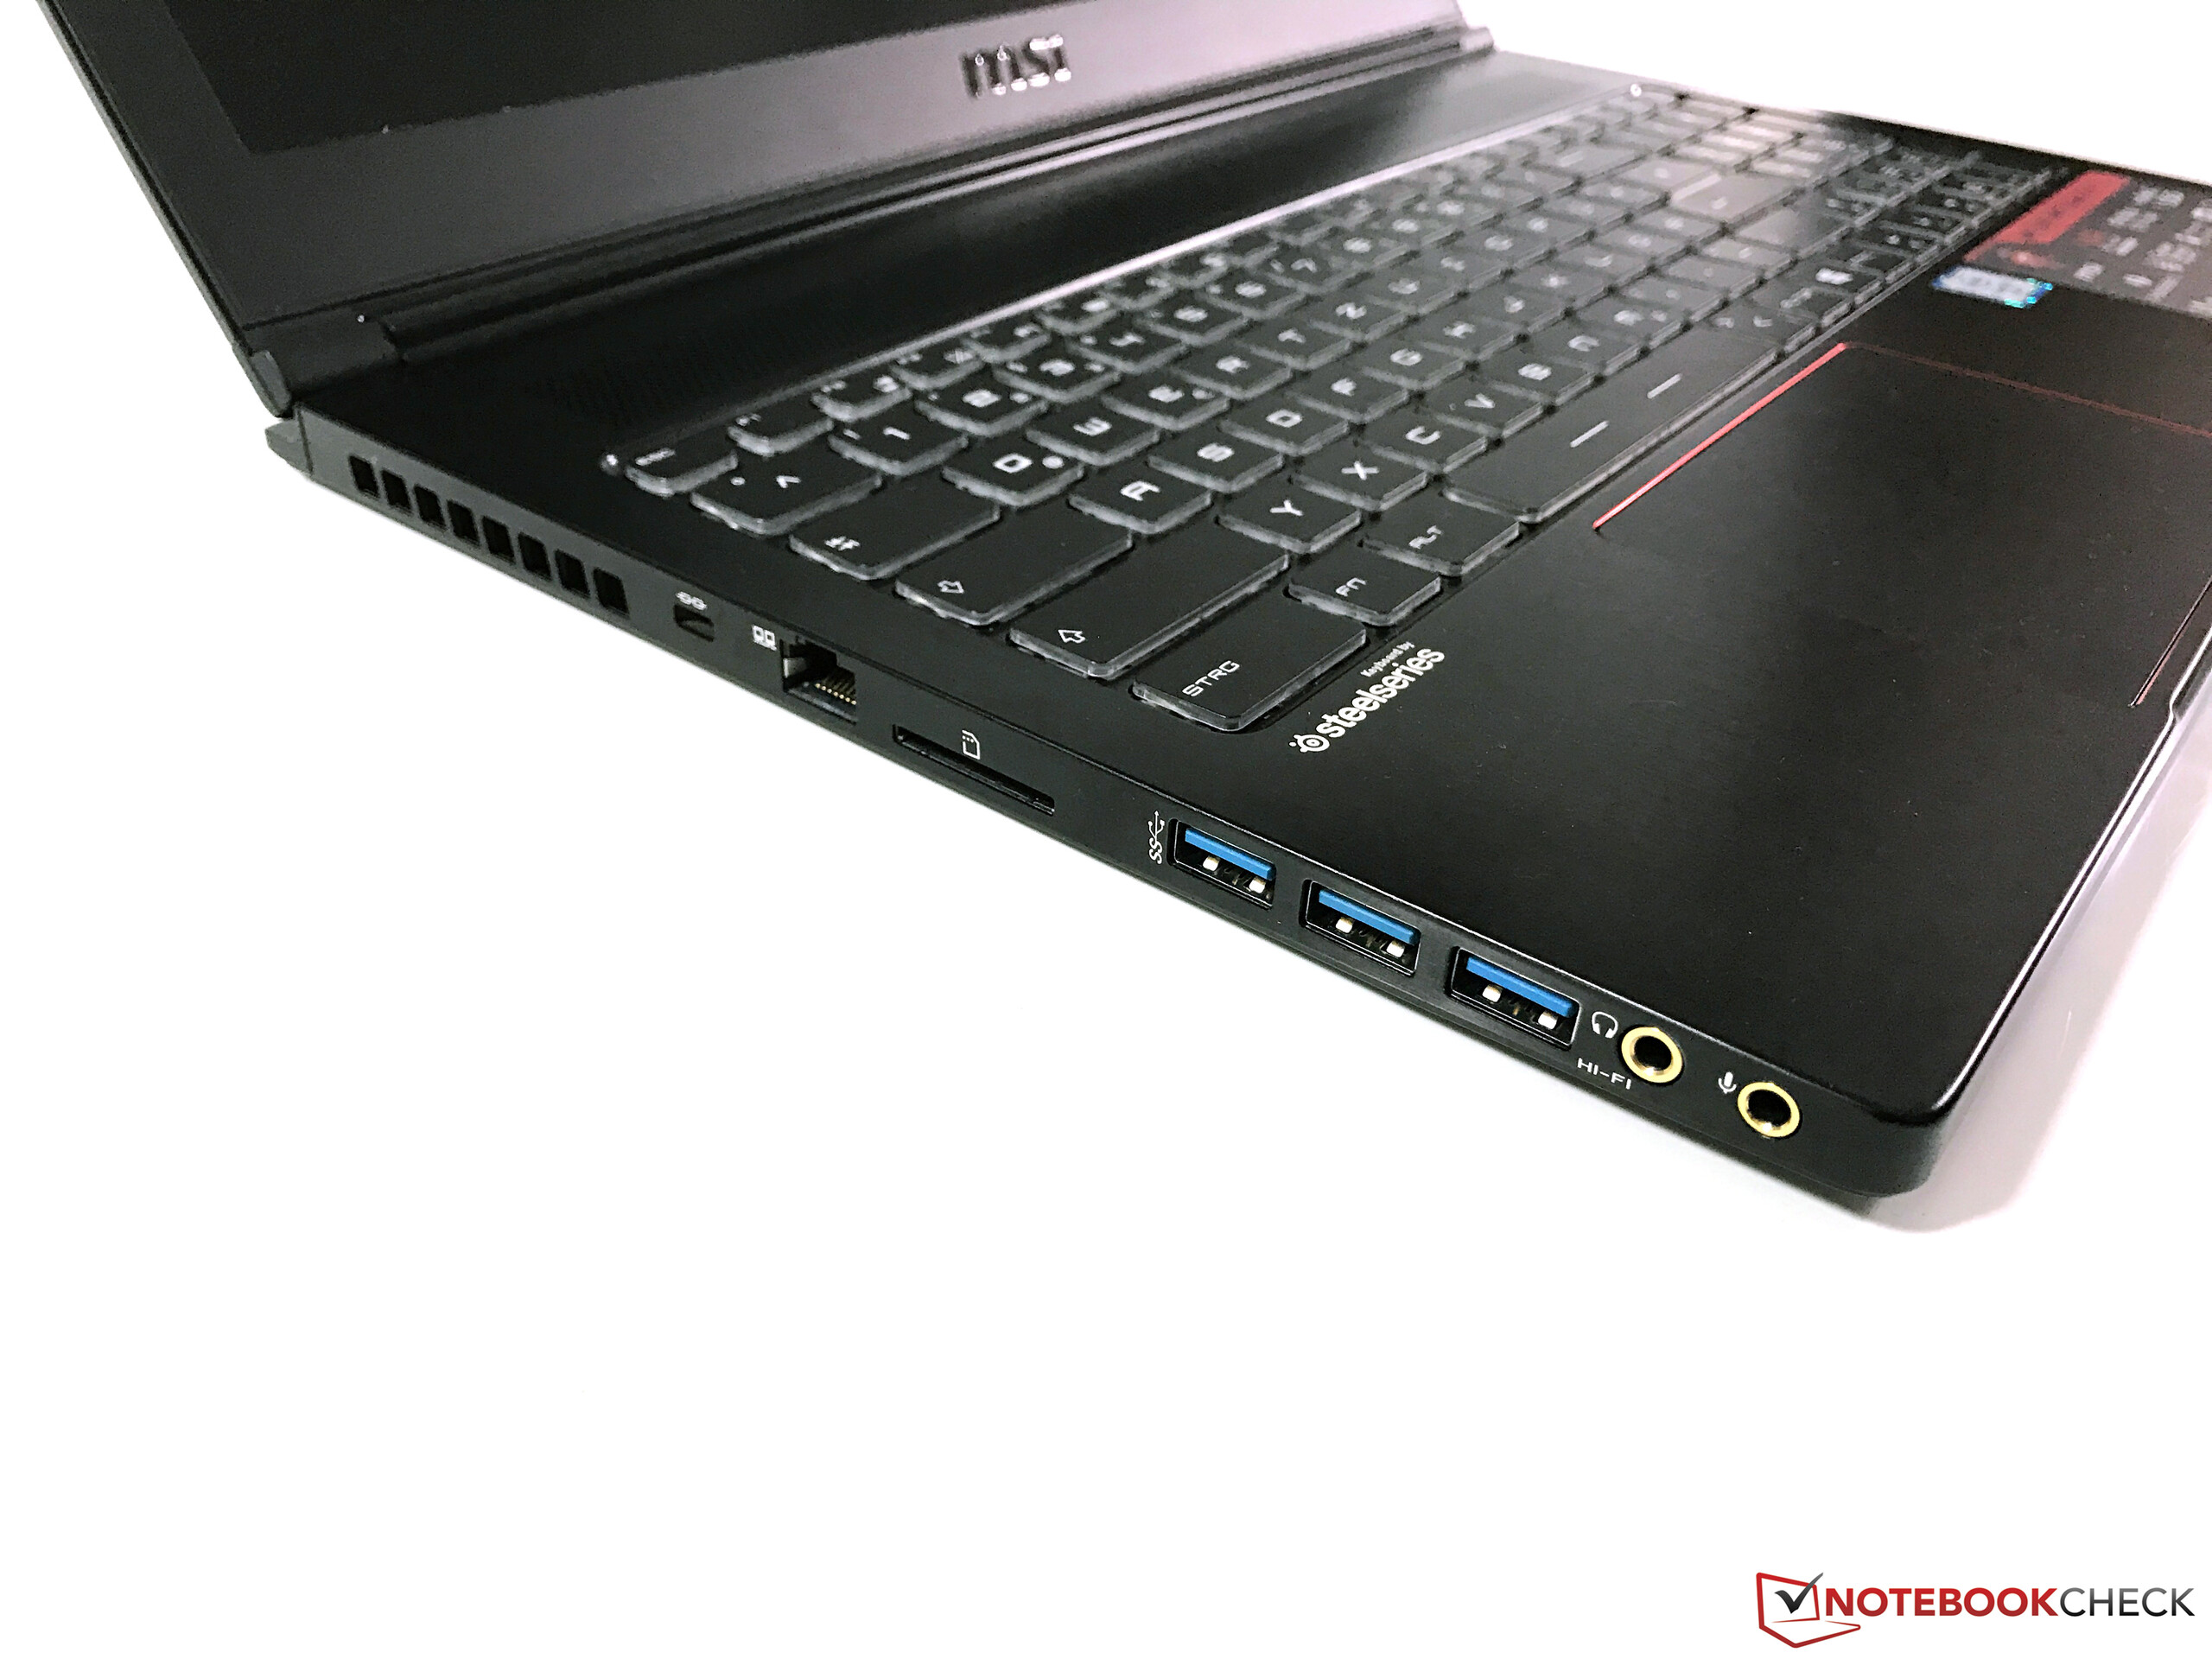
A a MSI também cria um pacote conveniente: bom chassi, painel Full HD com potencial, portas modernas e um bom teclado. Muitas das adições de software são úteis para os gamers e as outras especificações também não estão mal.
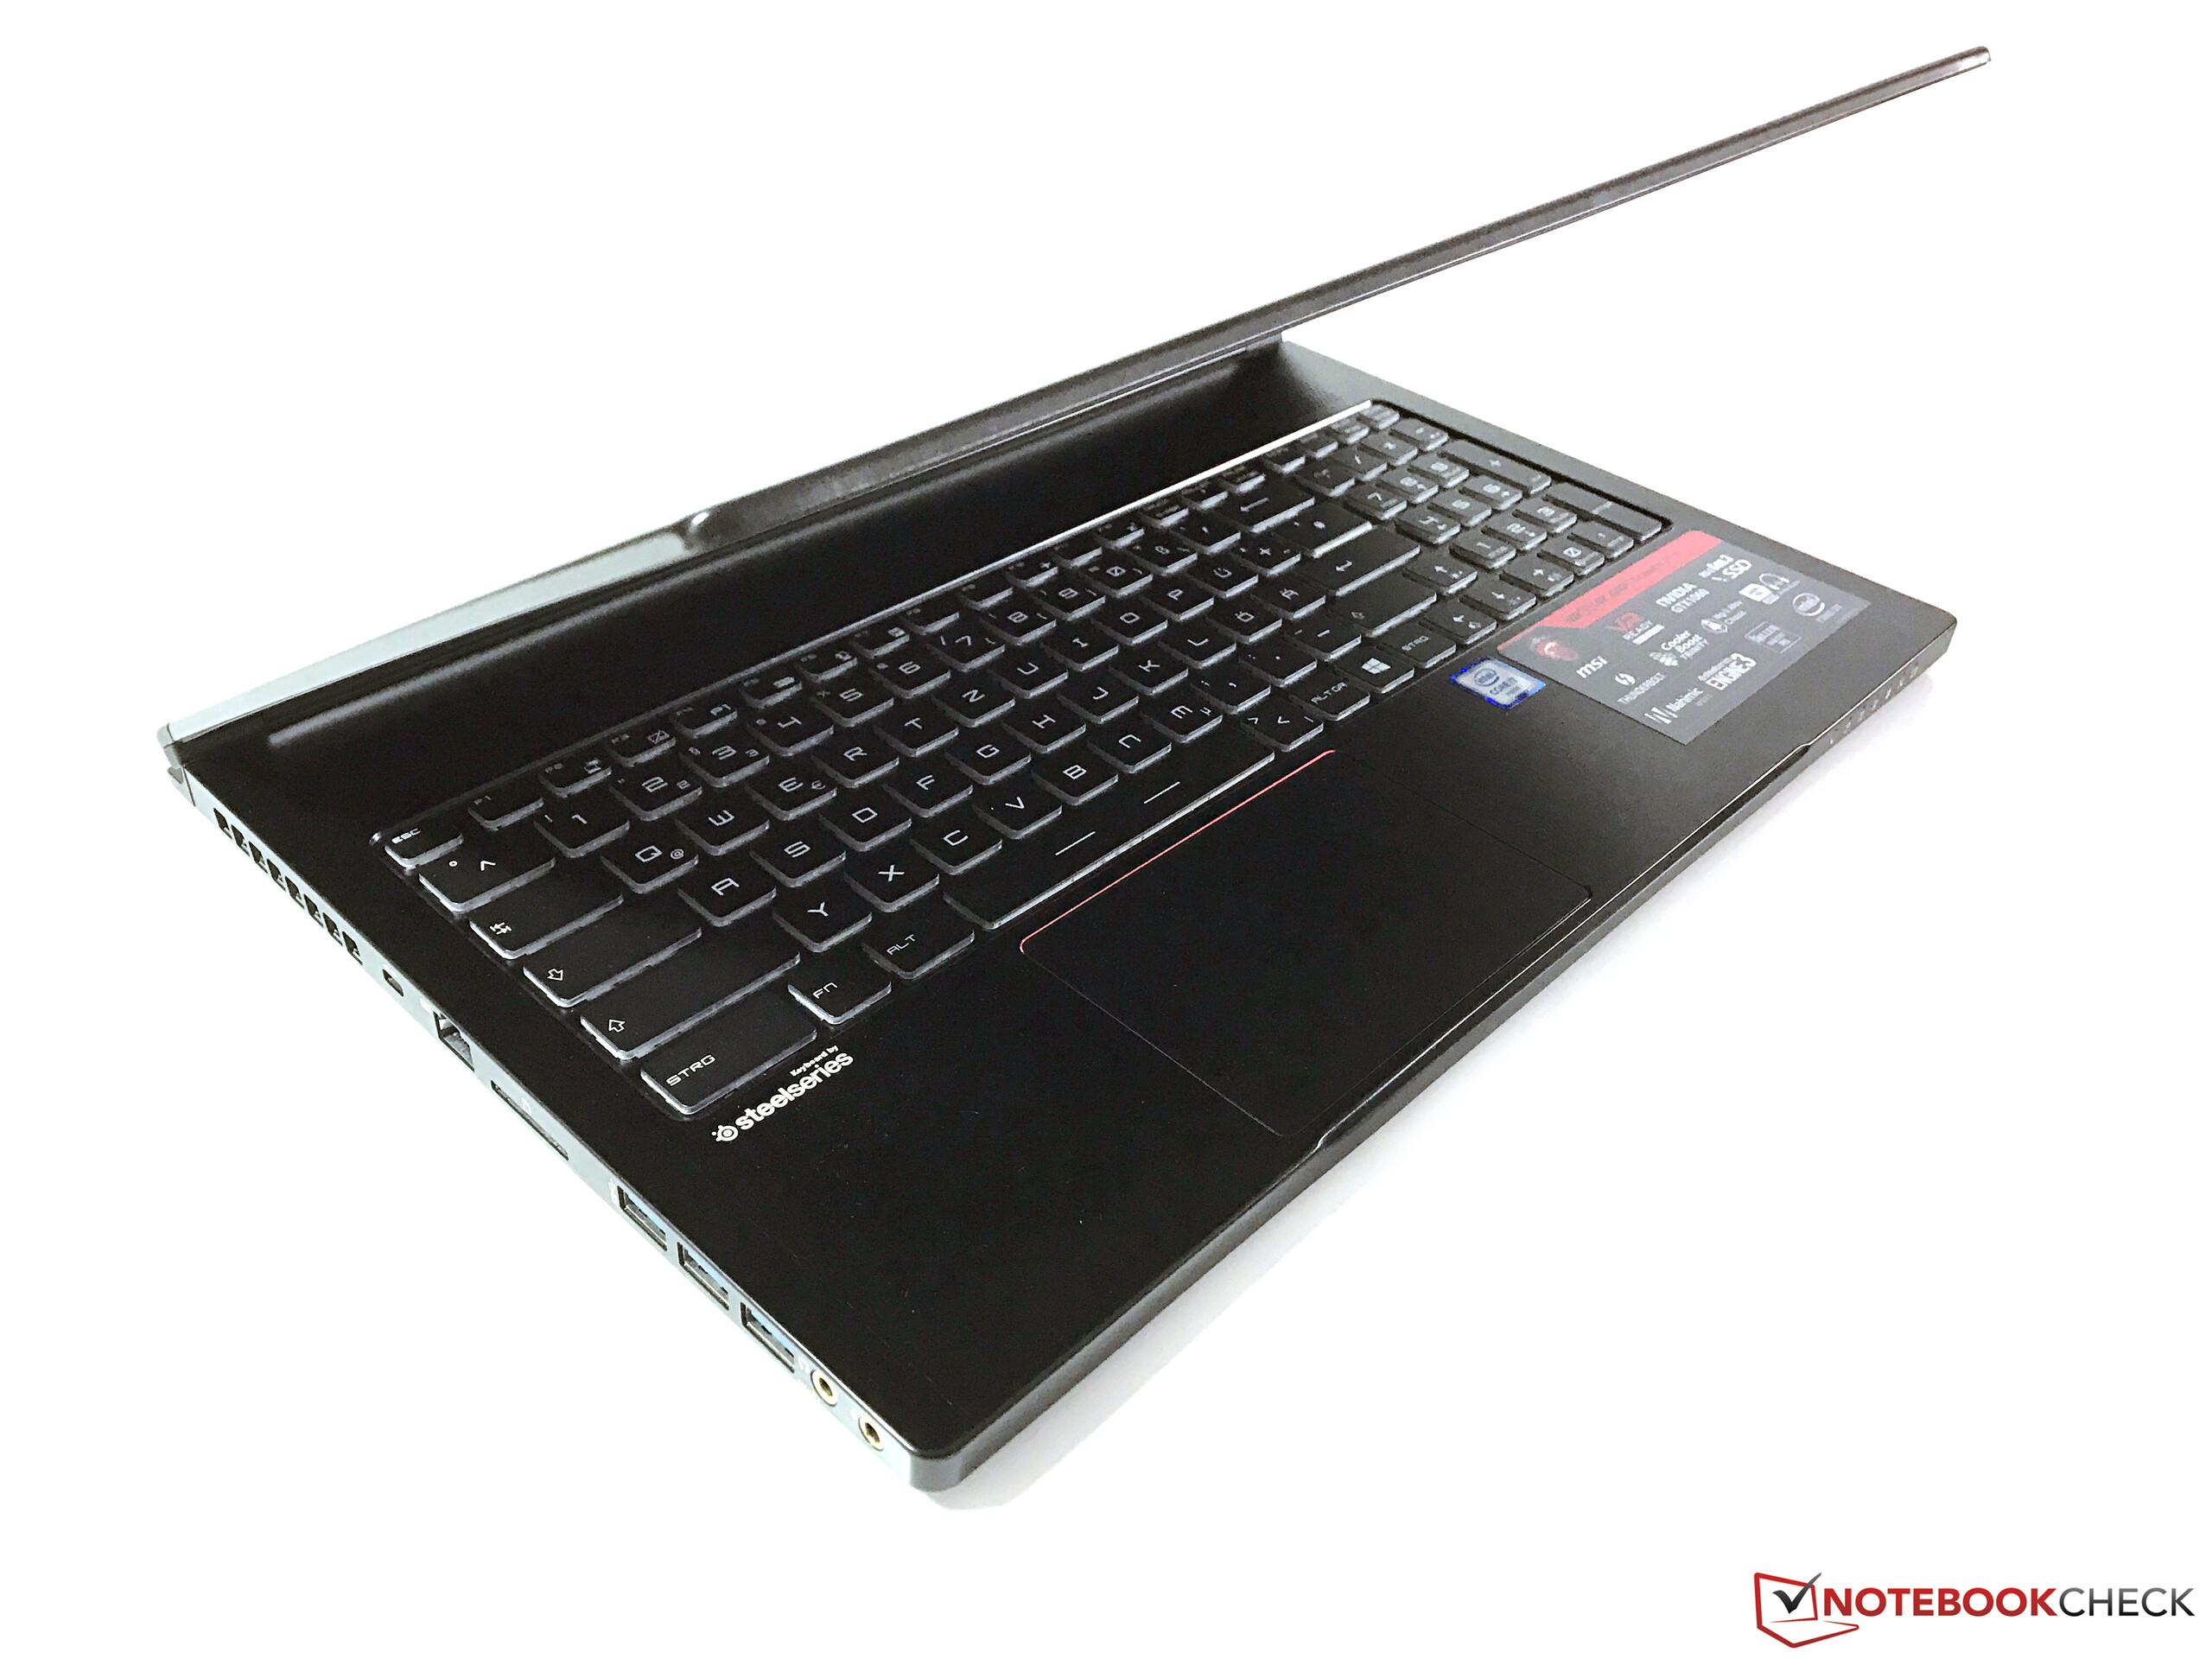
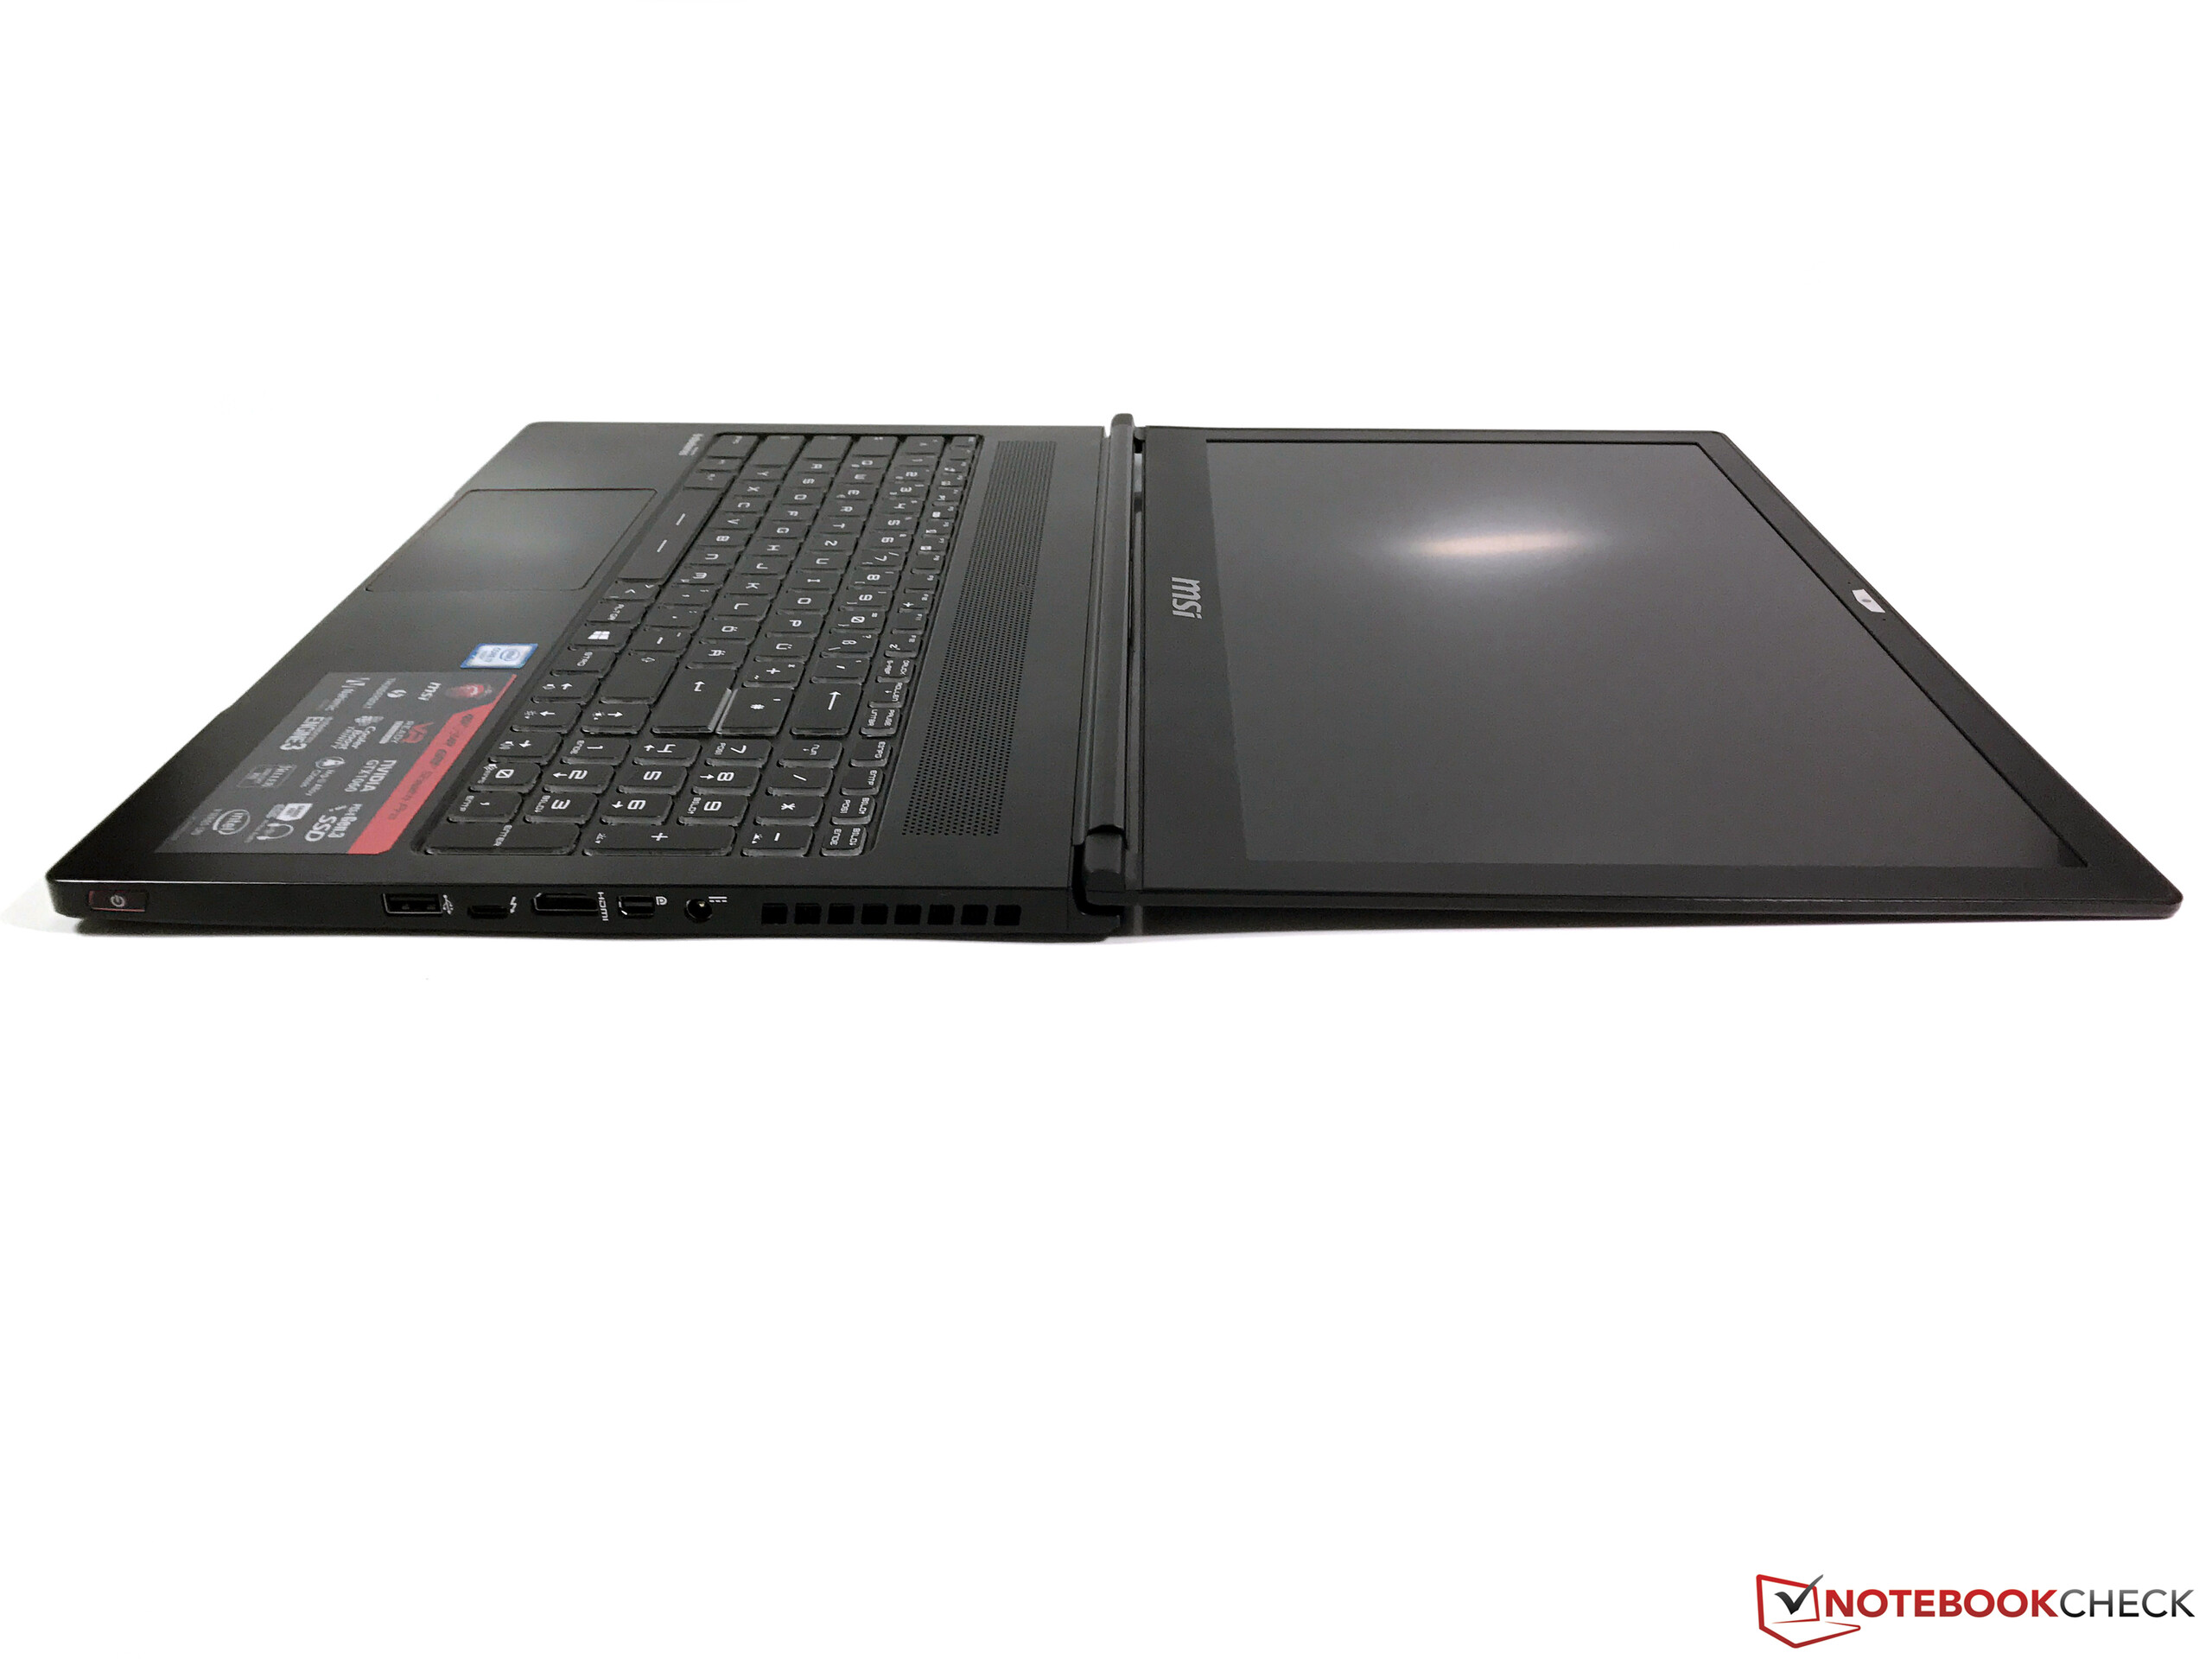
Mais desempenho em um aparelho fino atualmente não é possível. O MSI GS63VR é um dos portáteis de 15 polegadas mais finos no segmento de jogos, mas mesmo assim pode enfrentar rivais mais robustos em termos de desempenho. No entanto, as ventoinhas criam ruídos desagradáveis e as durações da bateria também não são boas.
O maior problema, exceto pelas temperaturas, é o barulho. As ventoinhas produzem um som muito desagradável sob carga e o HD é audível o tempo todo inclusive durante o modo inativo. Você deve dar uma olhada mais de perto para outras desvantagens. A estabilidade do chassi de alumínio poderia ser um pouco melhor, a tela é bastante escura e imprecisa de fábrica, as durações da bateria são medíocres, apesar dos gráficos alternantes e os alto falantes também não são um destaque. Um resfriamento melhor também melhoraria o desempenho gráfico ainda mais. Mesmo assim: Se estiver procurando um portátil fino com muito desempenho e deseja jogar com fones, o GS63VR deveria estar em sua lista.
MSI GS63VR-6RF16H22 Stealth Pro
-
10/18/2016 v5.1(old)
Andreas Osthoff
Pricecompare
