 Deutsch
 English
 Español
 Français
 Italiano
 Nederlands
 Polski
 Português
 Русский
 Türkçe
 Svenska
 Chinese
 Magyar
Breve Análise do Portátil Dell XPS 15 2017 9560 (7300HQ, Full-HD)
| SD Card Reader | |
| average JPG Copy Test (av. of 3 runs) | |
| Dell XPS 15 2017 9560 (7300HQ, Full-HD) | |
| maximum AS SSD Seq Read Test (1GB) | |
| Dell XPS 15 2017 9560 (7300HQ, Full-HD) | |
| |||||||||||||||||||||||||
iluminação: 89 %
iluminação com acumulador: 400 cd/m²
Contraste: 1538:1 (Preto: 0.26 cd/m²)
ΔE Color 4.9 | 0.5-29.43 Ø5
ΔE Greyscale 7.2 | 0.57-98 Ø5.3
98.9% sRGB (Argyll 1.6.3 3D)
64.2% AdobeRGB 1998 (Argyll 1.6.3 3D)
70.9% AdobeRGB 1998 (Argyll 2.2.0 3D)
98.9% sRGB (Argyll 2.2.0 3D)
68.9% Display P3 (Argyll 2.2.0 3D)
Gamma: 2.11
| Dell XPS 15 2017 9560 (7300HQ, Full-HD) Sharp SHP1453 LQ156M1, , 1920x1080, 15.60 | Dell XPS 13 9360 FHD i5 Sharp SHP1449 LQ133M1, , 1920x1080, 13.30 | Apple MacBook Pro 15 2016 (2.9 GHz, 460) Apple APPA030, , 2880x1800, 15.40 | Asus Zenbook UX510UW-CN044T LG Philips LP156WF6-SPB6, , 1920x1080, 15.60 | Dell XPS 15 9550 i7 FHD 1920x1080, 15.60 | Dell XPS 15-9550 i7 SHARP LQ156D1JX01 Dell PN: 7PHPT, , 3840x2160, 15.60 | |
|---|---|---|---|---|---|---|
| Display | -28% | 23% | -16% | -1% | 23% | |
| Display P3 Coverage | 68.9 | 48.94 -29% | 99 44% | 61.5 -11% | 68.5 -1% | 87.8 27% |
| sRGB Coverage | 98.9 | 73.3 -26% | 100 1% | 80.4 -19% | 97.2 -2% | 100 1% |
| AdobeRGB 1998 Coverage | 70.9 | 50.5 -29% | 87.3 23% | 58.8 -17% | 70.4 -1% | 99.4 40% |
| Response Times | 38% | 4% | 38% | -7% | 13% | |
| Response Time Grey 50% / Grey 80% * | 54 ? | 32.8 ? 39% | 46 ? 15% | 40 ? 26% | 64 ? -19% | 58 ? -7% |
| Response Time Black / White * | 52.4 ? | 33.2 ? 37% | 56 ? -7% | 26 ? 50% | 50 ? 5% | 35 ? 33% |
| PWM Frequency | 119000 ? | |||||
| Screen | -6% | 16% | -14% | -3% | -5% | |
| Brightness middle | 400 | 351.2 -12% | 420 5% | 326 -18% | 371.5 -7% | 361 -10% |
| Brightness | 392 | 325 -17% | 401 2% | 316 -19% | 356 -9% | 344 -12% |
| Brightness Distribution | 89 | 89 0% | 90 1% | 80 -10% | 92 3% | 90 1% |
| Black Level * | 0.26 | 0.195 25% | 0.3 -15% | 0.35 -35% | 0.252 3% | 0.38 -46% |
| Contrast | 1538 | 1801 17% | 1400 -9% | 931 -39% | 1474 -4% | 950 -38% |
| Colorchecker dE 2000 * | 4.9 | 7.4 -51% | 3.33 32% | 5.49 -12% | 5.55 -13% | 5.34 -9% |
| Colorchecker dE 2000 max. * | 11 | 9.08 17% | 5.11 54% | 11.36 -3% | 10.95 -0% | |
| Greyscale dE 2000 * | 7.2 | 6.71 7% | 2.73 62% | 4.84 33% | 7.1 1% | 4.84 33% |
| Gamma | 2.11 104% | 2.74 80% | 2.48 89% | 2.23 99% | 2.1 105% | 2.21 100% |
| CCT | 6911 94% | 7222 90% | 6457 101% | 5971 109% | 7395 88% | |
| Color Space (Percent of AdobeRGB 1998) | 64.2 | 50.48 -21% | 78.09 22% | 53 -17% | 63.4 -1% | 89 39% |
| Color Space (Percent of sRGB) | 98.9 | 73.31 -26% | 99.97 1% | 80 -19% | 97.9 -1% | 100 1% |
| Total Average (Program / Settings) | 1% /
-5% | 14% /
15% | 3% /
-7% | -4% /
-3% | 10% /
4% |
* ... smaller is better
Display Response Times
| ↔ Response Time Black to White | ||
|---|---|---|
| 52.4 ms ... rise ↗ and fall ↘ combined | ↗ 33.2 ms rise |  |
| ↘ 19.2 ms fall | ||
| The screen shows slow response rates in our tests and will be unsatisfactory for gamers. In comparison, all tested devices range from 0.1 (minimum) to 240 (maximum) ms. » 99 % of all devices are better. This means that the measured response time is worse than the average of all tested devices (21.5 ms). | ||
| ↔ Response Time 50% Grey to 80% Grey | ||
| 54 ms ... rise ↗ and fall ↘ combined | ↗ 33.2 ms rise |  |
| ↘ 20 ms fall | ||
| The screen shows slow response rates in our tests and will be unsatisfactory for gamers. In comparison, all tested devices range from 0.2 (minimum) to 636 (maximum) ms. » 89 % of all devices are better. This means that the measured response time is worse than the average of all tested devices (33.7 ms). | ||
Screen Flickering / PWM (Pulse-Width Modulation)
| Screen flickering / PWM not detected |  | ||
In comparison: 53 % of all tested devices do not use PWM to dim the display. If PWM was detected, an average of 17924 (minimum: 5 - maximum: 3846000) Hz was measured. | |||

| Dell XPS 15 2017 9560 (7300HQ, Full-HD) WDC WD10SPCX-75KHST0 + SanDisk Z400s M.2 2242 32 GB Cache | Dell XPS 13 9360 FHD i5 Toshiba NVMe THNSN5256GPUK | Apple MacBook Pro 15 2016 (2.9 GHz, 460) Apple SSD SM1024L | Asus Zenbook UX510UW-CN044T SanDisk SD8SNAT256G1002 | Dell XPS 15 9550 i7 FHD Samsung PM951 NVMe 512 GB | Dell XPS 15-9550 i7 Samsung PM951 NVMe 512 GB | |
|---|---|---|---|---|---|---|
| CrystalDiskMark 3.0 | 4538% | 7627% | 3855% | 6213% | 4766% | |
| Read Seq | 123 | 1233 902% | 1458 1085% | 459.3 273% | 1291 950% | 1274 936% |
| Write Seq | 74.2 | 733 888% | 1440 1841% | 325.5 339% | 590 695% | 594 701% |
| Read 512 | 101.7 | 1036 919% | 914 799% | 279.2 175% | 632 521% | 674 563% |
| Write 512 | 42.51 | 439.9 935% | 1058 2389% | 280.1 559% | 588 1283% | 596 1302% |
| Read 4k | 10.84 | 29.31 170% | 9.786 -10% | 22.43 107% | 41.4 282% | 37.02 242% |
| Write 4k | 1.021 | 116.9 11350% | 10.9 968% | 74.9 7236% | 132.4 12868% | 129.7 12603% |
| Read 4k QD32 | 69.8 | 479.2 587% | 679 873% | 149 113% | 542 677% | 457.9 556% |
| Write 4k QD32 | 1.057 | 218.3 20553% | 562 53069% | 234 22038% | 343.8 32426% | 225.4 21225% |

| 3DMark 11 - 1280x720 Performance GPU | |
| Dell XPS 15 2017 9560 (7300HQ, Full-HD) | |
| Apple MacBook Pro 15 2016 (2.9 GHz, 460) | |
| Dell XPS 15-9550 i7 | |
| Asus Zenbook UX510UW-CN044T | |
| Dell XPS 13 9360 FHD i5 | |
| 3DMark 11 Performance | 7504 pontos | |
| 3DMark Cloud Gate Standard Score | 14758 pontos | |
| 3DMark Fire Strike Score | 5458 pontos | |
| 3DMark Fire Strike Extreme Score | 2715 pontos | |
Ajuda | ||
Barulho
| Ocioso |
| 31.6 / 31.6 / 33.4 dB |
| HDD |
| 31.6 dB |
| Carga |
| 47.8 / 47.8 dB |
 | ||
30 dB silencioso 40 dB(A) audível 50 dB(A) ruidosamente alto |
||
min: | ||
Dell XPS 15 2017 9560 (7300HQ, Full-HD) audio analysis
(+) | speakers can play relatively loud (87 dB)
Bass 100 - 315 Hz
(-) | nearly no bass - on average 15.8% lower than median
(±) | linearity of bass is average (13.9% delta to prev. frequency)
Mids 400 - 2000 Hz
(+) | balanced mids - only 4.3% away from median
(±) | linearity of mids is average (7.1% delta to prev. frequency)
Highs 2 - 16 kHz
(+) | balanced highs - only 3.1% away from median
(±) | linearity of highs is average (7.9% delta to prev. frequency)
Overall 100 - 16.000 Hz
(+) | overall sound is linear (13.5% difference to median)
Compared to same class
» 21% of all tested devices in this class were better, 5% similar, 74% worse
» The best had a delta of 5%, average was 18%, worst was 45%
Compared to all devices tested
» 11% of all tested devices were better, 3% similar, 86% worse
» The best had a delta of 4%, average was 25%, worst was 134%
Apple MacBook 12 (Early 2016) 1.1 GHz audio analysis
(+) | speakers can play relatively loud (83.6 dB)
Bass 100 - 315 Hz
(±) | reduced bass - on average 11.3% lower than median
(±) | linearity of bass is average (14.2% delta to prev. frequency)
Mids 400 - 2000 Hz
(+) | balanced mids - only 2.4% away from median
(+) | mids are linear (5.5% delta to prev. frequency)
Highs 2 - 16 kHz
(+) | balanced highs - only 2% away from median
(+) | highs are linear (4.5% delta to prev. frequency)
Overall 100 - 16.000 Hz
(+) | overall sound is linear (10.2% difference to median)
Compared to same class
» 5% of all tested devices in this class were better, 2% similar, 93% worse
» The best had a delta of 5%, average was 19%, worst was 53%
Compared to all devices tested
» 3% of all tested devices were better, 1% similar, 96% worse
» The best had a delta of 4%, average was 25%, worst was 134%
| desligado | |
| Ocioso | |
| Carga |
|
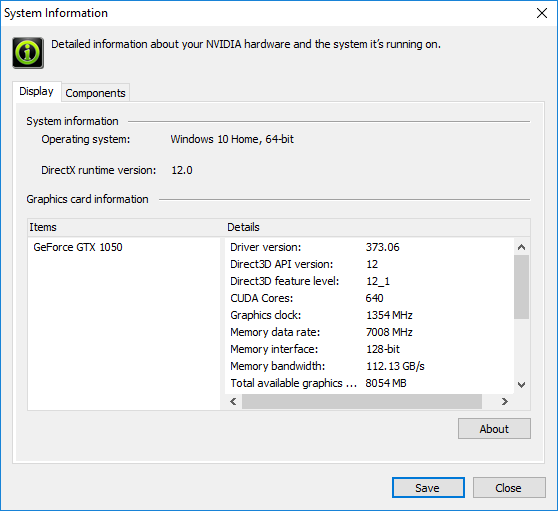
| Dell XPS 15 2017 9560 (7300HQ, Full-HD) i5-7300HQ, GeForce GTX 1050 Mobile, WDC WD10SPCX-75KHST0 + SanDisk Z400s M.2 2242 32 GB Cache, LED IGZO IPS InfinityEdge, 1920x1080, 15.60 | Dell XPS 13 9360 FHD i5 i5-7200U, HD Graphics 620, Toshiba NVMe THNSN5256GPUK, IPS, 1920x1080, 13.30 | Apple MacBook Pro 15 2016 (2.9 GHz, 460) 6920HQ, Radeon Pro 460, Apple SSD SM1024L, IPS, 2880x1800, 15.40 | Asus Zenbook UX510UW-CN044T 6500U, GeForce GTX 960M, SanDisk SD8SNAT256G1002, IPS, 1920x1080, 15.60 | Dell XPS 15 9550 i7 FHD 6700HQ, GeForce GTX 960M, Samsung PM951 NVMe 512 GB, IPS, 1920x1080, 15.60 | Dell XPS 15-9550 i7 6700HQ, GeForce GTX 960M, Samsung PM951 NVMe 512 GB, IGZO WLED 330 cd/m² 1000:1 Hard Coating 3H, 3840x2160, 15.60 | |
|---|---|---|---|---|---|---|
| Power Consumption | 58% | 13% | 14% | -67% | ||
| Idle Minimum * | 6.6 | 4.1 38% | 3 55% | 5 24% | 12.5 -89% | |
| Idle Average * | 9 | 4.2 53% | 9.9 -10% | 8.9 1% | 19.6 -118% | |
| Idle Maximum * | 10.7 | 5.1 52% | 12.5 -17% | 11.8 -10% | 22.8 -113% | |
| Load Average * | 77.5 | 22.1 71% | 70.6 9% | 55 29% | 102 -32% | |
| Load Maximum * | 130 | 29.4 77% | 90.8 30% | 93 28% | 107 18% |
* ... smaller is better
Pricecompare
