Análise do BMAX B7 Power: Um mini PC econômico com Intel Core i7 por US$ 400
O (MaxMini) B7 Power não é o primeiro dispositivo que testamos da BMAX. O BMAX MaxBook Y11 H1M6 Convertibleobteve 75 pontos percentuais em nosso teste. Também testamos um antecessor do B7 Power, o BMAX B5 Promas sem atribuir uma classificação a ele. No final de 2022, o B5 com Intel Gen8 ainda era o modelo topo de linha, mas agora o B7 Power está equipado com Intel Gen11. Isso pode não torná-lo o mais moderno, mas, por sua vez, mantém o preço bom e baixo. Atualmente, ele é vendido por pouco menos de US$ 400. A BMAX também oferece um B7 Pro com umIntel Core i5-1145G7em vez de umIntel Core i7-11390H.
O B7 Power tem que competir com outros minicomputadores. OGeekom Mini IT11é um dos candidatos com a mesma GPU, mas também analisaremos a diferença de desempenho em comparação com gerações mais recentes de GPUs, como oIntel NUC 13 Pro Kit. No meio disso, você pode encontrar oKit Intel NUC 12 Procom Intel Gen12. Outros dispositivos de comparação incluem oBeelink SEi11e o antecessor do B7 Power, oB5 Pro.
Possíveis concorrentes em comparação
Avaliação | Data | Modelo | Peso | Altura | Size | Resolução | Preço |
|---|---|---|---|---|---|---|---|
| 78.4 % v7 (old) | 09/2023 | BMAX B7 Power G7A2 i7-11390H, Iris Xe G7 96EUs | 363 g | 44 mm | x | ||
| 80.6 % v7 (old) | 07/2023 | Geekom Mini IT11, i7-11390H i7-11390H, Iris Xe G7 96EUs | 536 g | 48 mm | x | ||
| 80.8 % v7 (old) | 04/2023 | Intel NUC 13 Pro Kit NUC13ANK i7-1360P, Iris Xe G7 96EUs | 538 g | 37 mm | x | ||
v (old) | 03/2023 | Intel NUC 12 Pro Kit NUC12WSBi5 i5-1240P, Iris Xe G7 80EUs | 549 g | 45.6 mm | x | ||
v (old) | 09/2022 | Beelink SEi11 Pro i5-11320H, Iris Xe G7 96EUs | 440 g | 40 mm | x | ||
v (old) | 11/2022 | BMAX B5 Pro G7H8 i5-8260U, UHD Graphics 620 | 369 g | 43.2 mm | x |
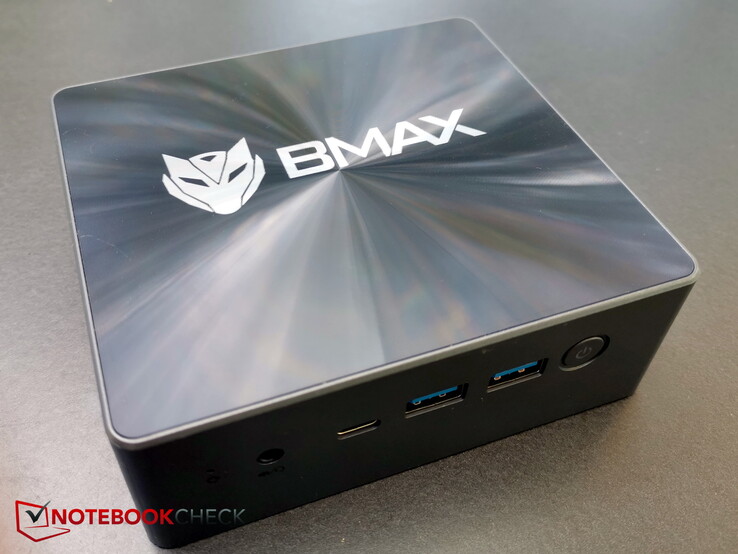
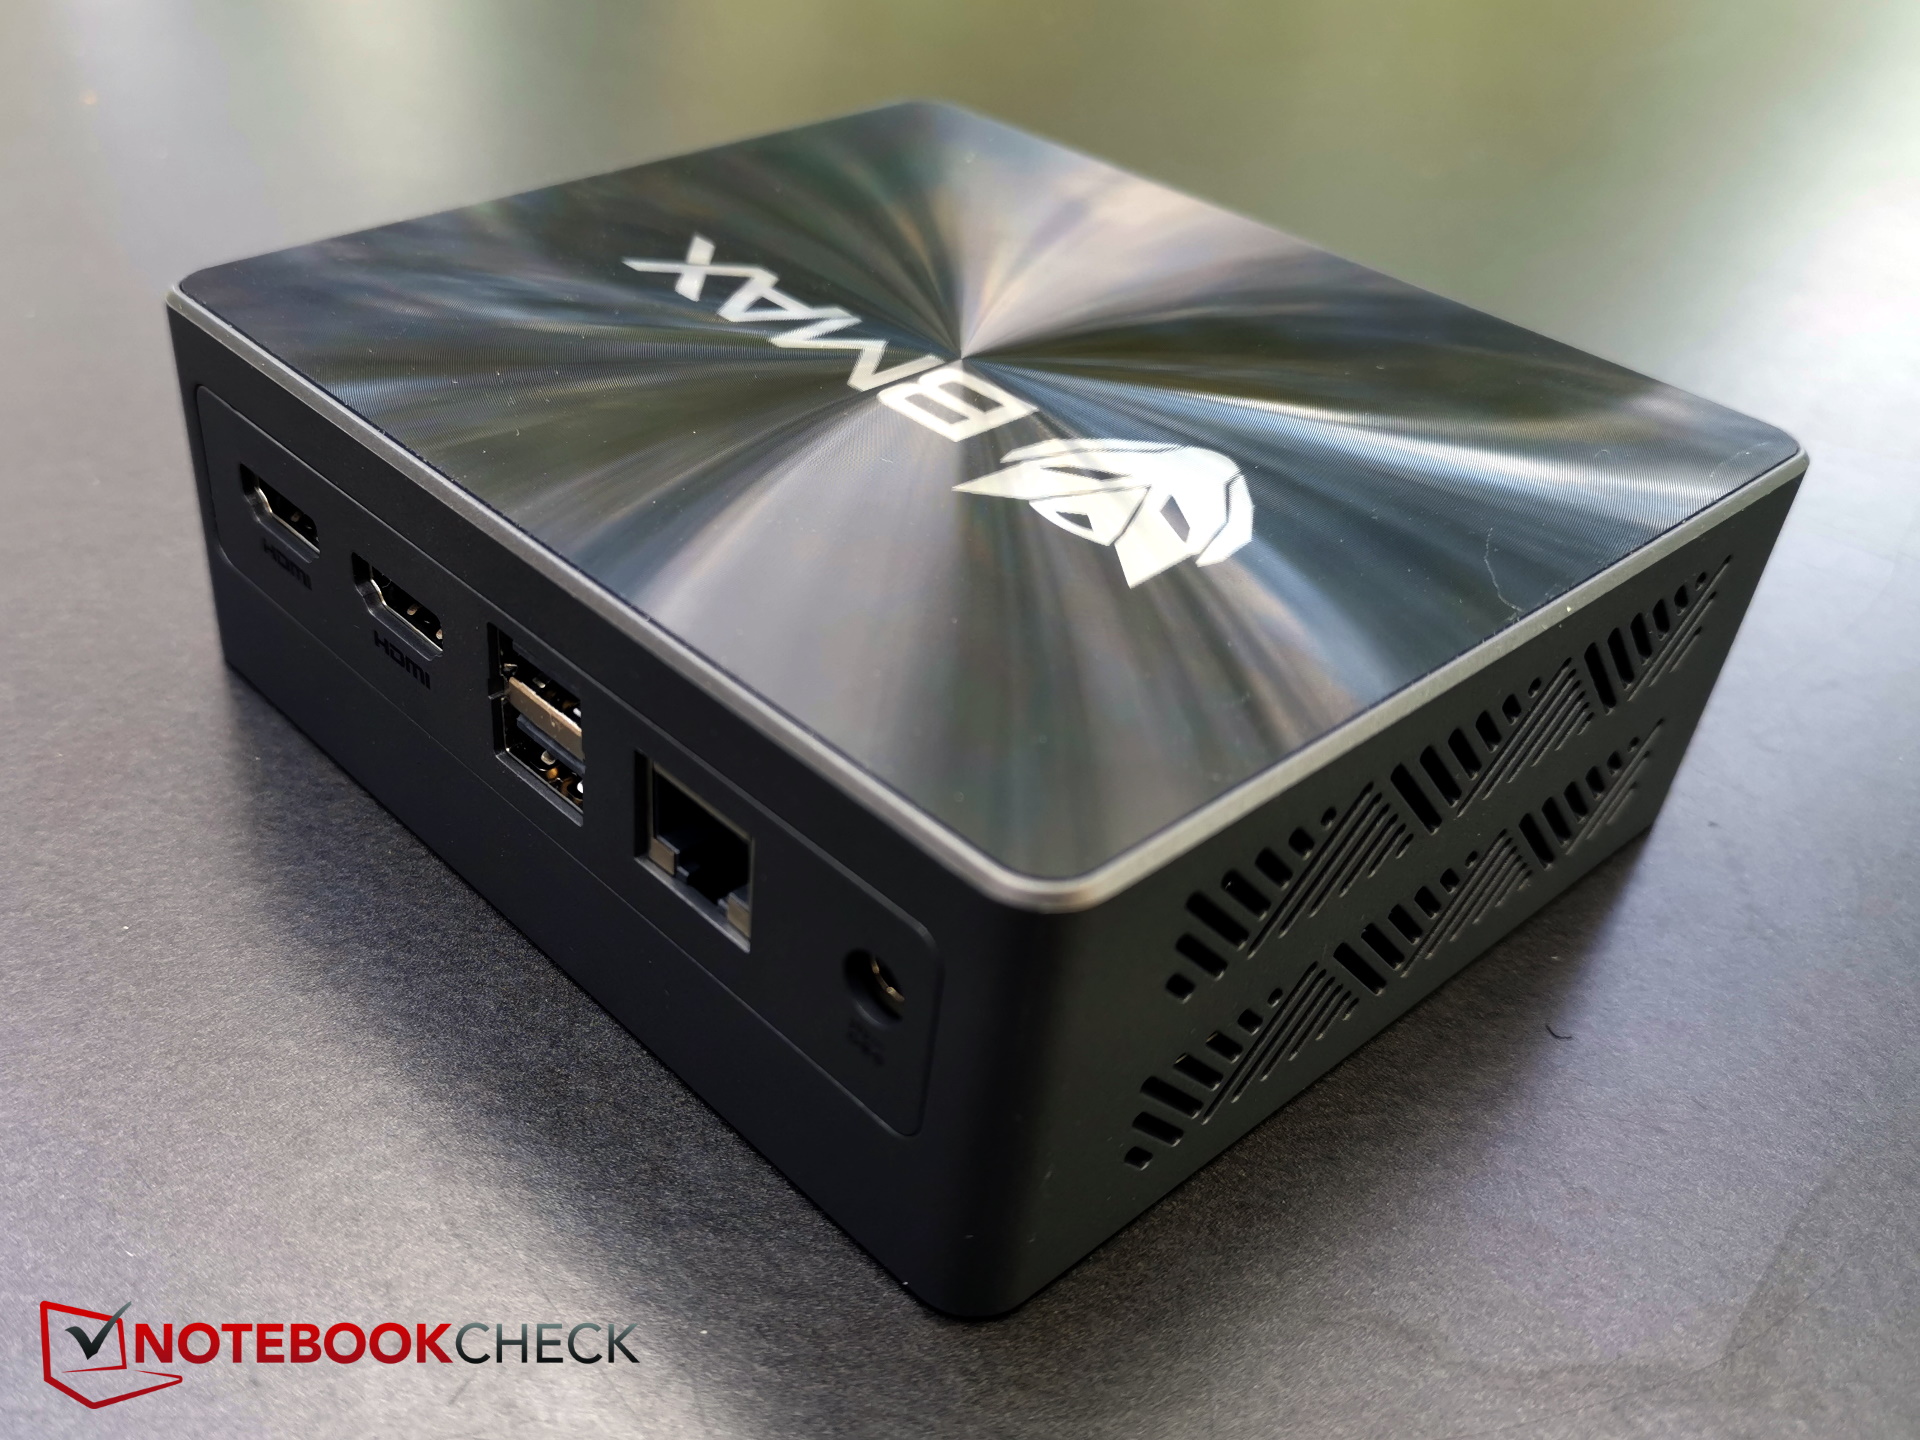
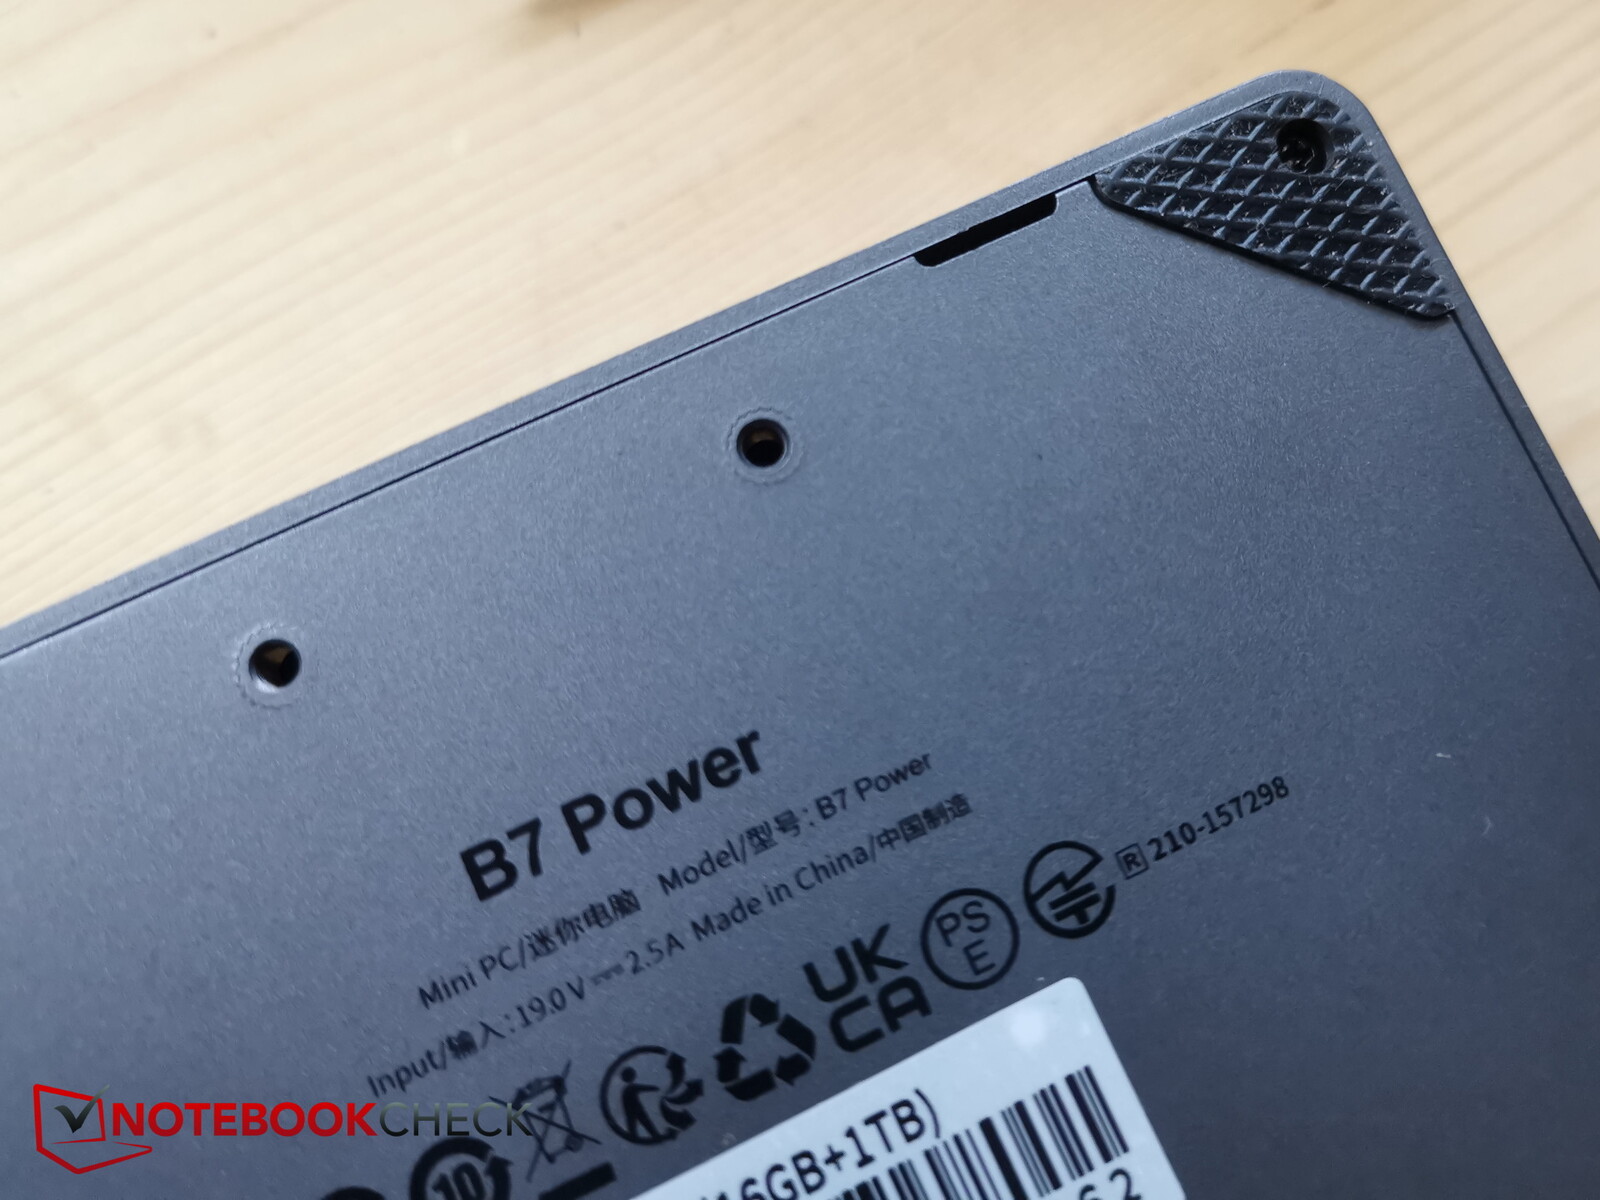
Estojo - O B7 Power é feito de plástico
O gabinete do PC é feito basicamente de plástico cinza escuro a preto. Como resultado de seu formato retangular compacto, ele ainda é bastante resistente. No entanto, você não deve tentar dobrá-lo muito, pois logo começará a ouvir o plástico rangendo. Ao mesmo tempo, o plástico confere ao dispositivo um peso baixo e agradável de apenas 363 gramas.
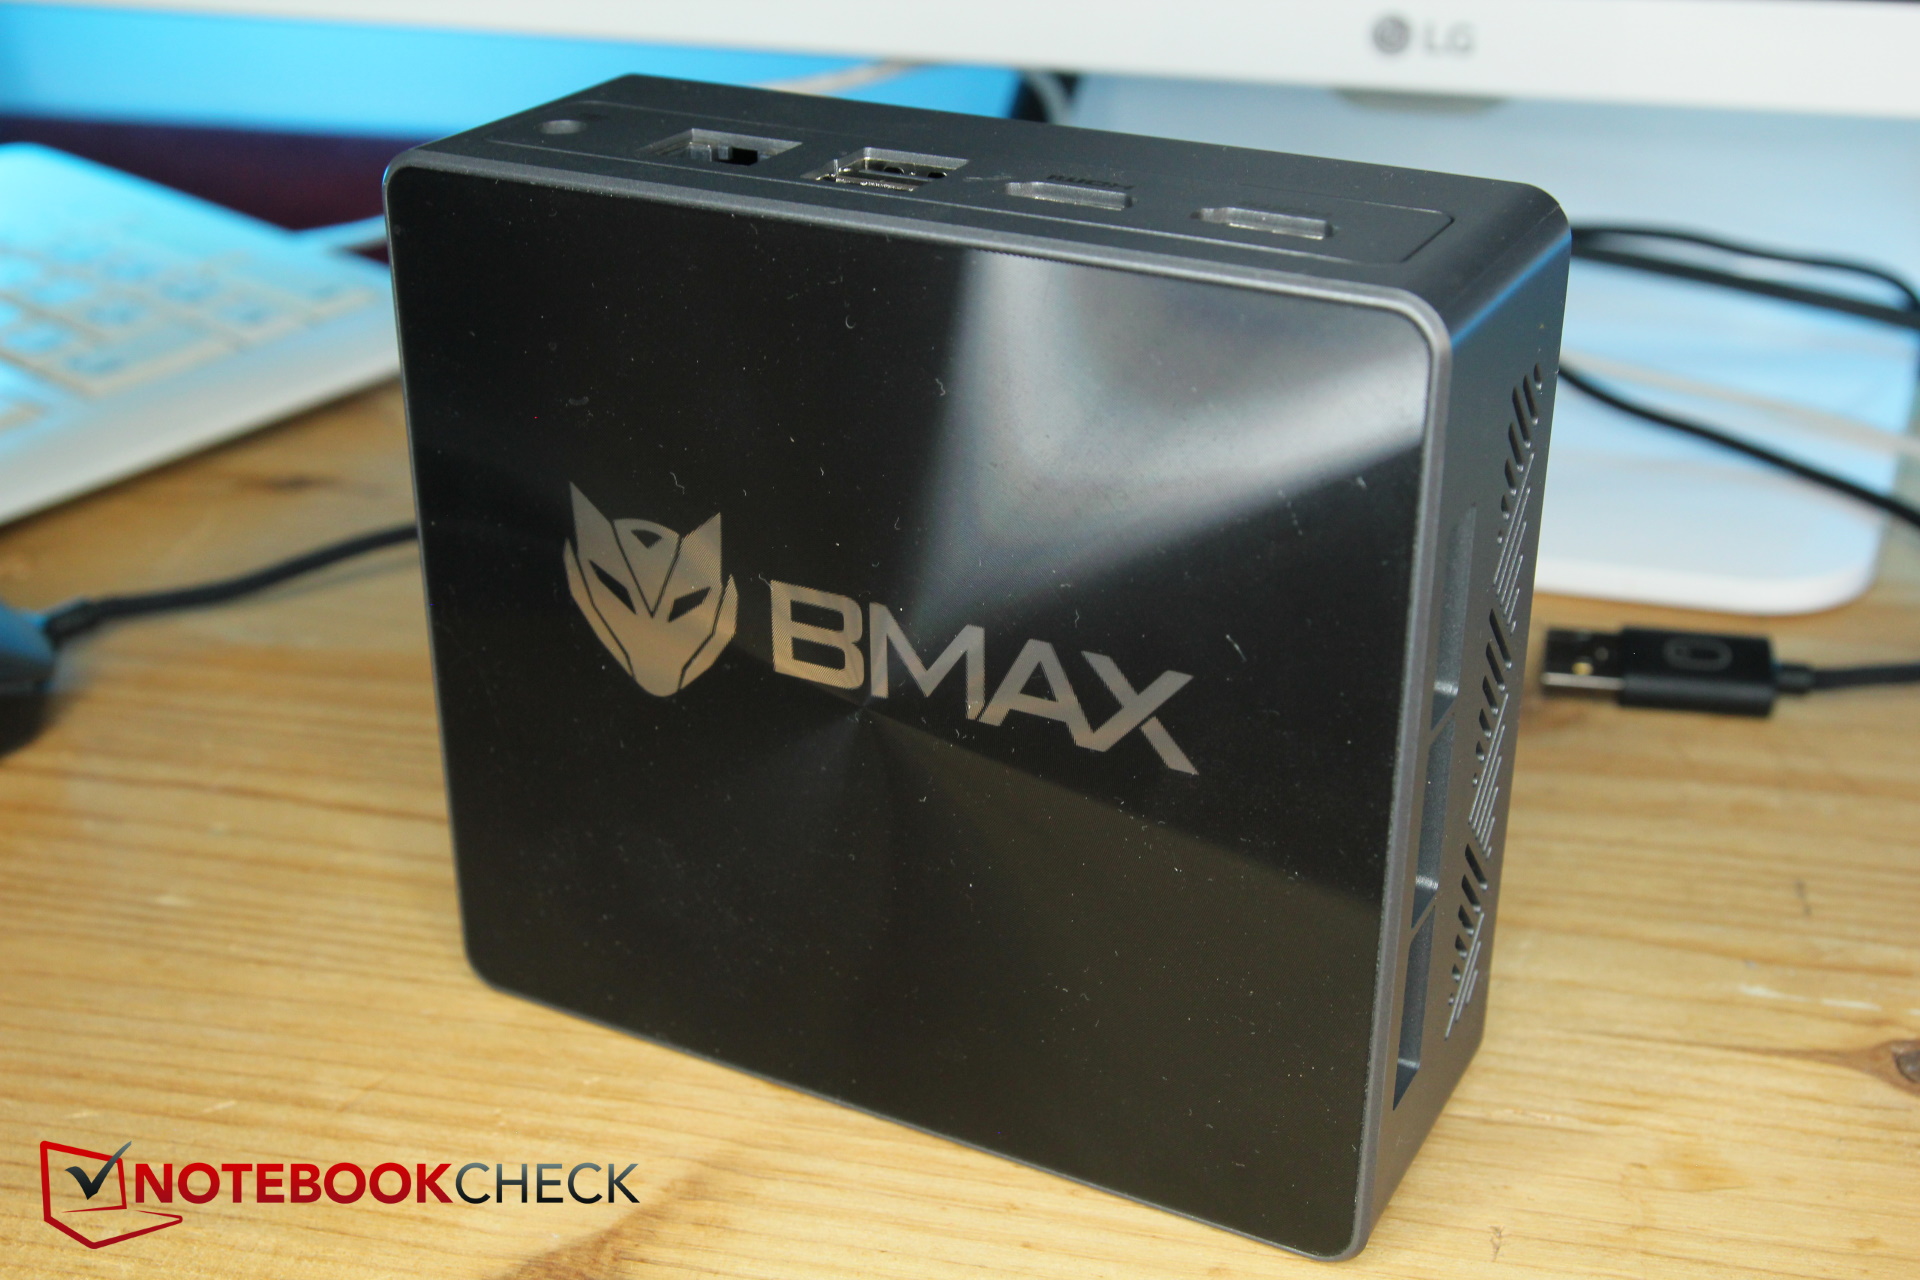
A parte superior do B7 Power chama a atenção porque há uma espécie de impressão com estrutura de lentes Fresnel acima do logotipo da BMAX, que faz com que a parte superior brilhe de forma diferente, dependendo do ângulo de visão.
O B7 Power também é o mais leve dos minicomputadores nesta comparação. Com 363 gramas, ele pesa significativamente menos que os modelos Intel NUC (pelo menos 538 gramas). O próximo concorrente mais leve é o mini PC da Beelinkmas com um peso de 440 gramas, ele já é um pouco mais pesado.
Por outro lado, alguns concorrentes, como os Intel NUCs, são um pouco menores - sua frente é cerca de 8 mm mais curta. O Beelink tem medidas semelhantes.
Conectividade - USB-C sem Thunderbolt, mas com PD
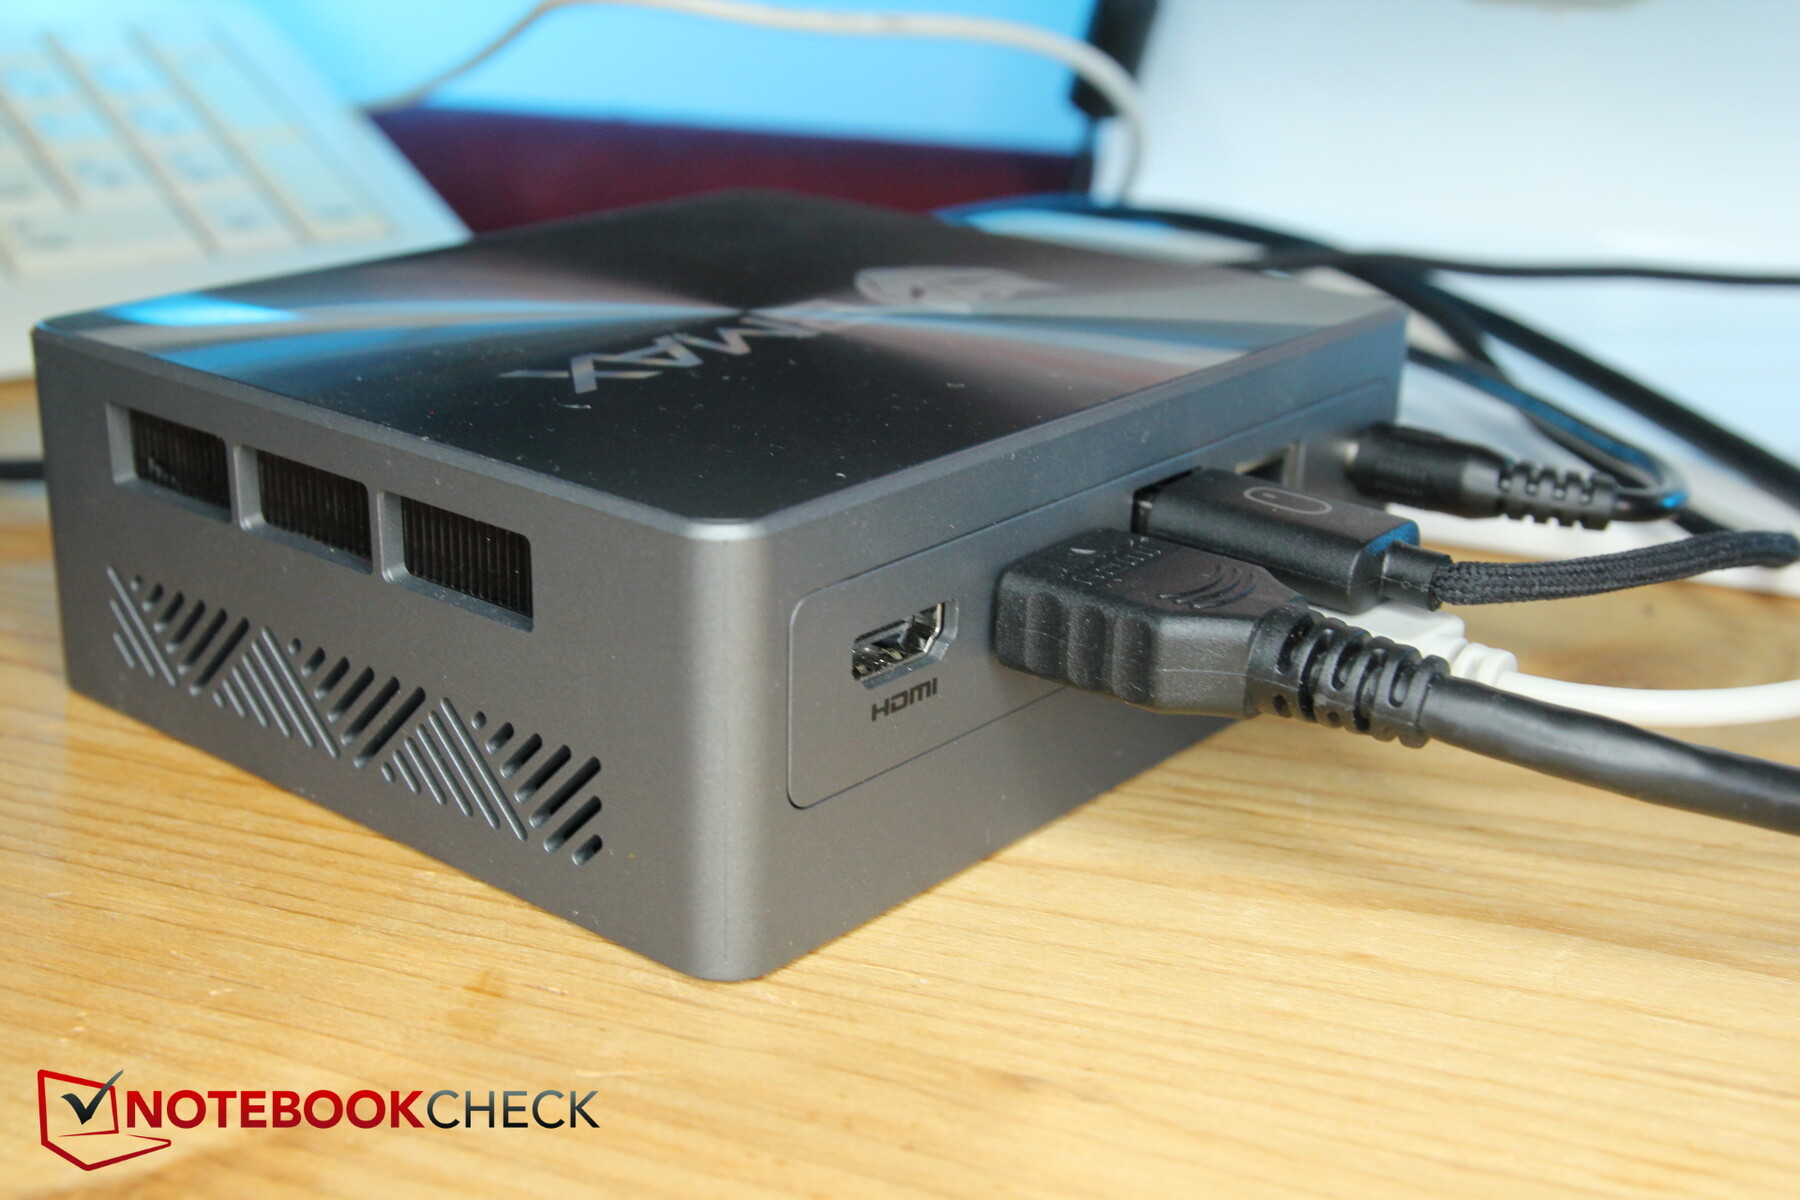
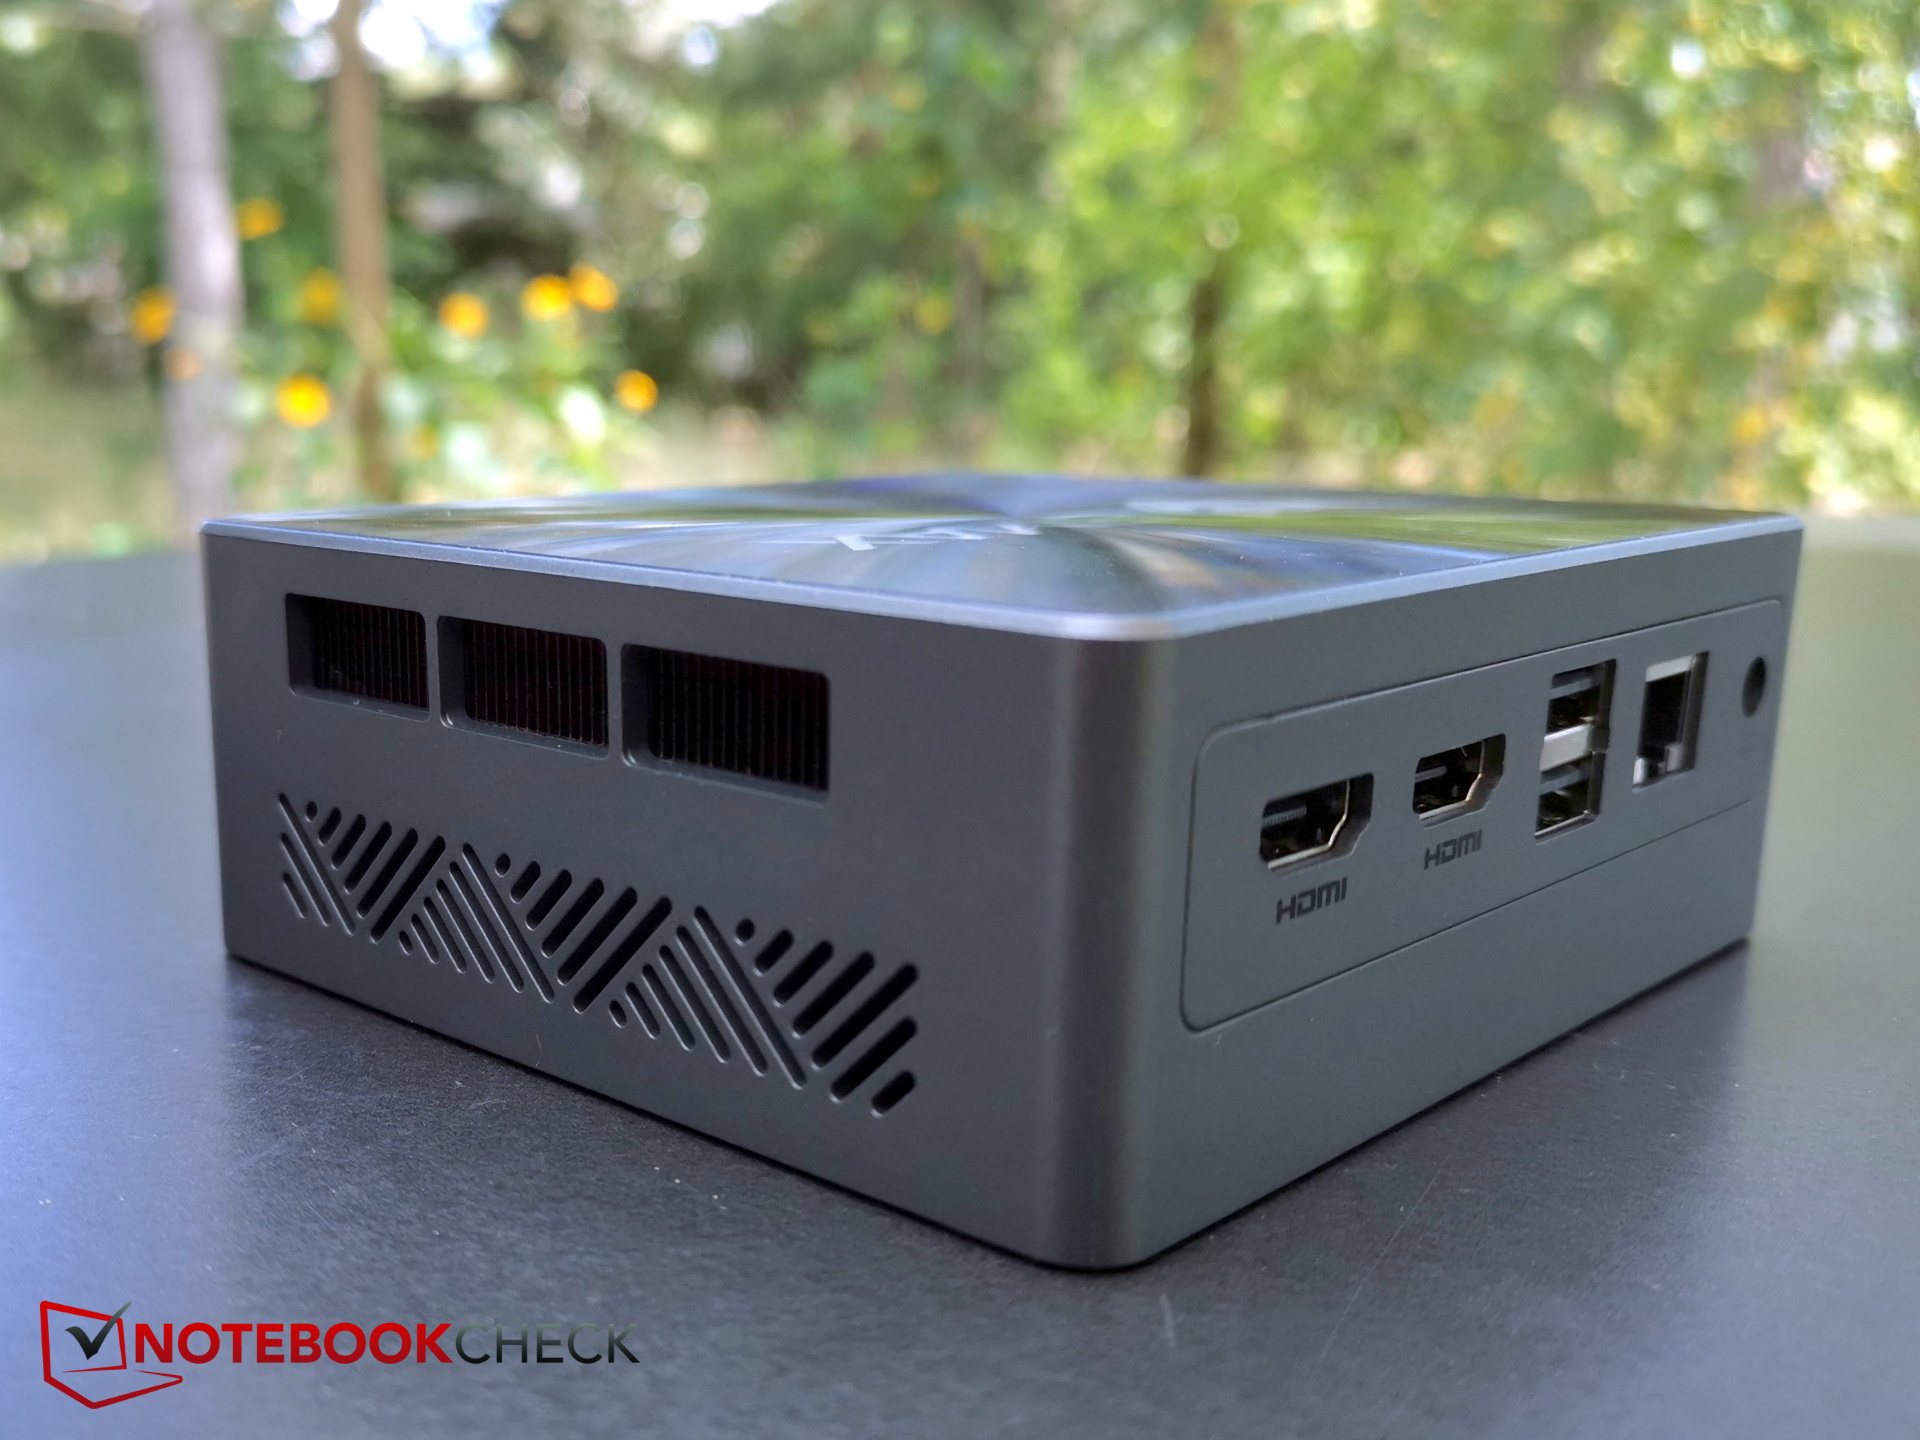
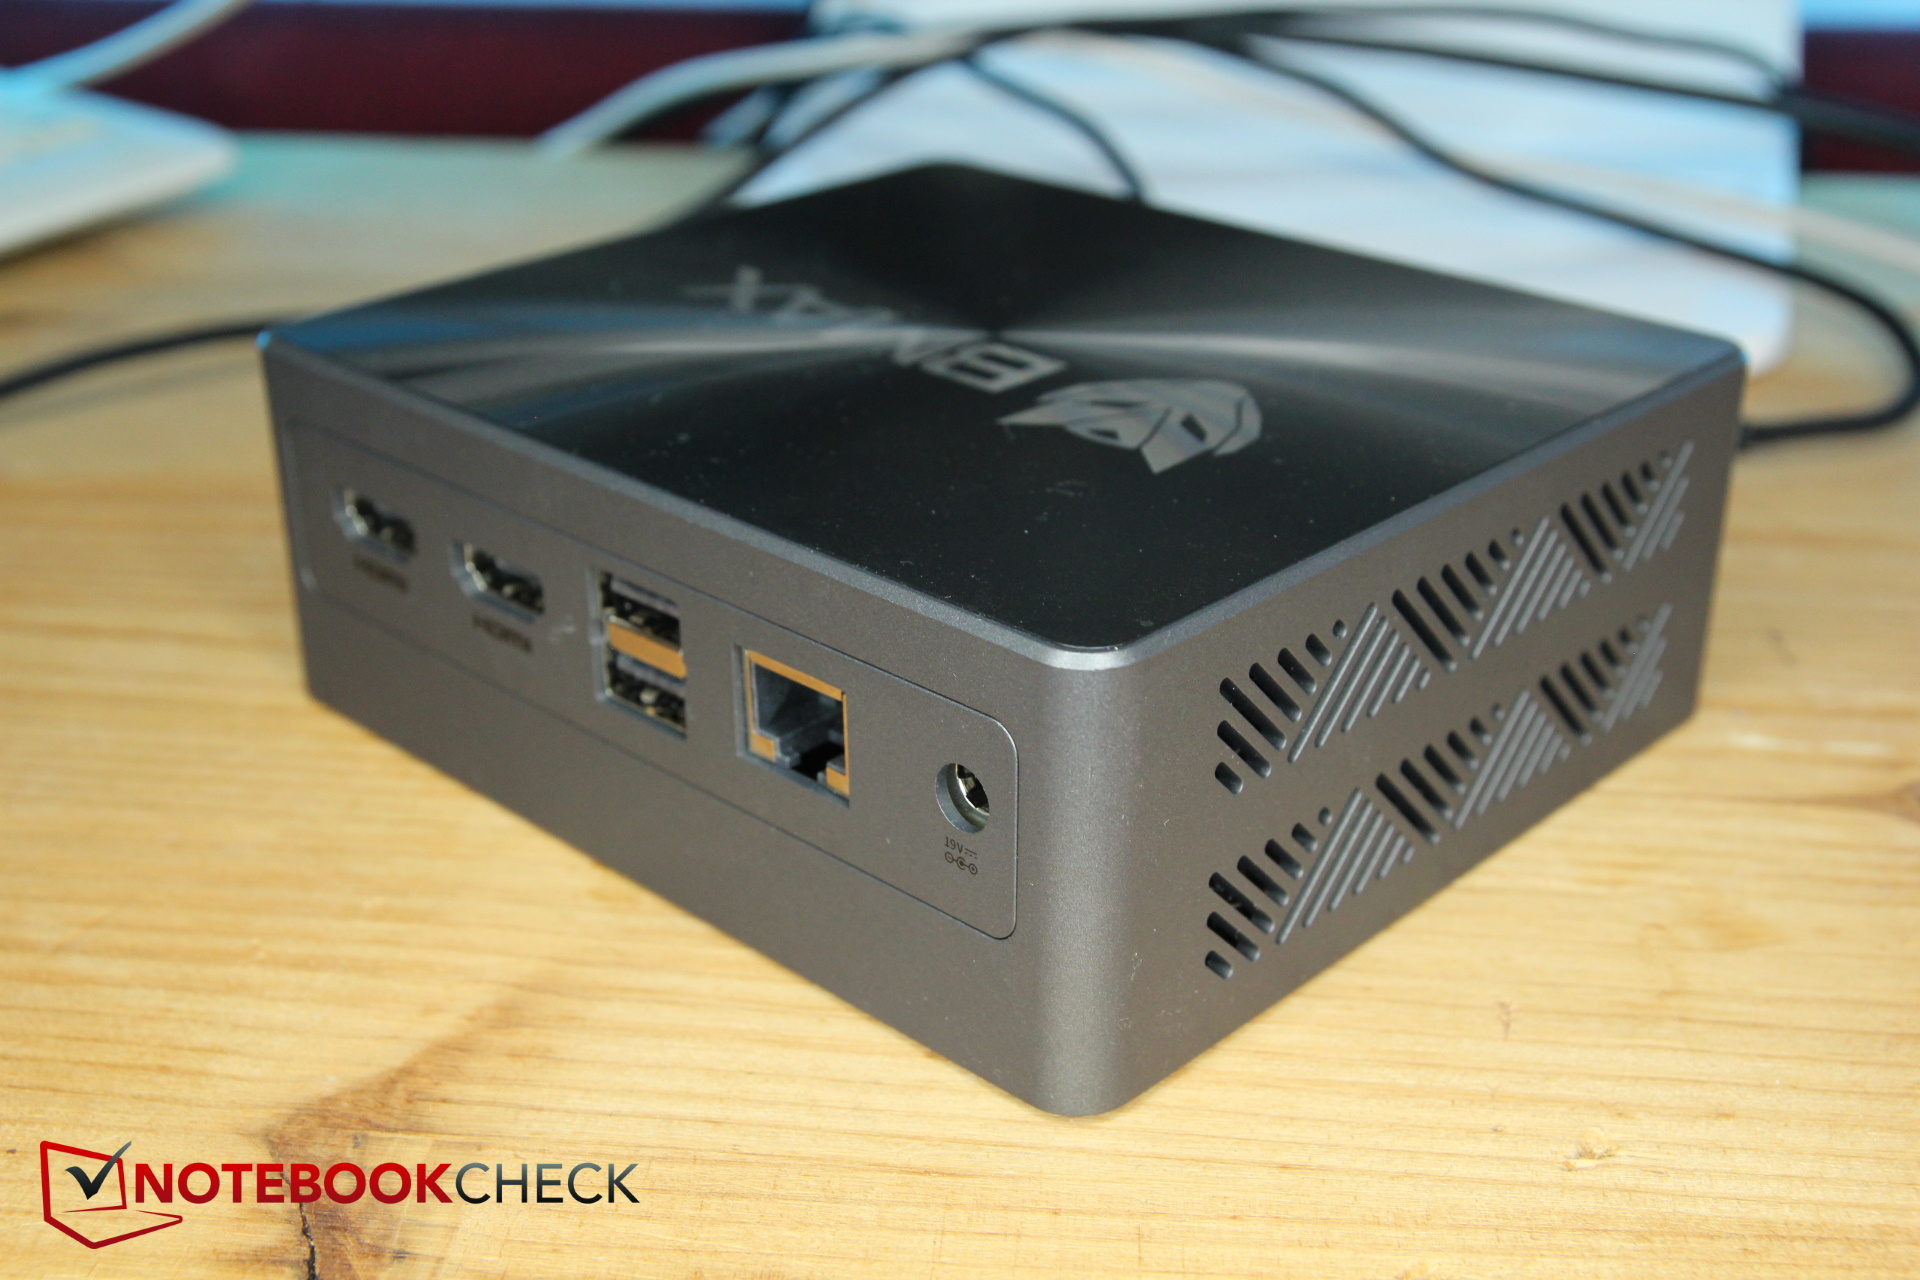
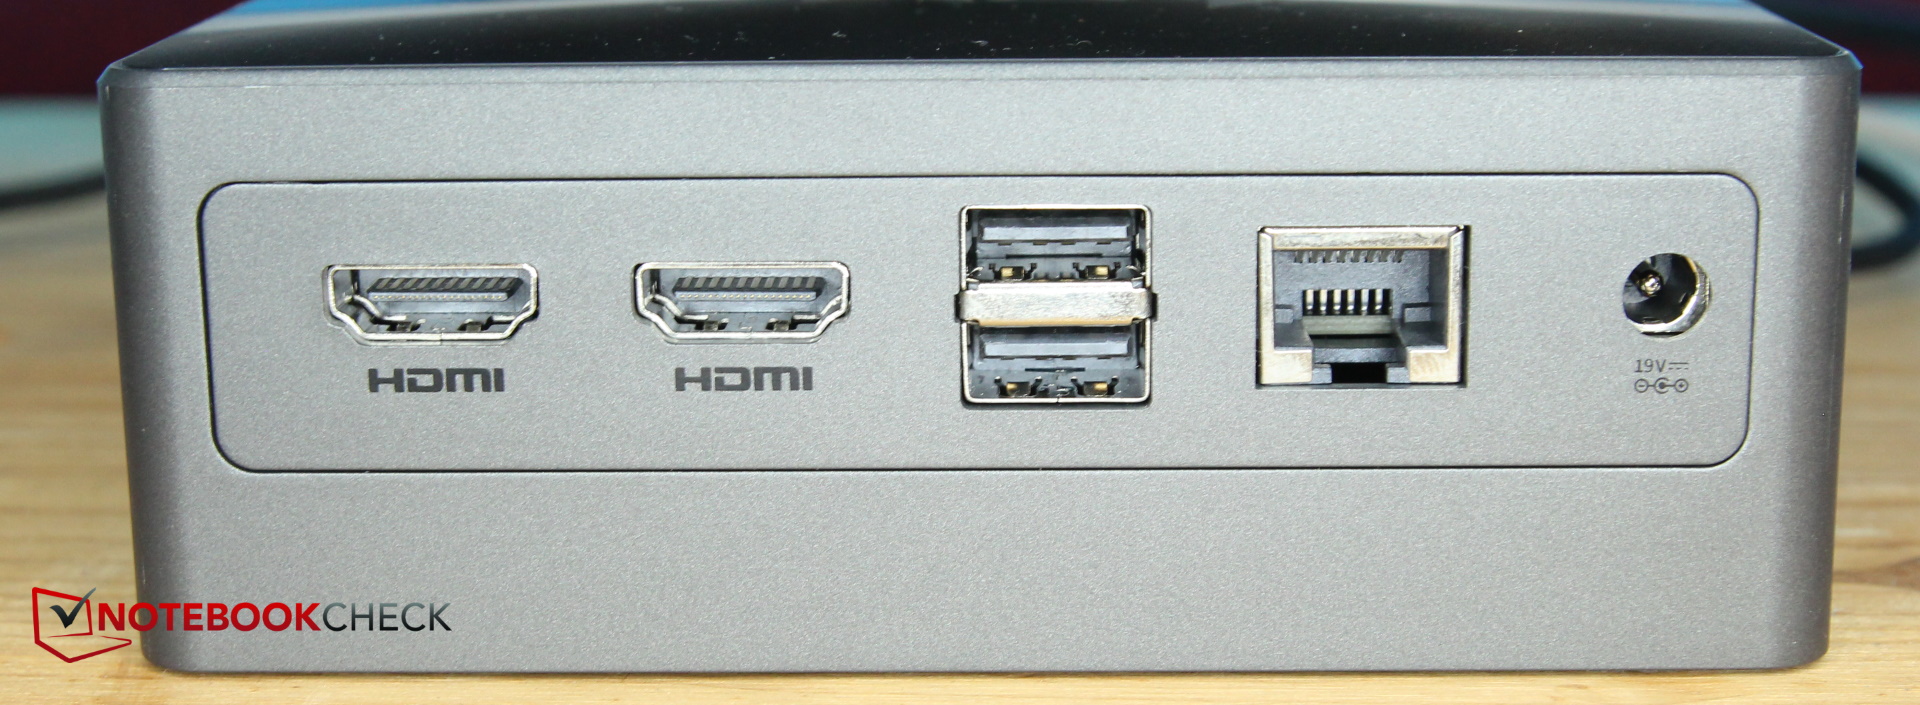
Na parte traseira do PC, encontram-se todas as portas necessárias para conexões permanentes, incluindo duas portas USB-A para conectar um mouse e um teclado, duas portas HDMI 2.0 para conectar até dois monitores, bem como uma porta LAN e uma conexão de energia.
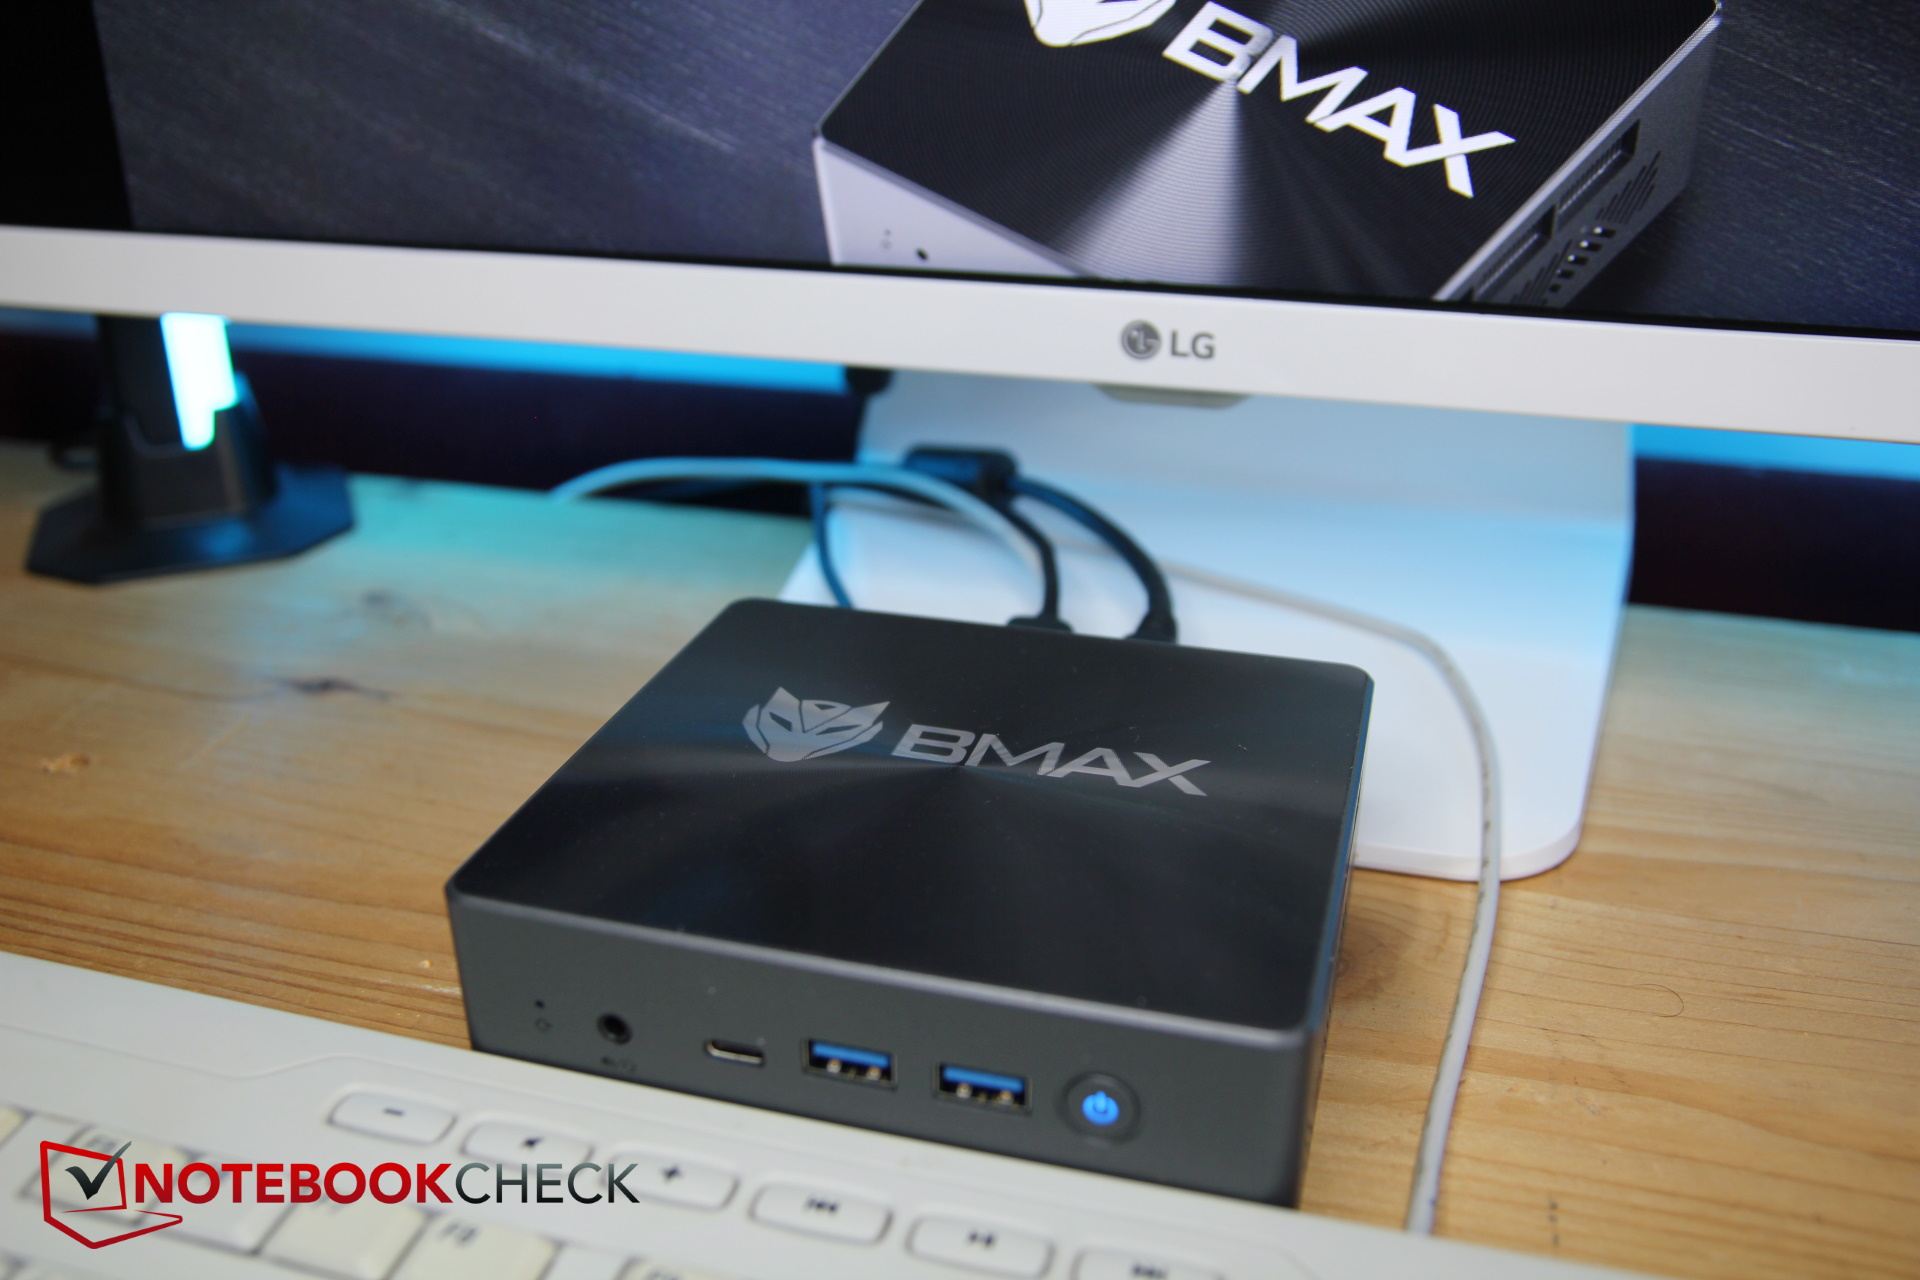
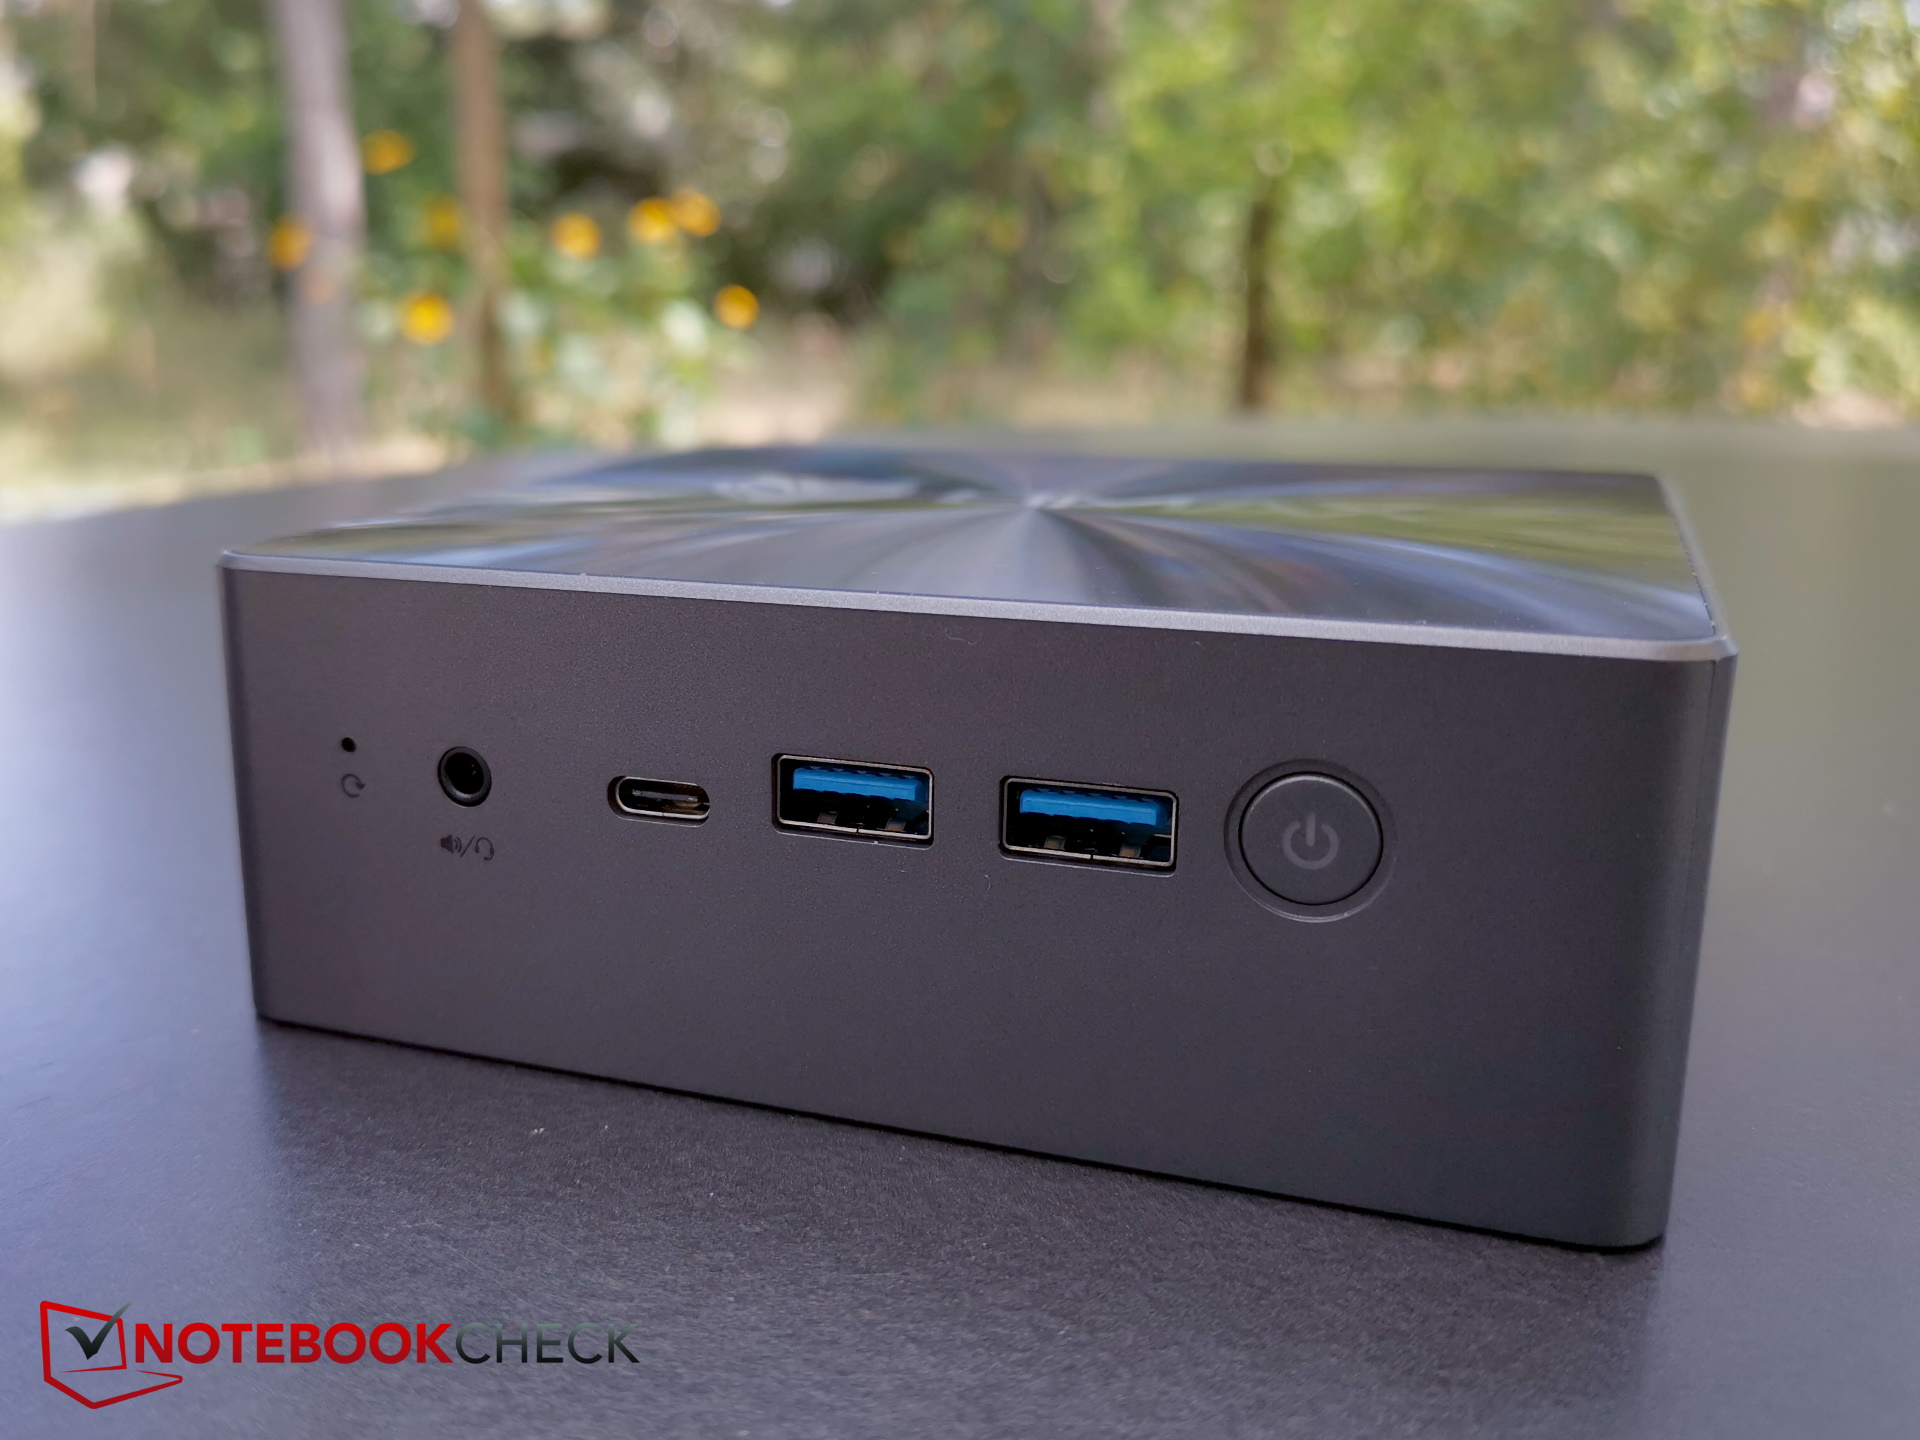
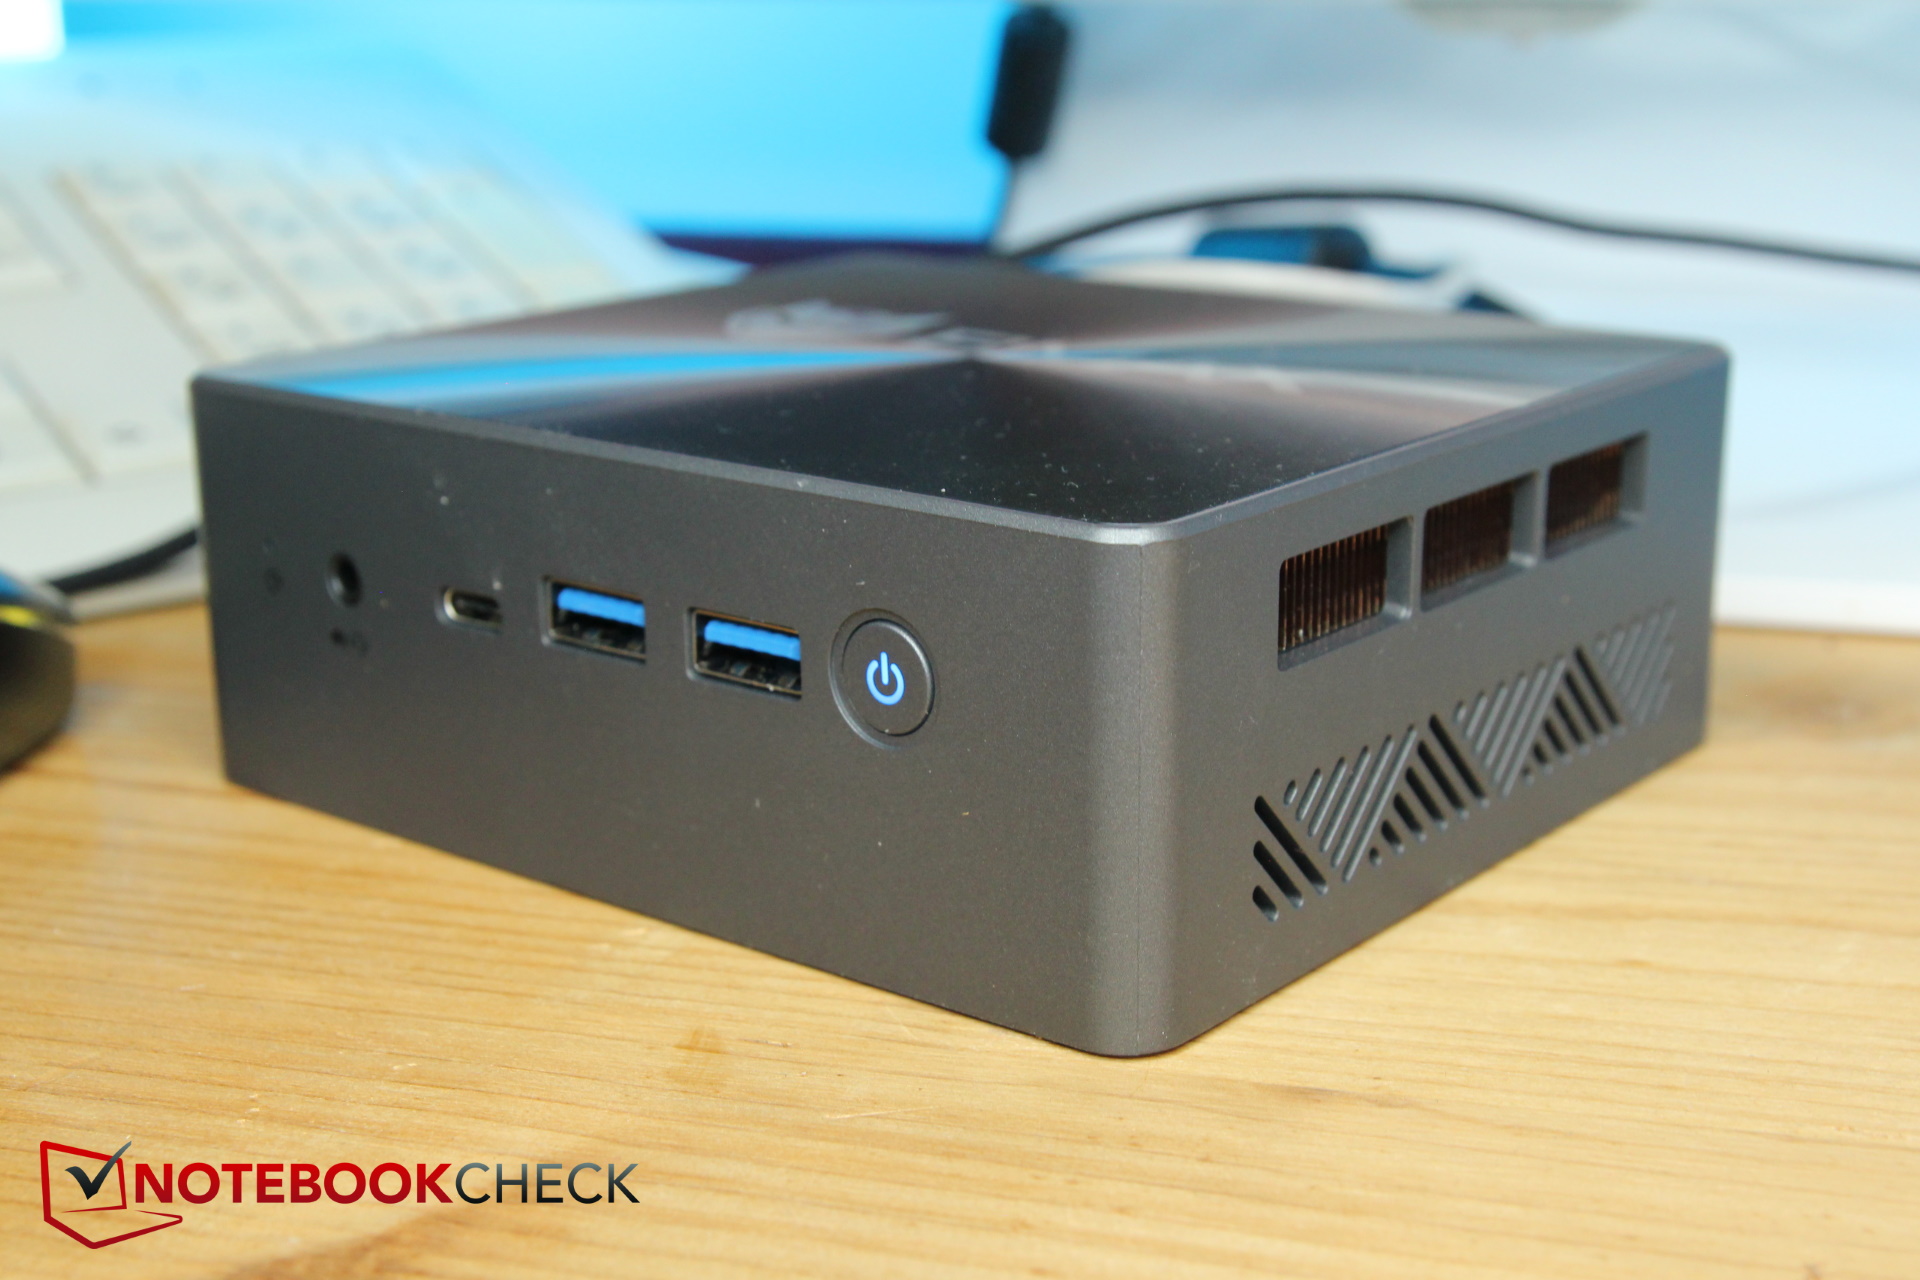
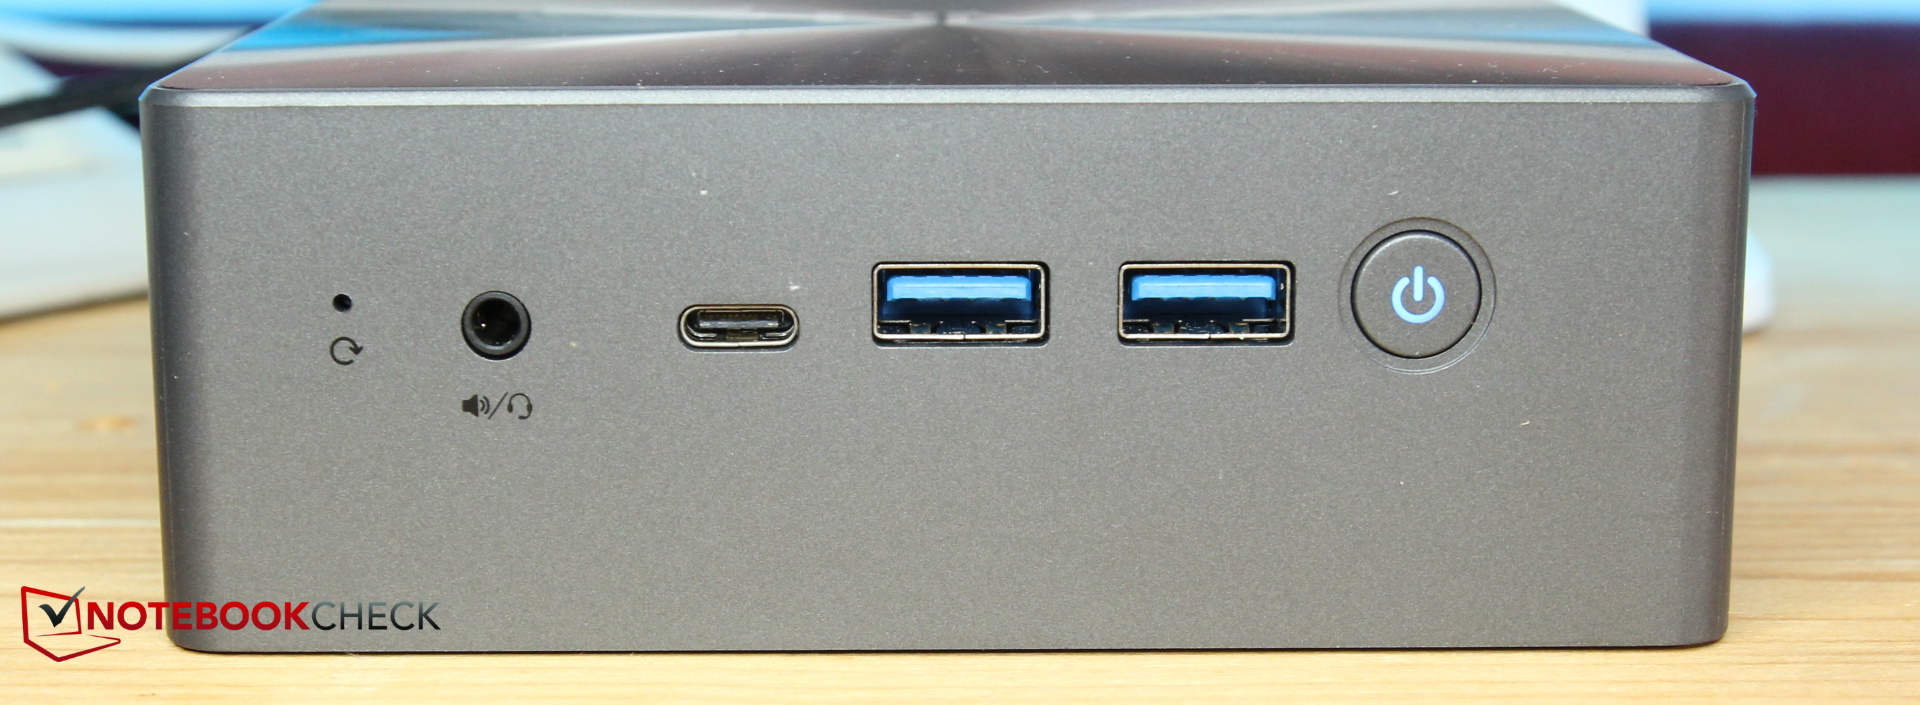
Na parte frontal, há portas adicionais para conectar dispositivos USB externos ou fones de ouvido. Aqui, você também pode encontrar uma porta USB-C. A BMAX o indicou como sendo "completo". É claro que ela não é compatível com Thunderbolt, mas é compatível com DisplayPort, o que significa que um total de três monitores podem ser conectados ao B7 Power de uma só vez.
Essa porta também é compatível com o Power Delivery, como nosso teste com dois carregadores USB-C confirmou. O carregador de 30 watts de um MacBook Air não funcionou, mas um carregador de 45 watts sim. Oficialmente, o B7 requer 19 V e 2,5 A (47,5 W).
O B7 não possui um leitor de cartão SD. Há alguns orifícios para parafusos na parte inferior do dispositivo que podem ser usados para conectar o mini PC à parte traseira de um monitor usando o suporte VESA fornecido.
Comunicação
Além da conexão Gigabit LAN, o B7 Power também pode se conectar via WiFi. Para isso, o fabricante instalou um chip da Realtek que, supostamente, também suporta WiFi 6. Isso significa que você pode se conectar à rede de 5 GHz, mas não à de 6 GHz.
O mini PC é bastante rápido quando se trata de 5 GHz. Entretanto, o uso de 2,4 GHz "normal" nos dá uma impressão totalmente diferente. Aqui, as taxas de transferência do PC em nosso ambiente de teste (propriedade alugada, várias redes sobrepostas nas proximidades) foram abomináveis - medimos apenas 100 a 150 MB/s.
Segurança
Obviamente, o TPM também é suportado graças ao chip Intel, mas, além disso, o B7 Power não oferece nem mesmo uma trava Kensington. No entanto, é provável que poucas pessoas sintam falta disso em um mini PC.
Escopo de entrega e garantia
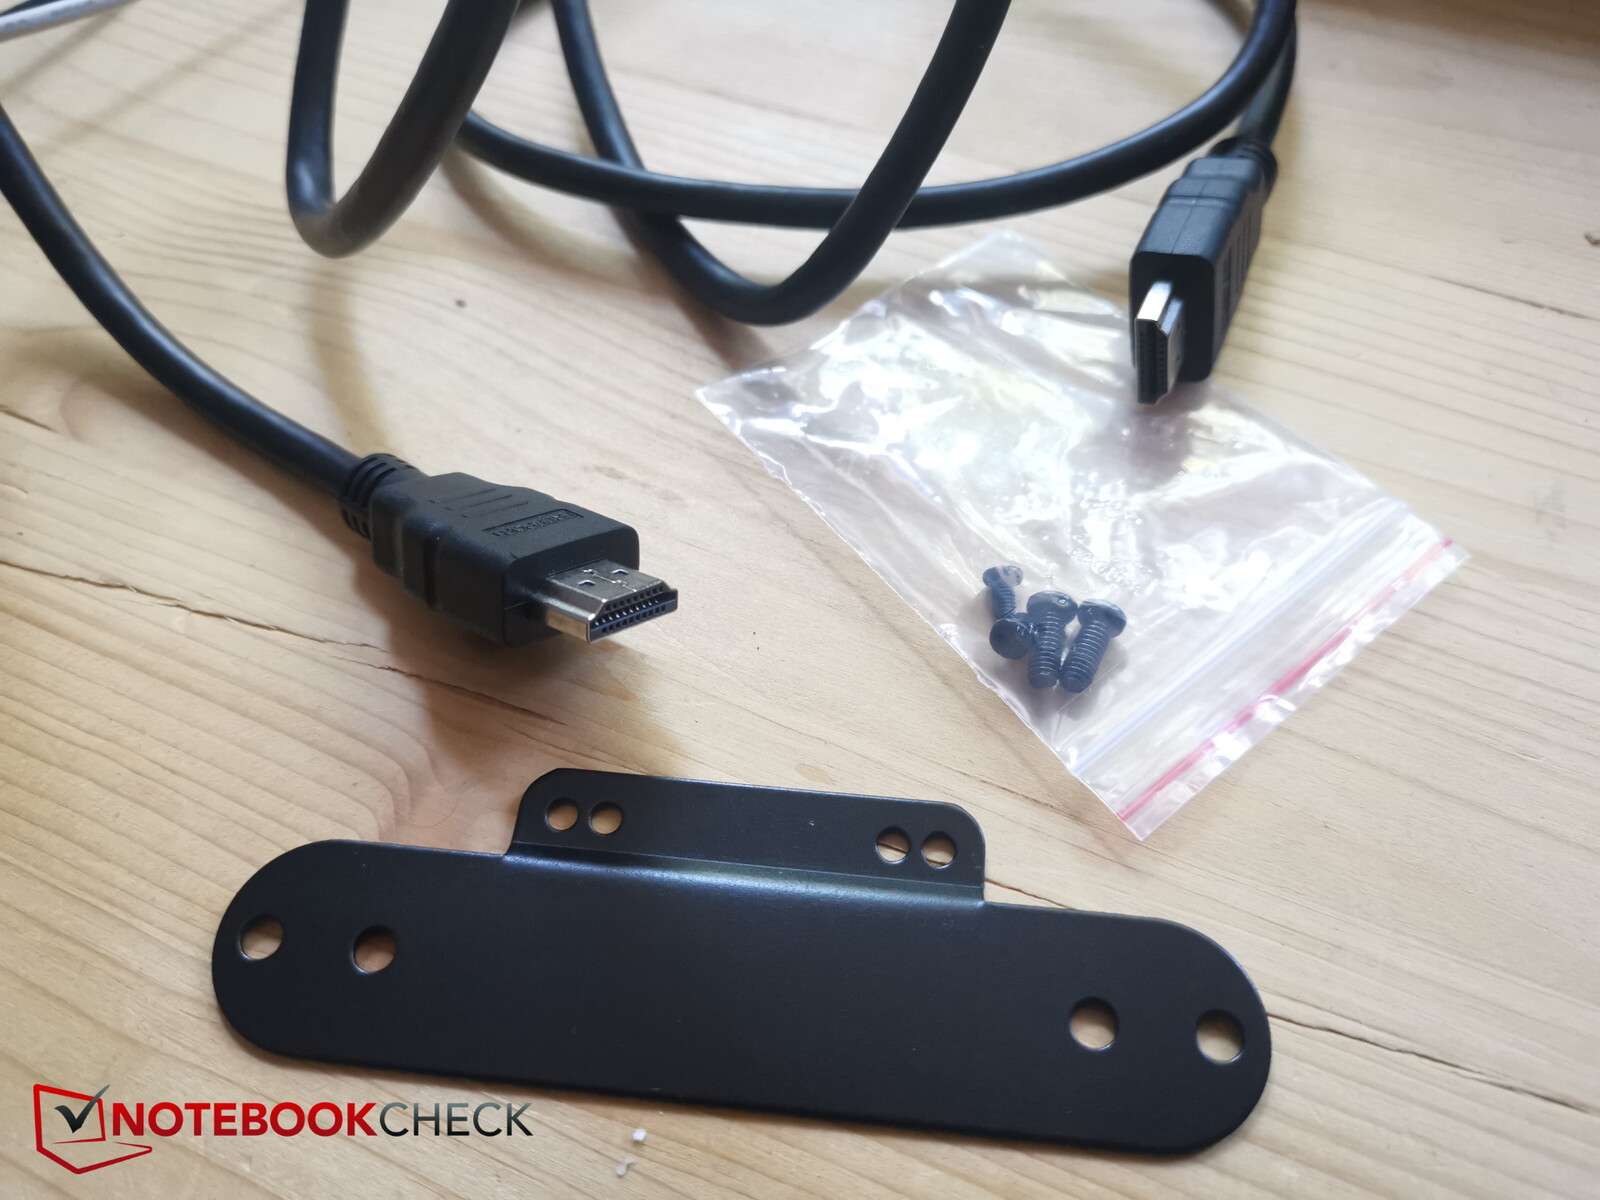
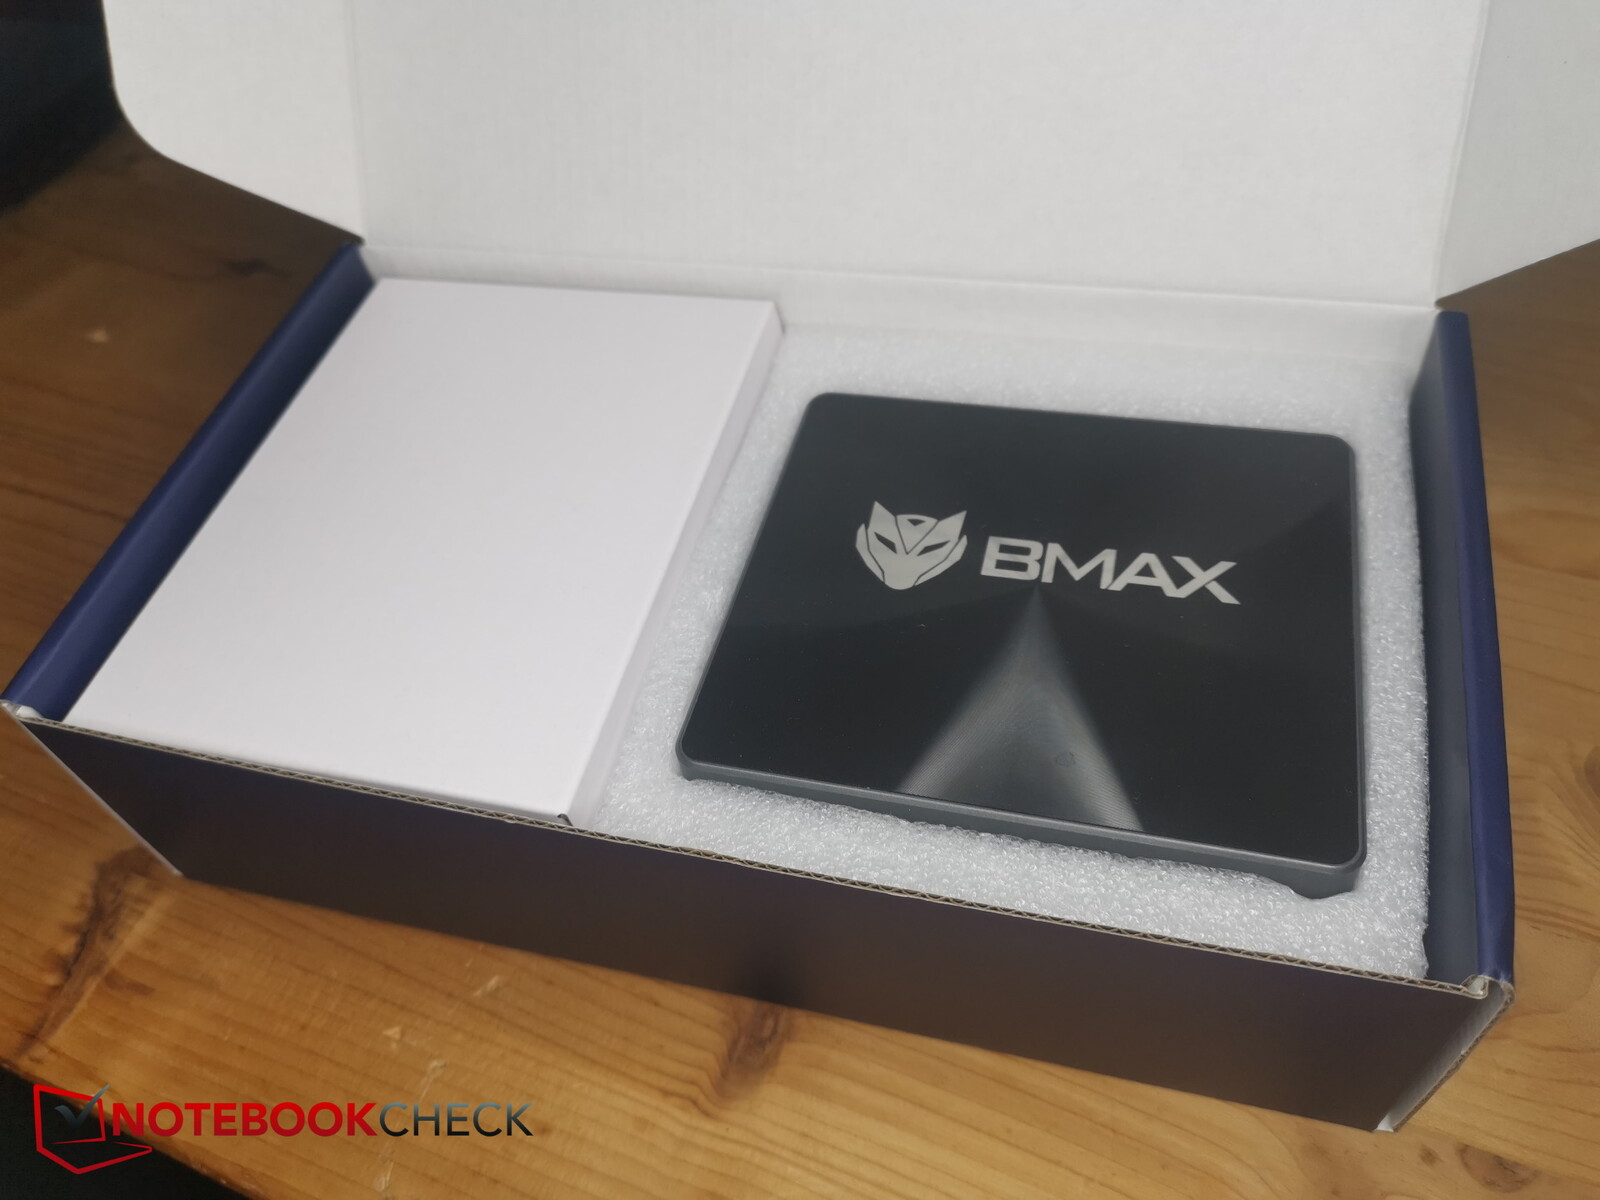
Além do próprio mini PC, o fabricante também incluiu uma fonte de alimentação proprietária, um cabo HDMI e um suporte VESA, incluindo os parafusos necessários.
No momento, o fabricante não comentou se o PC vem com garantia. Suas leis de garantia locais relevantes devem cobrir essa questão.
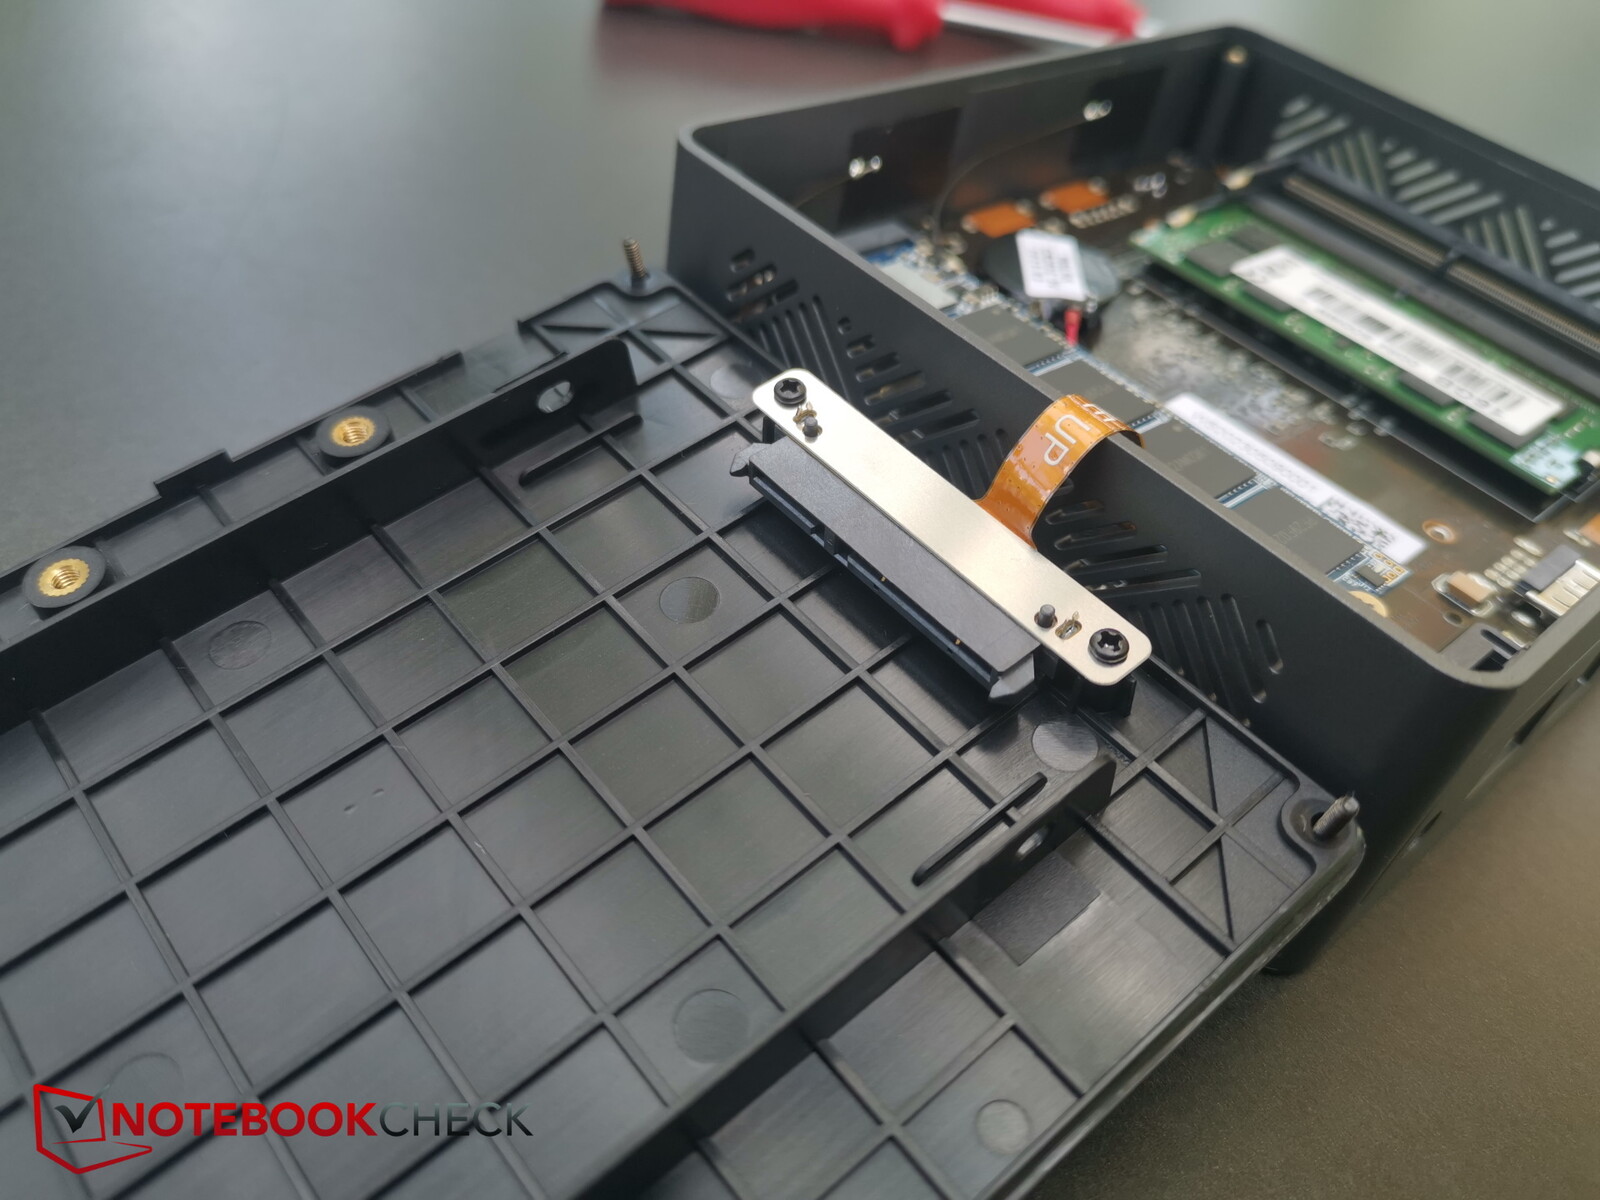
Manutenção
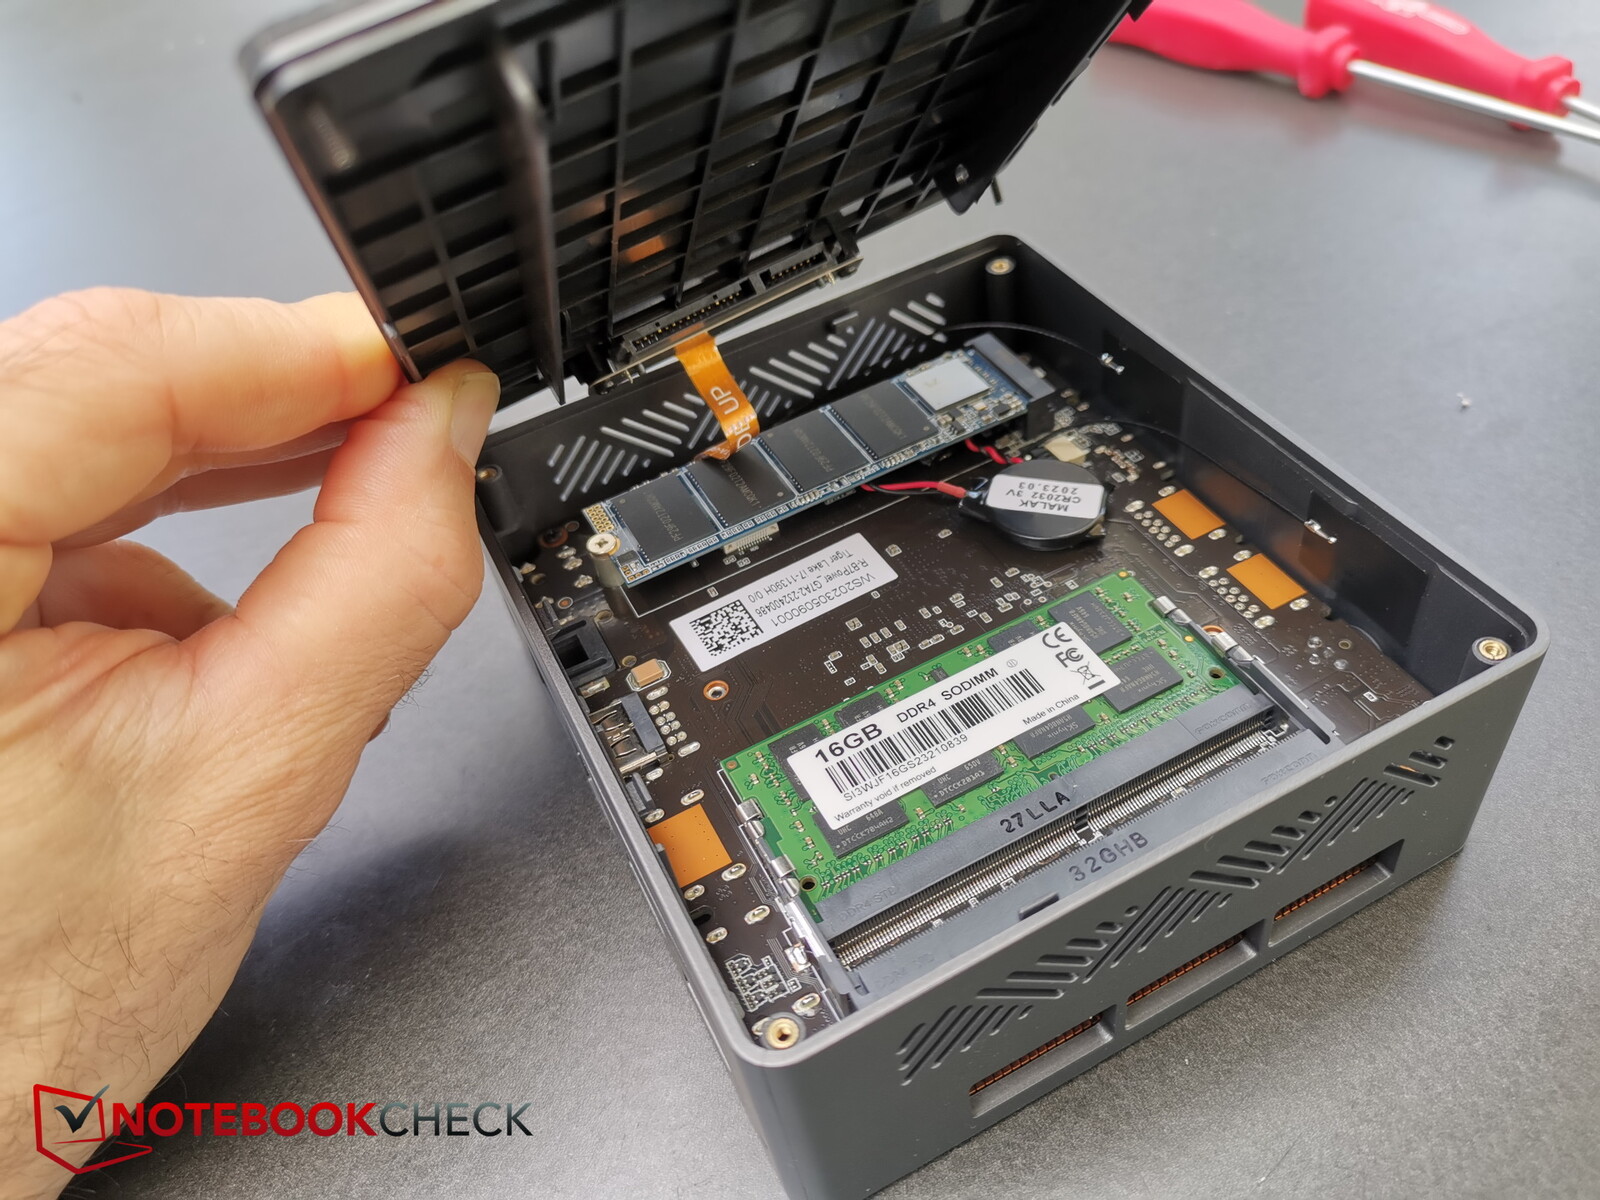
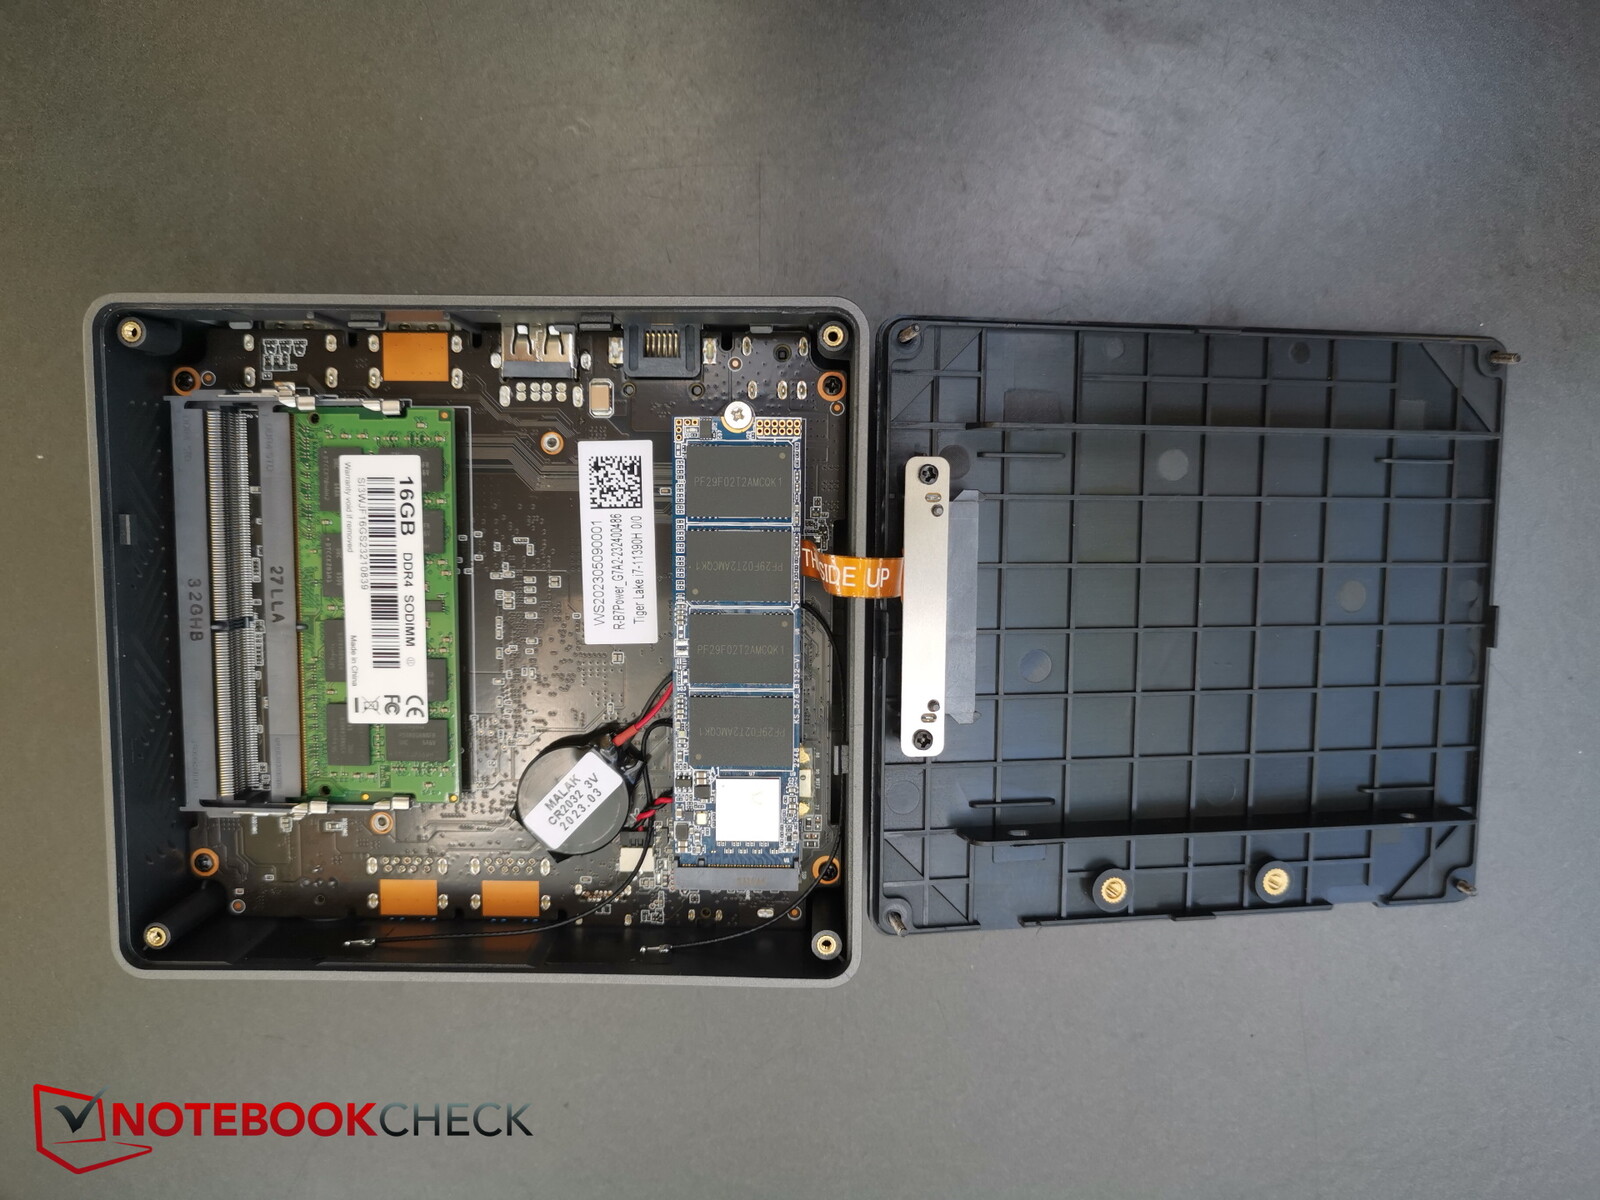
A manutenção do dispositivo é simples e agradável. Apenas 4 parafusos cruzados mantêm a placa inferior no lugar. Depois de removê-los, você pode virar cuidadosamente a parte inferior para o lado (à esquerda se vista de frente e de cima). Há um cabo conectando as duas partes que liga a porta SATA na placa inferior interna à placa-mãe.
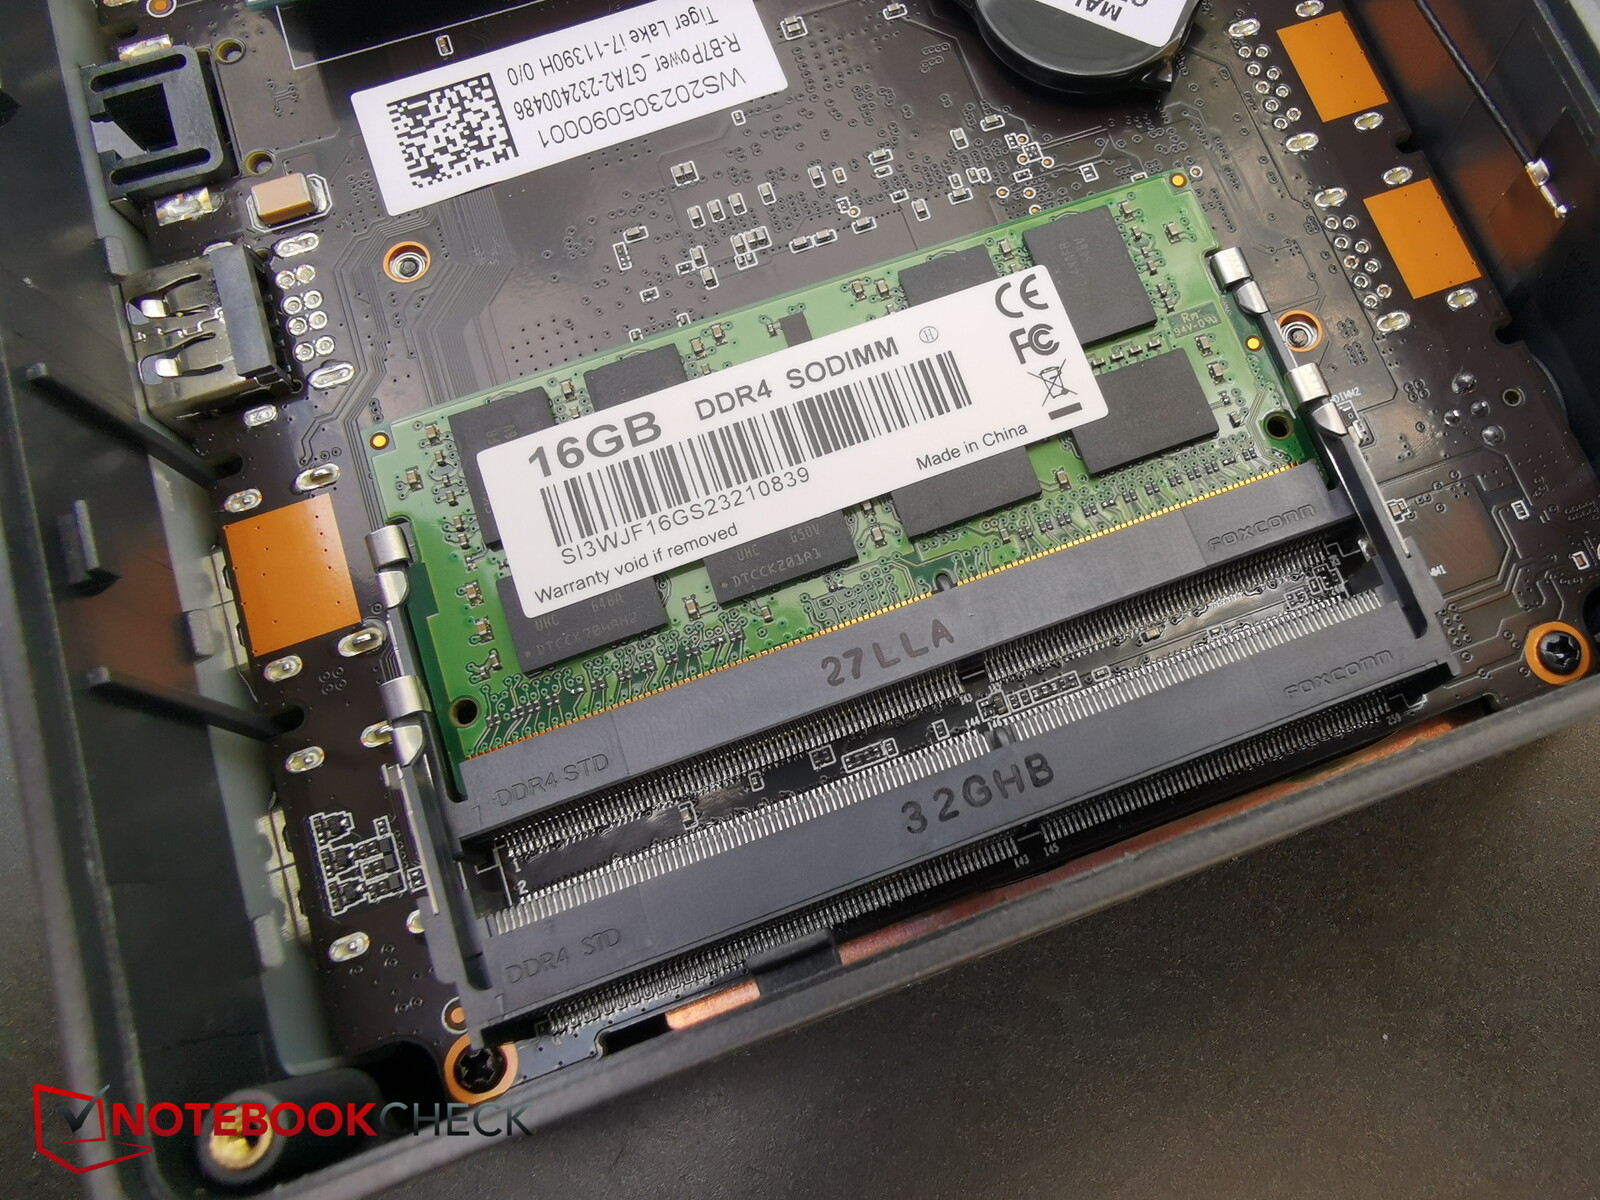
Posteriormente, é possível acessar os dois slots de RAM, o SSD NVMe e a porta SATA mencionada anteriormente para HDDs ou SSDs de 2,5 polegadas. Para acessar os ventiladores, é necessário desmontar o dispositivo.
Desempenho - Lento mesmo para a geração 11
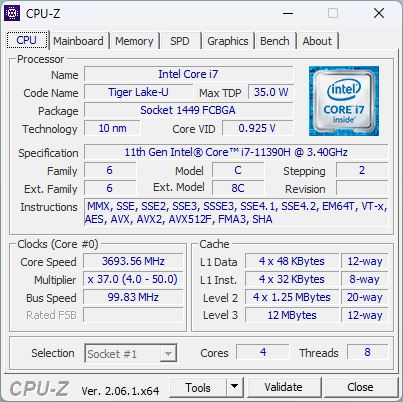
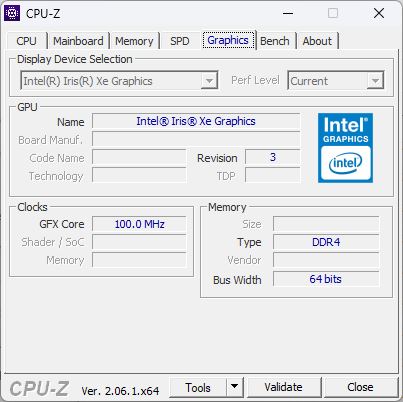
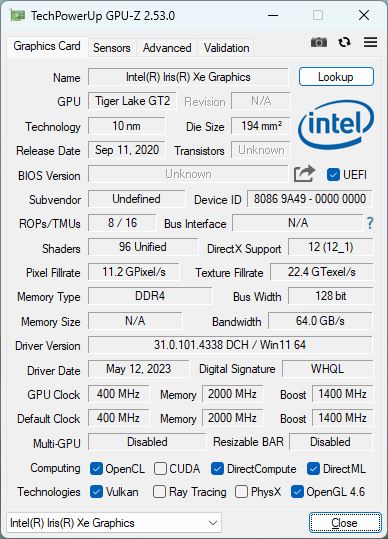
Intel Gen 11, especificamente oIntel Core i7-11390Hé, em geral, uma CPU decente, mas está alguns anos atrás da tecnologia atual da Intel Gen13, que pode ser encontrada noKit Intel NUC 13 Pro. Para completar a configuração, há 16 GB de RAM com opção de upgrade e um SSD sem nome de 1 TB. O PC não possui uma placa de vídeo dedicada, mas a placa de vídeo XE integrada à CPU funciona com 96 EUs em sua capacidade total. O PC é adequado principalmente para uso diário em escritórios e talvez também como console retrô.
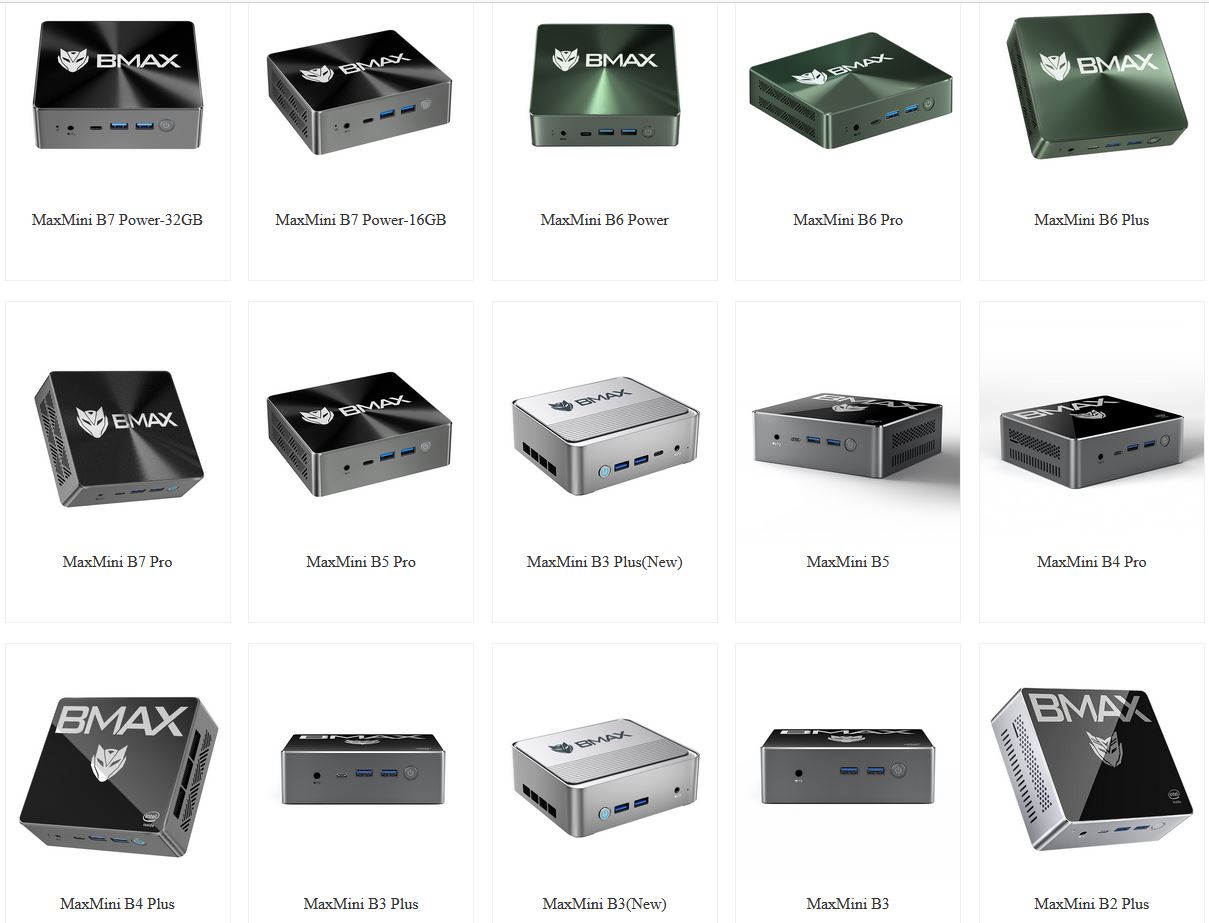
Há uma grande variedade de outros mini PCs oferecidos no site da BMAX, incluindo o B7 Pro com um processadori5-1145G7. Entretanto, o B7 Power já é o atual modelo topo de linha do fabricante.
Condições de teste
O B7 Power é agradavelmente espaçoso, pois você não encontrará nenhum bloatware ou software do próprio fabricante, como o Control Center, instalado no PC. Para obter os melhores resultados de benchmark, testamos o melhor desempenho no modo Windows.
Nossa tela permaneceu preta durante a primeira inicialização. Isso foi resolvido pressionando a combinação de teclas Windows + P.
Processador
OIntel Core i7-11390Hainda faz parte da série Tiger Lake - dois de seus 4 núcleos podem atingir clock individual de até 5 GHz. Todos os 4 núcleos são habilitados para hyper-threading, o que significa que 8 threads podem ser processados ao mesmo tempo.
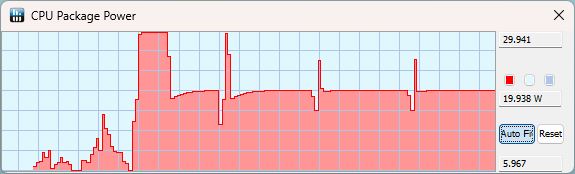
O chip pode ser configurado de 28 a 35 watts (TDP), dependendo de qual é o clock base garantido, que pode variar de 2,9 (28 W) a 3,4 GHz (35 W). A extremidade com TDP mais baixo parece estar um pouco mais configurada para o B7 Power. Em nosso loop Cinebench R15, o consumo de energia do PC ficou em torno de 30 watts durante a primeira execução. A partir da segunda execução, o B7 atingiu apenas 25 watts, e isso por pouco tempo; na maior parte do restante de cada execução, o minicomputador atingiu pouco menos de 20 watts.
Após a primeira execução do Cinebench R15, o desempenho do dispositivo caiu cerca de 10% e permaneceu estável depois disso. Entretanto, esse desempenho é bastante decepcionante no geral. É claro que os NUC 12 e 13 estão claramente à frente, mas até mesmo o Geekom Mini com a mesma CPU foi 17% mais rápido em todos os testes de CPU. Em comparação com os resultados médios do i7-11390H em nosso banco de dados, o desempenho da CPU do B7 Power é cerca de 13% mais fraco. Isso significa que o potencial da CPU não está esgotado de forma alguma. Até mesmo o B5 Power com Intel Gen8 mal conseguiu ser superado no teste Cinebench. Os dois dispositivos estão separados por uma enorme diferença de 87% na pontuação geral da CPU, mas há apenas cerca de 18% entre eles quando se trata do loop do Cinebench.
Cinebench R15 Multi continuous test
Cinebench R23: Multi Core | Single Core
Cinebench R20: CPU (Multi Core) | CPU (Single Core)
Cinebench R15: CPU Multi 64Bit | CPU Single 64Bit
Blender: v2.79 BMW27 CPU
7-Zip 18.03: 7z b 4 | 7z b 4 -mmt1
Geekbench 5.5: Multi-Core | Single-Core
HWBOT x265 Benchmark v2.2: 4k Preset
LibreOffice : 20 Documents To PDF
R Benchmark 2.5: Overall mean
| CPU Performance rating | |
| Média da turma Mini PC | |
| Intel NUC 13 Pro Kit NUC13ANK | |
| Intel NUC 12 Pro Kit NUC12WSBi5 -2! | |
| Geekom Mini IT11, i7-11390H | |
| Média Intel Core i7-11390H | |
| Beelink SEi11 Pro | |
| BMAX B7 Power G7A2 | |
| BMAX B5 Pro G7H8 | |
| Cinebench R23 / Multi Core | |
| Média da turma Mini PC (1571 - 39416, n=98, últimos 2 anos) | |
| Intel NUC 13 Pro Kit NUC13ANK | |
| Intel NUC 12 Pro Kit NUC12WSBi5 | |
| Intel NUC 12 Pro Kit NUC12WSBi5 | |
| Intel NUC 12 Pro Kit NUC12WSBi5 | |
| Geekom Mini IT11, i7-11390H | |
| Beelink SEi11 Pro | |
| Média Intel Core i7-11390H (4570 - 6379, n=3) | |
| BMAX B7 Power G7A2 | |
| BMAX B5 Pro G7H8 | |
| Cinebench R23 / Single Core | |
| Intel NUC 13 Pro Kit NUC13ANK | |
| Média da turma Mini PC (455 - 2303, n=98, últimos 2 anos) | |
| Intel NUC 12 Pro Kit NUC12WSBi5 | |
| Geekom Mini IT11, i7-11390H | |
| Média Intel Core i7-11390H (1407 - 1602, n=3) | |
| Beelink SEi11 Pro | |
| BMAX B7 Power G7A2 | |
| BMAX B5 Pro G7H8 | |
| Cinebench R20 / CPU (Multi Core) | |
| Média da turma Mini PC (555 - 15041, n=98, últimos 2 anos) | |
| Intel NUC 13 Pro Kit NUC13ANK | |
| Intel NUC 12 Pro Kit NUC12WSBi5 | |
| Geekom Mini IT11, i7-11390H | |
| Beelink SEi11 Pro | |
| Média Intel Core i7-11390H (1767 - 2362, n=3) | |
| BMAX B7 Power G7A2 | |
| BMAX B5 Pro G7H8 | |
| Cinebench R20 / CPU (Single Core) | |
| Intel NUC 13 Pro Kit NUC13ANK | |
| Média da turma Mini PC (173.6 - 884, n=98, últimos 2 anos) | |
| Intel NUC 12 Pro Kit NUC12WSBi5 | |
| Geekom Mini IT11, i7-11390H | |
| Média Intel Core i7-11390H (550 - 620, n=3) | |
| Beelink SEi11 Pro | |
| BMAX B7 Power G7A2 | |
| BMAX B5 Pro G7H8 | |
| Cinebench R15 / CPU Multi 64Bit | |
| Média da turma Mini PC (254 - 5881, n=98, últimos 2 anos) | |
| Intel NUC 13 Pro Kit NUC13ANK | |
| Intel NUC 12 Pro Kit NUC12WSBi5 | |
| Intel NUC 12 Pro Kit NUC12WSBi5 | |
| Geekom Mini IT11, i7-11390H | |
| Média Intel Core i7-11390H (775 - 1041, n=3) | |
| Beelink SEi11 Pro | |
| BMAX B7 Power G7A2 | |
| BMAX B5 Pro G7H8 | |
| Cinebench R15 / CPU Single 64Bit | |
| Intel NUC 13 Pro Kit NUC13ANK | |
| Média da turma Mini PC (78.3 - 340, n=98, últimos 2 anos) | |
| Intel NUC 12 Pro Kit NUC12WSBi5 | |
| Intel NUC 12 Pro Kit NUC12WSBi5 | |
| Geekom Mini IT11, i7-11390H | |
| Média Intel Core i7-11390H (209 - 239, n=3) | |
| Beelink SEi11 Pro | |
| BMAX B7 Power G7A2 | |
| BMAX B5 Pro G7H8 | |
| Blender / v2.79 BMW27 CPU | |
| BMAX B5 Pro G7H8 | |
| BMAX B7 Power G7A2 | |
| Média Intel Core i7-11390H (495 - 665, n=3) | |
| Beelink SEi11 Pro | |
| Geekom Mini IT11, i7-11390H | |
| Média da turma Mini PC (86 - 2330, n=94, últimos 2 anos) | |
| Intel NUC 12 Pro Kit NUC12WSBi5 | |
| Intel NUC 13 Pro Kit NUC13ANK | |
| 7-Zip 18.03 / 7z b 4 | |
| Média da turma Mini PC (8146 - 136872, n=93, últimos 2 anos) | |
| Intel NUC 13 Pro Kit NUC13ANK | |
| Intel NUC 12 Pro Kit NUC12WSBi5 | |
| Geekom Mini IT11, i7-11390H | |
| Média Intel Core i7-11390H (20822 - 28173, n=3) | |
| Beelink SEi11 Pro | |
| BMAX B7 Power G7A2 | |
| BMAX B5 Pro G7H8 | |
| 7-Zip 18.03 / 7z b 4 -mmt1 | |
| Intel NUC 13 Pro Kit NUC13ANK | |
| Geekom Mini IT11, i7-11390H | |
| Média da turma Mini PC (2454 - 7609, n=94, últimos 2 anos) | |
| Média Intel Core i7-11390H (5539 - 5895, n=3) | |
| BMAX B7 Power G7A2 | |
| Intel NUC 12 Pro Kit NUC12WSBi5 | |
| Beelink SEi11 Pro | |
| BMAX B5 Pro G7H8 | |
| Geekbench 5.5 / Multi-Core | |
| Média da turma Mini PC (1638 - 24593, n=97, últimos 2 anos) | |
| Intel NUC 13 Pro Kit NUC13ANK | |
| Média Intel Core i7-11390H (4457 - 6297, n=4) | |
| Geekom Mini IT11, i7-11390H | |
| Beelink SEi11 Pro | |
| BMAX B7 Power G7A2 | |
| BMAX B5 Pro G7H8 | |
| Geekbench 5.5 / Single-Core | |
| Intel NUC 13 Pro Kit NUC13ANK | |
| Média da turma Mini PC (466 - 2395, n=97, últimos 2 anos) | |
| Geekom Mini IT11, i7-11390H | |
| Média Intel Core i7-11390H (1486 - 1677, n=4) | |
| Beelink SEi11 Pro | |
| BMAX B7 Power G7A2 | |
| BMAX B5 Pro G7H8 | |
| HWBOT x265 Benchmark v2.2 / 4k Preset | |
| Média da turma Mini PC (1.5 - 40.3, n=94, últimos 2 anos) | |
| Intel NUC 13 Pro Kit NUC13ANK | |
| Intel NUC 12 Pro Kit NUC12WSBi5 | |
| Geekom Mini IT11, i7-11390H | |
| Beelink SEi11 Pro | |
| Média Intel Core i7-11390H (5.84 - 7.86, n=3) | |
| BMAX B7 Power G7A2 | |
| BMAX B5 Pro G7H8 | |
| LibreOffice / 20 Documents To PDF | |
| BMAX B5 Pro G7H8 | |
| Média da turma Mini PC (33.1 - 132.6, n=94, últimos 2 anos) | |
| BMAX B7 Power G7A2 | |
| Beelink SEi11 Pro | |
| Intel NUC 12 Pro Kit NUC12WSBi5 | |
| Média Intel Core i7-11390H (43.2 - 52.6, n=3) | |
| Geekom Mini IT11, i7-11390H | |
| Intel NUC 13 Pro Kit NUC13ANK | |
| R Benchmark 2.5 / Overall mean | |
| BMAX B5 Pro G7H8 | |
| Beelink SEi11 Pro | |
| BMAX B7 Power G7A2 | |
| Média Intel Core i7-11390H (0.537 - 0.571, n=3) | |
| Geekom Mini IT11, i7-11390H | |
| Intel NUC 12 Pro Kit NUC12WSBi5 | |
| Média da turma Mini PC (0.3517 - 1.56, n=95, últimos 2 anos) | |
| Intel NUC 13 Pro Kit NUC13ANK | |
* ... menor é melhor
AIDA64: FP32 Ray-Trace | FPU Julia | CPU SHA3 | CPU Queen | FPU SinJulia | FPU Mandel | CPU AES | CPU ZLib | FP64 Ray-Trace | CPU PhotoWorxx
| Performance rating | |
| Média da turma Mini PC | |
| Intel NUC 13 Pro Kit NUC13ANK | |
| Intel NUC 12 Pro Kit NUC12WSBi5 | |
| Beelink SEi11 Pro | |
| Média Intel Core i7-11390H | |
| Geekom Mini IT11, i7-11390H | |
| BMAX B7 Power G7A2 | |
| BMAX B5 Pro G7H8 | |
| AIDA64 / FP32 Ray-Trace | |
| Média da turma Mini PC (974 - 82725, n=105, últimos 2 anos) | |
| Intel NUC 13 Pro Kit NUC13ANK | |
| Beelink SEi11 Pro | |
| Média Intel Core i7-11390H (5904 - 7741, n=4) | |
| Geekom Mini IT11, i7-11390H | |
| Intel NUC 12 Pro Kit NUC12WSBi5 | |
| BMAX B7 Power G7A2 | |
| BMAX B5 Pro G7H8 | |
| AIDA64 / FPU Julia | |
| Média da turma Mini PC (6115 - 363782, n=105, últimos 2 anos) | |
| Intel NUC 13 Pro Kit NUC13ANK | |
| Beelink SEi11 Pro | |
| Média Intel Core i7-11390H (25054 - 32624, n=4) | |
| Intel NUC 12 Pro Kit NUC12WSBi5 | |
| Geekom Mini IT11, i7-11390H | |
| BMAX B7 Power G7A2 | |
| BMAX B5 Pro G7H8 | |
| AIDA64 / CPU SHA3 | |
| Média da turma Mini PC (385 - 9475, n=105, últimos 2 anos) | |
| Intel NUC 13 Pro Kit NUC13ANK | |
| Intel NUC 12 Pro Kit NUC12WSBi5 | |
| Beelink SEi11 Pro | |
| Média Intel Core i7-11390H (1747 - 2168, n=4) | |
| Geekom Mini IT11, i7-11390H | |
| BMAX B7 Power G7A2 | |
| BMAX B5 Pro G7H8 | |
| AIDA64 / CPU Queen | |
| Média da turma Mini PC (20501 - 184747, n=89, últimos 2 anos) | |
| Intel NUC 13 Pro Kit NUC13ANK | |
| Intel NUC 12 Pro Kit NUC12WSBi5 | |
| Média Intel Core i7-11390H (47355 - 58761, n=4) | |
| Geekom Mini IT11, i7-11390H | |
| BMAX B7 Power G7A2 | |
| Beelink SEi11 Pro | |
| BMAX B5 Pro G7H8 | |
| AIDA64 / FPU SinJulia | |
| Média da turma Mini PC (1019 - 31931, n=105, últimos 2 anos) | |
| Intel NUC 13 Pro Kit NUC13ANK | |
| Intel NUC 12 Pro Kit NUC12WSBi5 | |
| Beelink SEi11 Pro | |
| Média Intel Core i7-11390H (4106 - 5412, n=4) | |
| Geekom Mini IT11, i7-11390H | |
| BMAX B5 Pro G7H8 | |
| BMAX B7 Power G7A2 | |
| AIDA64 / FPU Mandel | |
| Média da turma Mini PC (3322 - 192994, n=105, últimos 2 anos) | |
| Intel NUC 13 Pro Kit NUC13ANK | |
| Beelink SEi11 Pro | |
| Média Intel Core i7-11390H (15441 - 19348, n=4) | |
| Geekom Mini IT11, i7-11390H | |
| Intel NUC 12 Pro Kit NUC12WSBi5 | |
| BMAX B7 Power G7A2 | |
| BMAX B5 Pro G7H8 | |
| AIDA64 / CPU AES | |
| Intel NUC 13 Pro Kit NUC13ANK | |
| Média da turma Mini PC (9214 - 325960, n=104, últimos 2 anos) | |
| Beelink SEi11 Pro | |
| Intel NUC 12 Pro Kit NUC12WSBi5 | |
| Média Intel Core i7-11390H (57644 - 77817, n=4) | |
| BMAX B7 Power G7A2 | |
| Geekom Mini IT11, i7-11390H | |
| BMAX B5 Pro G7H8 | |
| AIDA64 / CPU ZLib | |
| Média da turma Mini PC (127.2 - 2431, n=105, últimos 2 anos) | |
| Intel NUC 12 Pro Kit NUC12WSBi5 | |
| Intel NUC 13 Pro Kit NUC13ANK | |
| Média Intel Core i7-11390H (362 - 424, n=4) | |
| Geekom Mini IT11, i7-11390H | |
| Beelink SEi11 Pro | |
| BMAX B7 Power G7A2 | |
| BMAX B5 Pro G7H8 | |
| AIDA64 / FP64 Ray-Trace | |
| Média da turma Mini PC (537 - 43587, n=105, últimos 2 anos) | |
| Intel NUC 13 Pro Kit NUC13ANK | |
| Beelink SEi11 Pro | |
| Geekom Mini IT11, i7-11390H | |
| Média Intel Core i7-11390H (3138 - 4197, n=4) | |
| Intel NUC 12 Pro Kit NUC12WSBi5 | |
| BMAX B7 Power G7A2 | |
| BMAX B5 Pro G7H8 | |
| AIDA64 / CPU PhotoWorxx | |
| Média da turma Mini PC (8069 - 96843, n=105, últimos 2 anos) | |
| Intel NUC 13 Pro Kit NUC13ANK | |
| Intel NUC 12 Pro Kit NUC12WSBi5 | |
| Beelink SEi11 Pro | |
| Geekom Mini IT11, i7-11390H | |
| Média Intel Core i7-11390H (11409 - 39871, n=4) | |
| BMAX B5 Pro G7H8 | |
| BMAX B7 Power G7A2 | |
Desempenho do sistema
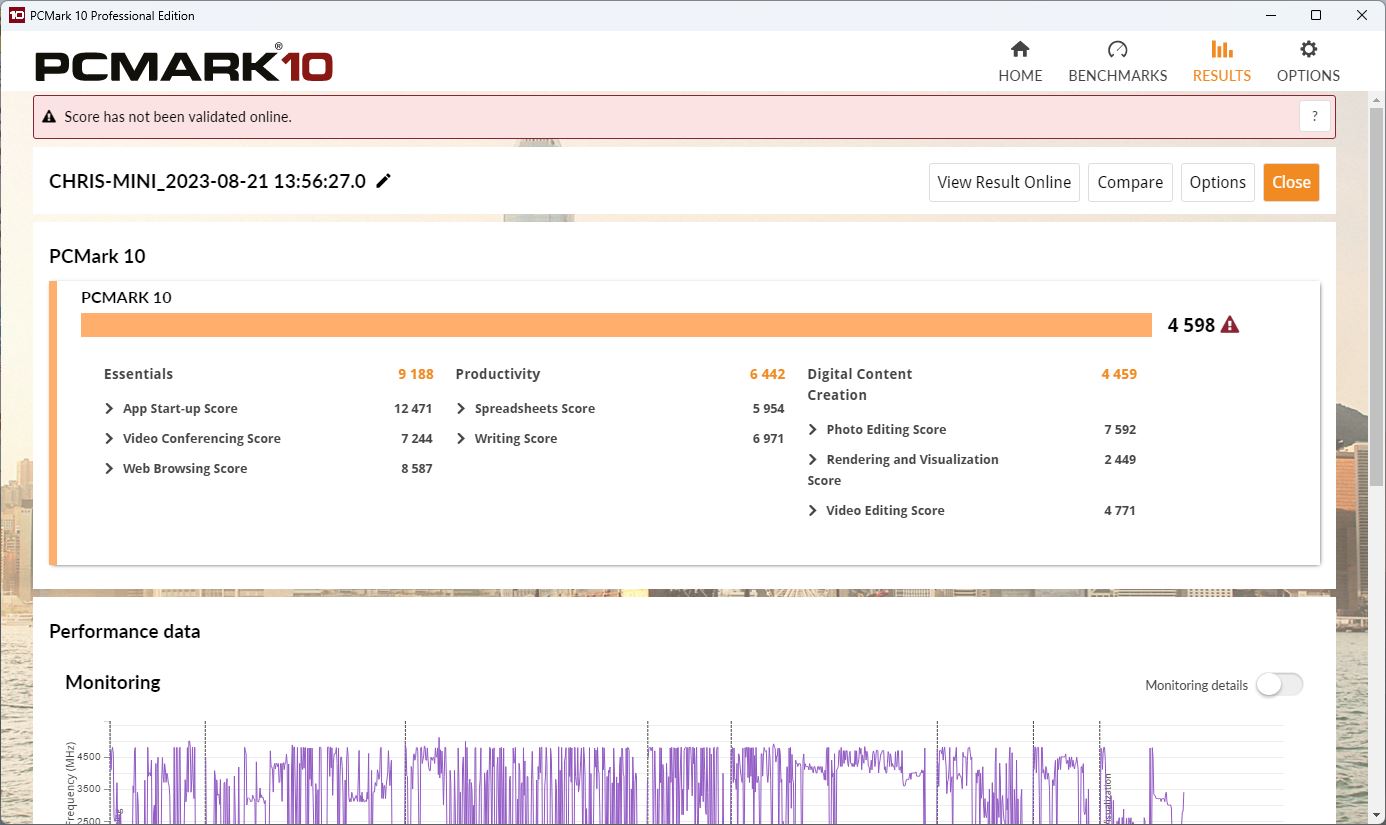
Seu desempenho também ficou atrás de um típico i7-11390Hem 9 por cento no PCMark. No CrossMark, ele ficou apenas 6% atrás.
Subjetivamente, o PC ainda tem um bom desempenho no uso diário quando se trata de navegar na Web e realizar tarefas de escritório.
CrossMark: Overall | Productivity | Creativity | Responsiveness
| PCMark 10 / Score | |
| Média da turma Mini PC (2191 - 9326, n=104, últimos 2 anos) | |
| Intel NUC 13 Pro Kit NUC13ANK | |
| Intel NUC 12 Pro Kit NUC12WSBi5 | |
| Beelink SEi11 Pro | |
| Média Intel Core i7-11390H, Intel Iris Xe Graphics G7 96EUs (4598 - 5475, n=3) | |
| Geekom Mini IT11, i7-11390H | |
| BMAX B7 Power G7A2 | |
| BMAX B5 Pro G7H8 | |
| PCMark 10 / Essentials | |
| Intel NUC 13 Pro Kit NUC13ANK | |
| Intel NUC 12 Pro Kit NUC12WSBi5 | |
| Beelink SEi11 Pro | |
| Média da turma Mini PC (5031 - 11997, n=103, últimos 2 anos) | |
| Média Intel Core i7-11390H, Intel Iris Xe Graphics G7 96EUs (9188 - 10451, n=3) | |
| Geekom Mini IT11, i7-11390H | |
| BMAX B7 Power G7A2 | |
| BMAX B5 Pro G7H8 | |
| PCMark 10 / Productivity | |
| Média da turma Mini PC (3646 - 17739, n=103, últimos 2 anos) | |
| Intel NUC 13 Pro Kit NUC13ANK | |
| Intel NUC 12 Pro Kit NUC12WSBi5 | |
| Beelink SEi11 Pro | |
| Média Intel Core i7-11390H, Intel Iris Xe Graphics G7 96EUs (6442 - 7197, n=3) | |
| Geekom Mini IT11, i7-11390H | |
| BMAX B7 Power G7A2 | |
| BMAX B5 Pro G7H8 | |
| PCMark 10 / Digital Content Creation | |
| Média da turma Mini PC (1558 - 17556, n=103, últimos 2 anos) | |
| Intel NUC 13 Pro Kit NUC13ANK | |
| Intel NUC 12 Pro Kit NUC12WSBi5 | |
| Média Intel Core i7-11390H, Intel Iris Xe Graphics G7 96EUs (4459 - 5920, n=3) | |
| Beelink SEi11 Pro | |
| Geekom Mini IT11, i7-11390H | |
| BMAX B7 Power G7A2 | |
| BMAX B5 Pro G7H8 | |
| CrossMark / Overall | |
| Intel NUC 13 Pro Kit NUC13ANK | |
| Média da turma Mini PC (385 - 2244, n=96, últimos 2 anos) | |
| Geekom Mini IT11, i7-11390H | |
| Média Intel Core i7-11390H, Intel Iris Xe Graphics G7 96EUs (1274 - 1438, n=2) | |
| Beelink SEi11 Pro | |
| BMAX B7 Power G7A2 | |
| BMAX B5 Pro G7H8 | |
| CrossMark / Productivity | |
| Intel NUC 13 Pro Kit NUC13ANK | |
| Média da turma Mini PC (446 - 2790, n=96, últimos 2 anos) | |
| Geekom Mini IT11, i7-11390H | |
| Média Intel Core i7-11390H, Intel Iris Xe Graphics G7 96EUs (1399 - 1523, n=2) | |
| Beelink SEi11 Pro | |
| BMAX B7 Power G7A2 | |
| BMAX B5 Pro G7H8 | |
| CrossMark / Creativity | |
| Intel NUC 13 Pro Kit NUC13ANK | |
| Média da turma Mini PC (340 - 2879, n=96, últimos 2 anos) | |
| Geekom Mini IT11, i7-11390H | |
| Média Intel Core i7-11390H, Intel Iris Xe Graphics G7 96EUs (1198 - 1359, n=2) | |
| Beelink SEi11 Pro | |
| BMAX B7 Power G7A2 | |
| BMAX B5 Pro G7H8 | |
| CrossMark / Responsiveness | |
| Intel NUC 13 Pro Kit NUC13ANK | |
| Média da turma Mini PC (363 - 2191, n=96, últimos 2 anos) | |
| Geekom Mini IT11, i7-11390H | |
| Beelink SEi11 Pro | |
| Média Intel Core i7-11390H, Intel Iris Xe Graphics G7 96EUs (1159 - 1434, n=2) | |
| BMAX B7 Power G7A2 | |
| BMAX B5 Pro G7H8 | |
| PCMark 10 Score | 4598 pontos | |
Ajuda | ||
| AIDA64 / Memory Copy | |
| Média da turma Mini PC (15933 - 163031, n=105, últimos 2 anos) | |
| Intel NUC 13 Pro Kit NUC13ANK | |
| Intel NUC 12 Pro Kit NUC12WSBi5 | |
| Geekom Mini IT11, i7-11390H | |
| Média Intel Core i7-11390H (19409 - 64750, n=4) | |
| Beelink SEi11 Pro | |
| BMAX B5 Pro G7H8 | |
| BMAX B7 Power G7A2 | |
| AIDA64 / Memory Read | |
| Média da turma Mini PC (14143 - 123769, n=105, últimos 2 anos) | |
| Intel NUC 12 Pro Kit NUC12WSBi5 | |
| Geekom Mini IT11, i7-11390H | |
| Beelink SEi11 Pro | |
| Intel NUC 13 Pro Kit NUC13ANK | |
| Média Intel Core i7-11390H (21253 - 59793, n=4) | |
| BMAX B5 Pro G7H8 | |
| BMAX B7 Power G7A2 | |
| AIDA64 / Memory Write | |
| Média da turma Mini PC (10630 - 216693, n=105, últimos 2 anos) | |
| Geekom Mini IT11, i7-11390H | |
| Intel NUC 12 Pro Kit NUC12WSBi5 | |
| Beelink SEi11 Pro | |
| Intel NUC 13 Pro Kit NUC13ANK | |
| Média Intel Core i7-11390H (19684 - 66881, n=4) | |
| BMAX B5 Pro G7H8 | |
| BMAX B7 Power G7A2 | |
| AIDA64 / Memory Latency | |
| Média da turma Mini PC (88.1 - 184.8, n=106, últimos 2 anos) | |
| Intel NUC 13 Pro Kit NUC13ANK | |
| BMAX B5 Pro G7H8 | |
| Intel NUC 12 Pro Kit NUC12WSBi5 | |
| Beelink SEi11 Pro | |
| Média Intel Core i7-11390H (66.3 - 95.3, n=4) | |
| Geekom Mini IT11, i7-11390H | |
| BMAX B7 Power G7A2 | |
* ... menor é melhor
Latência DPC
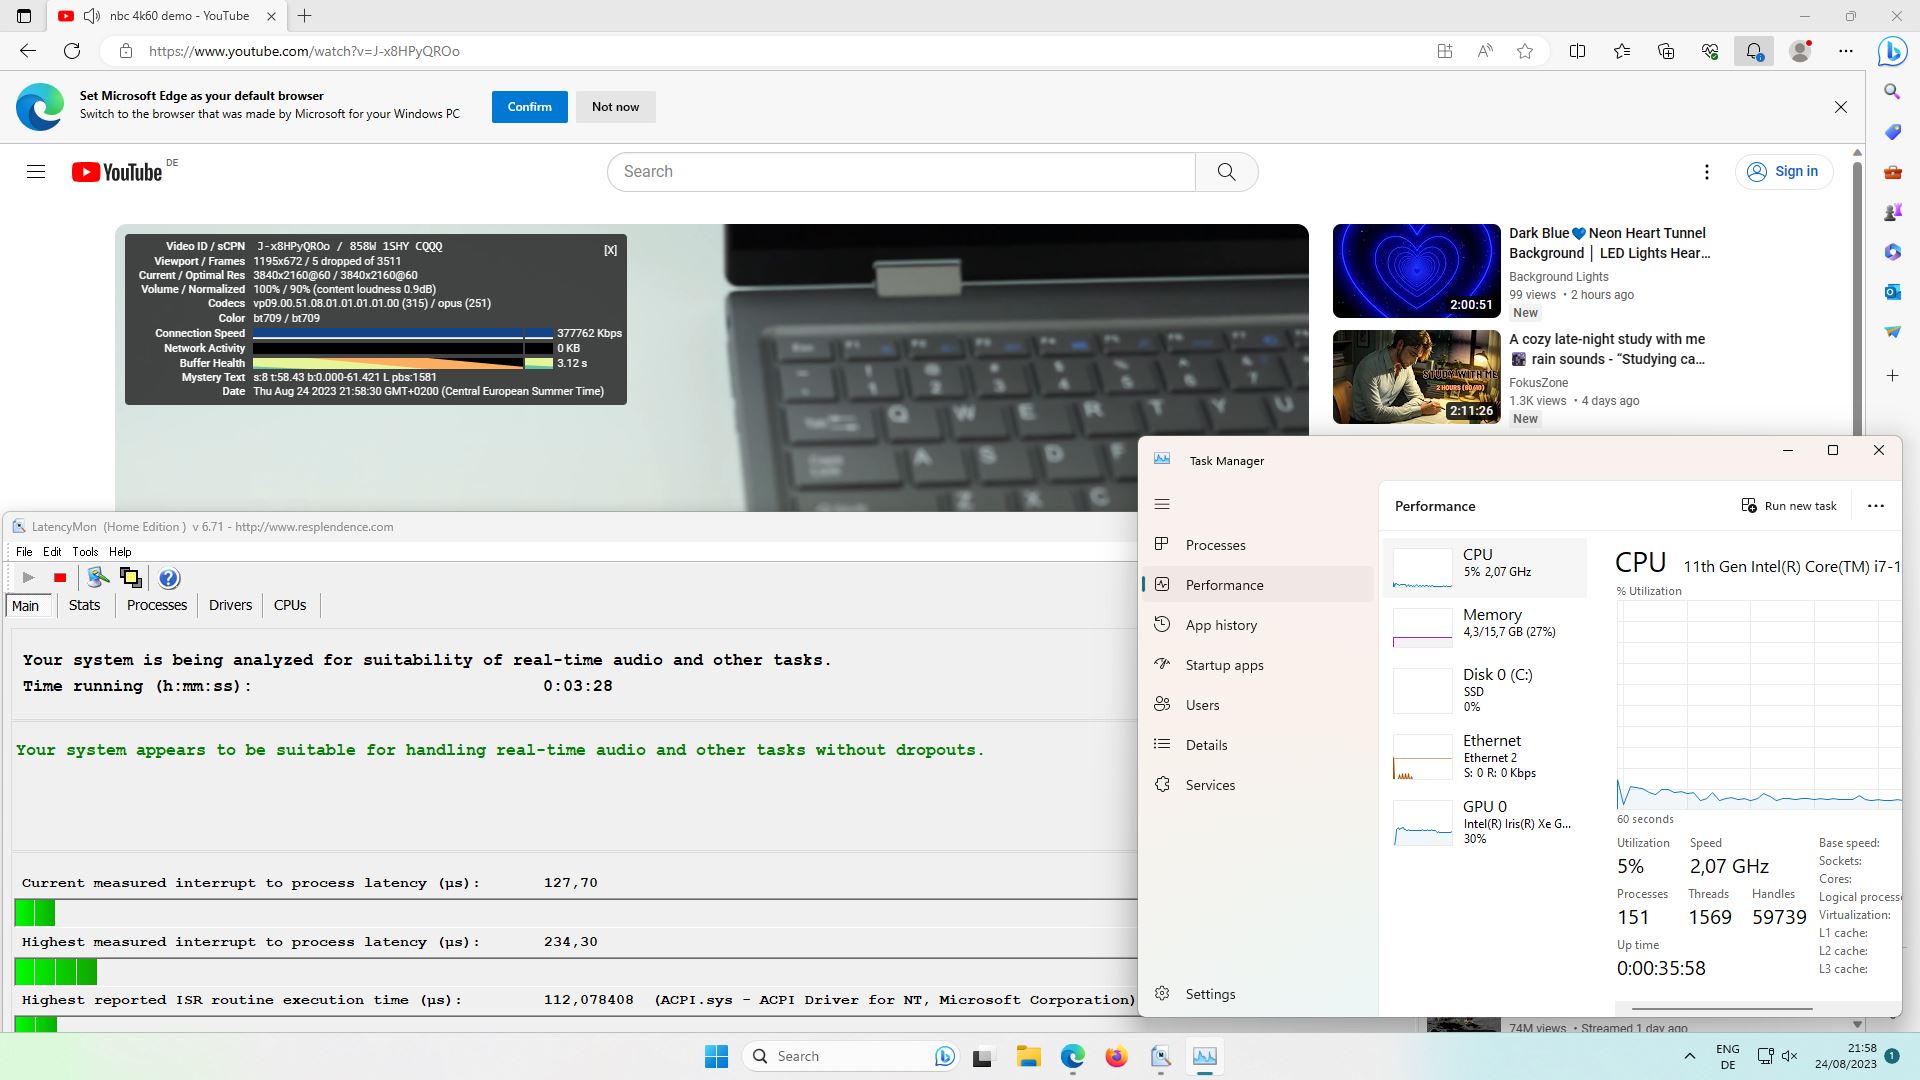
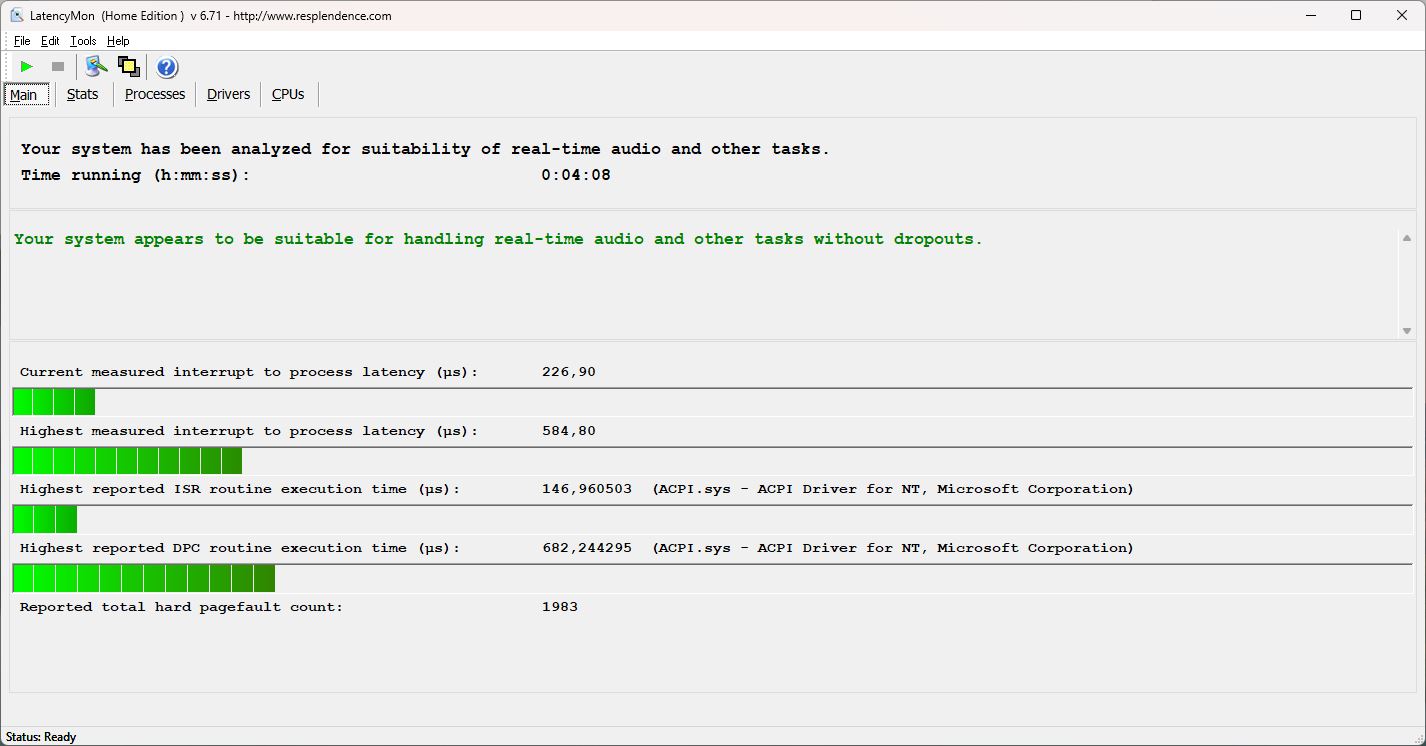
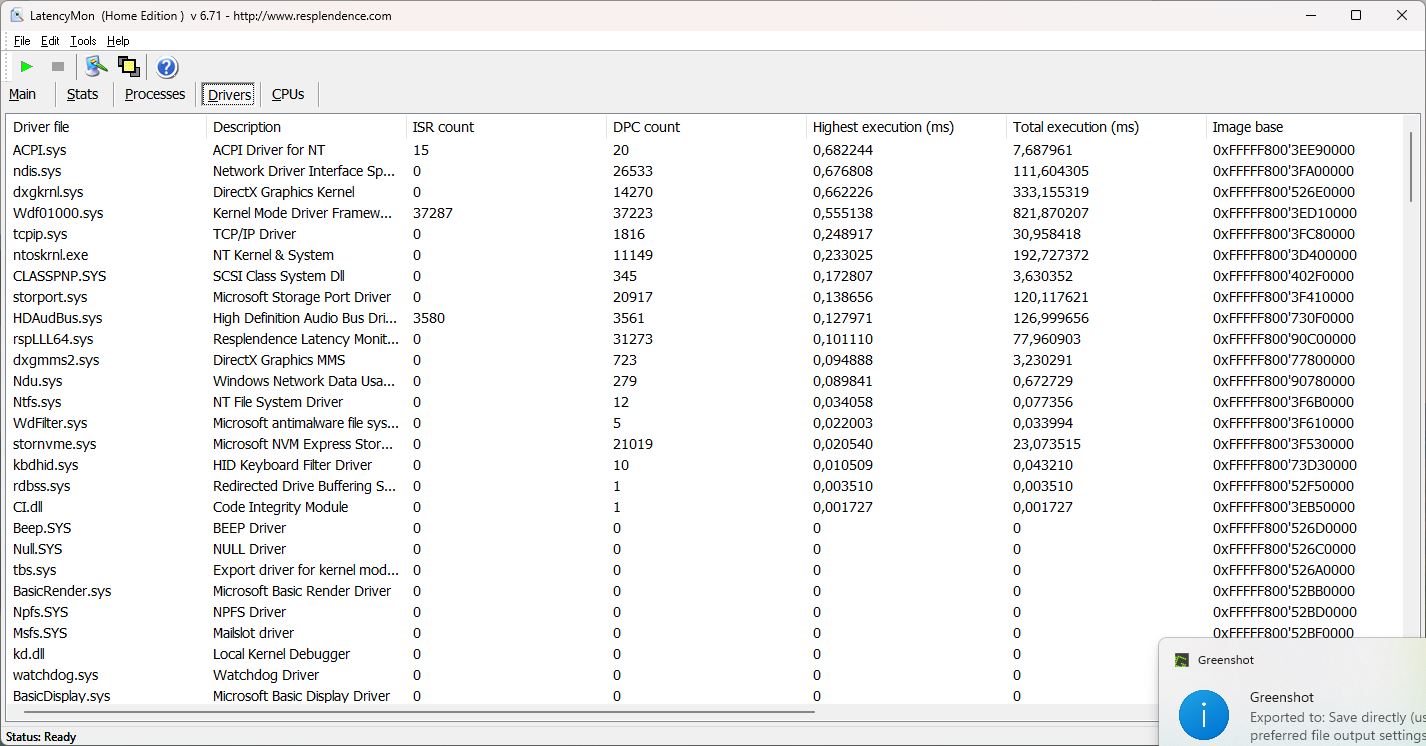
O carregamento de sites não é um problema para o PC cuboide. Ele até mesmo conseguiu abrir facilmente várias guias em nosso site, o que é um grande contraste com a maioria dos laptops para jogos atuais.
Por sua vez, ele não conseguiu reproduzir perfeitamente nosso vídeo em 4K/60 fps - notamos três quedas de quadros - mas, fora isso, ele funcionou muito bem. Isso torna o B7 adequado para reprodução de áudio em tempo real e outros recursos.
Em comparação, as latências dos NUCs da Intel eram mais altas, mas os minicomputadores de última geração da Geekom e da Beelink se saíram um pouco melhor.
| DPC Latencies / LatencyMon - interrupt to process latency (max), Web, Youtube, Prime95 | |
| Intel NUC 13 Pro Kit NUC13ANK | |
| Intel NUC 12 Pro Kit NUC12WSBi5 | |
| BMAX B7 Power G7A2 | |
| Geekom Mini IT11, i7-11390H | |
| BMAX B5 Pro G7H8 | |
| Beelink SEi11 Pro | |
* ... menor é melhor
Dispositivos de armazenamento
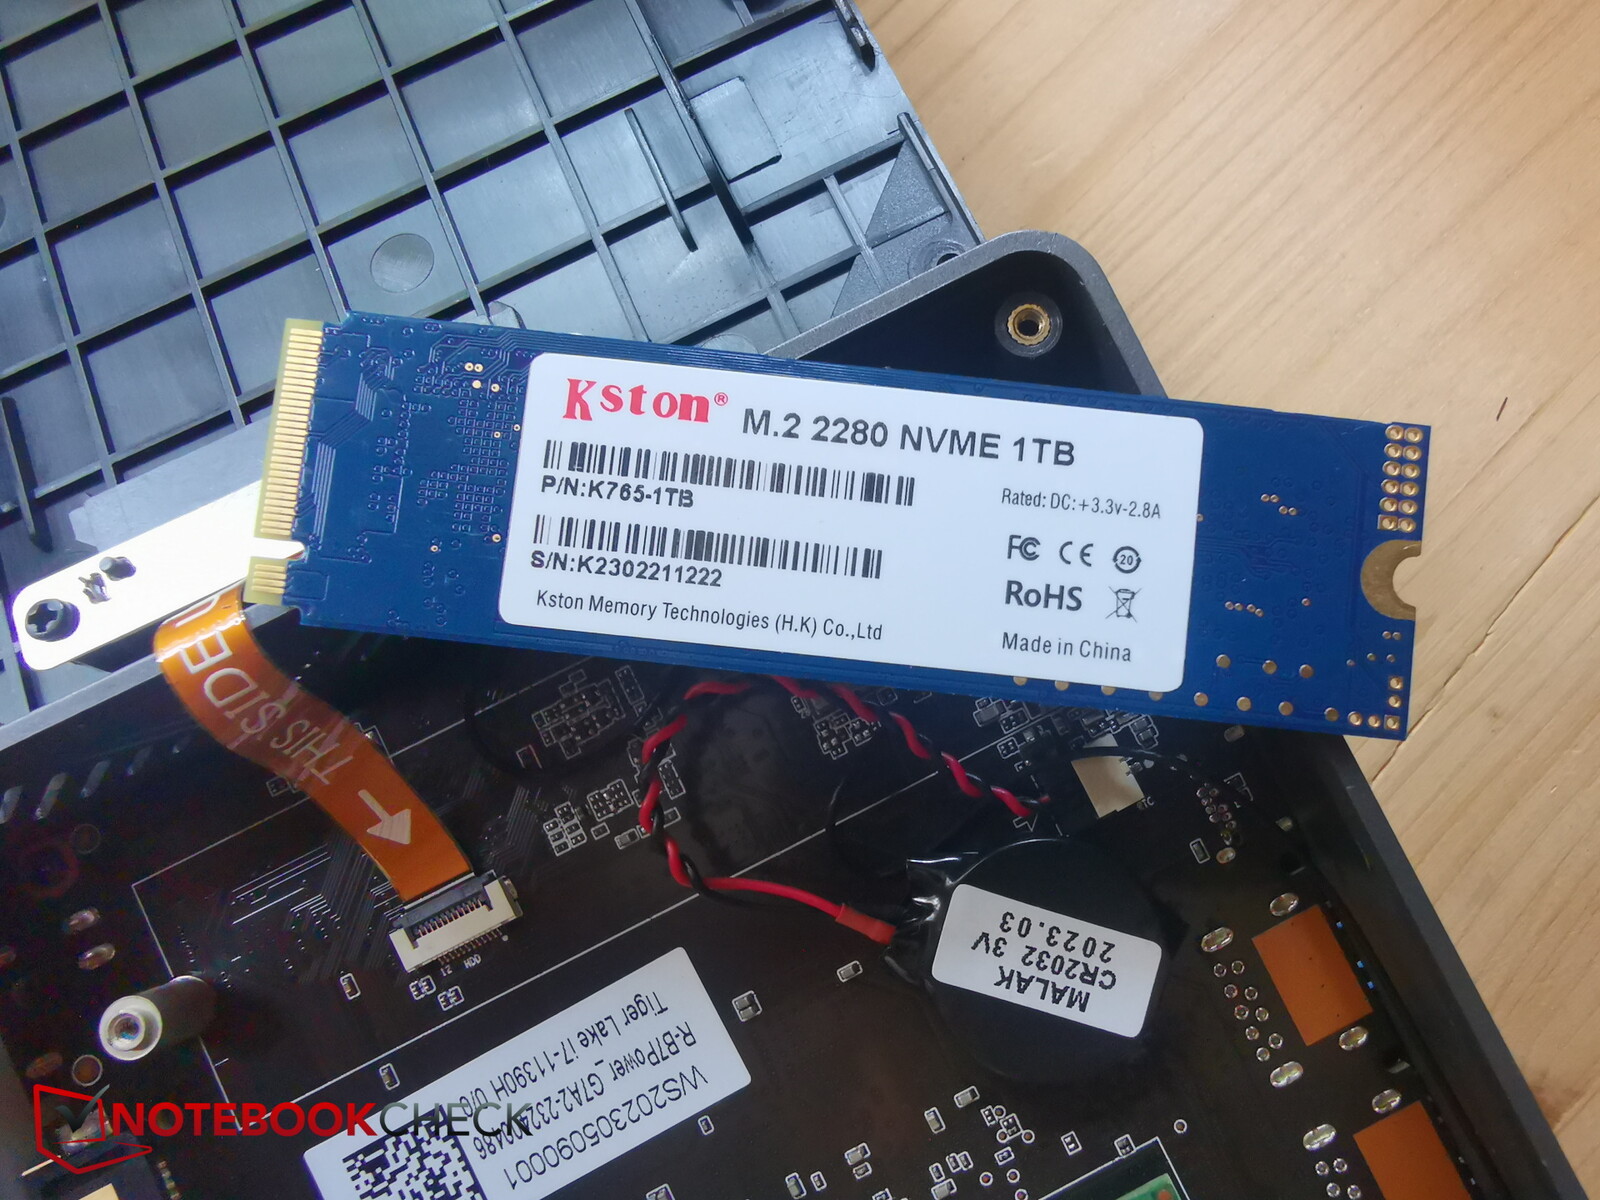
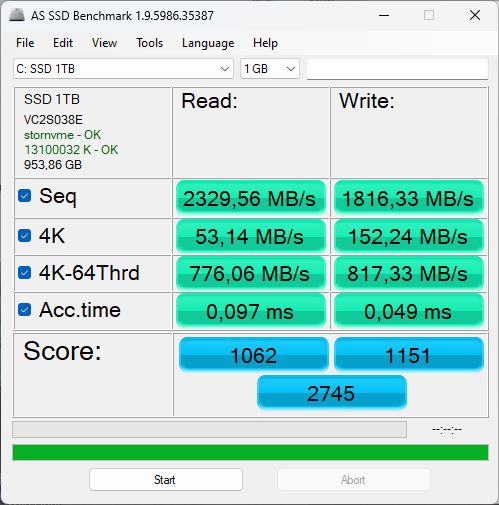
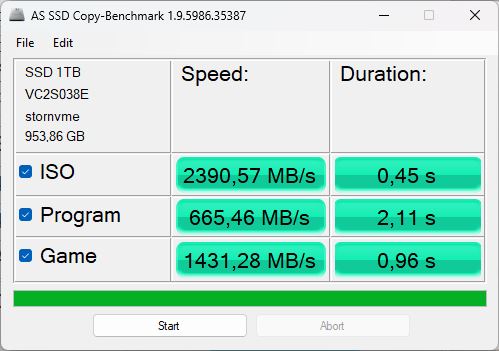
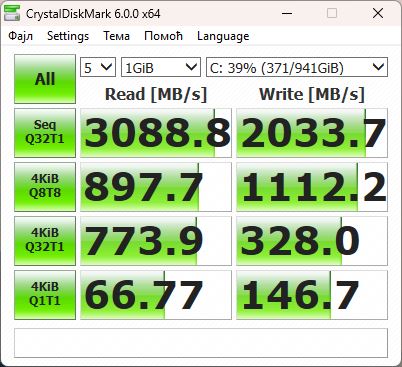
A BMAX instalou um SSD de 1 TB no dispositivo - é também assim que ele é rotulado em todos os lugares no Windows e até mesmo no BIOS. Em todos os lugares está escrito apenas "SSD 1 TB". Para determinar o modelo instalado e seu fabricante, é necessário abrir o B7 Power e remover a SSD. Há uma etiqueta na parte traseira. Um "Kston K765-1TB" não é muito conhecido aqui. Ele realmente não deveria ter motivos para se esconder - em comparação, esse modelo ainda alcançou taxas de transmissão decentes. Somente o SSD da Samsung dentro doNUC 13teve um desempenho consideravelmente melhor em todos os testes.
Infelizmente, seu desempenho foi um pouco prejudicado durante os períodos de carga mais longa devido aos limites térmicos. Não há uma unidade de resfriamento instalada, mas ela seria recomendada.

* ... menor é melhor
Reading continuous performance: DiskSpd Read Loop, Queue Depth 8
Placa de vídeo
Uma Intel Iris Xe Graphics G7 96EUsintegrada ao processador atua como a placa gráfica do PC. Dependendo do processador e do consumo de energia, seu desempenho varia bastante.
Mesmo nos benchmarks 3D, seu desempenho ficou bem abaixo da média. Em média, a Xe Graphics G7 com 96 EUs em nosso banco de dados teve um desempenho 51% melhor! Mesmo assim, o B7 Power conseguiu ser 118% melhor do que o B5 com um Intel UHD Graphics 620. Seu desempenho ainda é muito fraco e o hardware instalado é muito limitado. Seus concorrentes com a mesma iGPU permaneceram muito mais próximos dos valores médios e, como resultado, muito à frente do B7. Não é de surpreender que oNUC 13 Profoi o atual campeão nesse campo.
| 3DMark 11 Performance | 4743 pontos | |
| 3DMark Cloud Gate Standard Score | 13442 pontos | |
| 3DMark Fire Strike Score | 2546 pontos | |
| 3DMark Time Spy Score | 1103 pontos | |
Ajuda | ||
* ... menor é melhor
Desempenho em jogos
Apesar de seu nome conter o termo "potência", o B7 realmente não foi feito para jogos. Ele é muito mais adequado para o uso diário como um dispositivo de escritório.
Ao executar o Witcher 3 Ultra, o PC conseguiu apenas 8 a 9 fps em média. O Geekom Mini IT11com a mesma CPU/iGPU foi 30 por cento mais rápido. O Beelink SEi11 Pro- apesar de sua CPU um pouco mais fraca, ficou à frente de ambos os outros.
Na resolução mais baixa e com as configurações de detalhes mais baixas, você pode obter uma média de 48 fps ao jogar The Witcher 3. Em 720p e com detalhes médios, você pode atingir 30 fps.
O Far Cry 5 também mal pôde ser jogado nas configurações mais baixas (1.280 x 720, Low, ~ 29 fps). Você terá que se contentar com jogos mais antigos ou menos exigentes e, muitas vezes, apenas com configurações reduzidas. Por outro lado, recomendamos usar esse PC como um console retrô, por exemplo, em combinação com o RetroArch.
| Performance rating - Percent | |
| Média da turma Mini PC | |
| Intel NUC 13 Pro Kit NUC13ANK -3! | |
| Beelink SEi11 Pro -1! | |
| Intel NUC 12 Pro Kit NUC12WSBi5 -5! | |
| Geekom Mini IT11, i7-11390H -2! | |
| BMAX B7 Power G7A2 | |
| BMAX B5 Pro G7H8 -5! | |
| The Witcher 3 - 1920x1080 Ultra Graphics & Postprocessing (HBAO+) | |
| Média da turma Mini PC (11.9 - 271, n=54, últimos 2 anos) | |
| Intel NUC 13 Pro Kit NUC13ANK | |
| Beelink SEi11 Pro | |
| Geekom Mini IT11, i7-11390H | |
| BMAX B7 Power G7A2 | |
| GTA V - 1920x1080 Highest AA:4xMSAA + FX AF:16x | |
| Média da turma Mini PC (2.71 - 124.7, n=78, últimos 2 anos) | |
| Geekom Mini IT11, i7-11390H | |
| Geekom Mini IT11, i7-11390H | |
| BMAX B7 Power G7A2 | |
| Final Fantasy XV Benchmark - 1920x1080 High Quality | |
| Média da turma Mini PC (5.3 - 209, n=95, últimos 2 anos) | |
| Beelink SEi11 Pro | |
| BMAX B7 Power G7A2 | |
| Strange Brigade - 1920x1080 ultra AA:ultra AF:16 | |
| Média da turma Mini PC (17 - 245, n=48, últimos 2 anos) | |
| Intel NUC 13 Pro Kit NUC13ANK | |
| Beelink SEi11 Pro | |
| Geekom Mini IT11, i7-11390H | |
| BMAX B7 Power G7A2 | |
| Dota 2 Reborn - 1920x1080 ultra (3/3) best looking | |
| Média da turma Mini PC (8.2 - 213, n=103, últimos 2 anos) | |
| Intel NUC 13 Pro Kit NUC13ANK | |
| Beelink SEi11 Pro | |
| Geekom Mini IT11, i7-11390H | |
| Intel NUC 12 Pro Kit NUC12WSBi5 | |
| BMAX B7 Power G7A2 | |
| BMAX B5 Pro G7H8 | |
| X-Plane 11.11 - 1920x1080 high (fps_test=3) | |
| Média da turma Mini PC (4.77 - 147.9, n=87, últimos 2 anos) | |
| Beelink SEi11 Pro | |
| BMAX B7 Power G7A2 | |
Durante uma hora, seu desempenho oscilou muito ao jogar The Witcher 3, o que sugere estrangulamento térmico. Pelo menos, a ferramenta CapframeX mediu valores flutuantes entre 7 e cerca de 20 fps. Esse último valor só foi alcançado em rajadas curtas - o número médio de fps ficou em 8,8.
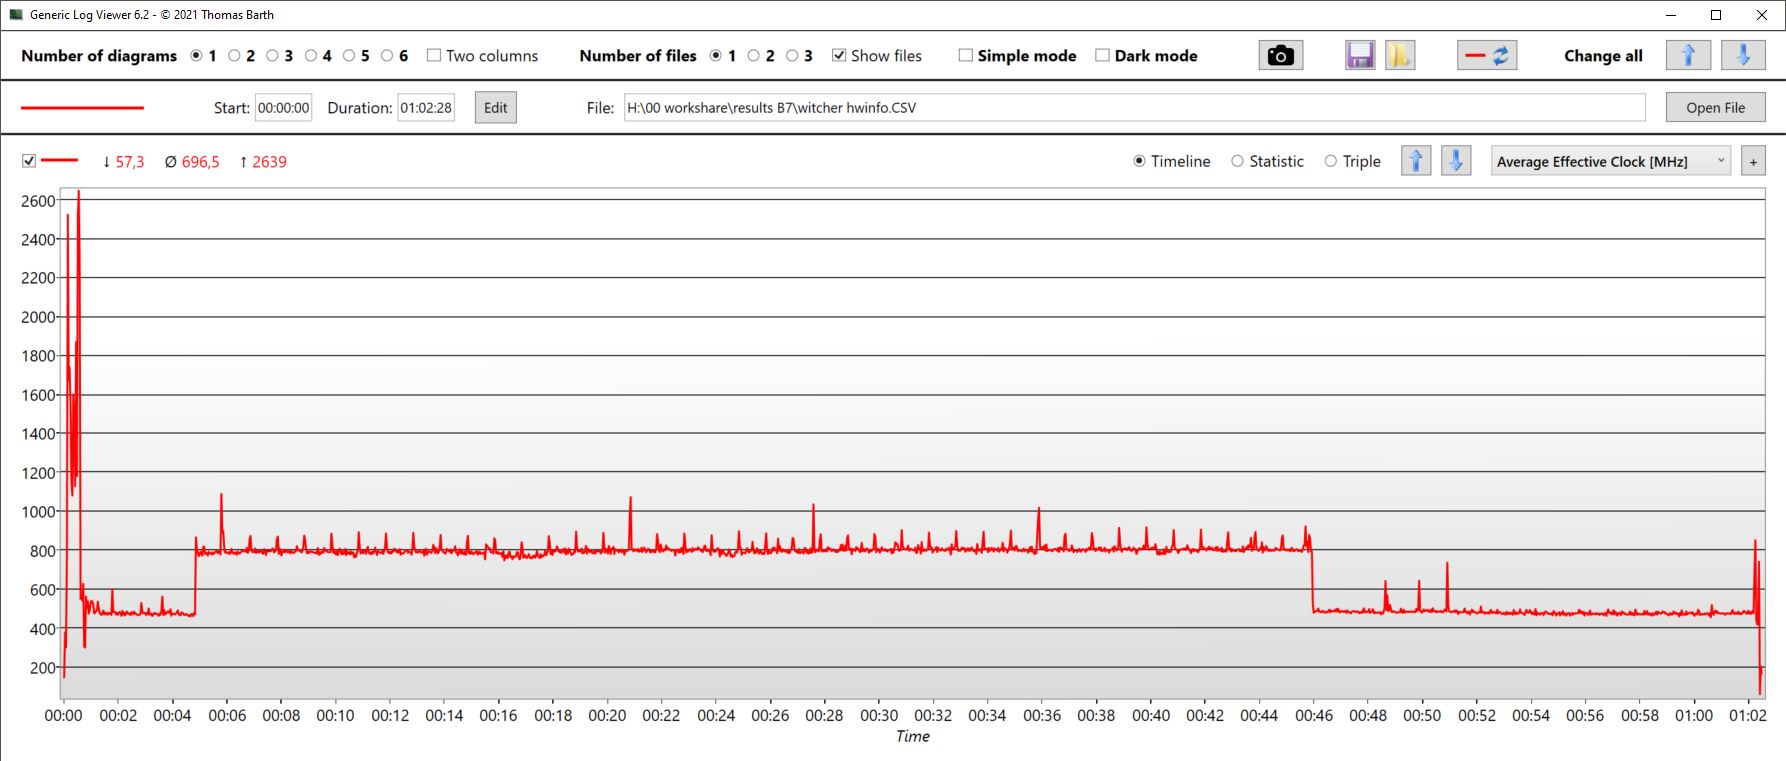
Witcher 3 FPS diagram
| baixo | média | alto | ultra | |
|---|---|---|---|---|
| GTA V (2015) | 56.4 | 44.8 | 4.13 | |
| The Witcher 3 (2015) | 48.4 | 31.3 | 8.8 | |
| Dota 2 Reborn (2015) | 92.3 | 64.9 | 32.9 | 29.6 |
| Final Fantasy XV Benchmark (2018) | 22.1 | 10.5 | 8.15 | |
| X-Plane 11.11 (2018) | 38 | 30 | 27.9 | |
| Far Cry 5 (2018) | 29 | |||
| Strange Brigade (2018) | 49 | 18.2 | 15.4 | 13.2 |
| Diablo 4 (2023) | 16.3 |
Emissões - O silencioso B7 Power
Emissões de ruído
Ok, seu desempenho é inferior, mas será que o B7 Power pode se redimir, pelo menos, na forma de suas emissões e se mostrar como um mini PC silencioso e econômico?
O B7 Power tem apenas uma ventoinha. Mesmo no modo inativo, ela é ativada após um curto período de tempo. No entanto, é preciso aproximar o ouvido do gabinete para ouvir esses 25 dB. Mesmo sob carga máxima, a ventoinha não faz muito barulho - medimos 27 dB.
O NUC13, mais potente, é muito mais barulhento, com emissões de ruído superiores a 40 dB. O B7 Power é, de longe, o mini PC mais silencioso nessa comparação.
Barulho
| Ocioso |
| 23 / 25.12 / 25.12 dB |
| Carga |
| 27.15 / 27.15 dB |
 | ||
30 dB silencioso 40 dB(A) audível 50 dB(A) ruidosamente alto |
||
min: | ||
| BMAX B7 Power G7A2 Iris Xe G7 96EUs, i7-11390H, Kston K765-1TB | Geekom Mini IT11, i7-11390H Iris Xe G7 96EUs, i7-11390H, Lexar 1024GB LNM6A1X001T-HNNNG | Intel NUC 13 Pro Kit NUC13ANK Iris Xe G7 96EUs, i7-1360P, Samsung PM9A1 MZVL2512HCJQ | Beelink SEi11 Pro Iris Xe G7 96EUs, i5-11320H, Kingston NV1 SNVS/500GCN | BMAX B5 Pro G7H8 UHD Graphics 620, i5-8260U | |
|---|---|---|---|---|---|
| Noise | -23% | -35% | -13% | -7% | |
| desligado / ambiente * (dB) | 23 | 29.7 -29% | 29.8 -30% | 22.8 1% | 23 -0% |
| Idle Minimum * (dB) | 23 | 30.2 -31% | 30.2 -31% | 24.7 -7% | 25.1 -9% |
| Idle Average * (dB) | 25.12 | 30.2 -20% | 31.1 -24% | 24.7 2% | 25.1 -0% |
| Idle Maximum * (dB) | 25.12 | 30.2 -20% | 31.9 -27% | 25.3 -1% | 25.1 -0% |
| Load Average * (dB) | 27.15 | 30.6 -13% | 40 -47% | 33.2 -22% | 28.6 -5% |
| Witcher 3 ultra * (dB) | 27.15 | 30.5 -12% | 34.5 -27% | 30.1 -11% | |
| Load Maximum * (dB) | 27.15 | 36.4 -34% | 40.5 -49% | 37.8 -39% | 34 -25% |
* ... menor é melhor
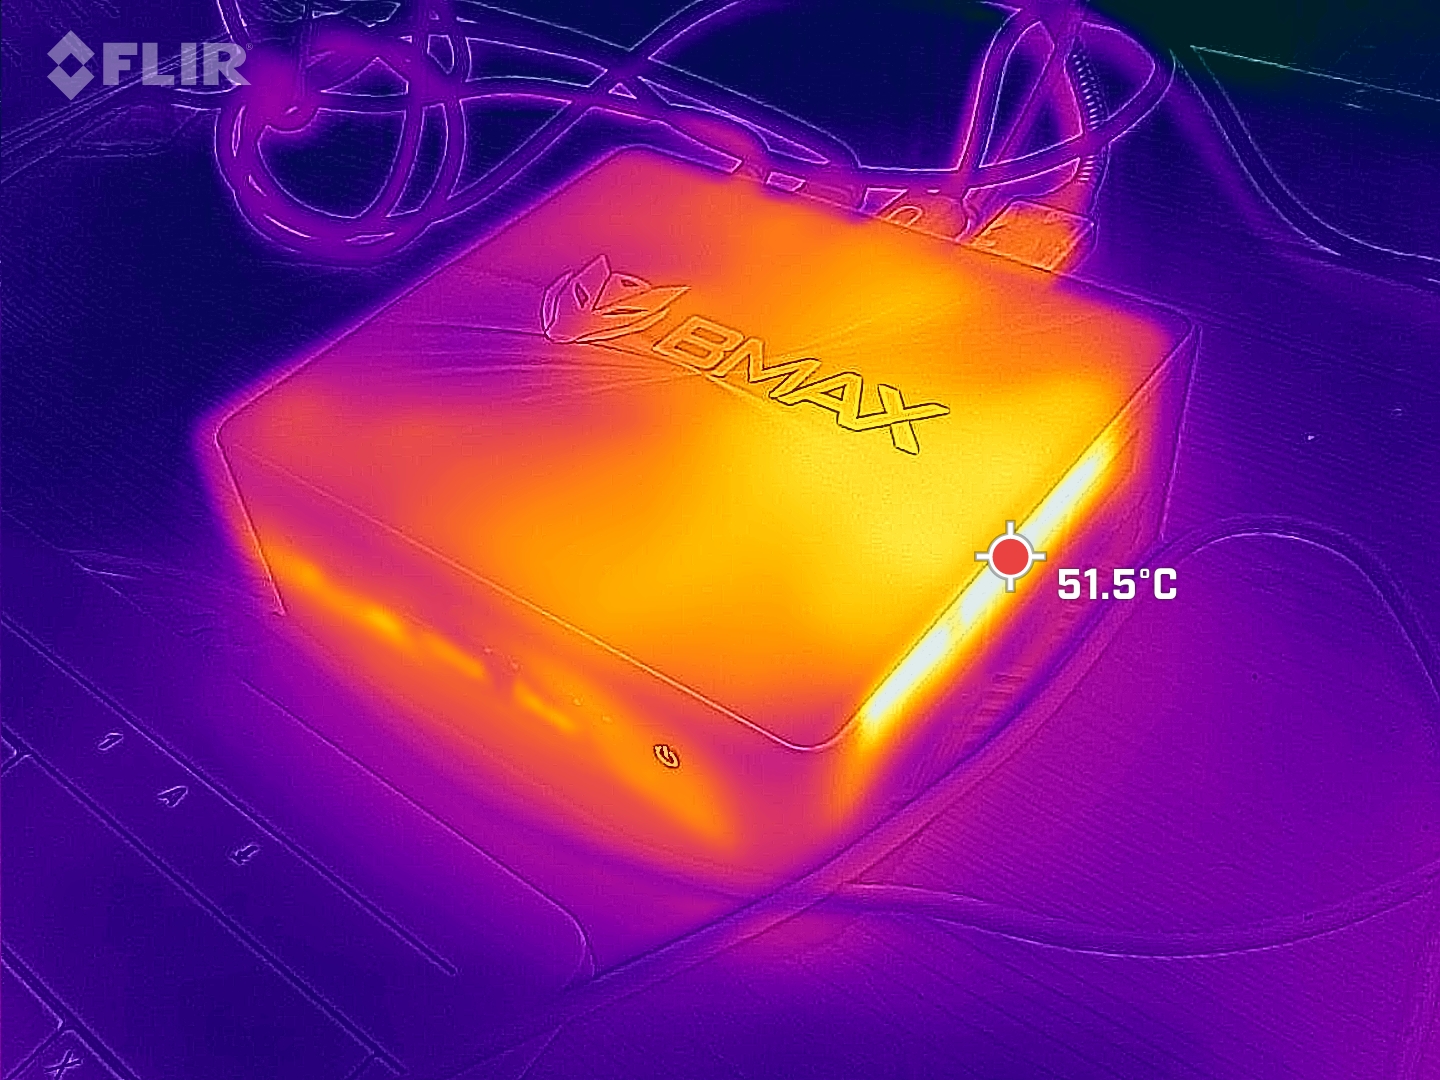
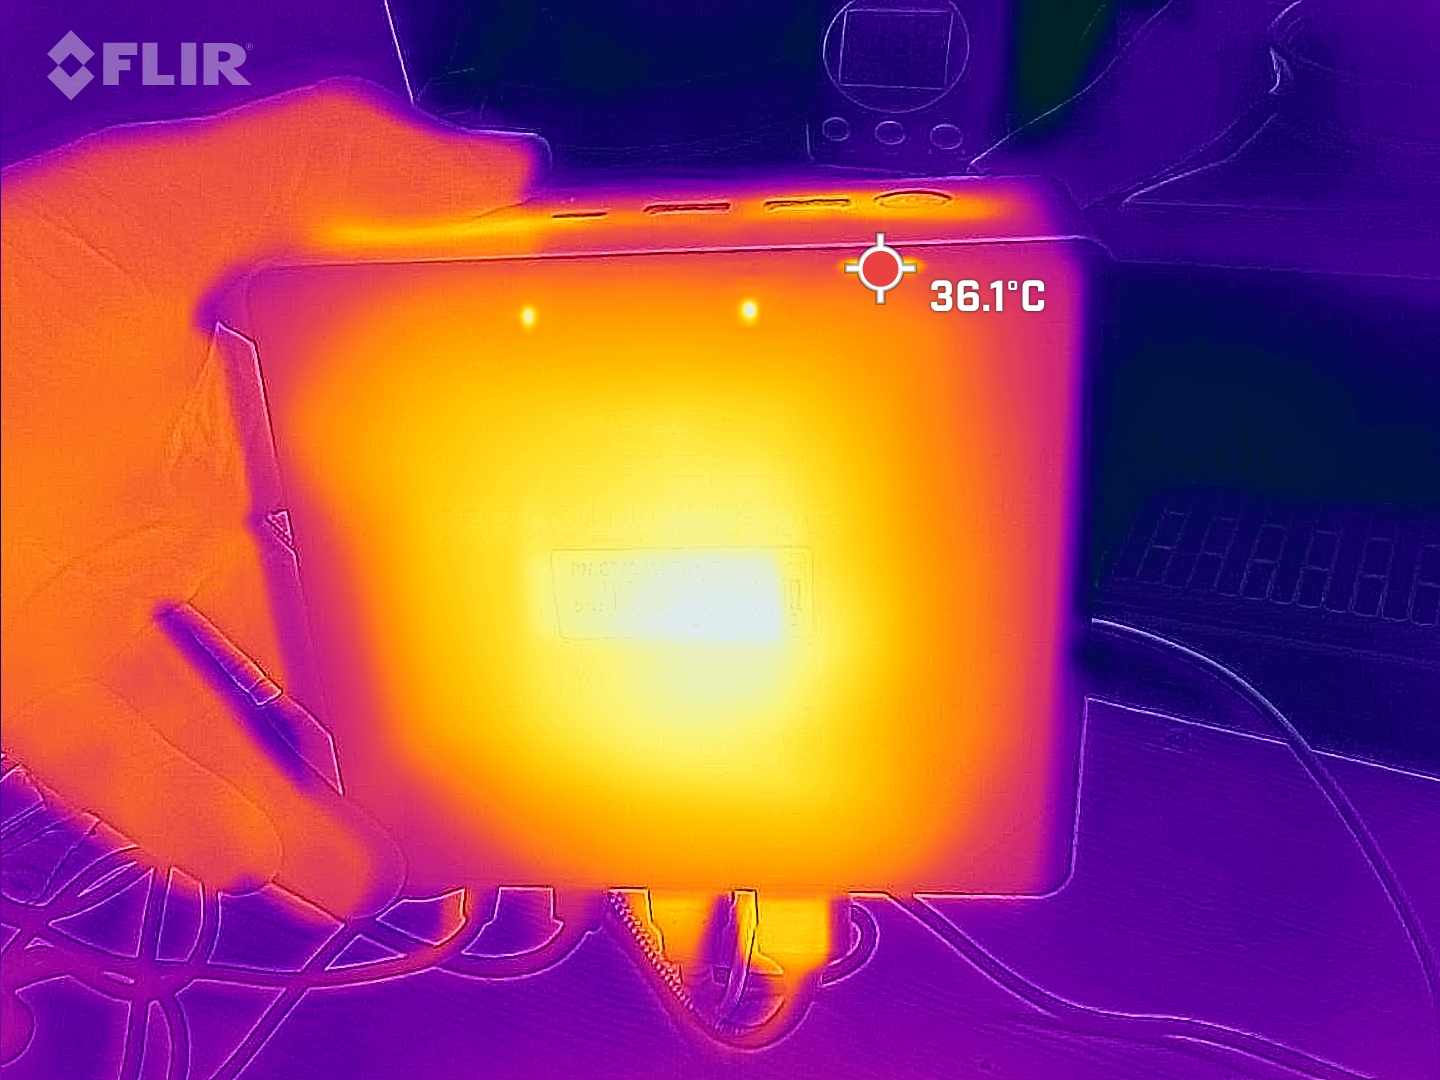
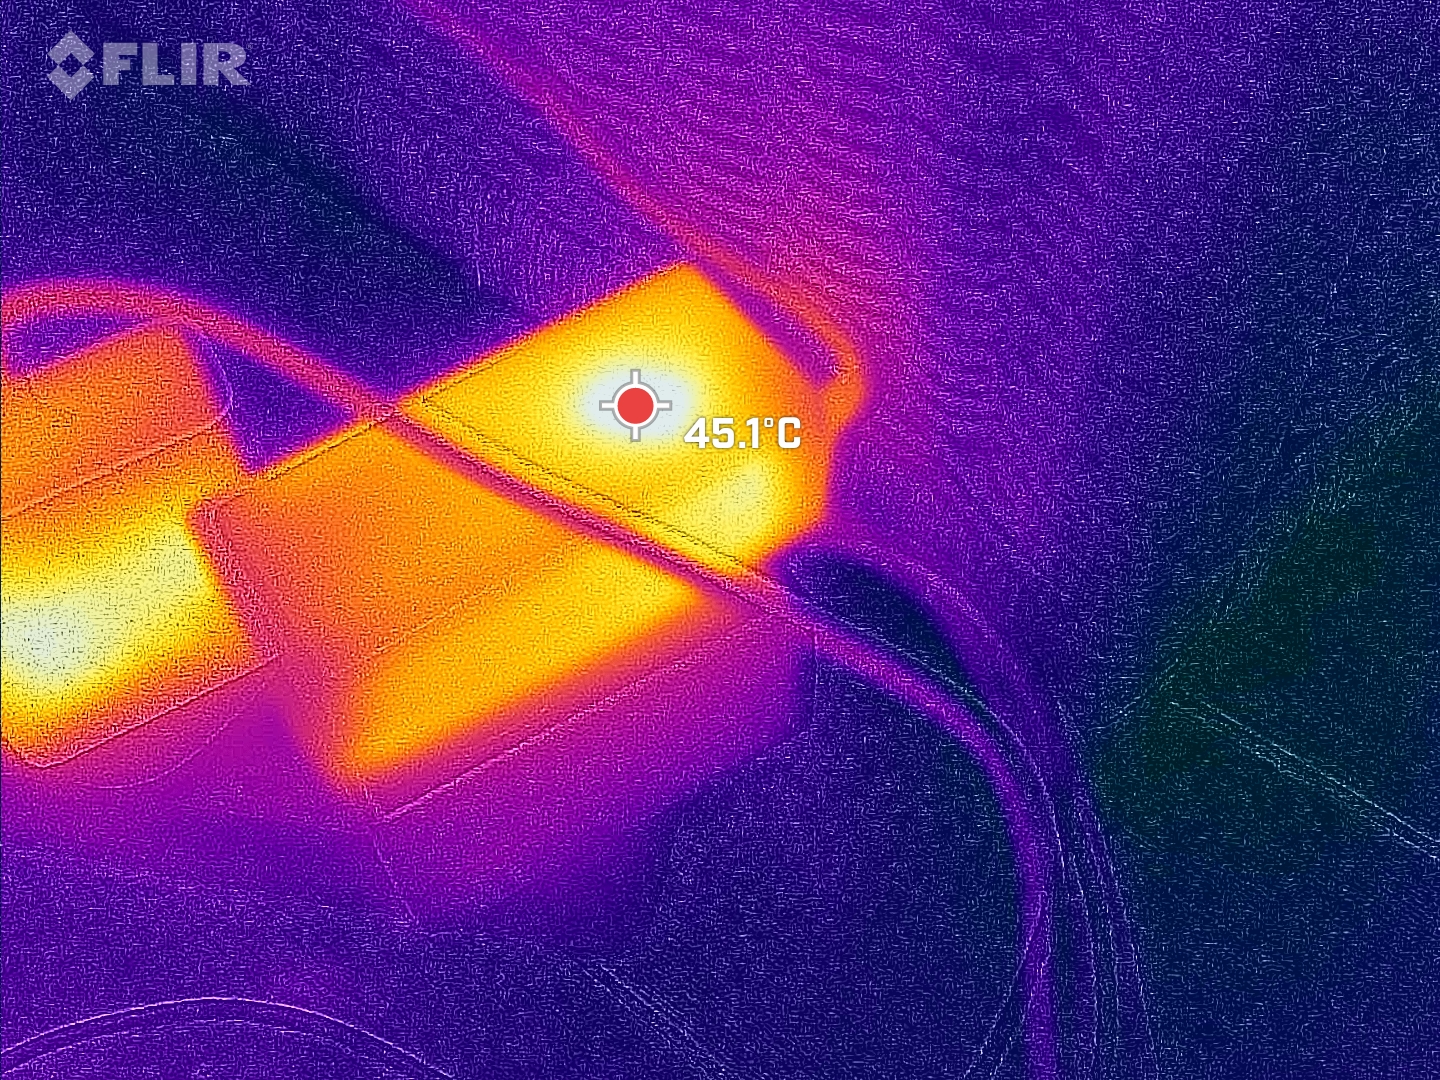
Temperatura
Por outro lado, a ventoinha silenciosa também leva a temperaturas bastante altas, mas, felizmente, apenas onde fica a grade de ar. As partes superior e inferior do gabinete atingiram temperaturas médias de apenas 43 °C durante os testes de jogos e de estresse. Onde o ar é expelido para fora do gabinete, no lado direito, medimos até 54 °C.
(±) A temperatura máxima no lado superior é 43 °C / 109 F, em comparação com a média de 35.4 °C / 96 F , variando de 20.6 a 69.5 °C para a classe Mini PC.
(±) A parte inferior aquece até um máximo de 42 °C / 108 F, em comparação com a média de 36.1 °C / 97 F
(±) Em uso inativo, a temperatura média para o lado superior é 35.2 °C / 95 F, em comparação com a média do dispositivo de 32.1 °C / ### class_avg_f### F.
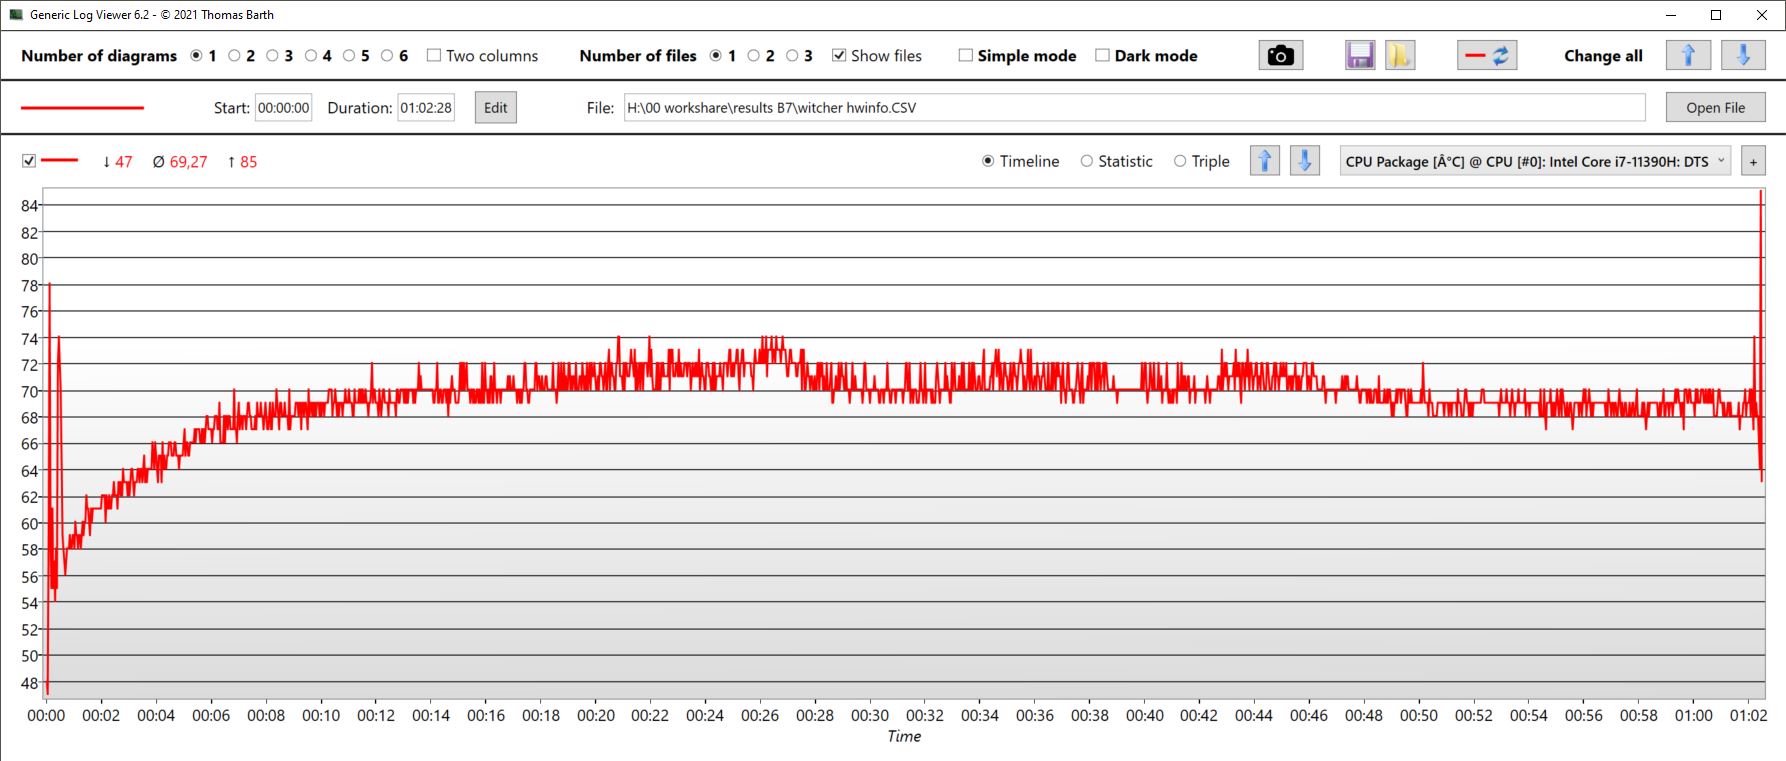
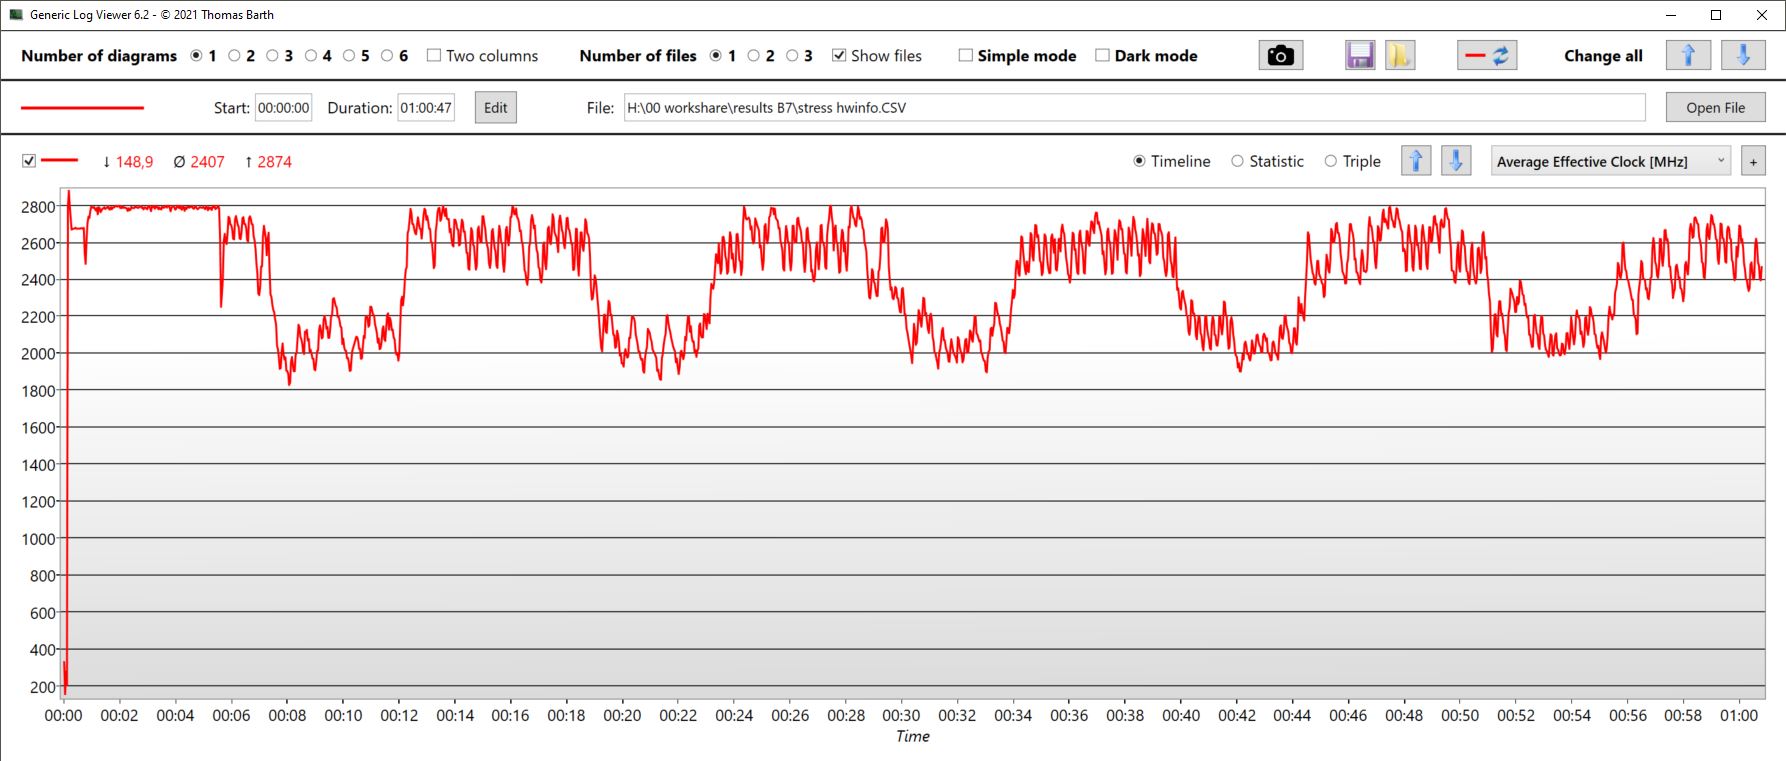
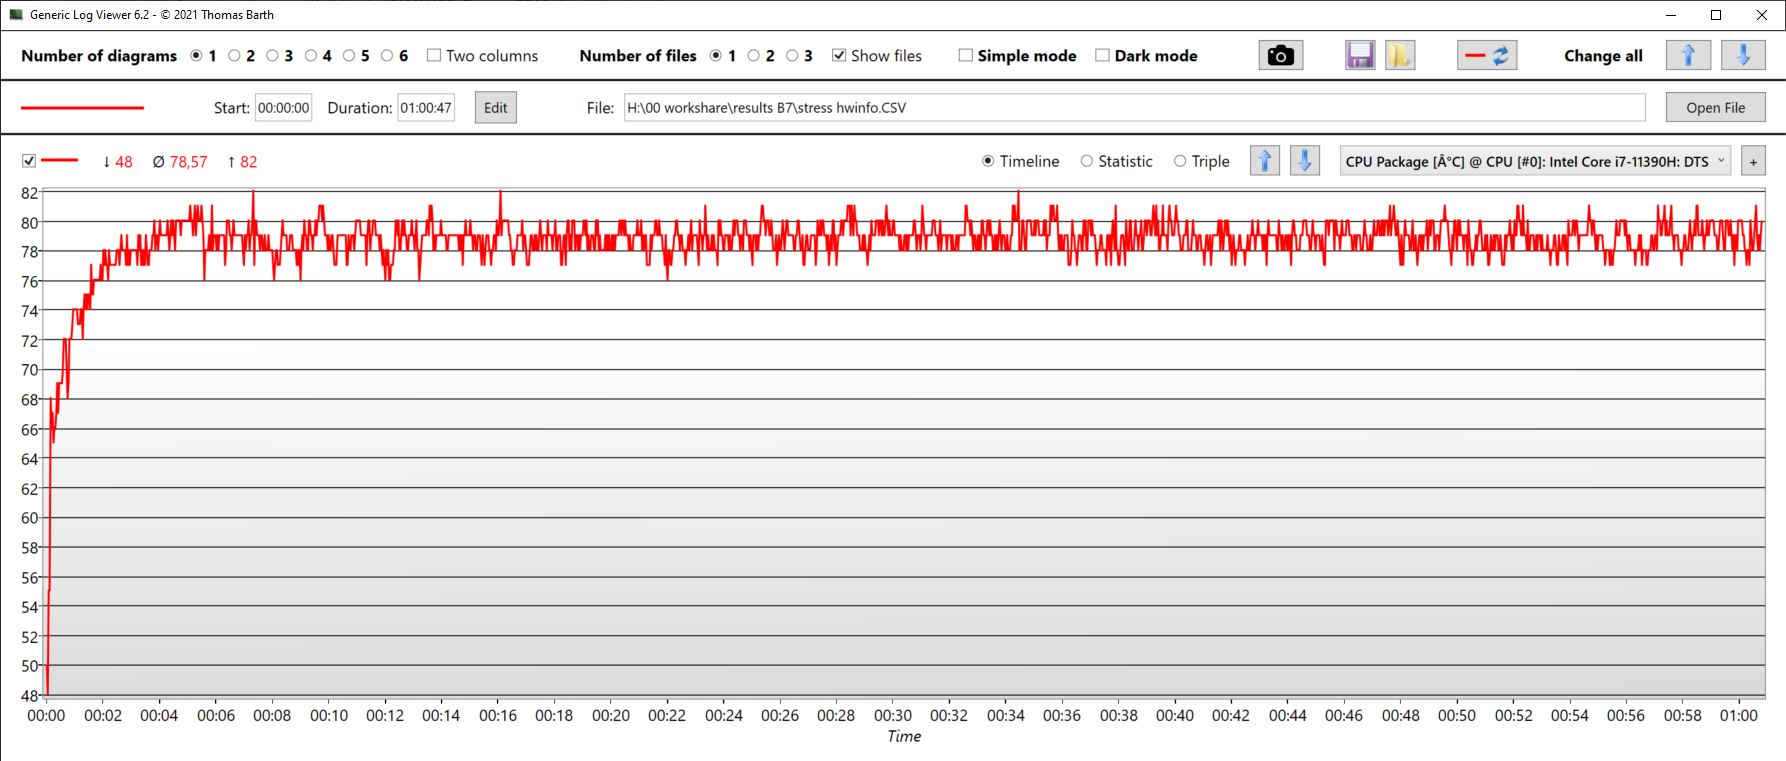
Teste de estresse
O Prime95 e o Furmark foram executados simultaneamente no teste de estresse. A CPU atingiu brevemente um clock de até 2,8 GHz. Após uma pequena queda, o processador manteve o clock de 2,8 GHz durante os cinco minutos seguintes, após o que caiu repetidamente para 1,8 a 2,3 GHz em ciclos. As temperaturas individuais dos núcleos nunca subiram acima de 78°C. Entretanto, a CPU como um todo aqueceu até 82 °C, mas 78 °C foram mantidos em média.
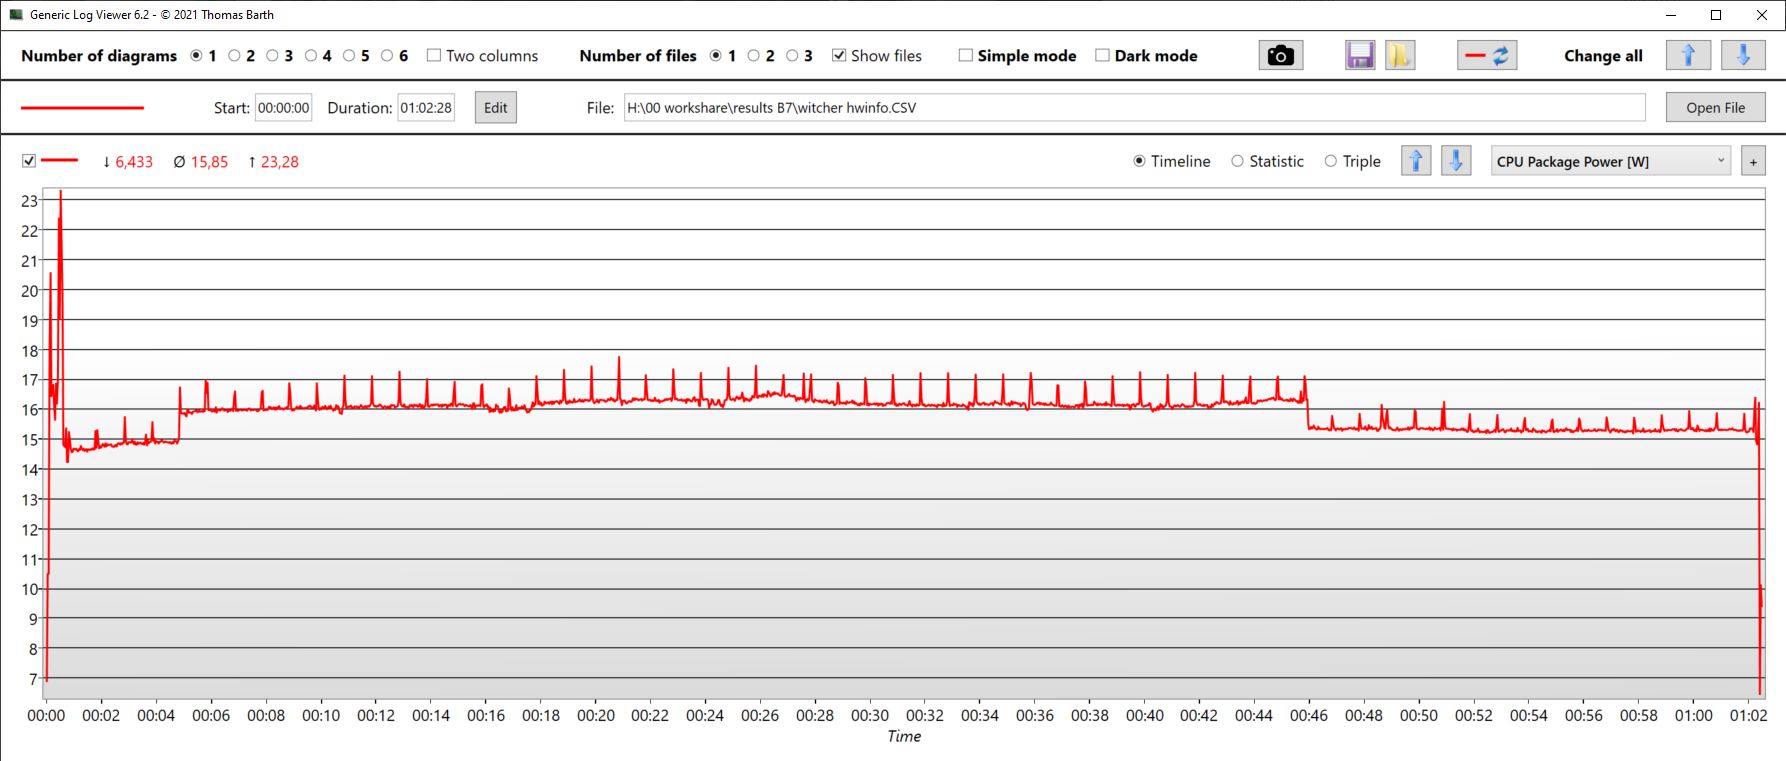
O consumo de energia da CPU foi de 24 watts no início, mas apenas cerca de 19 watts em média.
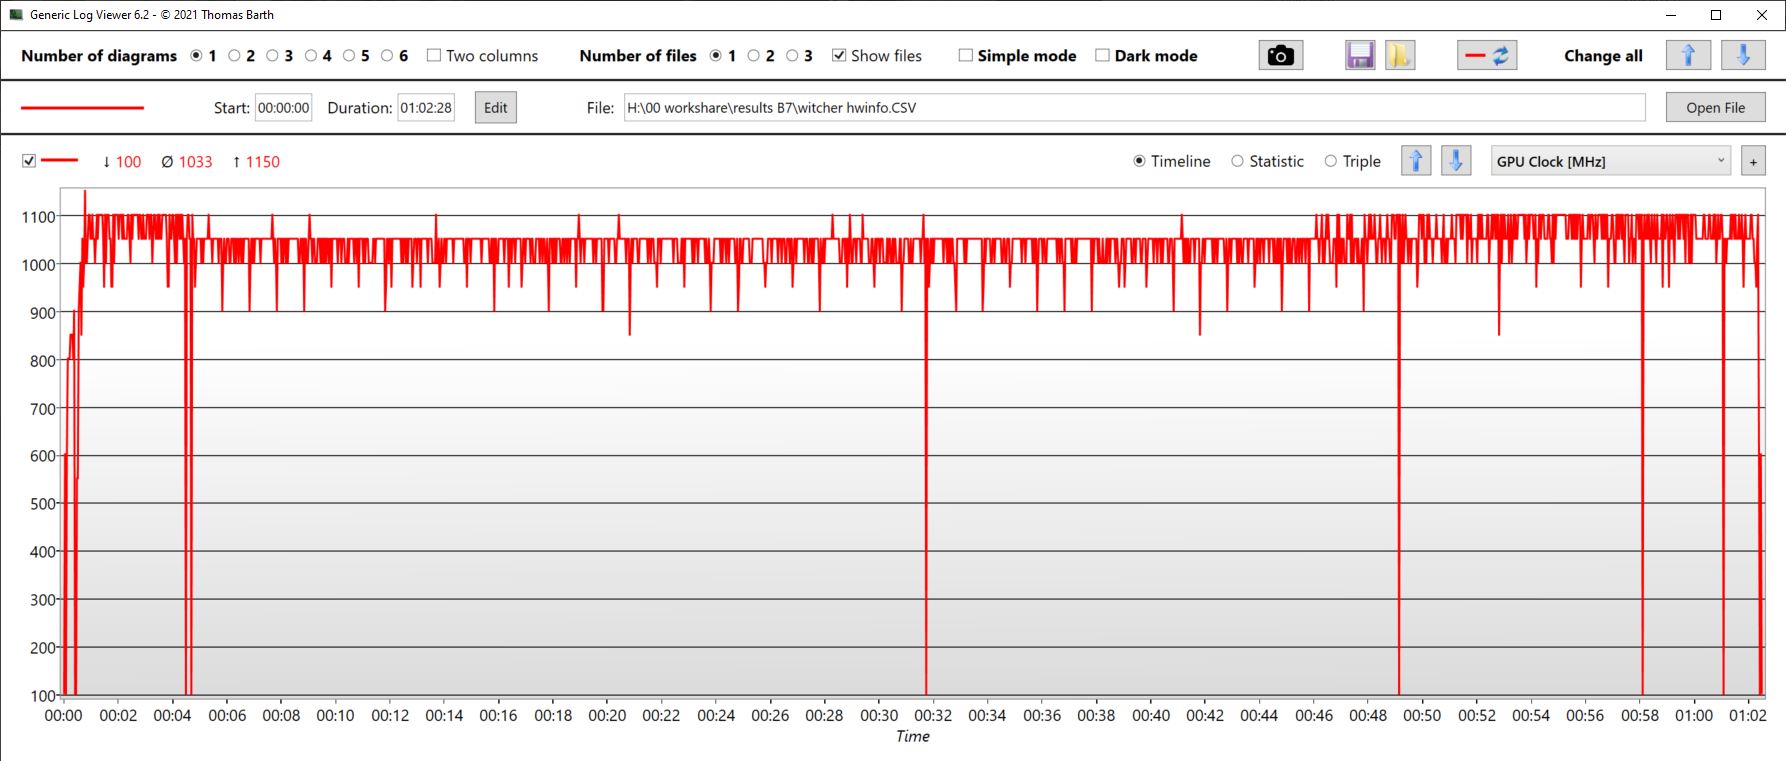
A GPU integrada atingiu o clock de 1,4 GHz por um período muito curto, após o qual ocorreu a mesma queda periódica do clock de cerca de 600 MHz para 100 a 350 MHz. Em média, a unidade gráfica registrava clock de 400 MHz.
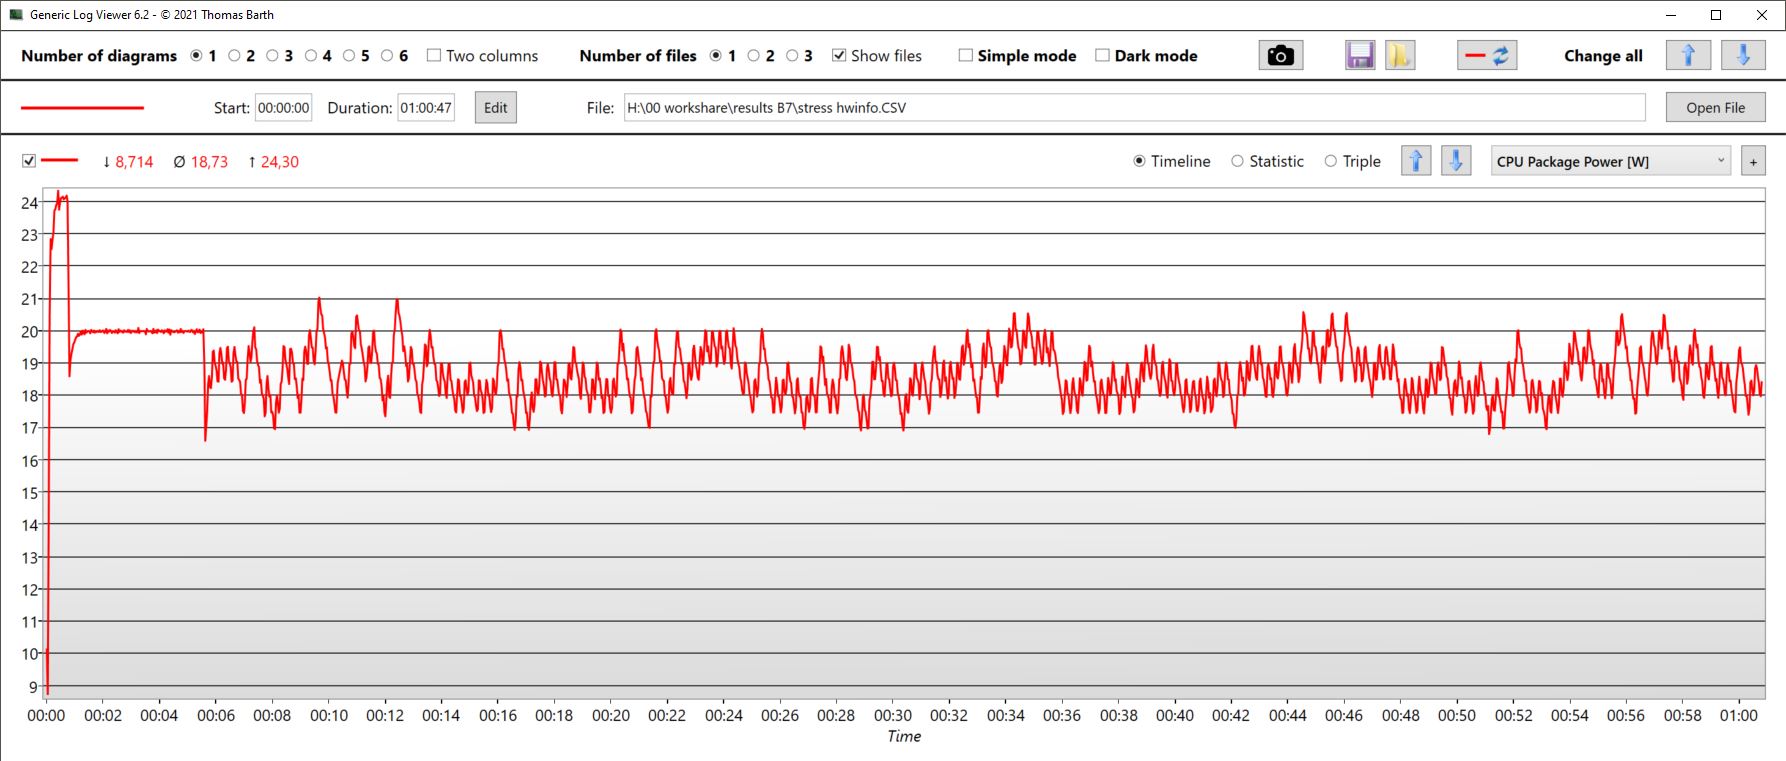
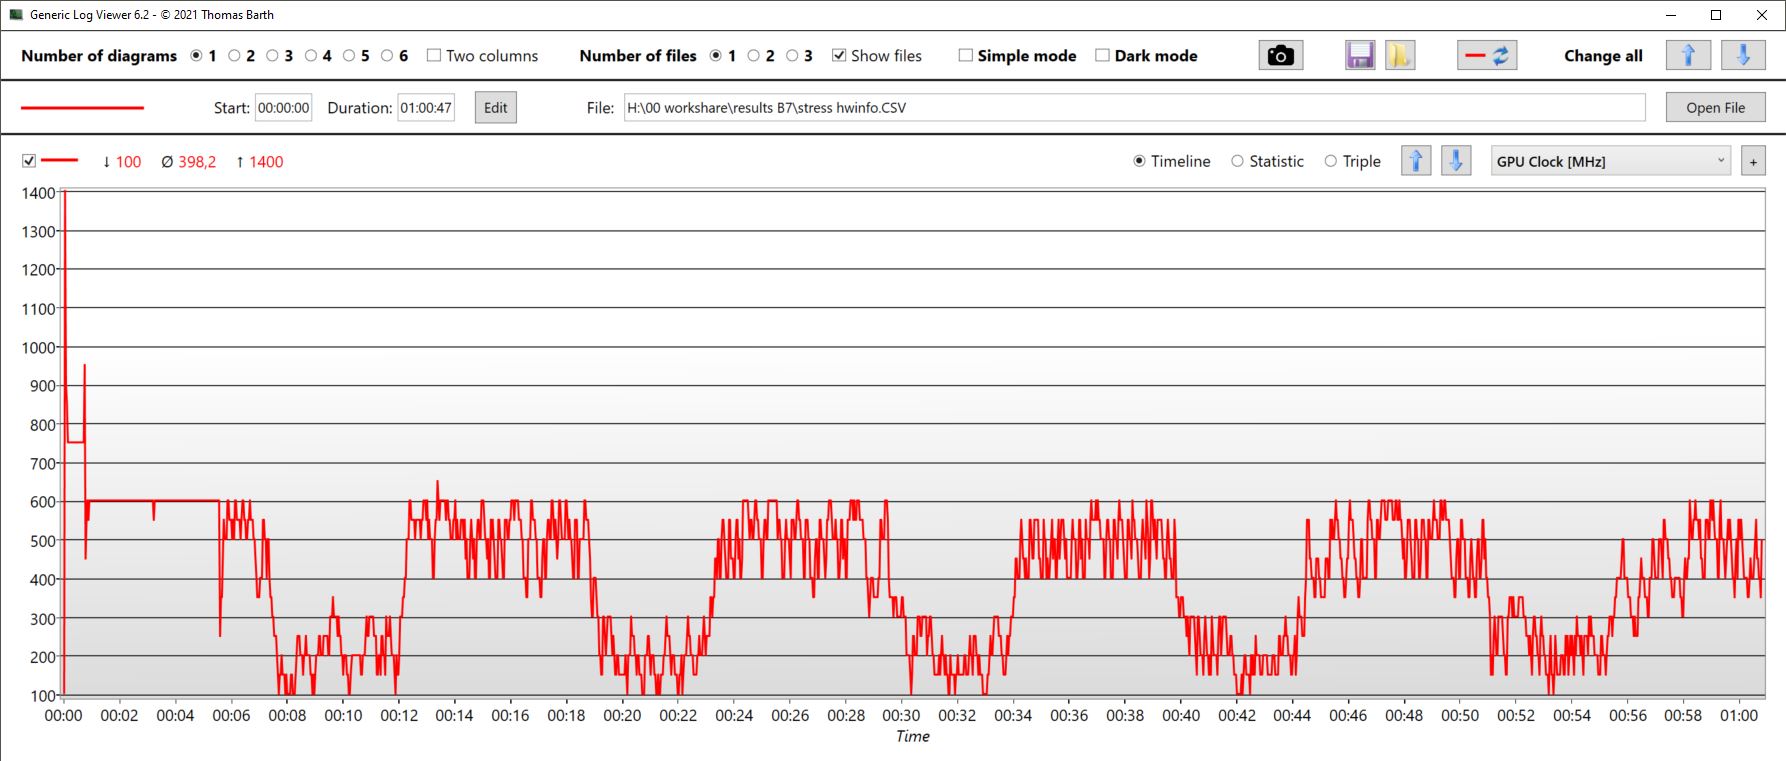
| Relógio da CPU (GHz) | Relógio da GPU (MHz) | Temperatura média da CPU (°C) | Temperatura média da GPU (°C) | |
| Estresse Prime95 + FurMark | 2.4 | 400 | 79 | 79 |
| Witcher 3 estresse | 0,7 | 1033 | 69 | 69 |
Gerenciamento de energia - O BMAX B7 muito econômico
Consumo de energia
De modo geral, o B7 Power é muito econômico. Dependendo do modo de energia, medimos entre 9 e 10 watts no modo inativo. O B7 realmente mostra como é econômico sob carga.
Seu consumo máximo absoluto ficou temporariamente abaixo de 44 watts - no entanto, em média, o B7 Power não usa continuamente mais de 35 watts. Sua pequena fonte de alimentação é classificada em 47,5 watts (19 V e 2,5 A). Como alternativa, você pode alimentar o B7 por meio de sua conexão USB-C, desde que o carregador atenda às especificações mínimas.
Atenção: se o B7 estiver desligado, ele ainda usará quase 1 watt. Além disso, as portas USB passam energia por elas. Como resultado, nosso mouse RGB continua iluminado mesmo quando está desligado. Sem o teclado e o mouse, o B7 consome 830 mW quando está desligado. Com o mouse e o teclado, seu consumo é parcialmente superior a 1 watt. Dependendo da aplicação, recomendamos um soquete de alimentação comutável para o B7 Power.
| desligado | |
| Ocioso | |
| Carga |
|
Key:
min: | |
| BMAX B7 Power G7A2 i7-11390H, Iris Xe G7 96EUs, Kston K765-1TB, , x, | Geekom Mini IT11, i7-11390H i7-11390H, Iris Xe G7 96EUs, Lexar 1024GB LNM6A1X001T-HNNNG, , x, | Intel NUC 13 Pro Kit NUC13ANK i7-1360P, Iris Xe G7 96EUs, Samsung PM9A1 MZVL2512HCJQ, , x, | Beelink SEi11 Pro i5-11320H, Iris Xe G7 96EUs, Kingston NV1 SNVS/500GCN, , x, | BMAX B5 Pro G7H8 i5-8260U, UHD Graphics 620, , , x, | Média Intel Iris Xe Graphics G7 96EUs | Média da turma Mini PC | |
|---|---|---|---|---|---|---|---|
| Power Consumption | -8% | -61% | -48% | -8% | -28% | -88% | |
| Idle Minimum * (Watt) | 9.1 | 7.3 20% | 5.1 44% | 9.8 -8% | 6 34% | 5.51 ? 39% | 8.82 ? 3% |
| Idle Average * (Watt) | 9.5 | 7.8 18% | 5.8 39% | 10.3 -8% | 6.2 35% | 8.66 ? 9% | 10.9 ? -15% |
| Idle Maximum * (Watt) | 10 | 8.4 16% | 10.2 -2% | 10.5 -5% | 6.3 37% | 10.9 ? -9% | 13.9 ? -39% |
| Load Average * (Watt) | 27.1 | 28.7 -6% | 68.1 -151% | 54.2 -100% | 42.8 -58% | 45.6 ? -68% | 65 ? -140% |
| Witcher 3 ultra * (Watt) | 29.1 | 53.1 -82% | 35 -20% | ||||
| Load Maximum * (Watt) | 32.3 | 61.1 -89% | 108.3 -235% | 59 -83% | 55.8 -73% | 67.8 ? -110% | 113.5 ? -251% |
* ... menor é melhor
Power consumption with external monitor
Pro
Contra
Veredicto - Mais como "B7 Econômico"

O BMAX B7 Power cria desnecessariamente uma falsa impressão. O processador instalado é de duas gerações atrás e é muito lento, mesmo para seus padrões, pois é estrangulado. Ao mesmo tempo, o B7 não precisa se envergonhar, pois seus pontos fortes, como o fato de ser silencioso e econômico, falam pelo fato de o PC ser usado para finalidades totalmente diferentes.
O mini PC X86 é adequado para todos os usos que exigem um determinado nível de desempenho e, ao mesmo tempo, mantêm o consumo de energia e as emissões de ruído baixos. Isso inclui vários cenários, como usá-lo como servidor doméstico, console retrô e assim por diante. O B7 Power está simplesmente sendo comercializado de forma errada. Se você ainda está comprando um Intel Gen11 nos dias de hoje, provavelmente não está de olho no mais alto desempenho - como resultado, os verdadeiros pontos fortes do B7 deveriam ser mais divulgados. Seria muito mais adequado dar a ele um nome como B7 Power Server, B7 Home Server ou B7 Efficient.
Se você está procurando o máximo de "potência", está procurando no lugar errado com o BMAX B7 Power com sua GPU Gen11 acelerada. Por outro lado, se estiver em busca de um servidor doméstico ou similar, esse dispositivo é perfeito para você.
Preço e disponibilidade
BMAX B7 Power G7A2
- 09/12/2023 v7 (old)
Christian Hintze
Transparência
A seleção dos dispositivos a serem analisados é feita pela nossa equipe editorial. A amostra de teste foi fornecida ao autor como empréstimo pelo fabricante ou varejista para fins desta revisão. O credor não teve influência nesta revisão, nem o fabricante recebeu uma cópia desta revisão antes da publicação. Não houve obrigação de publicar esta revisão. Como empresa de mídia independente, a Notebookcheck não está sujeita à autoridade de fabricantes, varejistas ou editores.
É assim que o Notebookcheck está testando
Todos os anos, o Notebookcheck analisa de forma independente centenas de laptops e smartphones usando procedimentos padronizados para garantir que todos os resultados sejam comparáveis. Desenvolvemos continuamente nossos métodos de teste há cerca de 20 anos e definimos padrões da indústria no processo. Em nossos laboratórios de teste, equipamentos de medição de alta qualidade são utilizados por técnicos e editores experientes. Esses testes envolvem um processo de validação em vários estágios. Nosso complexo sistema de classificação é baseado em centenas de medições e benchmarks bem fundamentados, o que mantém a objetividade.Price comparison

