 Deutsch
 English
 Español
 Français
 Italiano
 Nederlands
 Polski
 Português
 Русский
 Türkçe
 Svenska
 Chinese
 Magyar
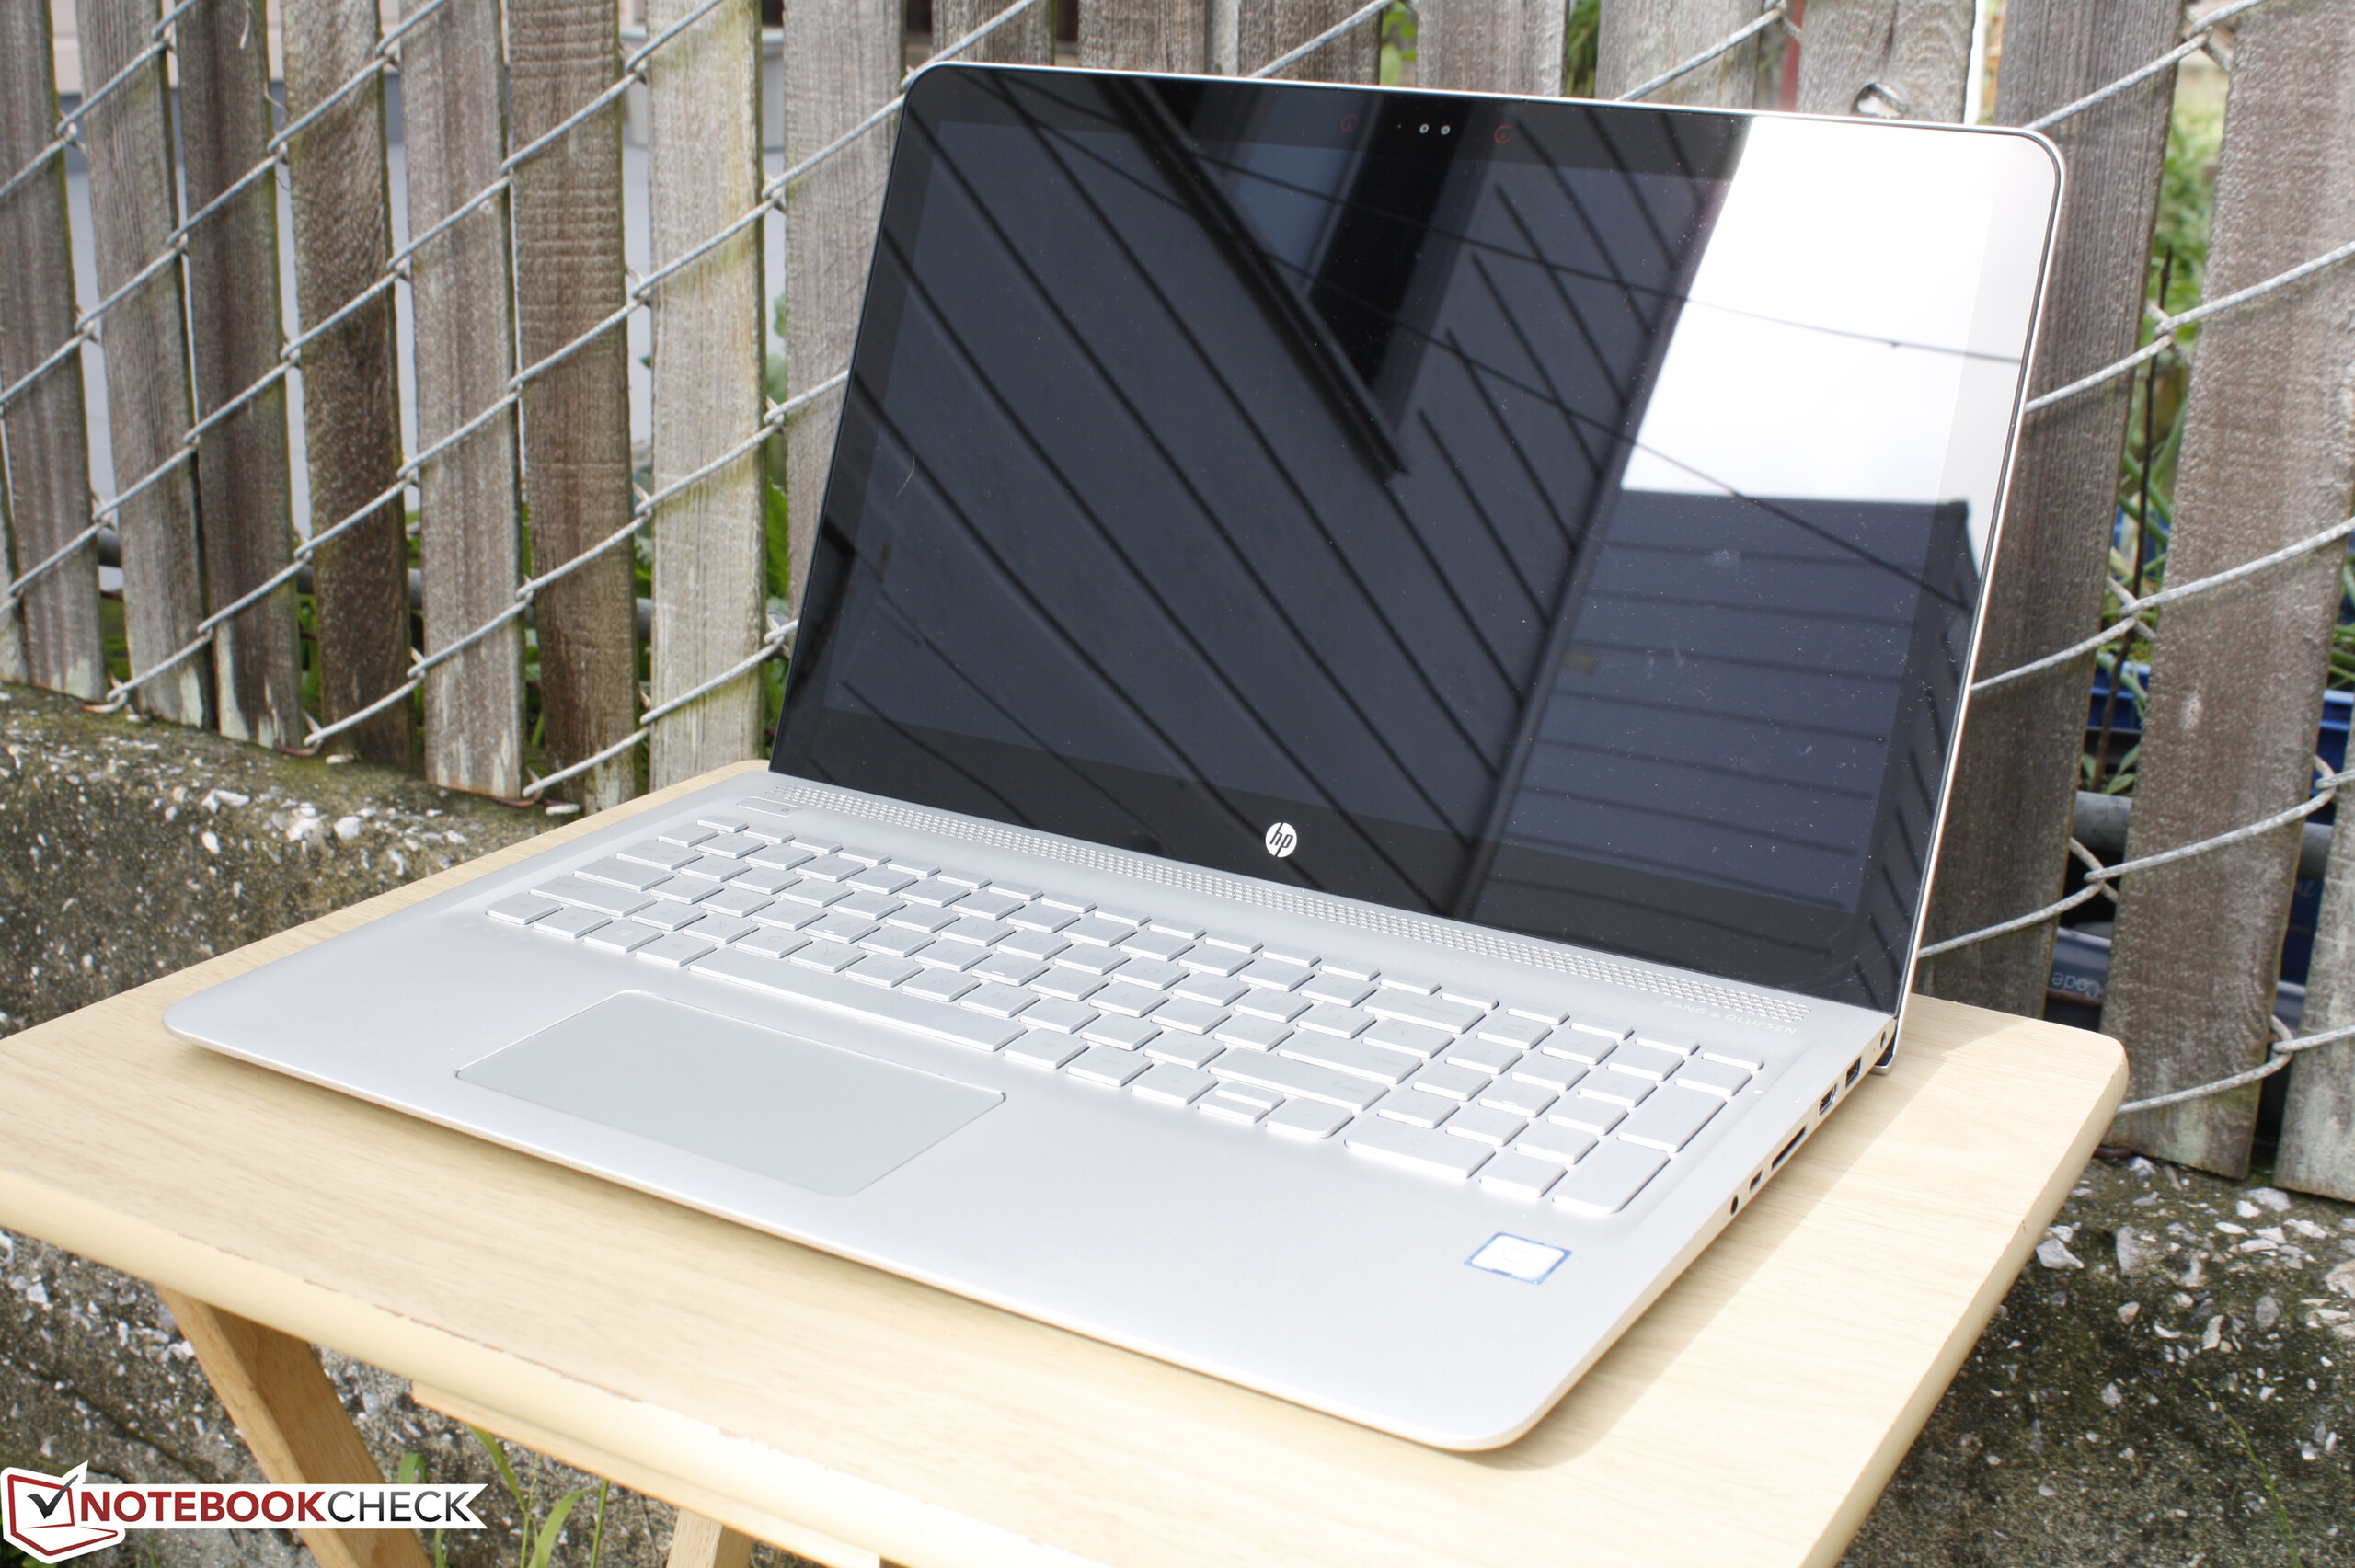
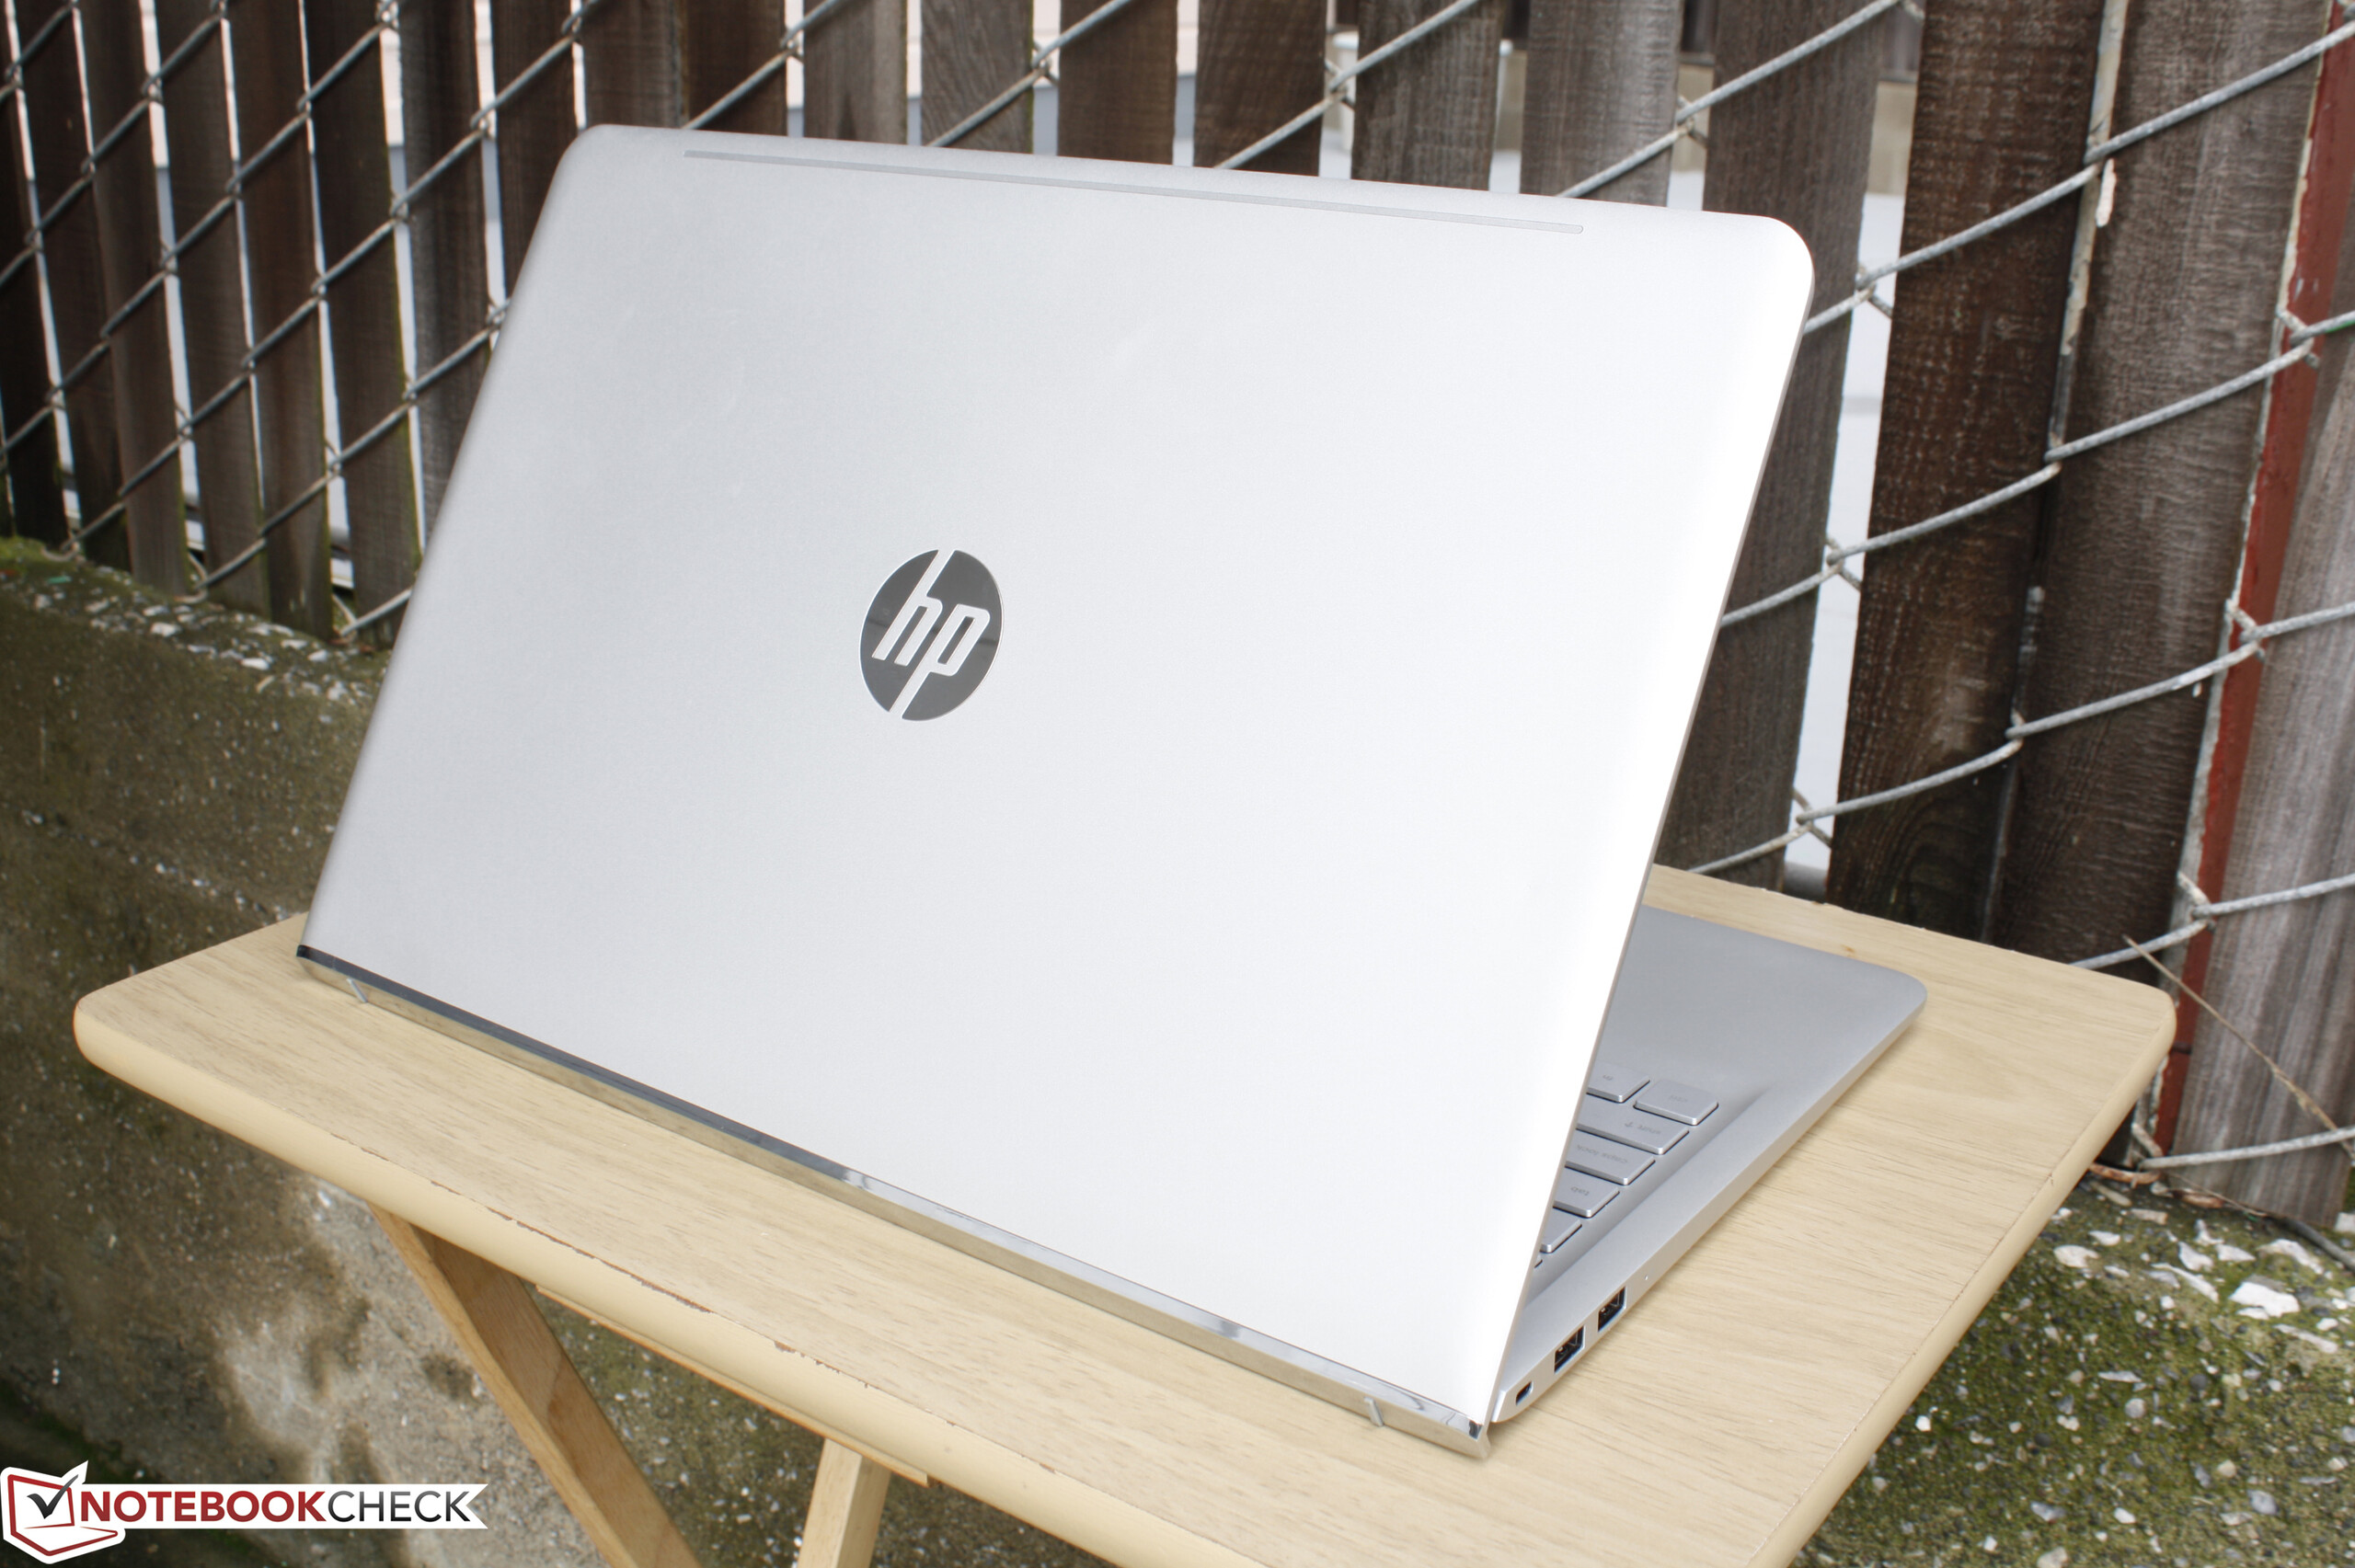
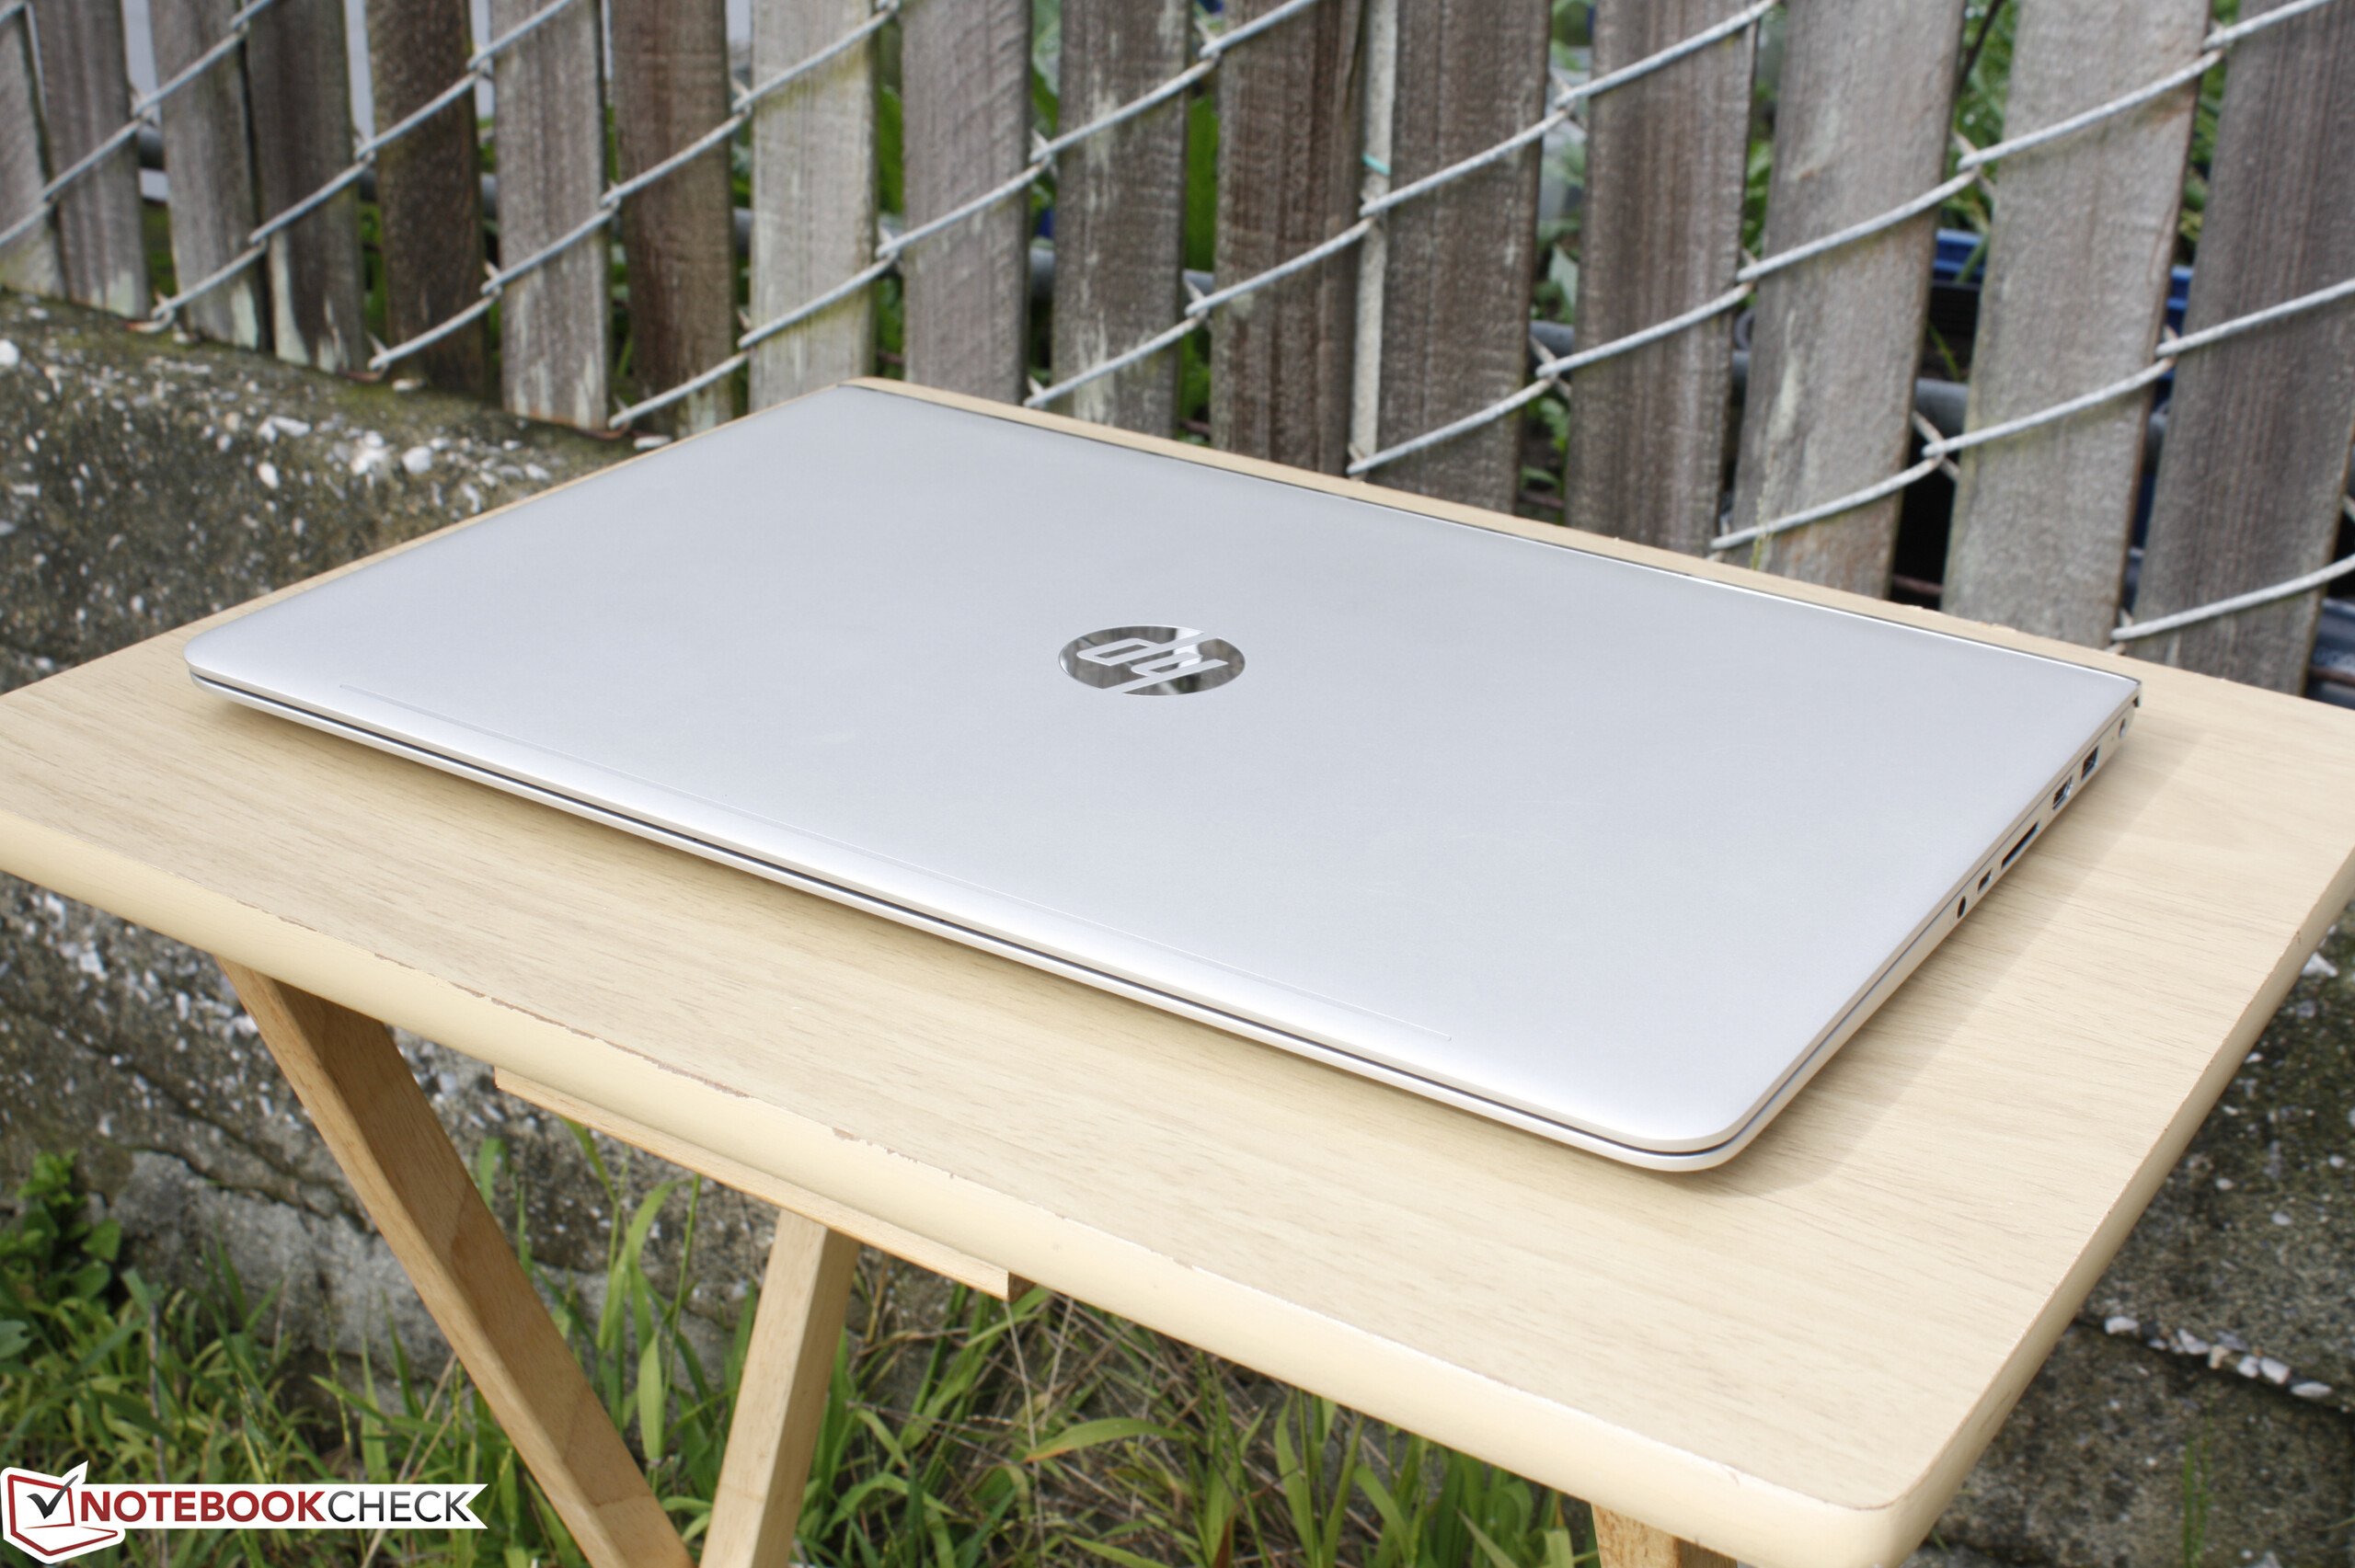
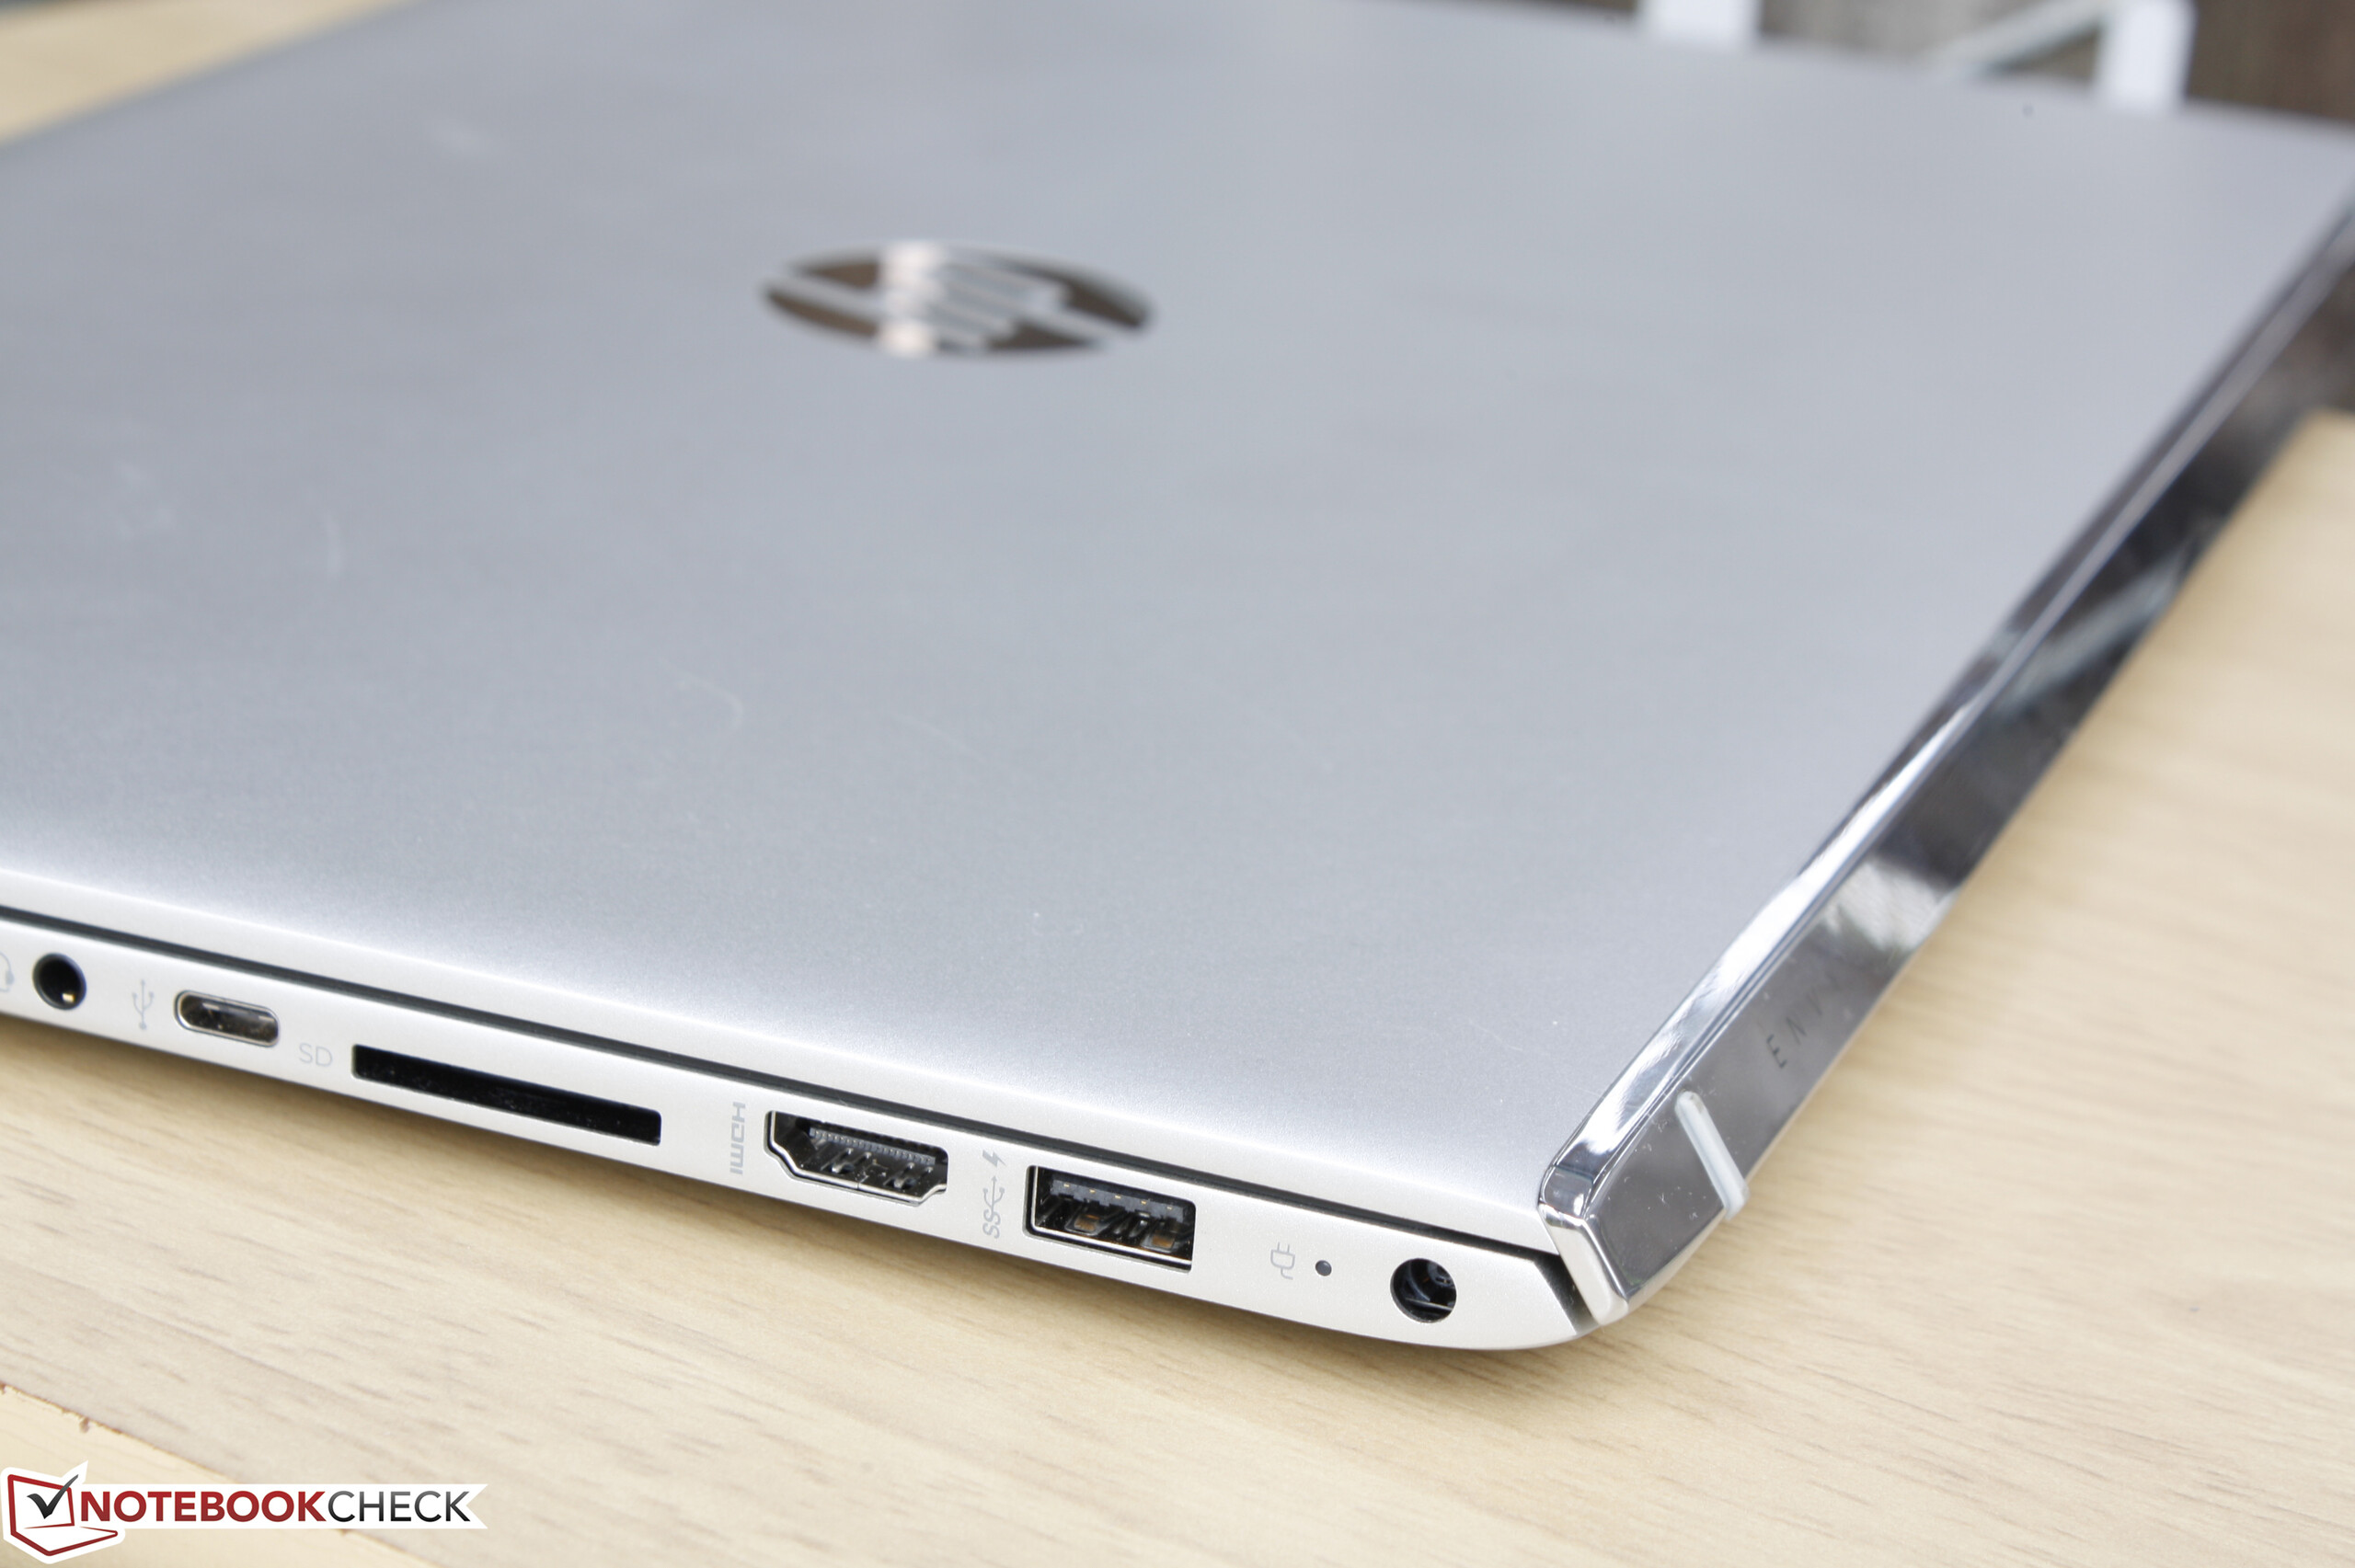
Breve Análise do Portátil HP Envy 15 as133cl

| SD Card Reader | |
| average JPG Copy Test (av. of 3 runs) | |
| Dell XPS 13 9360 FHD i5 | |
| HP Envy 15-as133cl | |
| HP 17-y044ng | |
| maximum AS SSD Seq Read Test (1GB) | |
| Dell XPS 13 9360 FHD i5 | |
| HP Envy 15-as133cl | |
| HP 17-y044ng | |
| Networking | |
| iperf3 transmit AX12 | |
| Dell XPS 13 9360 FHD i5 | |
| HP Envy 15-as133cl | |
| HP 15-ba077ng | |
| iperf3 receive AX12 | |
| HP Envy 15-as133cl | |
| Dell XPS 13 9360 FHD i5 | |
| HP 15-ba077ng | |
| |||||||||||||||||||||||||
iluminação: 83 %
iluminação com acumulador: 262.3 cd/m²
Contraste: 1093:1 (Preto: 0.24 cd/m²)
ΔE Color 5 | 0.5-29.43 Ø5
ΔE Greyscale 3.2 | 0.57-98 Ø5.3
63.5% sRGB (Argyll 1.6.3 3D)
40.5% AdobeRGB 1998 (Argyll 1.6.3 3D)
44.41% AdobeRGB 1998 (Argyll 2.2.0 3D)
64.3% sRGB (Argyll 2.2.0 3D)
42.95% Display P3 (Argyll 2.2.0 3D)
Gamma: 2.45
| HP Envy 15-as133cl Chi Mei CMN15D8, IPS, 15.60, 1920x1080 | Dell XPS 15 2017 9560 (7300HQ, Full-HD) Sharp SHP1453 LQ156M1, LED IGZO IPS InfinityEdge, 15.60, 1920x1080 | HP 15-ba077ng BOE, TN LED, 15.60, 1920x1080 | Acer Aspire E15 E5-553G-109A Chi Mei CMN15C4 / N156HGE-EAB, TN LED, 15.60, 1920x1080 | HP Pavilion 15t-au100 CTO (W0P31AV) BOE0693, IPS, 15.60, 1920x1080 | Lenovo Ideapad 310-15IKB BOE NT156FHM-N31, TN LED, 15.60, 1920x1080 | |
|---|---|---|---|---|---|---|
| Display | 58% | -7% | -8% | 1% | -11% | |
| Display P3 Coverage | 42.95 | 68.9 60% | 39.98 -7% | 39.72 -8% | 43.27 1% | 38.07 -11% |
| sRGB Coverage | 64.3 | 98.9 54% | 60.2 -6% | 59.2 -8% | 64.9 1% | 57.3 -11% |
| AdobeRGB 1998 Coverage | 44.41 | 70.9 60% | 41.31 -7% | 41.07 -8% | 44.71 1% | 39.34 -11% |
| Response Times | -49% | -21% | 943% | -29% | 17% | |
| Response Time Grey 50% / Grey 80% * | 44.4 ? | 54 ? -22% | 42 ? 5% | 42.4 ? 5% | 42 ? 5% | 43 ? 3% |
| Response Time Black / White * | 30 ? | 52.4 ? -75% | 22 ? 27% | 14.6 ? 51% | 33.6 ? -12% | 21 ? 30% |
| PWM Frequency | 1000 ? | 50 ? -95% | 28740 2774% | 198.4 -80% | ||
| Screen | 19% | -71% | -54% | -10% | -33% | |
| Brightness middle | 262.3 | 400 52% | 209 -20% | 224 -15% | 186.5 -29% | 185 -29% |
| Brightness | 240 | 392 63% | 200 -17% | 201 -16% | 174 -27% | 184 -23% |
| Brightness Distribution | 83 | 89 7% | 88 6% | 75 -10% | 69 -17% | 95 14% |
| Black Level * | 0.24 | 0.26 -8% | 0.56 -133% | 0.46 -92% | 0.18 25% | 0.28 -17% |
| Contrast | 1093 | 1538 41% | 373 -66% | 487 -55% | 1036 -5% | 661 -40% |
| Colorchecker dE 2000 * | 5 | 4.9 2% | 12.21 -144% | 10.5 -110% | 5.7 -14% | 8.07 -61% |
| Colorchecker dE 2000 max. * | 20.6 | 11 47% | 20.66 -0% | 16.8 18% | 22.5 -9% | 14.83 28% |
| Greyscale dE 2000 * | 3.2 | 7.2 -125% | 13.48 -321% | 11.23 -251% | 4.4 -38% | 8.83 -176% |
| Gamma | 2.45 90% | 2.11 104% | 2.34 94% | 2.12 104% | 2.35 94% | 2.47 89% |
| CCT | 6817 95% | 6911 94% | 15364 42% | 11096 59% | 6963 93% | 10628 61% |
| Color Space (Percent of AdobeRGB 1998) | 40.5 | 64.2 59% | 38 -6% | 38 -6% | 44.71 10% | 36.2 -11% |
| Color Space (Percent of sRGB) | 63.5 | 98.9 56% | 60 -6% | 59 -7% | 64.95 2% | 57 -10% |
| Total Average (Program / Settings) | 9% /
18% | -33% /
-49% | 294% /
141% | -13% /
-12% | -9% /
-22% |
* ... smaller is better
Display Response Times
| ↔ Response Time Black to White | ||
|---|---|---|
| 30 ms ... rise ↗ and fall ↘ combined | ↗ 6.4 ms rise | 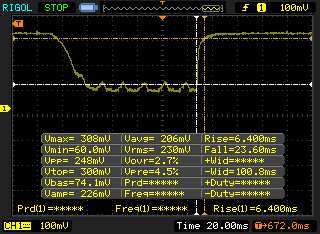 |
| ↘ 23.6 ms fall | ||
| The screen shows slow response rates in our tests and will be unsatisfactory for gamers. In comparison, all tested devices range from 0.1 (minimum) to 240 (maximum) ms. » 77 % of all devices are better. This means that the measured response time is worse than the average of all tested devices (21.5 ms). | ||
| ↔ Response Time 50% Grey to 80% Grey | ||
| 44.4 ms ... rise ↗ and fall ↘ combined | ↗ 16 ms rise | 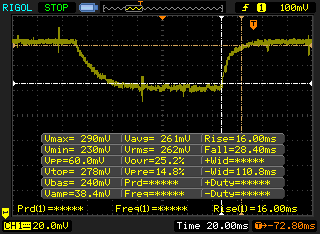 |
| ↘ 28.4 ms fall | ||
| The screen shows slow response rates in our tests and will be unsatisfactory for gamers. In comparison, all tested devices range from 0.2 (minimum) to 636 (maximum) ms. » 72 % of all devices are better. This means that the measured response time is worse than the average of all tested devices (33.7 ms). | ||
Screen Flickering / PWM (Pulse-Width Modulation)
| Screen flickering / PWM detected | 1000 Hz | ≤ 99 % brightness setting | 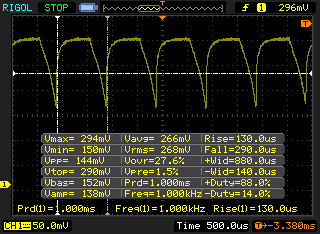 |
The display backlight flickers at 1000 Hz (worst case, e.g., utilizing PWM) Flickering detected at a brightness setting of 99 % and below. There should be no flickering or PWM above this brightness setting. The frequency of 1000 Hz is quite high, so most users sensitive to PWM should not notice any flickering. In comparison: 53 % of all tested devices do not use PWM to dim the display. If PWM was detected, an average of 17900 (minimum: 5 - maximum: 3846000) Hz was measured. | |||
| Cinebench R15 | |
| CPU Single 64Bit | |
| Dell Inspiron 15 5000 5567-1753 | |
| HP Envy 15-as133cl | |
| Asus Zenbook UX310UQ-GL011T | |
| Fujitsu LifeBook A557 PL | |
| Lenovo U31-70 80M5003EGE | |
| Acer TravelMate P249-M-5452 | |
| Lenovo Y40-59423035 | |
| HP 250 G4 T6P08ES | |
| Acer Aspire V3-572PG-604M | |
| HP 15-ba077ng | |
| CPU Multi 64Bit | |
| HP Envy 15-as133cl | |
| Dell Inspiron 15 5000 5567-1753 | |
| Asus Zenbook UX310UQ-GL011T | |
| Fujitsu LifeBook A557 PL | |
| Acer TravelMate P249-M-5452 | |
| Lenovo U31-70 80M5003EGE | |
| HP 250 G4 T6P08ES | |
| Lenovo Y40-59423035 | |
| Acer Aspire V3-572PG-604M | |
| HP 15-ba077ng | |
| Cinebench R11.5 | |
| CPU Single 64Bit | |
| Dell Inspiron 15 5000 5567-1753 | |
| HP Envy 15-as133cl | |
| Asus Zenbook UX310UQ-GL011T | |
| Lenovo U31-70 80M5003EGE | |
| Acer TravelMate P249-M-5452 | |
| Lenovo Y40-59423035 | |
| HP 250 G4 T6P08ES | |
| Acer Aspire V3-572PG-604M | |
| HP 15-ba077ng | |
| CPU Multi 64Bit | |
| HP Envy 15-as133cl | |
| Dell Inspiron 15 5000 5567-1753 | |
| Acer TravelMate P249-M-5452 | |
| Asus Zenbook UX310UQ-GL011T | |
| Lenovo U31-70 80M5003EGE | |
| HP 250 G4 T6P08ES | |
| Lenovo Y40-59423035 | |
| HP 15-ba077ng | |
| Acer Aspire V3-572PG-604M | |
| Cinebench R10 | |
| Rendering Multiple CPUs 32Bit | |
| HP Envy 15-as133cl | |
| Dell Inspiron 15 5000 5567-1753 | |
| Asus Zenbook UX310UQ-GL011T | |
| Acer TravelMate P249-M-5452 | |
| Lenovo U31-70 80M5003EGE | |
| HP 250 G4 T6P08ES | |
| Acer Aspire V3-572PG-604M | |
| HP 15-ba077ng | |
| Rendering Single 32Bit | |
| Dell Inspiron 15 5000 5567-1753 | |
| HP Envy 15-as133cl | |
| Asus Zenbook UX310UQ-GL011T | |
| Lenovo U31-70 80M5003EGE | |
| Acer TravelMate P249-M-5452 | |
| HP 250 G4 T6P08ES | |
| Acer Aspire V3-572PG-604M | |
| HP 15-ba077ng | |
| wPrime 2.10 - 1024m | |
| Lenovo Y40-59423035 | |
| Fujitsu LifeBook A557 PL | |
| HP Envy 15-as133cl | |
* ... smaller is better
| PCMark 8 | |
| Home Score Accelerated v2 | |
| Dell Inspiron 15 5000 5567-1753 | |
| HP Envy 15-as133cl | |
| Asus Zenbook UX310UQ-GL011T | |
| Acer TravelMate P249-M-5452 | |
| Work Score Accelerated v2 | |
| Dell Inspiron 15 5000 5567-1753 | |
| Asus Zenbook UX310UQ-GL011T | |
| HP Envy 15-as133cl | |
| Acer TravelMate P249-M-5452 | |
| Creative Score Accelerated v2 | |
| Dell Inspiron 15 5000 5567-1753 | |
| Asus Zenbook UX310UQ-GL011T | |
| HP Envy 15-as133cl | |
| Acer TravelMate P249-M-5452 | |
| PCMark 8 Home Score Accelerated v2 | 3809 pontos | |
| PCMark 8 Creative Score Accelerated v2 | 4361 pontos | |
| PCMark 8 Work Score Accelerated v2 | 4594 pontos | |
Ajuda | ||
| HP Envy 15-as133cl HGST Travelstar 5K1000 HTS541010A7E630 | Dell XPS 15 2017 9560 (7300HQ, Full-HD) WDC WD10SPCX-75KHST0 + SanDisk Z400s M.2 2242 32 GB Cache | HP 15-ba077ng SanDisk Z400s SD8SNAT-256G | Acer Aspire E15 E5-553G-109A Liteonit CV3-8D128 | HP Pavilion 15t-au100 CTO (W0P31AV) Toshiba MQ01ABD100 | |
|---|---|---|---|---|---|
| CrystalDiskMark 3.0 | 1425% | 5547% | 5871% | 1% | |
| Read Seq | 103.2 | 123 19% | 447.4 334% | 348.6 238% | 109.5 6% |
| Write Seq | 102.6 | 74.2 -28% | 243.3 137% | 311.8 204% | 105.2 3% |
| Read 512 | 31.46 | 101.7 223% | 333.4 960% | 295.9 841% | 34.08 8% |
| Write 512 | 46.3 | 42.51 -8% | 283.1 511% | 185.8 301% | 40.02 -14% |
| Read 4k | 0.366 | 10.84 2862% | 20.99 5635% | 23.76 6392% | 0.429 17% |
| Write 4k | 1.008 | 1.021 1% | 62.7 6120% | 44.94 4358% | 1.008 0% |
| Read 4k QD32 | 0.828 | 69.8 8330% | 143.1 17183% | 171.6 20625% | 0.81 -2% |
| Write 4k QD32 | 1.015 | 1.057 4% | 138 13496% | 143.2 14008% | 0.893 -12% |

| 3DMark 11 | |
| 1280x720 Performance GPU | |
| Acer Aspire V3-572PG-604M | |
| Asus Zenbook UX310UQ-GL011T | |
| Dell Inspiron 15 5000 5567-1753 | |
| HP 250 G4 T6P08ES | |
| Lenovo U31-70 80M5003EGE | |
| HP Envy 15-as133cl | |
| Fujitsu LifeBook A557 PL | |
| Acer TravelMate P249-M-5452 | |
| 1280x720 Performance Combined | |
| Dell Inspiron 15 5000 5567-1753 | |
| Asus Zenbook UX310UQ-GL011T | |
| Acer Aspire V3-572PG-604M | |
| HP Envy 15-as133cl | |
| HP 250 G4 T6P08ES | |
| Lenovo U31-70 80M5003EGE | |
| Acer TravelMate P249-M-5452 | |
| Fujitsu LifeBook A557 PL | |
| 3DMark | |
| 1280x720 Cloud Gate Standard Graphics | |
| Dell Inspiron 15 5000 5567-1753 | |
| Acer Aspire V3-572PG-604M | |
| HP Envy 15-as133cl | |
| Asus Zenbook UX310UQ-GL011T | |
| Lenovo U31-70 80M5003EGE | |
| Fujitsu LifeBook A557 PL | |
| Acer TravelMate P249-M-5452 | |
| HP 250 G4 T6P08ES | |
| 1920x1080 Fire Strike Graphics | |
| Acer Aspire V3-572PG-604M | |
| Asus Zenbook UX310UQ-GL011T | |
| Dell Inspiron 15 5000 5567-1753 | |
| Lenovo U31-70 80M5003EGE | |
| HP 250 G4 T6P08ES | |
| HP Envy 15-as133cl | |
| Fujitsu LifeBook A557 PL | |
| Acer TravelMate P249-M-5452 | |
| 1920x1080 Ice Storm Extreme Graphics | |
| HP Envy 15-as133cl | |
| Asus Zenbook UX310UQ-GL011T | |
| Dell Inspiron 15 5000 5567-1753 | |
| Acer TravelMate P249-M-5452 | |
| 3DMark 11 Performance | 1780 pontos | |
| 3DMark Ice Storm Standard Score | 72759 pontos | |
| 3DMark Cloud Gate Standard Score | 6756 pontos | |
| 3DMark Fire Strike Score | 929 pontos | |
| 3DMark Fire Strike Extreme Score | 427 pontos | |
Ajuda | ||
| baixo | média | alto | ultra | |
| BioShock Infinite (2013) | 52.7 | 30.7 | 26.4 | 8.3 |
| Rise of the Tomb Raider (2016) | 20.2 | 12.1 | ||
| Overwatch (2016) | 49.5 | 35.1 |
Barulho
| Ocioso |
| 32.5 / 32.5 / 32.5 dB |
| HDD |
| 33.8 dB |
| Carga |
| 38.7 / 32.5 dB |
 | ||
30 dB silencioso 40 dB(A) audível 50 dB(A) ruidosamente alto |
||
min: | ||
| HP Envy 15-as133cl HD Graphics 620, i7-7500U, HGST Travelstar 5K1000 HTS541010A7E630 | Dell XPS 15 2017 9560 (7300HQ, Full-HD) GeForce GTX 1050 Mobile, i5-7300HQ, WDC WD10SPCX-75KHST0 + SanDisk Z400s M.2 2242 32 GB Cache | HP 15-ba077ng Radeon R7 (Bristol Ridge), A12-9700P, SanDisk Z400s SD8SNAT-256G | Acer Aspire E15 E5-553G-109A Radeon R8 M445DX, A12-9700P, Liteonit CV3-8D128 | HP Pavilion 15t-au100 CTO (W0P31AV) GeForce 940MX, i7-7500U, Toshiba MQ01ABD100 | Lenovo Ideapad 310-15IKB HD Graphics 620, i5-7200U, Hynix HFS128G3MND | |
|---|---|---|---|---|---|---|
| Noise | -12% | 4% | 3% | -7% | 1% | |
| off / environment * | 30 | 30.3 -1% | 30.6 -2% | 30.5 -2% | 29 3% | |
| Idle Minimum * | 32.5 | 31.6 3% | 31.5 3% | 31.4 3% | 32.2 1% | 30.6 6% |
| Idle Average * | 32.5 | 31.6 3% | 31.8 2% | 31.4 3% | 32.2 1% | 30.6 6% |
| Idle Maximum * | 32.5 | 33.4 -3% | 31.8 2% | 31.9 2% | 33.7 -4% | 30.6 6% |
| Load Average * | 38.7 | 47.8 -24% | 31.4 19% | 33.7 13% | 39.4 -2% | 36.8 5% |
| Load Maximum * | 32.5 | 47.8 -47% | 33.4 -3% | 33.8 -4% | 42.2 -30% | 38.2 -18% |
| Witcher 3 ultra * | 40.6 |
* ... smaller is better
(+) The maximum temperature on the upper side is 35.6 °C / 96 F, compared to the average of 36.9 °C / 98 F, ranging from 21.1 to 71 °C for the class Multimedia.
(+) The bottom heats up to a maximum of 39.4 °C / 103 F, compared to the average of 39.1 °C / 102 F
(+) In idle usage, the average temperature for the upper side is 23 °C / 73 F, compared to the device average of 31.2 °C / 88 F.
(+) The palmrests and touchpad are cooler than skin temperature with a maximum of 24.6 °C / 76.3 F and are therefore cool to the touch.
(+) The average temperature of the palmrest area of similar devices was 28.8 °C / 83.8 F (+4.2 °C / 7.5 F).
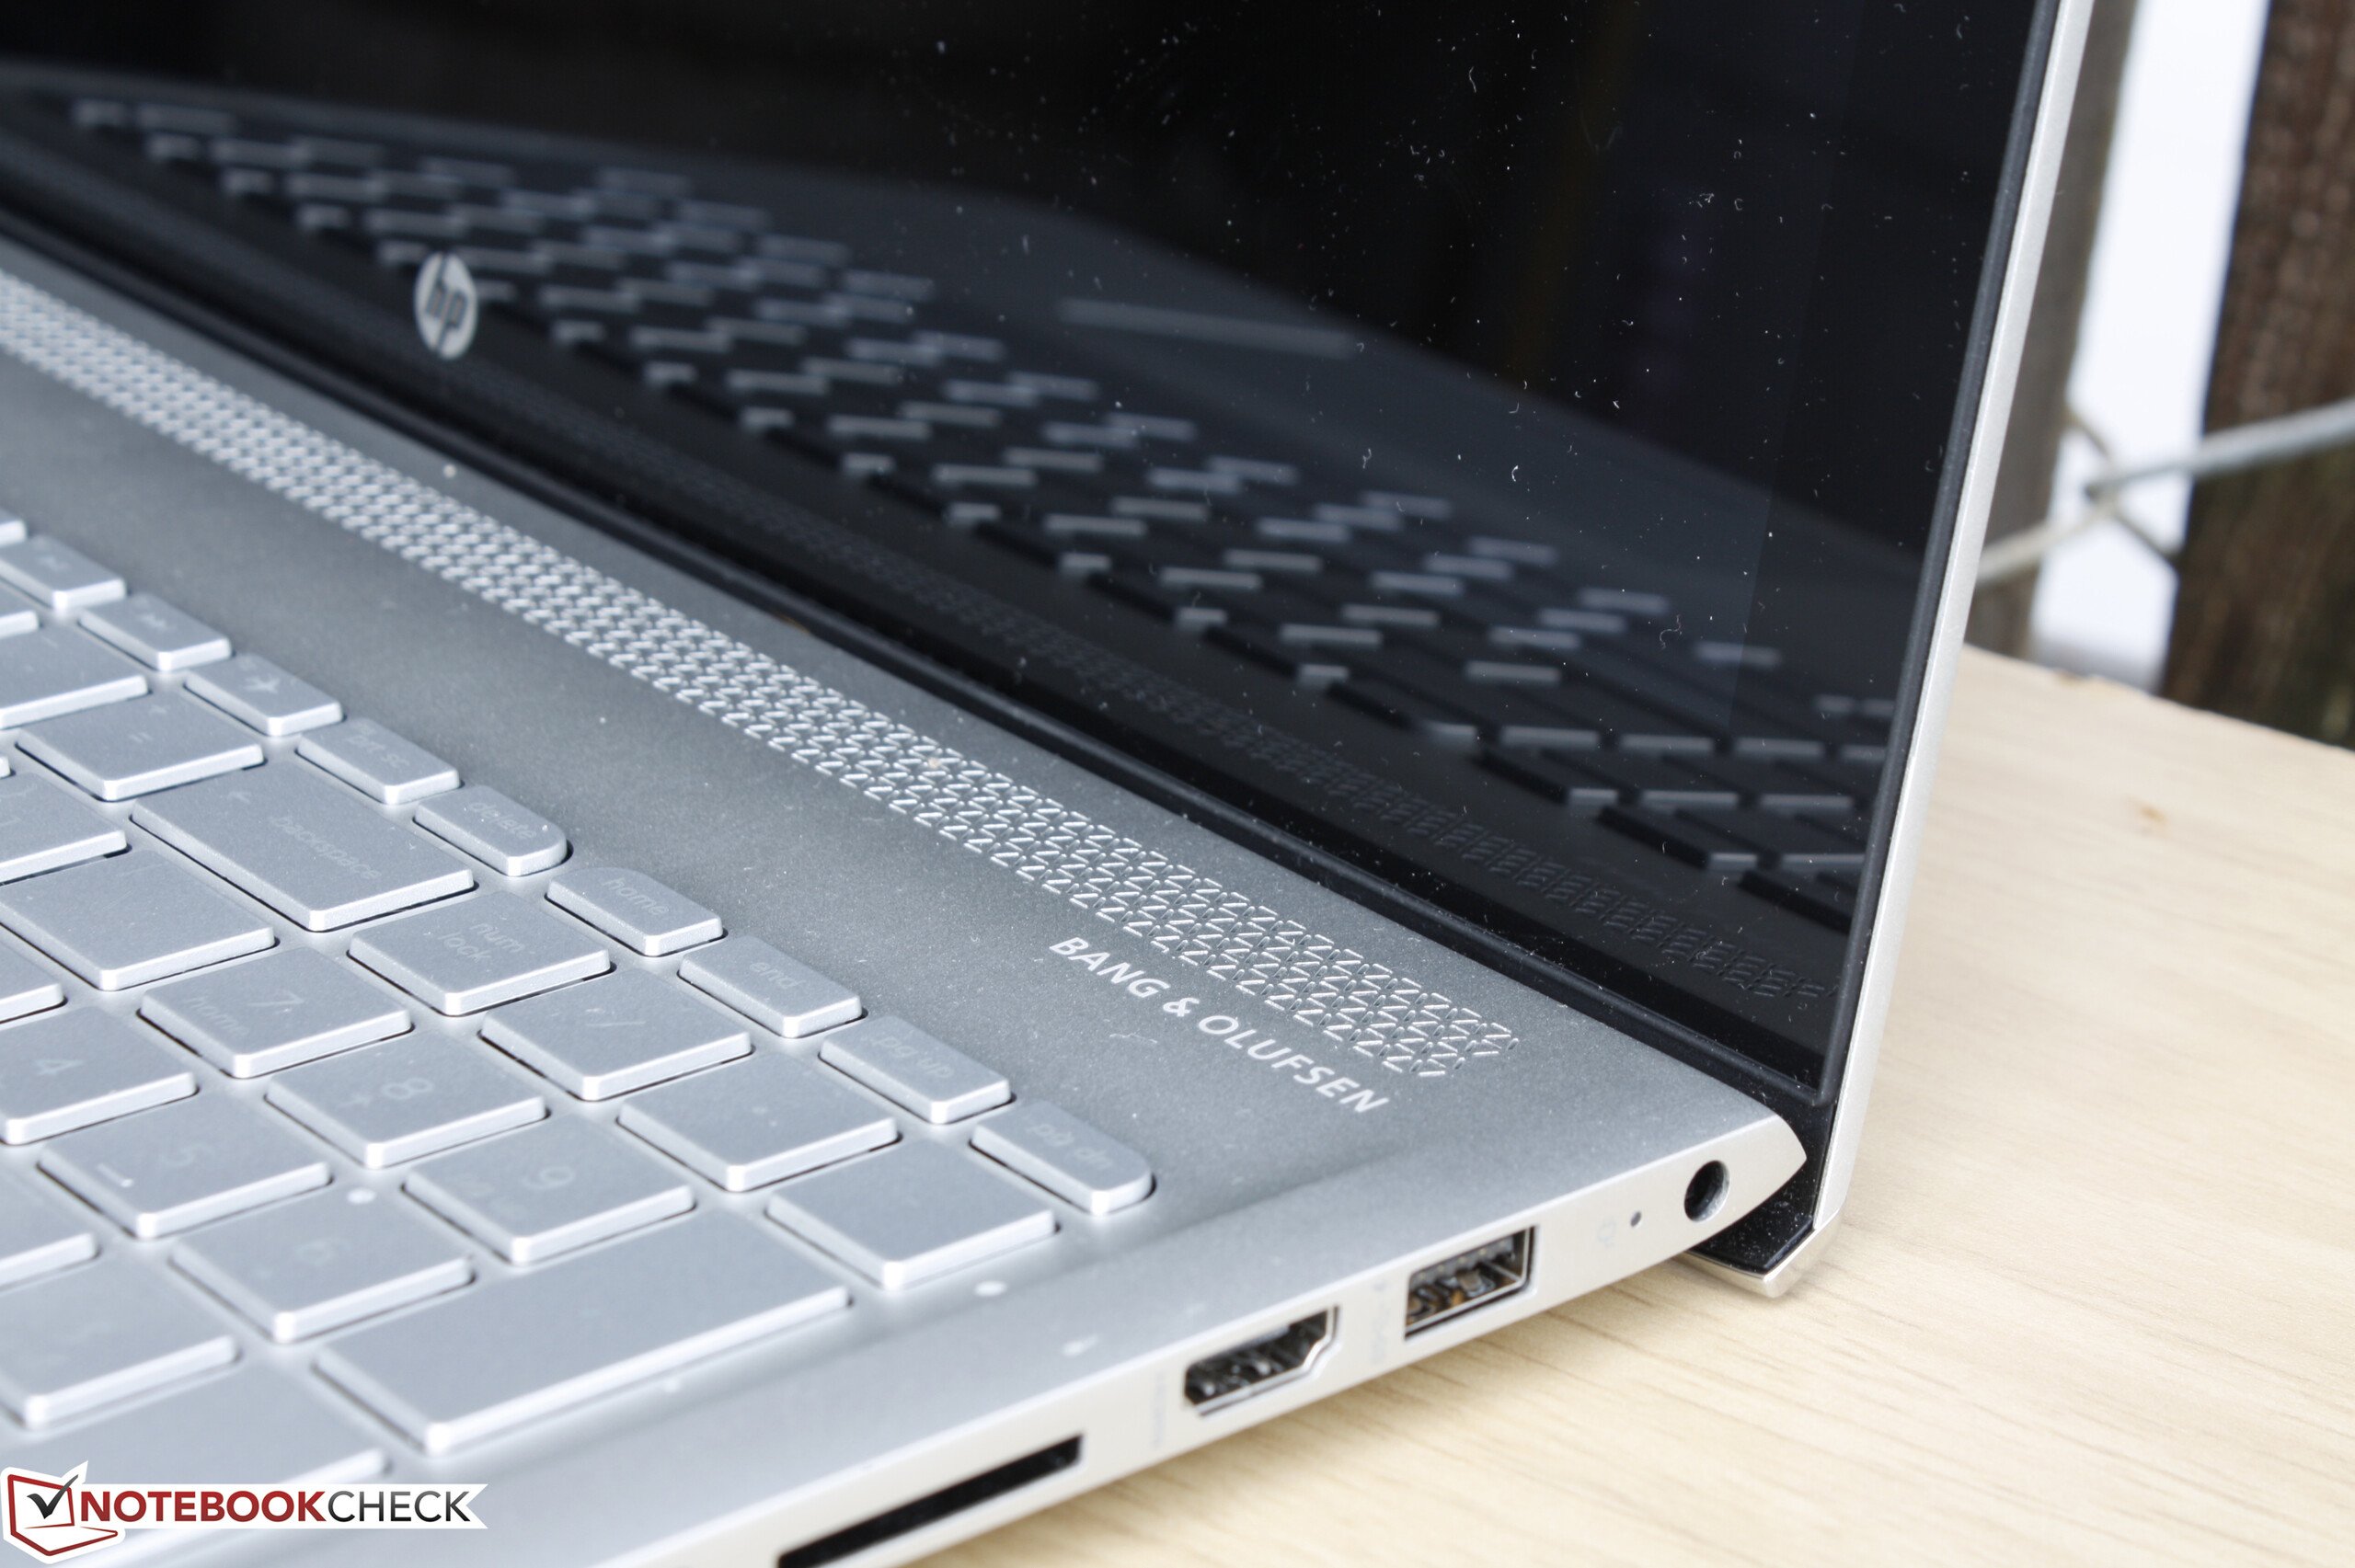
HP Envy 15-as133cl audio analysis
(±) | speaker loudness is average but good (77.2 dB)
Bass 100 - 315 Hz
(-) | nearly no bass - on average 16.6% lower than median
(±) | linearity of bass is average (13.8% delta to prev. frequency)
Mids 400 - 2000 Hz
(+) | balanced mids - only 1.9% away from median
(+) | mids are linear (4.3% delta to prev. frequency)
Highs 2 - 16 kHz
(+) | balanced highs - only 2.6% away from median
(±) | linearity of highs is average (9.8% delta to prev. frequency)
Overall 100 - 16.000 Hz
(±) | linearity of overall sound is average (20% difference to median)
Compared to same class
» 62% of all tested devices in this class were better, 9% similar, 29% worse
» The best had a delta of 5%, average was 18%, worst was 45%
Compared to all devices tested
» 46% of all tested devices were better, 8% similar, 46% worse
» The best had a delta of 4%, average was 25%, worst was 134%
Apple MacBook 12 (Early 2016) 1.1 GHz audio analysis
(+) | speakers can play relatively loud (83.6 dB)
Bass 100 - 315 Hz
(±) | reduced bass - on average 11.3% lower than median
(±) | linearity of bass is average (14.2% delta to prev. frequency)
Mids 400 - 2000 Hz
(+) | balanced mids - only 2.4% away from median
(+) | mids are linear (5.5% delta to prev. frequency)
Highs 2 - 16 kHz
(+) | balanced highs - only 2% away from median
(+) | highs are linear (4.5% delta to prev. frequency)
Overall 100 - 16.000 Hz
(+) | overall sound is linear (10.2% difference to median)
Compared to same class
» 5% of all tested devices in this class were better, 2% similar, 93% worse
» The best had a delta of 5%, average was 19%, worst was 53%
Compared to all devices tested
» 3% of all tested devices were better, 1% similar, 96% worse
» The best had a delta of 4%, average was 25%, worst was 134%
| desligado | |
| Ocioso | |
| Carga |
|
| HP Envy 15-as133cl | Dell XPS 15 2017 9560 (7300HQ, Full-HD) | HP 15-ba077ng | Acer Aspire E15 E5-553G-109A | HP Pavilion 15t-au100 CTO (W0P31AV) | Lenovo Ideapad 310-15IKB | |
|---|---|---|---|---|---|---|
| Power Consumption | -145% | -7% | -76% | -56% | -7% | |
| Idle Minimum * | 4.6 | 6.6 -43% | 4.4 4% | 7.2 -57% | 6.16 -34% | 3.5 24% |
| Idle Average * | 7.7 | 9 -17% | 6.8 12% | 10.3 -34% | 8.48 -10% | 6.1 21% |
| Idle Maximum * | 7.8 | 10.7 -37% | 8.9 -14% | 11.9 -53% | 9.62 -23% | 7 10% |
| Load Average * | 30.5 | 77.5 -154% | 30.9 -1% | 48.2 -58% | 41.63 -36% | 31.2 -2% |
| Load Maximum * | 22.7 | 130 -473% | 31 -37% | 63 -178% | 63.22 -179% | 42.9 -89% |
| Witcher 3 ultra * | 51.8 |
* ... smaller is better
| HP Envy 15-as133cl i7-7500U, HD Graphics 620, 52 Wh | Dell XPS 15 2017 9560 (7300HQ, Full-HD) i5-7300HQ, GeForce GTX 1050 Mobile, 56 Wh | HP 15-ba077ng A12-9700P, Radeon R7 (Bristol Ridge), 41 Wh | Acer Aspire E15 E5-553G-109A A12-9700P, Radeon R8 M445DX, 40 Wh | HP Pavilion 15t-au100 CTO (W0P31AV) i7-7500U, GeForce 940MX, 41 Wh | Lenovo Ideapad 310-15IKB i5-7200U, HD Graphics 620, 30 Wh | |
|---|---|---|---|---|---|---|
| Battery Runtime | -1% | 15% | -33% | -8% | -8% | |
| Reader / Idle | 573 | 565 -1% | 742 29% | 358 -38% | 438 -24% | 612 7% |
| WiFi v1.3 | 408 | 334 -18% | 296 -27% | 257 -37% | 220 -46% | 230 -44% |
| Load | 72 | 84 17% | 103 43% | 55 -24% | 106 47% | 81 13% |
Pro
Contra
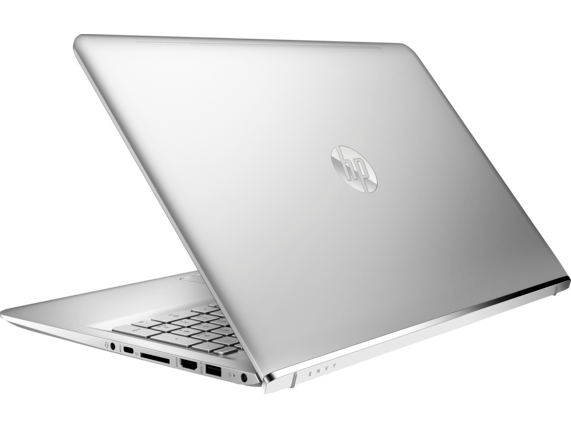
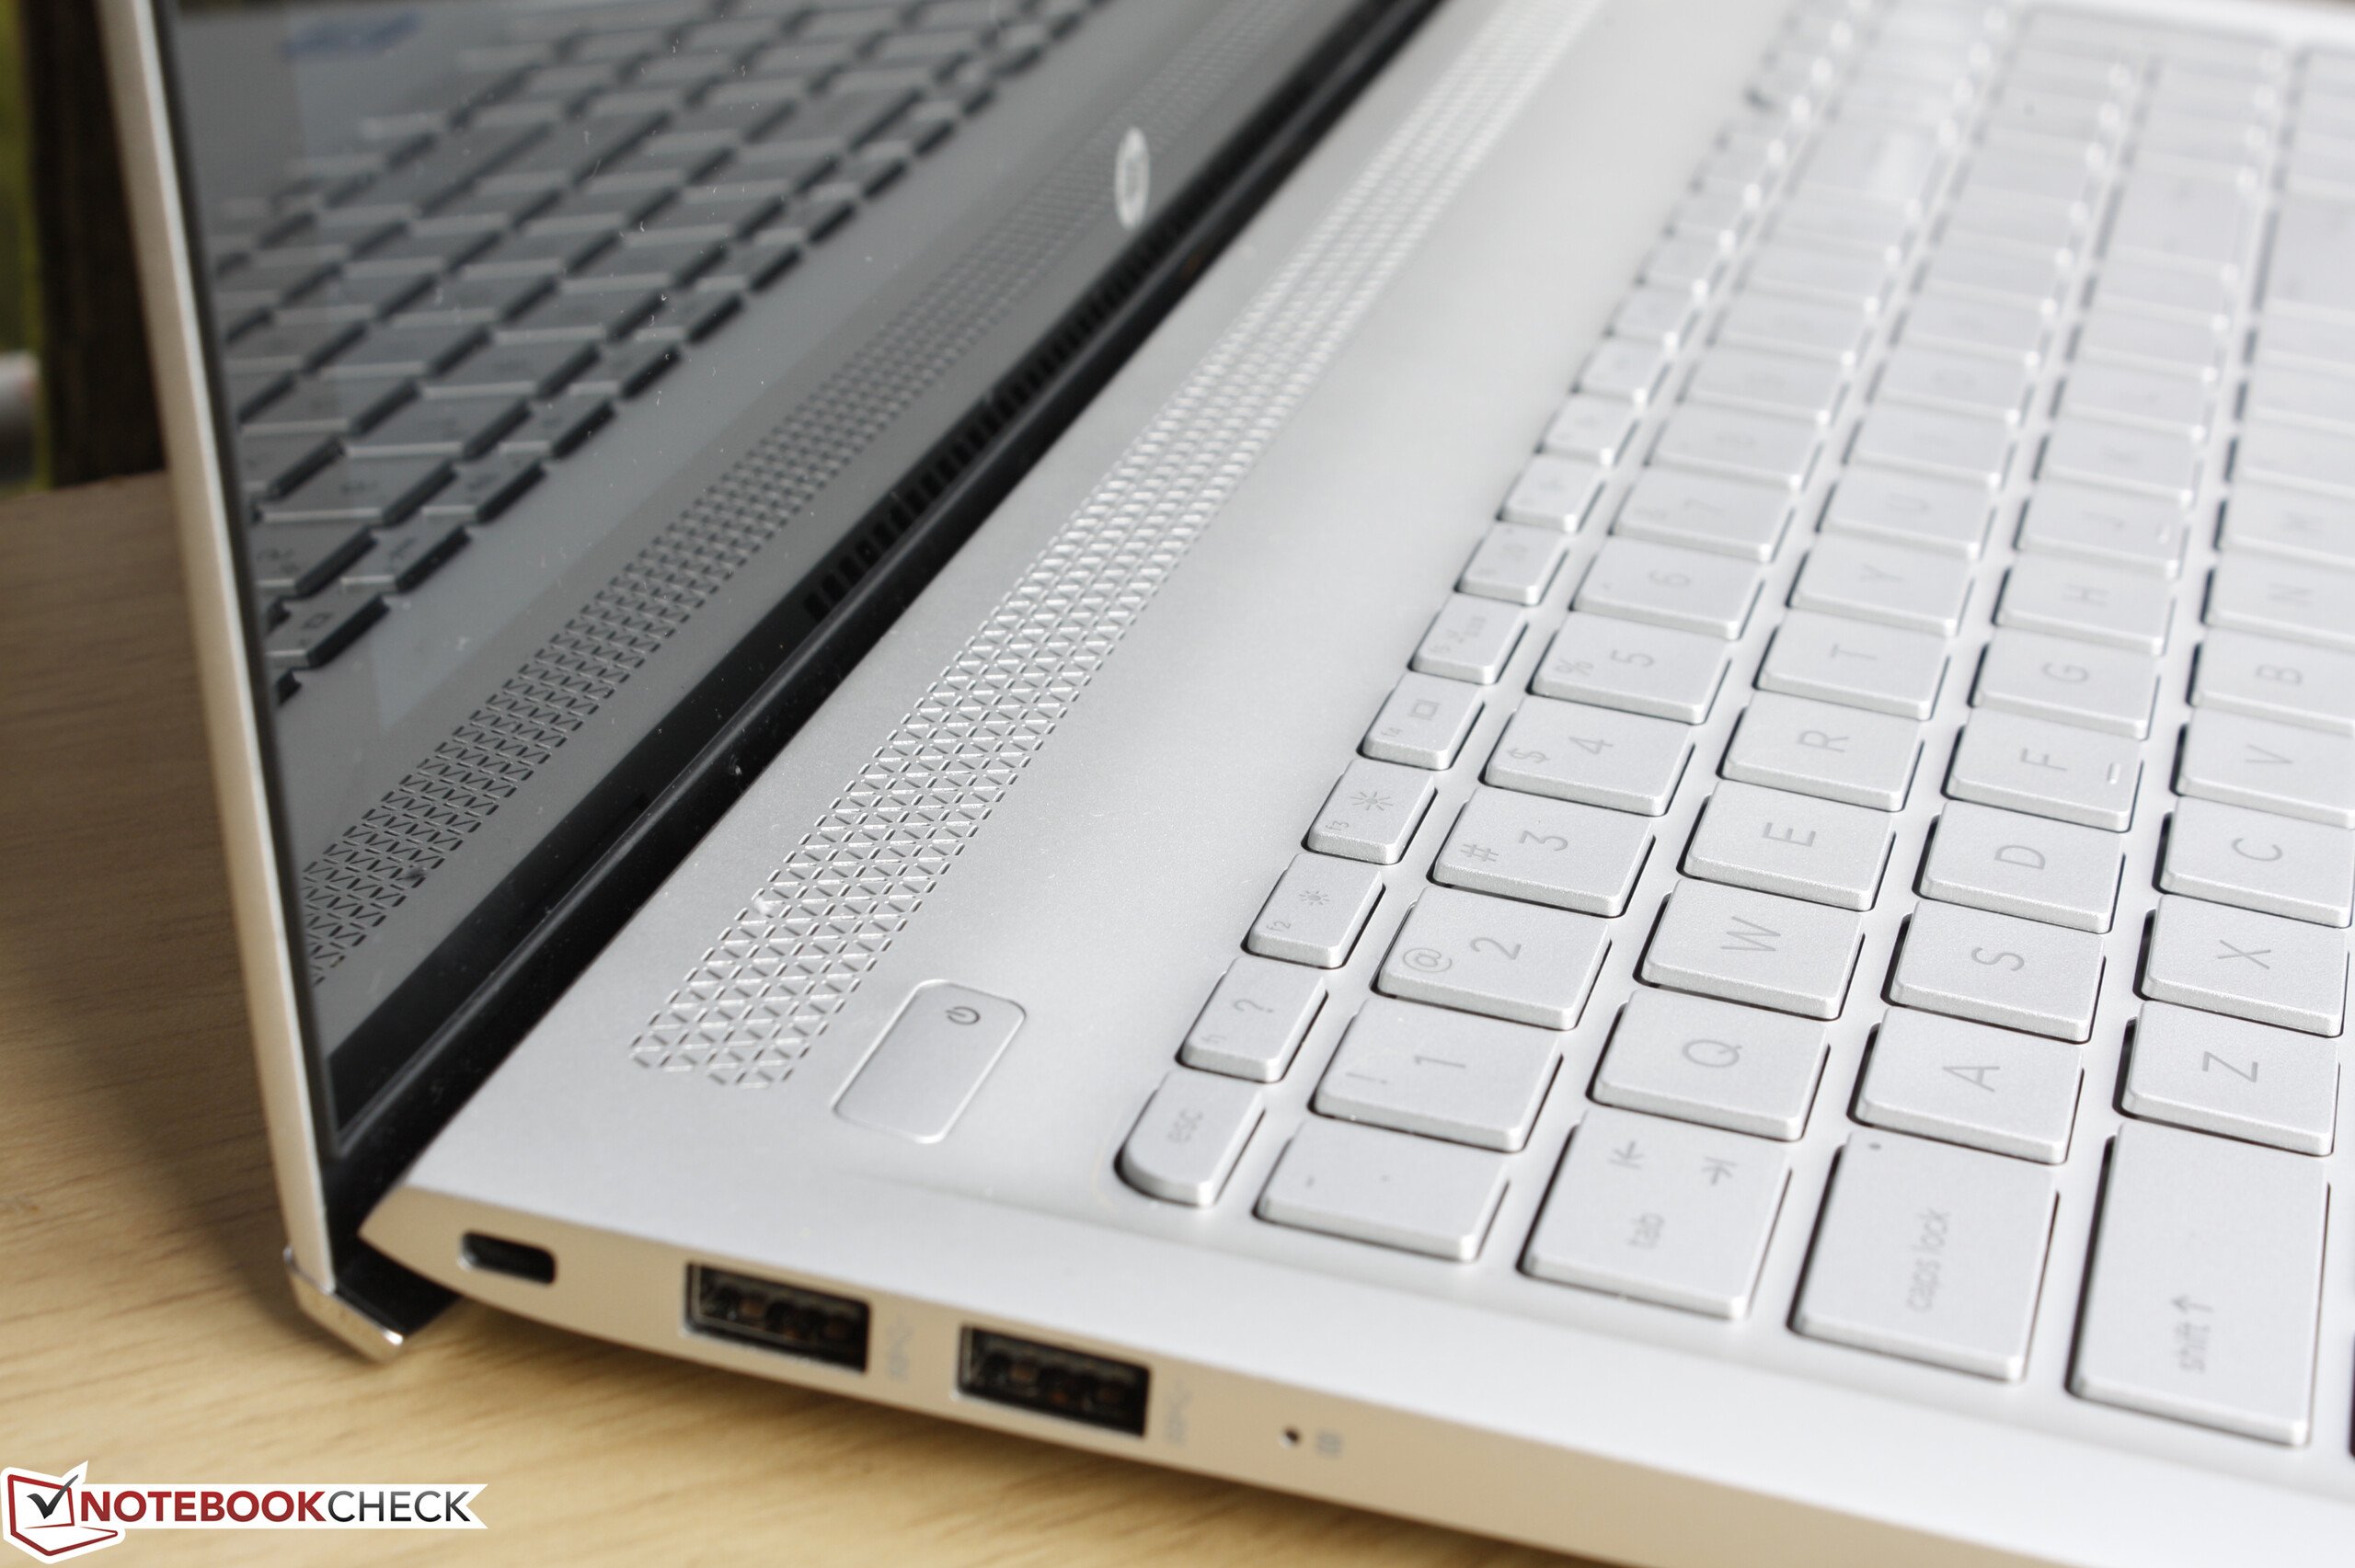
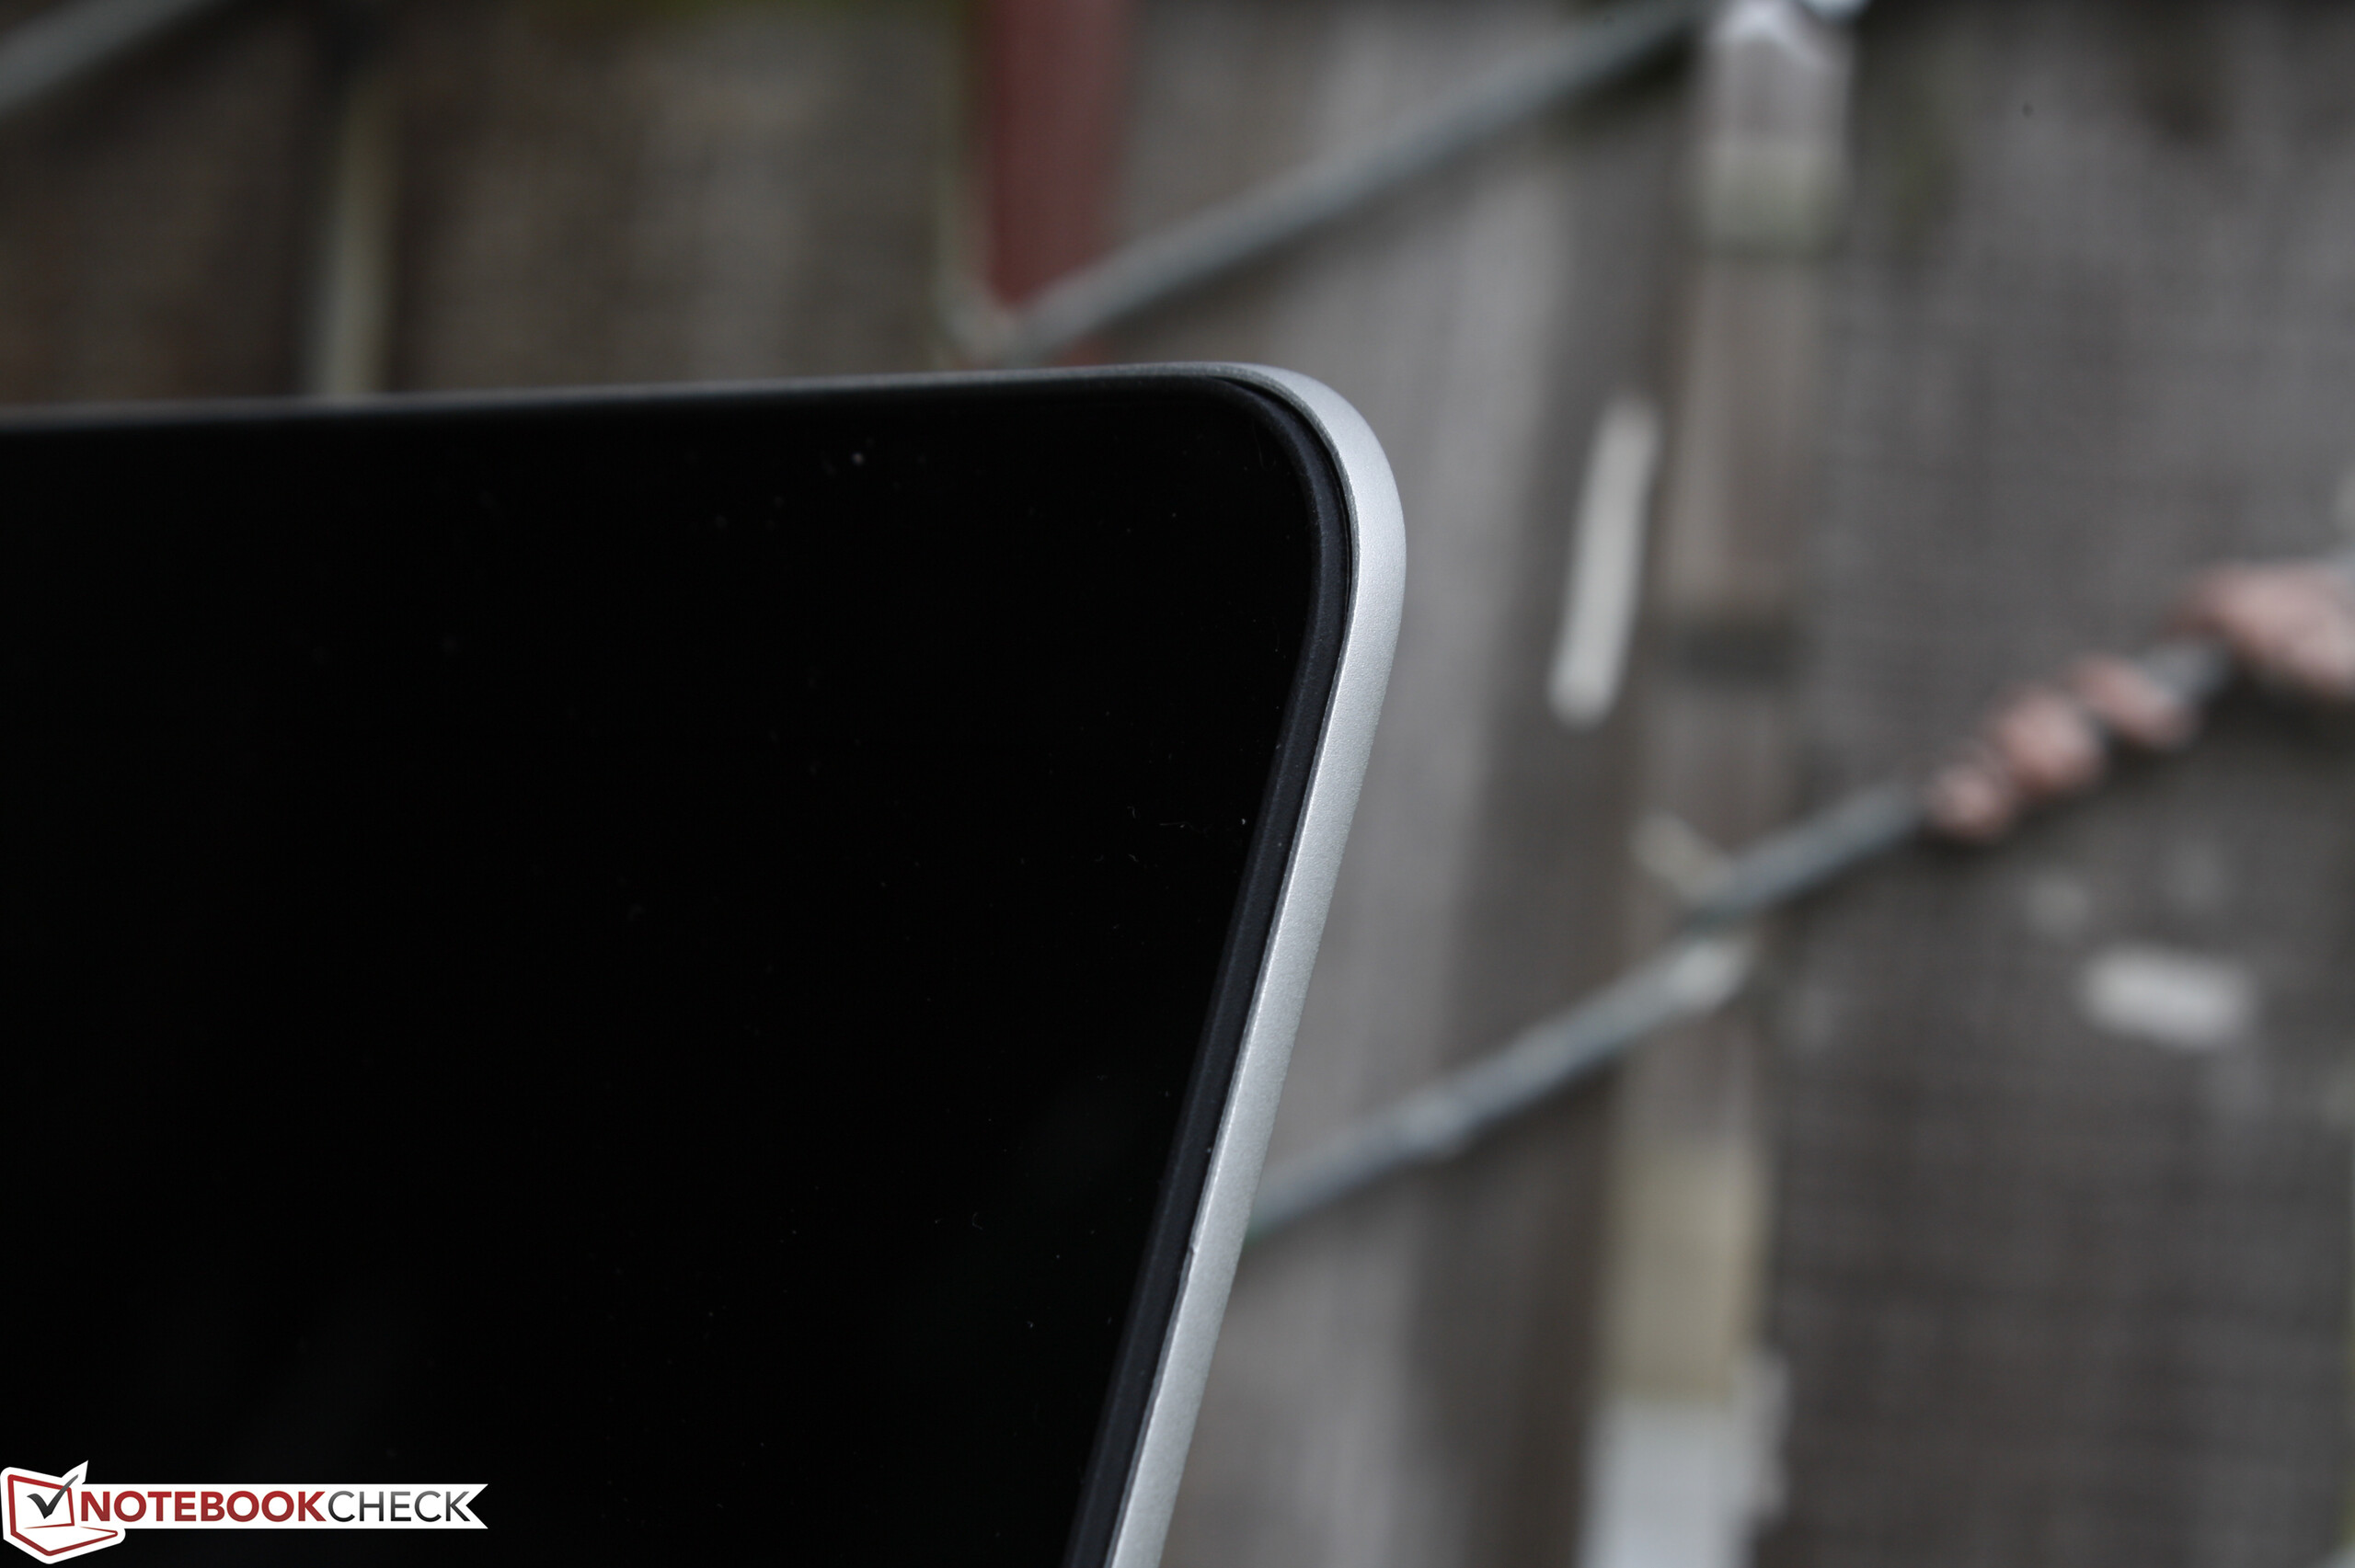
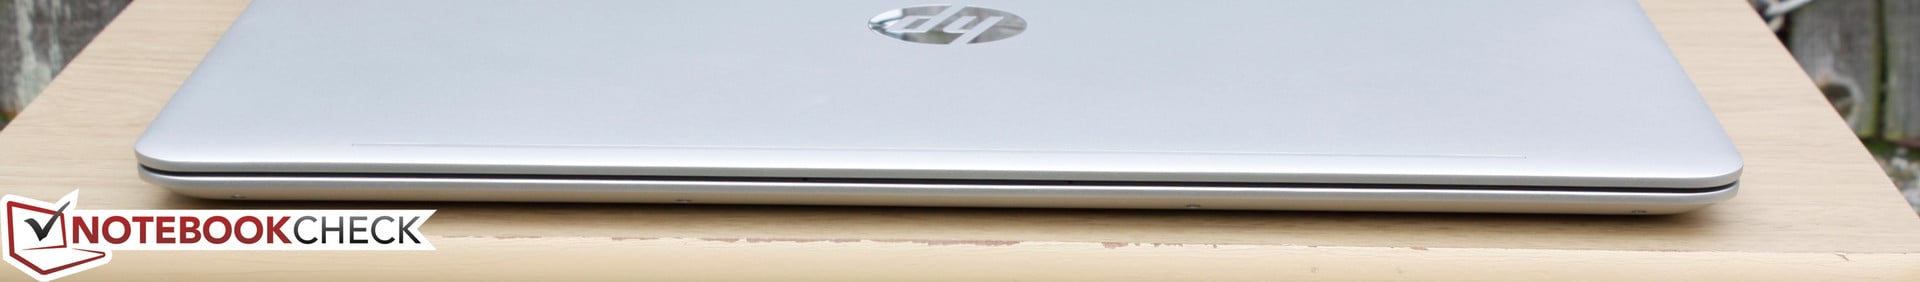
Nada em particular se destaca no Envy 15. Seu chassi e design fino o tornam mais atraente que os portáteis da Acer ou Lenovo da faixa de preços sub $900 USD e a duração da bateria também é bastante boa, mas o desempenho geral é um pouco decepcionante. A ventoinha do sistema está sempre ativa, as teclas do teclado e do clickpad são muito suaves, a cobertura sRGB é limitada, a funcionalidade da tela táctil é forçada para todo os SKUs, e a tampa poderia ter sido mais firme e menos balançante. Recomendamos evitar SKUs com o HD principal e em vez disso invista em um com um SSD NVMe para um desempenho de sistema muito mais veloz, dado que a manutenção para o usuário final é difícil.
Se portáteis concorrentes podem ser considerados, então os usuários encontrarão mais valor do vindouro XPS 15 9550. Configurar o Envy 15 básico com um SSD de 256 GB levará o preço perto dos 4 dígitos onde inclusive os SKUs de nível de entrada do XPS 15 9550, Spectre 15 x360, ou a série Asus Zenbook estão dentro do alcance.
HP Envy 15-as133cl
-
02/13/2017 v6(old)
Allen Ngo
Pricecompare
